Abstract
In order to determine the water vapor adsorption performance of a rotary desiccant-based air conditioning system, the behavior of water adsorption on cylindrical pores of different sizes was studied by using classical density functional theory (CDFT) based on perturbated chain statistical associating fluid theory (PC-SAFT). Firstly, the structural parameters of the desiccant material were characterized by scanning electron microscopy (SEM), X-ray Energy Dispersive Spectrum (EDS), and N2 adsorption/desorption isotherms, as well as adsorption equilibrium measurements of water vapor at temperature range 293–308 K. Secondly, the potential energy equation of water molecules in cylindrical pores was determined, and contribution of various terms of PC-SAFT for simulating fluid in cylindrical pores were established. Finally, the pore size distribution (PSD) of the desiccant materials is determined by the PC-SAFT kernel. Moreover, water vapor condensation was investigated with the PC-SAFT model in micropores. The results indicate that the rotary desiccant materials have a large number of micropores with a volume of 0.3669 cm3/g and the amount of water adsorption is about 0.285 g/g. The condensation pressure and the pore width corresponding to the saturated pressure P0 grow with an increase in the temperature, signifying that adjusting the PSD of the material has a significant effect on improving the dehumidification performance. The research concludes that the PSD range of the oxide cylindrical pore between 1.09 and 1.53 nm is particularly beneficial for dehumidification. This study provides valuable theoretical guidance for optimizing dehumidification materials.
1. Introduction
The CO2 emission of the building sector is about 28% of the total global CO2 emission, which has affected the global climate and environment [1]. In terms of building energy consumption, the air conditioning system has the highest energy consumption [2]. Therefore, it is necessary to improve the efficiency of the air conditioning system, such as by introducing solar energy [3], heat pump [4], or residual heat [5,6] driven rotary desiccant air conditioning. The rotating desiccant wheel can independently control temperature and humidity and is usually used for dehumidifying air, which can effectively improve the dehumidification capacity and processing capacity of air conditioning [7,8,9].
In the rotary desiccant air conditioning system, the dehumidification capacity depends on the adsorption of water vapor in the air by solid materials [9]. Therefore, the adsorption performance of desiccant materials for water vapor will directly affect the operation performance in systems [10]. At present, the main component of commercial materials for desiccant wheels is silica gel. The adsorption behavior of water vapor is subcritical adsorption, and multi-layer adsorption can be formed on the adsorbent [11]. Meanwhile, due to the large temperature and humidity changes in air conditioning conditions, it is necessary to determine the adsorption behavior of water vapor in different pore sizes, as well as determining the pore size suitable for air dehumidification regulation [12].
The adsorption process of fluid on porous materials is a heterogeneous system between interfaces, involving diffusion and condensation between the molecules. It is difficult to accurately predict the adsorption behavior of fluids. Especially, subcritical gases (such as N2, Ar, CO2, and H2O) may even produce fluid mixing, droplet and bubble breakage, and polymerization, thus forming a gas–liquid–solid interface, which has more complex thermodynamic properties than the main fluid [13,14]. Both GCMC [15] and MD [16] theories can be used to describe gas adsorption, but they are time-consuming and not conducive to high-throughput characterization of gas adsorption. The classical density functional theory (CDFT) based on statistical thermodynamics has been widely used in the prediction of adsorption behavior and characterization of PSD of porous medium due to its high accuracy and faster calculation speed [17,18]. However, in the characterization of gas adsorption, polar molecules such as N2, CO2, and H2O [19] have significant four polarization, which will affect the accuracy of the above model to describe fluid adsorption. Statistical association fluid theory (SAFT) should be used to further describe the association, chain formation, and other interactions for this kind of small molecular fluid, and a theoretical model for describing the gas-solid interface could be established combined with CDFT. The commonly used SAFT equations state describing fluid include SAFT for Potentials of Variable Range (SAFT-VR) [19], PC-SAFT [20], and SAFT based on Perturbed Chain Polar theory (PCP-SAFT) [21]. These theories are widely used to predict the thermophysical properties of water vapor and the adsorption behavior of water vapor on solid materials. Malheiro et al. used the SAFT-VR equation of state and weighted density approximation to describe the density functional theory of spherical non-associated monomers in confined media and predicted the adsorption behavior of water vapor on slit pore activated carbon [19]. Xi et al. Proposed an effective algorithm for the density functional theory of molecules in silica gel cylindrical pores, and quickly solved it by using fast Hankel transform [22]. Rolf et al. Provided the numerical solution of fast Fourier transform for the density functional theory of PC-SAFT in one-dimensional to three-dimensional coordinates [20]. The studies of these numerical algorithms have greatly accelerated the solution of CDFT, which is beneficial to expand the study of PC-SAFT to describe the adsorption of water vapor in porous media.
In this paper, according to the water vapor adsorption performance of commercial desiccant materials, the adsorption behavior of water molecules on different pore sizes was studied by using PC-SAFT. Firstly, the structural parameters of commercial desiccant materials were characterized, and the adsorption isotherms of water vapor on samples were tested. Secondly, the potential energy equation of water molecules in the cylindrical pore is determined, and the partial functional expansions of PC-SAFT for simulating fluid in the different cylindrical pores are established. Finally, the pore size distribution (PSD) of the silica gel is determined by obtaining the adsorption kernels.
2. Materials and Methods
2.1. Structural Characterization
The desiccant material was supplied by Jiangyin SAT Air Treatment Equipment Co., Ltd. (Wuxi, China). The sample was investigated for its microstructure and composition by SEM and EDS as shown in Figure 1.
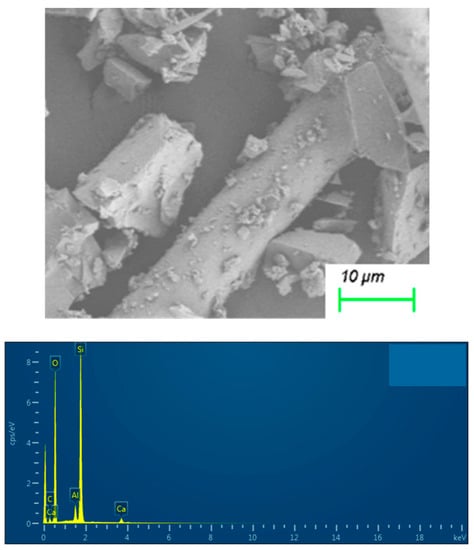
Figure 1.
The SEM and the EDS images of desiccant material.
The SEM image in Figure 1 reveals that the desiccant material has a triangular prism structure, and the size of the particle is greater than 10 um. The elemental analysis results of desiccant material from the EDS image were listed in Table 1.

Table 1.
Elemental analysis results of samples by the EDS.
As shown in Table 1, the content of Si atoms and O atoms in the sample is about 82%. It indicates that the main component of desiccant material is silica gel. Therefore, according to the traditional scheme of NLDFT characterization of silica gel materials [23,24,25], the desiccant material will be assumed as a cylindrical channel.
2.2. Adsorption Measurements
Gas adsorption measurements were employed on a surface characterization analyzer, 3Flex, supplied by Micromeritics Instrument Corporation, America. In addition to inert gases (nitrogen, argon, and krypton), there are physical adsorption, static chemical adsorption, and dynamic chemical adsorption. Vapor adsorption is another widely used and trusted option on the 3Flex surface characterization analyzer. Vapor adsorption analysis has the following advantages [26]: (1) fast experimental speed. (2) Easy sample handling: for humidity-sensitive materials, the sealed frit in the glove box can be used to simply transfer the sample from the bottle to the sample tube. The sample will not be exposed to air, which is difficult to achieve on the gravimetric adsorption analyzer.
For the characterization of porous structure, N2 adsorption/desorption experiments were carried out at 77 K. A stainless-steel chamber with a hard seal was installed on the equipment as a reservoir for water vapor adsorption experiments. The overall schematic diagram of the equipment is shown in Figure 2. Static volumetric measurements are used to measure the amount of adsorbed gas and vapor.
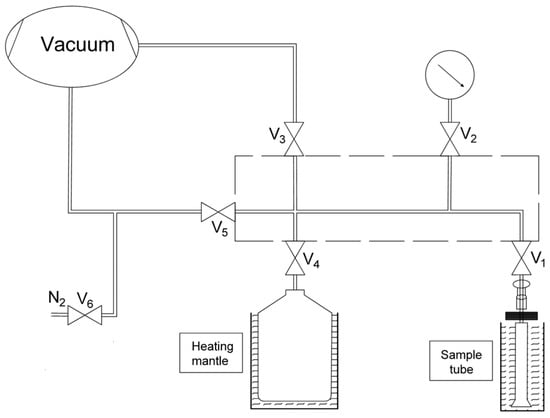
Figure 2.
Schematic diagram of N2 and water vapor adsorption equilibrium process measured on 3Flex.
As shown in Figure 2, the manifold within the dashed box is considered a reference reservoir and the sample tube is located at an oil bath. Accurately measure about 85.8 mg of the sample and place it in a 33 cm long flat bottom glass tube. Prior to this, the sample was activated overnight at 120 °C for adsorption. The activation and testing temperatures are controlled by a constant temperature oil bath.
The water adsorption [27] isotherm was obtained by dosing a specific amount of vapor to the sample tube after a definite interval to reach a desired relative pressure, and this process continued until the set maximum relative pressure was obtained. All specific parameters are set in the control software, and the experiment is carried out spontaneously according to the command of the software. The instrument is equipped with a pressure sensor with a reading accuracy of ±0.12% of FS and a display resolution of 0.00013 Pa. To prevent condensation during the experiment, the sample tube was kept at 10 °C above the adsorption temperature. The adsorption temperature is maintained by a constant temperature oil bath, and the vapor source temperature is maintained by a heating jacket.
Micromeritics 3Flex measurements of N2 adsorption at 77 K are shown in Figure 3.
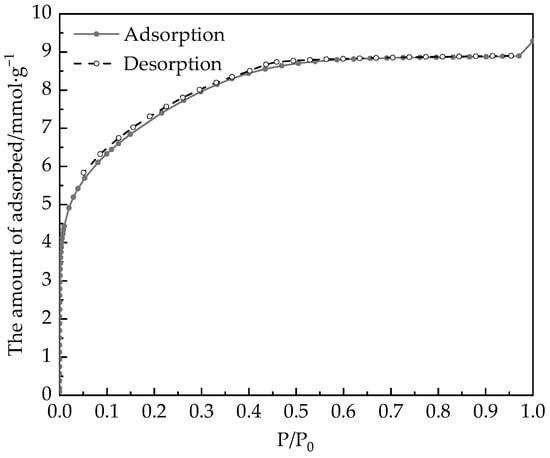
Figure 3.
Adsorption/desorption isotherms of nitrogen at 77 K on the desiccant material.
The used gases (nitrogen and helium) are of ultra-high-purity grade and they were from Air Liquide Xiamen Co. Ltd. (Xiamen, China). Figure 3 shows a little ‘hysteresis loop’ on the desorption isotherm, which indicates that the desiccant material has few mesopores and many micropores. The specific surface area determined by the BET method is 590.3 m2∙g−1, and the pore volume determined by NLDFT [23], is about 0.322 cm3∙g−1.
Considering the working conditions of air conditioning dehumidification, the temperature range selected in this paper is 293–303 K, and the test pressure range P/P0 = 0–0.9. About 0.0858 g samples were selected for measurement of adsorption isotherms of water vapor. The equilibrium data were also obtained volumetrically by Micromeritics 3Flex. Water vapor is generated by deionized water placed in the vapor source container as shown in Figure 2. Prior to each adsorption test, the sample was placed within a vacuum at 120 °C for 12 h to degas any moisture from it. The test temperature of prior is controlled by a constant temperature water bath, and adsorption isotherms of water at 293–308 K were shown in Figure 4.
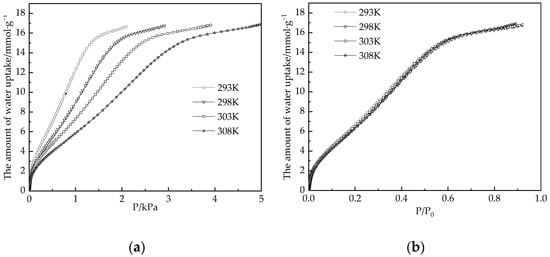
Figure 4.
Adsorption isotherms of water vapor on the desiccant material at 293–308 K. (a) Adsorption isotherms at different temperatures; (b) Adsorption isotherm of relative pressure P/P0.
In Figure 4a, all isotherms exhibit a type I adsorption isotherm, with adsorption capacity increasing as water vapor pressure increases. Meanwhile, with the increase in temperature, the pressure corresponding to adsorption saturation increases. Figure 4b shows that the adsorption isotherms plotted with relative pressure P/P0 are basically the same under different temperature conditions, and the adsorption of water vapor by samples was basically saturated, reaching 15.8 mmol·g−1, which was about 0.285 g water per gram of desiccant materials after P/P0 = 0.6.
2.3. Classical Density Functional Theory
The CDFT formulation is employed to describe the grand canonical ensemble for a given volume V, temperature T, and chemical potential μ, and the grand potential functional for one pure component is given by [28]
where is the function of the intrinsic Helmholtz free energy. The external potential describes interactions between water molecules at and solid surfaces.
The condition of adsorption equilibrium that gives the particle density of the inhomogeneous fluid under the effect of an external potential from adsorbent is found by solving the minimization of grand potential , which means that the functional derivative of with respect to the particle density of fluid equal to 0.
2.3.1. Solid–Fluid Interaction Parameters
As shown in Table 1, the main composition of the desiccant material is silica gel. It is assumed to be a cylindrical pore structure, and the external potential is only related to the radial direction r. The interaction between water and an oxide surface cylindrical pore wall is expressed by the potential as [29]
where R = is the radial coordinate of the adsorption centers, is the surface number density of the adsorption centers, and is the hypergeometric series. For water adsorption oxide surface silica-materials, we set the solid–fluid interaction parameters as, , , [30].
2.3.2. PC-SAFT
The function of the intrinsic Helmholtz free energy can be split into two exactly known parts, that is
where is the intrinsic Helmholtz free energy from ideal gas functional and is the part that excess free energy. The ideal gas function is
The excess free energy functional of PC-SAFT is based on the perturbation theory of first order in a non-mean field approach [31],
where are free energy functional of hard-sphere contribution, dispersion contribution, association contribution, and chain contribution.
The modified fundamental measure theory (MFMT) by Yu is used to approximate the hard-sphere fluid free energy functional [32], which is consistent with the Boublík-Mansoori-Carnahan-Starling-Leland (BMCSL) equation of state for the bulk hard-sphere fluid,
and the hard-sphere free energy density is determined by a series of six weighted densities denoted by , with the general form
where is a weighting function (α = 0, 1, 2, 3, v1 and v2), the symbol represents convolution, and and represent fast Fourier transform and inverse transform respectively. The detailed solution process can be found in our previous research [33].
The dispersion contribution is determined by employing the weighed density approximation (WDA) approach to the PC-SAFT bulk free energy. The WDA approach is similar to the method introduced by Sauer and Gross [21]. This method can accurately predict the inhomogeneous free energy density reduces to the free energy of PC-SAFT in the bulk limit. The weighted density as
where is the weighting functions for PC-SAFT
Here, is the Heaviside step function. is the temperature-dependent hard-sphere diameter of water molecules as used in PC-SAFT [20].
From the weighted density approximation field, the dispersion contribution of the inhomogeneous PC-SAFT can be determined as follow,
where represents the dispersion free energy density of PC-SAFT calculated by WDA.
Here, . The solution procedure of the compressibility , the universal integral and can be found in the work by Rolf [20]. The molecular parameters , , and are the same as the ones used by the PC-SAFT equation of state listed in Table 2.
Table 2.
PC-SAFT parameters for water studied in this work [34].
The association contribution is determined by employing the associating weighed density approximation (aWDA) approach [35,36] to the PC-SAFT bulk free energy. The aWDA makes use of the same weighted density shown in Equation (9), and is:
where is the fraction of non-bonded species at r relative to other water molecules [36,37], and has the following relationship with the average density determined by Equation (9) as,
where is the association strength, and is also related to the average density as,
is the cavity correlation function between two segments evaluated at contact distance and at a WDA-type averaged density corresponding to the interpenetration volume of two segments.
with the segment densities .
The chain contribution is determined by the molecular densities as shown by Sauer and Gross [21] instead of the segment density as defined in the original functional [38,39]. The expression of the chain contribution of PC-SAFT is
where is an averaged density over a segment surface at contact distance to account for segment-segment connectivity [38,39].
Here, represents the Dirac delta function.
2.3.3. Numerical Procedure
Once we have the expression of excess Helmholtz free energy functional, we can use the Euler Equation (2) to obtain the equilibrium density profiles by the Picard iteration method. The density profile that is radial distribution along with the cylindrical geometry can be solved as
where is the density of the bulk fluid, and it can be found in the data NIST [40]. μex is excess chemical potential. For the one-dimensional distribution of confined space, the matrix of corresponding position distribution in the space is constructed with
, and the matrix operation of MATLAB is used to discretize the solution by Picard iteration. Xi et al. present an efficient numerical algorithm for the solution of CDFT in cylindrical pores [22], we have referred to their work and will not repeat it here.
3. Results and Discussion
3.1. Adsorption in Cylindrical Pore
According to the CDFT based on PC-SAFT, the adsorption isotherms of water in silica gel cylindrical pores with pore widths of 0.9328 nm, 1.2335 nm, and 1.5342 nm at 308 K were predicted respectively. The results were described in Figure 5.
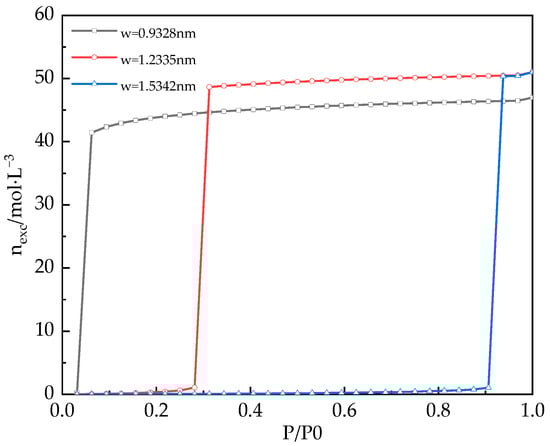
Figure 5.
Adsorption isotherms of water vapor in different pore widths predicted by CDFT.
As shown in Figure 5, with the increase of pressure, the adsorption capacity of water vapor in different pore widths is also increasing. The results indicate that the saturated adsorption capacity of water is reached before the saturated vapor pressure of water, and the corresponding pressure is the condensation pressure (Pcond). When the simulated pore width is smaller, its corresponding Pcond is smaller. This is because the smaller the pore width, the greater the interaction energy determined by Equation (3) so that water molecules will condense into liquid water at lower pressure. However, the phenomenon does not mean that the smaller the pore size, the greater the adsorption capacity. Compared with Figure 4, when the pore width is 0.9238 nm, the condensation pressure is Pcond/P0 = 0.0625, but the saturated adsorption capacity of water is only 47 mol/L, which is smaller than that of other pore widths. The water sorption on porous materials belongs to multilayer adsorption under subcritical conditions. Then, when the adsorption behavior occurs in narrow pores enough to cause 2–3 layers of water adsorption, the repulsive force of water molecules between the adsorption layers is greater, leading to an increase in water molecular spacing and a decrease in saturation adsorption capacity of water. However, the pore width is large enough for many more layers of water molecules, making the outer layers of the fluid behaves as a liquid phase, and the saturated adsorption capacity of water is higher than 50 mol/L.
In considering air condition dehumidification demand, the working temperature range of the air inlet of the rotary desiccant air conditioning system selected in this paper is 293–308 K, and the relative humidity is 60–90%. Figure 6 shows the variation of Pcond with temperature within the same range of pore size.
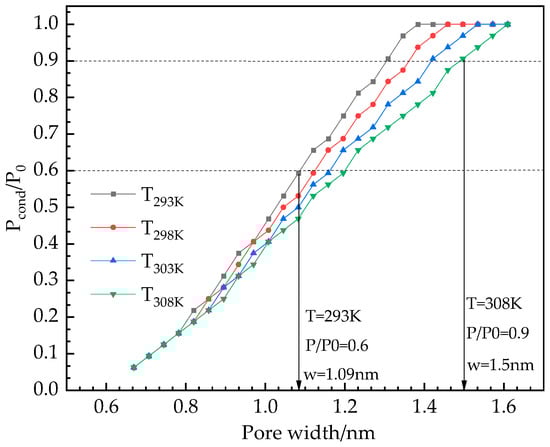
Figure 6.
Variation trend of water vapor condensation pressure Pcond with temperature in different pore widths.
It can be found from Figure 6 that with the increase of pore width at the same temperature, the condensation pressure Pcond gradually increases until it reaches the saturated vapor pressure P0 of water. As shown in Figure 5, the two dashed lines of 60% and 90% relative humidity of water vapor intersect with the condensation pressure Pcond determined at 293 K and 308 K, which can determine that the optimal pore distribution range for dehumidification is between 1.09 and 1.53 nm. As shown in Figure 7, we have plotted the largest pore width at which condensation pressure occurs as a function of temperature.
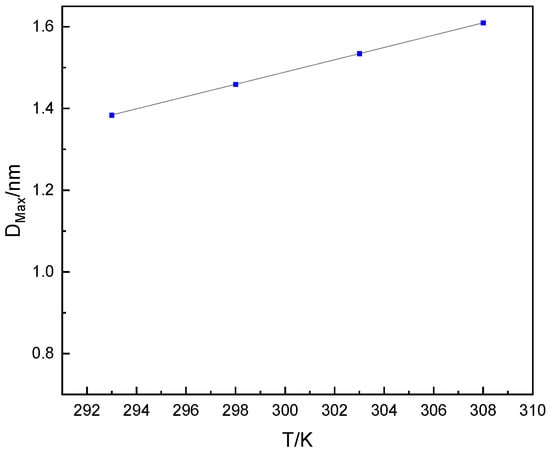
Figure 7.
The largest pore size for which condensation pressure of water occurs as a function of temperature in cylindrical pores.
3.2. Application of PC-SAFT for PSD Analysis of Desiccant Materials
The CDFT-predicted adsorption isotherms are calculated by integrating the fluid density profile [41],
where is the edge position of the solid wall when, and is the diameter of oxygen atoms, 0.276 nm.
According to the adsorption isotherm of water on desiccant materials at 308 K, the PC-SAFT kernel of adsorption isotherms with a pore width of 0.62–1.77 nm by Equation (21) is calculated as shown in Figure 8.
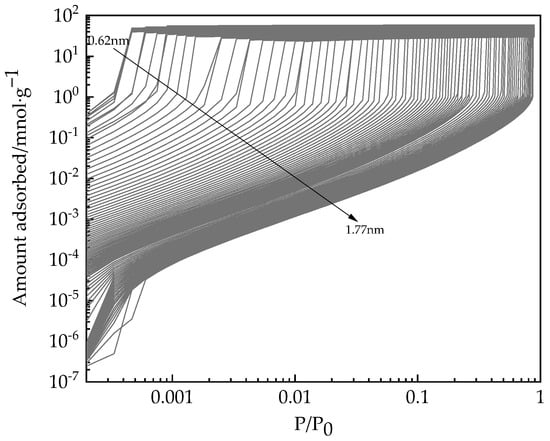
Figure 8.
Kernels of adsorption isotherms on pores at different pore widths determined by PC-SAFT.
The results of PSD analysis of desiccant materials can be solved through the integral adsorption isotherm equation (IAE),
where, and are the minimum pore width and the upper limit pore width, respectively. In this paper, is the pore size distribution function. The above equation can be regularized by Tikonov regularization, and the L-curve method is used to determine the numerical optimal solution [42]. The results of PSD are shown in Figure 9.
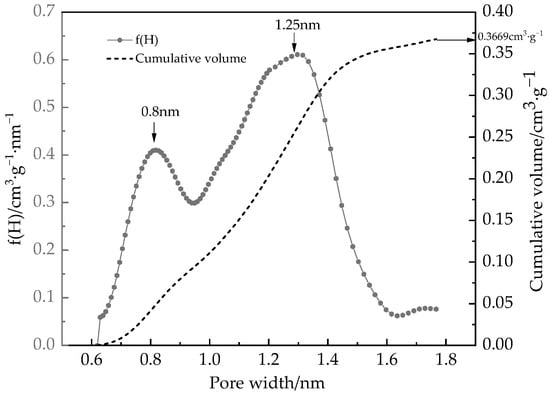
Figure 9.
PSD of desiccant materials for rotary desiccant determined by water vapor adsorption isotherm at 308 K.
It can be seen from Figure 9 that the rotary desiccant contains a large number of micropores with a volume of 0.3669 cm3/g, which is slightly larger than that of NLDFT by N2 adsorption isotherm. This is because the diameter of water molecules, listed in Table 2, is smaller than that of N2 (0.3575 nm [43]), the smaller molecules can characterize smaller pore sizes [44,45]. Among them, there are characteristic pore widths at 0.8 nm and 1.25 nm. The adsorption kernels determined in Figure 8 and the PSD determined in Figure 9 can predict the adsorption isotherm of water on the desiccant material according to Equation (22), and the results are shown in Figure 10.
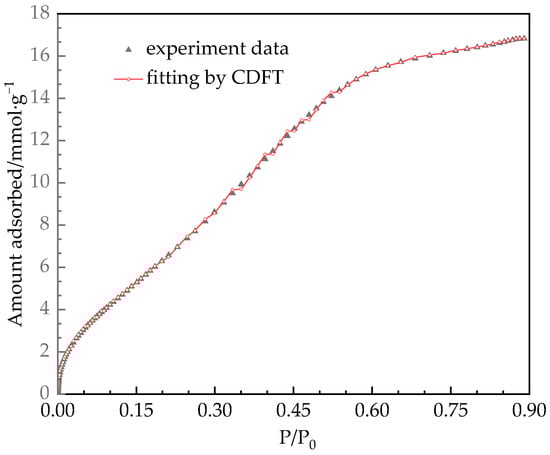
Figure 10.
Isotherm of water vapor adsorption on desiccant materials at 308 K from experiments and calculations.
As shown in Figure 10, it can be found that the prediction of water vapor adsorption behavior on silica gel by CDFT has high accuracy within the tested pressure range. Adsorption saturation occurs at approximately P/P0 = 0.6. In addition, the trend of cumulative volume changing with pore size in Figure 9 is similar to the trend of water vapor adsorption capacity increasing with pressure. This indicates that the pore width of porous materials can be adjusted based on the operating conditions of dehumidifiers, especially the relative humidity P/P0 in air conditioning, to increase the ability of water absorption under corresponding operating conditions and improve the dehumidification performance of the rotary desiccant wheel. We will focus on our next research.
4. Conclusions
In this paper, we have determined the cylindrical pore size of the desiccant material suitable for waste heat-driven rotary desiccant air conditioning and established a CDFT characterizing the cylindrical pore size based on PC-SAFT. The following conclusions can be listed,
- The main component of desiccant material in this paper is silica gel, and water vapor adsorption on desiccant materials is basically saturated after P/P0 = 0.6, reaching 15.8 mmol·g−1, which is about 0.285 g of water per gram of desiccant;
- The optimal PSD range of desiccant material for rotary desiccant air conditioning was determined by CDFT established from PC-SAFT. As the temperature increases, the pore width increases when the condensation pressure Pcond/P0 of different pore widths reaches the saturated steam pressure P0 of water. When the working temperature range of the intake air of the rotary desiccant air conditioning is 293–308 K and the relative humidity is 60–90%, the optimal PSD range of dehumidification is 1.09–1.53 nm;
- The CDFT established from PC-SAFT can characterize the PSD of the desiccant material by water adsorption isotherm. The rotary desiccant materials contain a large number of micropores with a volume of 0.3669 cm3/g. Among them, there are characteristic pore widths at 0.8 nm and 1.25 nm.
Author Contributions
Conceptualization, Z.Z. and M.Z.; methodology, Z.Z.; software, Z.Z.; validation, Z.Z. and M.Z.; formal analysis, Z.Z.; investigation, Z.Z.; resources, Z.Z.; data curation, Z.Z.; writing—original draft preparation, Z.Z. and M.Z.; writing—review and editing, Z.Z.; visualization, Z.Z.; supervision, Z.Z.; project administration, Z.Z.; funding acquisition, Z.Z. All authors have read and agreed to the published version of the manuscript.
Funding
This research was funded by the National Natural Science Foundation of China (22108092).
Data Availability Statement
Data are available upon request.
Conflicts of Interest
The authors declare no conflict of interest.
Nomenclature
| Symbols | Greek symbols | ||
| the compressibility of the hard-chain fluid | the fraction of non-bonded particles | ||
| diameter (nm) | the association strength (nm) | ||
| Helmholtz free energy (J) | energy well-depth for L-J fluid and solid (J) | ||
| the universal integral | the weighted packing fraction profile | ||
| Boltzmann constant (J·K−1) | chemical potential (J) | ||
| the association volume | density (nm−3) | ||
| segment number | size well-depth for L-J fluid and solid (J) (nm) | ||
| weighted densities (nm−3) | weighting function | ||
| N | the amount of adsorption (mmol·g−1) | the weighted quantities | |
| the position of and fluid molecules in space (nm) | grand potential (J) | ||
| radius (nm) | Subscripts and superscripts | ||
| external potential (J) | Number of states | ||
| pore width (nm) | assoc | association contribution | |
| the cavity correlation function | avg | Average | |
| Abbreviations | bulk | bulk density of fluid | |
| CDFT | Classical Density Functional Theory | chain | chain contribution |
| EDS | Energy Dispersive Spectrum | disp | dispersion contribution |
| GCMC | Grand Canonical Monte Carlo | ex | excess |
| MD | Molecular Dynamics | ff | fluid-fluid |
| MFMT | Modified Fundamental Measure Theory | HB | the hydrogen bonding |
| PSD | Pore Size Distribution | hs | hard-sphere contribution |
| PC-SAFT | Perturbated Chain Statistical Associating Fluid Theory | id | the intrinsic Helmholtz free energy from ideal gas functional |
| SEM | Scanning Electron Microscopy | int | the intrinsic Helmholtz free energy |
| WDA | Weighed Density Approximation | ss, sf | sloid-sloid, sloid-fluid |
References
- Arsiwala, A.; Elghaish, F.; Zoher, M. Digital twin with Machine learning for predictive monitoring of CO2 equivalent from existing buildings. Energy Build. 2023, 284, 112851. [Google Scholar] [CrossRef]
- Wrobel, J.; Walter, P.S.; Schmitz, G. Performance of a solar assisted air conditioning system at different locations. Sol. Energy 2013, 92, 69–83. [Google Scholar] [CrossRef]
- Liu, Y.; Chen, Y.; Wang, D.; Liu, J.; Li, L.; Luo, X.; Wang, Y.; Liu, J. Performance evaluation of a hybrid solar powered rotary desiccant wheel air conditioning system for low latitude isolated islands. Energy Build. 2020, 224, 110208. [Google Scholar] [CrossRef]
- Tian, S.; Su, X.; Geng, Y. Review on heat pump coupled desiccant wheel dehumidification and air conditioning systems in buildings. J. Build. Eng. 2022, 54, 104655. [Google Scholar] [CrossRef]
- Zheng, G.; Zheng, C.; Yang, G.; Chen, W. Development of a New Marine Rotary Desiccant Airconditioning System and its Energy Consumption Analysis. Energy Procedia 2012, 16, 1095–1101. [Google Scholar]
- Zhu, J.; Chen, W. Energy and exergy performance analysis of a marine rotary desiccant air-conditioning system based on orthogonal experiment. Energy 2014, 77, 953–962. [Google Scholar] [CrossRef]
- Zheng, C.Y.; Zheng, G.J.; Yu, W.S.; Chen, W. Study on the marine ejector refrigeration-rotary desiccant air-conditioning system. In Proceedings of the 2nd International Conference on Materials Science, Energy Technology and Environmental Engineering (MSETEE), Zhuhai, China, 28–30 April 2017. [Google Scholar]
- Abdelgaied, M.; Saber, M.A.; Bassuoni, M.M.; Khaira, A.M. Comparative analysis of a new desiccant dehumidifier design with a traditional rotary desiccant wheel for air conditioning purpose. Appl. Therm. Eng. 2023, 222, 119945. [Google Scholar] [CrossRef]
- Singh, R.P.; Das, R.K. Progressive Development and Challenges Faced by Solar Rotary Desiccant-Based Air-Conditioning Systems: A Review. Processes 2021, 9, 1785. [Google Scholar] [CrossRef]
- Lu, Z.; Wang, R.; Xia, Z. Experimental analysis of an adsorption air conditioning with micro-porous silica gel–water. Appl. Therm. Eng. 2013, 50, 1015–1020. [Google Scholar] [CrossRef]
- Alyousef, H.; Ben Yahia, M.B.; Aouaini, F. Statistical physics modeling of water vapor adsorption isotherm into kernels of dates: Experiments, microscopic interpretation and thermodynamic functions evaluation. Arab. J. Chem. 2020, 13, 4691–4702. [Google Scholar] [CrossRef]
- Tan, J.-X.; Chen, Z.-Y.; Chen, C.H.; Hsieh, M.-F.; Lin, A.Y.-C.; Chen, S.S.; Wu, K.C.-W. Efficient adsorption and photocatalytic degradation of water emerging contaminants through nanoarchitectonics of pore sizes and optical properties of zirconium-based MOFs. J. Hazard. Mater. 2023, 451, 131113. [Google Scholar] [CrossRef] [PubMed]
- Jagiello, J.; Kenvin, J.; Celzard, A.; Fierro, V. Enhanced resolution of ultra micropore size determination of biochars and activated carbons by dual gas analysis using N2 and CO2 with 2D-NLDFT adsorption models. Carbon 2019, 144, 206–215. [Google Scholar] [CrossRef]
- Ma, L.; Li, Z.; Zhao, H.; Zhang, T.; Yan, N.; Li, J. Understanding the Water Effect for Selective Catalytic Reduction of NOx with NH3 over Cu-SSZ-13 Catalysts. ACS EST Eng. 2022, 2, 1684–1696. [Google Scholar] [CrossRef]
- Zhou, Y.; Li, Q.; Wang, Q. Energy Storage Analysis of UIO-66 and Water Mixed Nanofluids: An Experimental and Theoretical Study. Energies 2019, 12, 2521. [Google Scholar] [CrossRef]
- Wang, Y.; Le, X.; Wang, X.; Liu, W.; Wang, Z. Molecular Dynamics Simulation of the Synergistic Effect of Alka-li/Surfactant/Polymer on the Formation and Stabilization of Water-Based Foam Systems. Polymers 2023, 15, 584. [Google Scholar] [CrossRef]
- Landers, J.; Gor, G.Y.; Neimark, A.V. Density functional theory methods for characterization of porous materials. Colloids Surf. A Physicochem. Eng. Asp. 2013, 437, 3–32. [Google Scholar] [CrossRef]
- Lucena, S.M.P.; Oliveira, J.C.A.; Gonçalves, D.; Silvino, P.; Dantas, S.; Neimark, A. Pore size analysis of carbons with heterogeneous kernels from reactive molecular dynamics model and quenched solid density functional theory. Carbon 2021, 183, 672–684. [Google Scholar] [CrossRef]
- Malheiro, C.; Mendiboure, B.; Plantier, F.; Blas, F.J.; Miqueu, C. Density functional theory for the description of spherical non-associating monomers in confined media using the SAFT-VR equation of state and weighted density approximations. J. Chem. Phys. 2014, 140, 134707. [Google Scholar] [CrossRef]
- Stierle, R.; Sauer, E.; Eller, J.; Theiss, M.; Rehner, P.; Ackermann, P.; Gross, J. Guide to efficient solution of PC-SAFT classical Density Functional Theory in various Co-ordinate Systems using fast Fourier and similar Transforms. Fluid Phase Equilibria 2020, 504, 112306. [Google Scholar] [CrossRef]
- Sauer, E.; Gross, J. Classical Density Functional Theory for Liquid–Fluid Interfaces and Confined Systems: A Functional for the Perturbed-Chain Polar Statistical Associating Fluid Theory Equation of State. Ind. Eng. Chem. Res. 2017, 56, 4119–4135. [Google Scholar] [CrossRef]
- Xi, S.; Liu, J.; Parambathu, A.V.; Zhang, Y.; Chapman, W.G. An Efficient Algorithm for Molecular Density Functional Theory in Cylindrical Ge-ometry: Application to Interfacial Statistical Associating Fluid Theory (iSAFT). Ind. Eng. Chem. Res. 2020, 59, 6716–6728. [Google Scholar] [CrossRef]
- Ravikovitch, P.I.; Domhnaill, S.C.O.; Neimark, A.V.; Schueth, F.; Unger, K.K. Capillary Hysteresis in Nanopores: Theoretical and Experimental Studies of Nitrogen Adsorption on MCM-41. Langmuir 1995, 11, 4765–4772. [Google Scholar] [CrossRef]
- Ravikovitch, P.I.; Neimark, A.V. Density Functional Theory Model of Adsorption on Amorphous and Microporous Silica Materials. Langmuir 2006, 22, 11171–11179. [Google Scholar] [CrossRef] [PubMed]
- Miyasaka, K.; Neimark, A.V.; Terasaki, O. Density Functional Theory of in Situ Synchrotron Powder X-ray Diffraction on Mesoporous Crystals: Argon Adsorption on MCM-41. J. Phys. Chem. C 2009, 113, 791–794. [Google Scholar] [CrossRef]
- Guo, P.; Micromeritics Instrumentation Corporation. Water Vapor Sorption in Metal-Organic Frameworks Characterized by Micromeritics 3Flex Gas Sorption Analyzer. Available online: https://www.micromeritics.com/Repository/Files/Application_Note_175_V6.pdf (accessed on 20 June 2023).
- Jahan, I.; Islam, M.A.; Rupam, T.H.; Palash, M.L.; Saha, B.B. Water adsorption characterization of bivalent metal doped HKUST-1. Therm. Sci. Eng. Prog. 2022, 35, 101453. [Google Scholar] [CrossRef]
- Roth, R. Fundamental measure theory for hard-sphere mixtures: A review. J. Physics Condens. Matter 2010, 22, 063102. [Google Scholar] [CrossRef]
- Daniel, D.W.; Gelb, L.D. Extension of the Steele 10-4-3 potential for adsorption calculations in cylindrical, spherical, and other pore geometries. J. Chem. Phys. 2011, 135, 84703. [Google Scholar]
- An, R.; Huang, L.; Long, Y.; Kalanyan, B.; Lu, X.; Gubbins, K.E. Liquid–Solid Nanofriction and Interfacial Wetting. Langmuir 2016, 32, 743–750. [Google Scholar] [CrossRef]
- Gross, J.; Sadowski, G. Perturbed-Chain SAFT: An Equation of State Based on a Perturbation Theory for Chain Molecules. Ind. Eng. Chem. Res. 2016, 40, 1244–1260. [Google Scholar] [CrossRef]
- Yu, Y.-X.; Wu, J. Structures of hard-sphere fluids from a modified fundamental-measure theory. J. Chem. Phys. 2002, 117, 10156–10164. [Google Scholar] [CrossRef]
- Zhu, Z.W.; Zheng, Q.R.; Wang, Z.; Tang, Z.; Chen, W. Hydrogen adsorption on graphene sheets and nonporous graphitized thermal carbon black at low surface coverage. Int. J. Hydrogen Energy 2017, 42, 18465–18472. [Google Scholar] [CrossRef]
- Gross, J.; Sadowski, G. Application of the Perturbed-Chain SAFT Equation of State to Associating Systems. Ind. Eng. Chem. Res. 2002, 41, 5510–5515. [Google Scholar] [CrossRef]
- Vergara, E.L.C.; Kontogeorgis, G.M.; Liang, X. A new study of associating inhomogeneous fluids with classical density functional theory. Mol. Phys. 2020, 118, e1725668. [Google Scholar] [CrossRef]
- Vergara, E.L.C.; Kontogeorgis, G.M.; Liang, X. On the study of the vapor-liquid interface of associating fluids with classical density functional theory. Fluid Phase Equilibria 2020, 522, 112744. [Google Scholar] [CrossRef]
- Hughes, J.; Krebs, E.J.; Roundy, D. A classical density-functional theory for describing water interfaces. J. Chem. Phys. 2013, 138, 024509. [Google Scholar] [CrossRef]
- Tripathi, S.; Chapman, W.G. Microstructure and Thermodynamics of Inhomogeneous Polymer Blends and Solutions. Phys. Rev. Lett. 2005, 94, 087801. [Google Scholar] [CrossRef] [PubMed]
- Tripathi, S.; Chapman, W.G. Microstructure of inhomogeneous polyatomic mixtures from a density functional formalism for atomic mixtures. J. Chem. Phys. 2005, 122, 094506. [Google Scholar] [CrossRef]
- Linstrom, P.J.; Mallard, W.G. (Eds.) NIST Chemistry WebBook; NIST Standard Reference Database Number 69; National Institute of Standards and Technology: Gaithersburg, MD, USA, 2022; p. 20899. [Google Scholar] [CrossRef]
- Ravikovitch, P.I.; Wei, D.; Chueh, W.T.; Haller, G.L.; Neimark, A.V. Evaluation of Pore Structure Parameters of MCM-41 Catalyst Supports and Catalysts by Means of Nitrogen and Argon Adsorption. Cheminform 1997, 28, 3671–3679. [Google Scholar] [CrossRef]
- Jagiello, J. Stable Numerical Solution of the Adsorption Integral Equation Using Splines. Langmuir 1994, 10, 2778–2785. [Google Scholar] [CrossRef]
- Ustinov, E.A.; Do, D.D. Application of density functional theory to analysis of energetic heterogeneity and pore size distribution of activated carbons. Langmuir 2004, 20, 3791–3797. [Google Scholar] [CrossRef]
- Jagiello, J.; Thommes, M. Comparison of DFT characterization methods based on N2, Ar, CO2, and H2 adsorption applied to carbons with various pore size distributions. Carbon 2004, 42, 1227–1232. [Google Scholar] [CrossRef]
- Jagiello, J.; Kenvin, J.; Ania, C.O.; Parra, J.B.; Celzard, A.; Fierro, V. Exploiting the adsorption of simple gases O2 and H2 with minimal quadrupole moments for the dual gas characterization of nanoporous carbons using 2D-NLDFT models. Carbon 2020, 160, 164–175. [Google Scholar] [CrossRef]
Disclaimer/Publisher’s Note: The statements, opinions and data contained in all publications are solely those of the individual author(s) and contributor(s) and not of MDPI and/or the editor(s). MDPI and/or the editor(s) disclaim responsibility for any injury to people or property resulting from any ideas, methods, instructions or products referred to in the content. |
© 2023 by the authors. Licensee MDPI, Basel, Switzerland. This article is an open access article distributed under the terms and conditions of the Creative Commons Attribution (CC BY) license (https://creativecommons.org/licenses/by/4.0/).