Article

Development and Process Optimization of a Ready-to-Eat Snack from Rice-Cowpea Composite by a Twin Extruder

by
Abiodun Afolabi Okunola
1,2,
Ewhoritsemogha Priscilla Dottie
1,
Olumuyiwa Isaac Moses
1,2,*,
Timothy Adesoye Adekanye
1,2,
Clinton E. Okonkwo
3,
Mohammad Kaveh
4,
Mariusz Szymanek
5,* and
Charity O. Aremu
6
1
Department of Agricultural and Biosystems Engineering, Landmark University, P.M.B. 1001, Omu-Aran 251103, Nigeria
2
SDG 2 Food Security Research Group, Landmark University, P.M.B. 1001, Omu-Aran 251103, Nigeria
3
Department of Food Science, College of Food and Agriculture, United Arab Emirates University, Al Ain 15551, United Arab Emirates
4
Department of Petroleum Engineering, College of Engineering, Knowledge University, Erbil 44001, Iraq
5
Department of Agricultural, Forest and Transport Machinery, University of Life Sciences in Lublin, Głęboka 28, 20-612 Lublin, Poland
6
Department of Agricultural Sciences, Landmark University, P.M.B. 1001, Omu-Aran 251103, Nigeria
*
Authors to whom correspondence should be addressed.
Processes 2023, 11(7), 2159; https://doi.org/10.3390/pr11072159
Submission received: 5 June 2023 / Revised: 14 July 2023 / Accepted: 17 July 2023 / Published: 19 July 2023

Abstract

:
A central composite rotatable design with four independent variables viz. blend ratio (broken rice flour and cowpea flour): 90:10–70:30, moisture content (10–18% wet basis), barrel temperature (110–150 °C), and screw speed (280–360 rpm) were varied in the development of ready-to-eat snacks using a twin extruder for a broken rice–cowpea product. The effects of the independent variables on specific mechanical energy, water absorption index, water solubility index, total color, hardness, bulk density, expansion ratio, and overall acceptability of the extruded snack were investigated using regression analysis. The results showed that the physical qualities of the ready-to-eat snacks were significantly affected by the extrusion parameters (i.e., blend ratio, barrel temperature, moisture content, and screw speed). From the findings, it was observed that screw speed and moisture contents affected hardness, while water absorption index was affected by all the extrusion parameters. However, the water solubility index and overall acceptance were majorly affected by the moisture content; extrudate produced with barrel ratio of 85:15, 12% moisture content, barrel temperature of 140 °C, and screw speed of 300 rpm was the most acceptable, at 6.73 on a 9 point hedonic scales. The blend ratio and barrel temperature influenced the expansion. Furthermore, the combination of cowpea and broken rice to produce nutritious ready-to-eat snacks has high acceptability and is a promising panacea for food security.

1. Introduction

Extrusion technology involves the application of high temperature and shear pressures in a short time duration to develop ready-to-eat snacks (RTES) and there is increasing consumer demand for them due to the time-saving needs of the modern lifestyle [1]. Snack consumption is an important aspect of most eating habits of the populace, particularly the youth, as it plays a major role in their food intake [2]. Most snacks are produced from starchy ingredients including corn, oats, wheat, rice, potatoes, and other tuber crops, which have a high glycemic index (GI). Consumers, on the other hand, can enjoy snack foods with good taste, flavor, and pleasing textural mouth feel, but obtain more nutrients through the inclusion of legumes, fruits, and vegetables.
Extrusion cooking increases the digestibility of proteins and starch [3] as well as reducing the levels of some anti-nutrients in legumes, as they are heat liable [4,5,6,7] and has been employed by researchers to produce an array of RTES using different composites in both single- and twin-screw extruders [1,8,9]. Extrusion is very versatile, prolific, energy efficient, and environmentally friendly with no effluent and it is excellent in the development of RTES.
Rice is a cereal grain that is a staple food for a majority of the world’s populace, especially in Asia and Africa [10]. Rice is one of the cheapest sources of food energy with a GI of 65 [11]. However, broken rice is rampant in rice milled in developing countries, ranging between 22 and 33% of the milled rice [12,13]; it contains the same nutrient profile as whole rice but is lower priced. [14,15,16]. Cowpea is a starch–protein legume with 25% protein content and is suitable to fortify RTES to improve dietary and nutritional values [9,17] Hence, broken rice was incorporated into cowpea so as to have desirable functional and nutritional qualities in this optimized RTES product. Jakkanwar et al. [9], using a single screw extruder, deduced that an increase in the feed moisture content (FMC) and a decrease in barrel temperature (BT) resulted in an increase of the bulk density (BD) and hardness (HD), but expansion ratio (ER), water absorption index (WAI), water solubility index (WSI), and overall acceptance (OA) were reduced.
Singh et al. [18] assessed the influence of moisture content (MC), screw speed (SS), and BT on a potato-based snack using a twin-screw extruder; he established that FMC influenced all product responses, although SS and BT had no effect on the specific mechanical energy (SME), WSI, and hardness (HD) of the product. An increase in FMC increases BD, WAI, and hardness, while it decreases SME and WSI. The BD, WAI, and hardness of the snacks reduce as the SS increases. However, the SME, BD, WAI, and HD decrease as the BT rises, but the WSI is on the increase. In the use of a twin-screw extruder, Danbaba et al. [8] observed that the mineral composition of the rice–cowpea extrudate affected the process variables of blend ratio (BR), barrel temperature (BT), and moisture content (MC). The physicochemical properties for the characterization of rice–cowpea composites using broken rice, which is of lower economic value, are required. Hence, the objective of this investigation is to characterize and optimize the extrusion parameters using a twin extruder in producing an acceptable and nutritious RTES from broken rice and cowpea.

2. Materials and Methods

2.1. Raw Materials Preparation

Broken rice (FARO 66) was collected from a double-pass rice mill and cowpea (IT97K-568-18) was obtained from the International Institute of Tropical Agriculture (IITA) in Ibadan, Nigeria. Prior to use, the materials were kept in desiccators at room temperature. Broken rice and the cowpea were winnowed to remove contaminants; the cowpea was soaked in water at 70 °C for 5 min to loosen the outer coat as suggested by Elina et al. [19] and de-hulled manually. The de-hulled cowpea was dried in a cabinet dryer (DC125 Genlab, Cheshire, UK) for 12 h at 60 °C, as suggested by Olaniran et al. [20]. A hammer mill (FT2-A, Armfield, UK) was used to grind broken rice and cowpea into flour, which was then sieved through a 1 mm sieve to ensure uniformity in size. The flours were wrapped in low-density polythene pouches and placed in separate desiccators at ambient temperature. Proximate analyses of the samples were determined before and after extrusion cooking using the AOAC (2005) method [21].

2.2. Extrusion Cooking

The experiment was performed with the use of an inter-meshing co-rotating twin-extruder (MPF-24,190U2F250CACAA215320-GADD, Baker Perkins, MI, USA) in the Department of Food Technology, University of Ibadan, Nigeria. The length-to-diameter (L/D) ratio was 25:1 and a die opening of 2 mm with four heating zones, and the first, second, and third were kept constant at Z1 = 75 °C, Z2 = 90 °C, and Z3 = 90 °C, respectively, while the fourth Z4 was varied within 110 to 150 °C, according to the experimental design in Table 1. Before extrusion, the formulations were thoroughly mixed using the laboratory mixer (ES-315, EUROSONIC, GmbH, Germany) to be homogenized for 3 min. To each BR, salt, sugar, vegetable oil, and spice (Piper guineense) mix were added at 0.5, 4, 2, and 2.15% weight, respectively according to the experimental design (Table 1). The ingredients remained constant for all the experimental design runs derived by CCRD.

2.3. Determination of Extrusion System Response

Specific Mechanical Energy (SME)

The specific mechanical energy (SME) is utilized for gel formation of starch-based foods, and it controls the rate of starch conversion according to Hussain et al. [22]. SME was determined using Equation (1) [23].
S M E   W h k g = A c t u a l   s r c e w   s p e e d   ( r p m ) R a t e d   s c r e w   s p e e d   ( r p m )   ×   %   m o t o r   t o r q u e 100   ×   m o t o r   p o w e r   r a t i n g m a s s   f l o w   r a t e   ( k g h )   ×   1000

2.4. Properties of Extruded Products

2.4.1. Bulk Density (BD)

The bulk density (BD) is the average ratio of mass to volume of ten samples of extrudates; BD was determined using a digital vernier caliper to measure axial dimensions (diameter, D; length, L) of 10 randomly selected products from each of the extrudate samples, according to Jakkanwar et al. [9]. An analytical balance (PA-214, OHAUS, NJ, USA) was used to determine the weight (m, g). The BD was calculated by the formula in Equation (2), given by Jakkanwar et al. [9].
B D = 4 × m π × D 2 × L ( g / c m 3 )

2.4.2. Expansion Ratio (ER)

The expansion ratio (ER) is the degree of puffiness of an extrudate when exiting the die, determined by Equation (3), as described by Rathod and Annapure [24].
E R = E x t r u d a t e   d i a m e t e r   ( m m ) d i e   d i a m e t e r   ( m m )

2.4.3. Water Absorption Index and Water Solubility Index (WAI and WSI)

Extrudates were ground into a powder with a hammer mill (FT2-A, Armfield, UK) and passed through a sieve of mesh 60, and samples of 2.5 g suspended in 25 mL were centrifuged using the procedure described by Rathod and Annapure [24]. The WAI is the weight of gel obtained after removal of the supernatant per unit weight of original dry solids while WSI is the weight of dry solids in the supernatant expressed in percentage. The equations for WAI and WSI are represented in Equations (4) and (5).
W A I   g g = w e i g h t   o f   s e d i m e n t w e i g h t   o f   d r y   s o l i d s
W S I   ( % ) = w e i g h t   o f   d i s s o l v e d   s o l i d   i n   s u p e r n a t e n t w e i g h t   o f   d r y   s o l i d   ×   100
where sediment represents the residual left over from decanting the liquid portion and supernatant stands for the liquid portion removed from the residue after centrifugation.

2.4.4. Hardness

Hardness (HD) is a subjective perception of a material’s textural structure that determines the product’s cell structure and puffiness. The hardness was determined from the 30 mm length of extruded product using a universal testo metric machine (Texture Analyzer, M500-100AT, Testrometric, UK) at the National Centre for Agricultural Mechanization (NCAM), Ilorin, Nigeria. A 3-point flexural test was performed with a 100 kg load cell. Three randomly selected samples of each of the extrudates were used for the hardness test and the mean values of the readings were calculated according to Jakkanwar et al. [9]. The compression probe was used to determine the amount of compression force necessary to break the samples, according to Hussain and Singh’s method [15]. The testing conditions were 90 mm/min test speed; the preload was set at off and the span at 50 mm.

2.4.5. Color

The total color change ∆E are values of L* (luminosity), a* (red-green chromaticity), and b (yellow/blue chromaticity) and was determined by a Chroma Meter (CR-400 & CR-410-Konica Minolta, Europe). The total color change (∆E) of the RTES was calculated using Equation (6) [25].
E = L * 1 L * 0 2 + ( b * 1 b * 0 ) 2 + ( a * 1 a * 0 ) 2 1 2

2.4.6. Sensory Evaluation

Overall acceptability (OA) is important in the food processing sector because it enables the producer to ascertain the acceptability of the product and enhance improvements for food product development. A trained panel of fifty, which comprised staff and students of Landmark University, were asked to evaluate the RTES using the 9-point hedonic scale (from 1 = ‘extremely dislike’ to 9 = ’extremely like’) for appearance, color, crunchiness, crispiness, taste, mouth-feel, and OA [18,26]. Thirty coded samples were served to the panelists in batches of six samples daily for five (5) days. The panelists were provided with distilled water that was used to rinse the mouth to neutralize the taste buds and had a 5 min break between sample sets for each day.

2.4.7. Numerical Optimization

The optimal levels of the four independent variables were determined via numerical optimization. This was performed using the Design Expert 11.1.0.1 software [27], ranging with minimum and maximum values. All response parameters were assigned a main goal. ER and OA were set to the maximum; WAI and WSI were set in range; SME, BD, and hardness were set to the minimum, respectively, [28,29] as shown in Table 1.

2.5. Statistical Analysis and Experimental Design

The proximate and mineral analysis data were analyzed statistically with the use of Statistical Package for Social Sciences (SPSS) software version 21 [30]. The experiments were replicated thrice, and the data were analyzed using a design factorial in a Complete Randomized Design (CRD). Duncan’s Multiple Range Test (DMRT) was performed to determine the statistical difference in a one-way ANOVA at a 5% level of significance.
The independent variables considered using CCRD of RSM were BR for rice and cowpea (90:10 and 70:30)—A; MC (10–18%)—B; BT (110–150 °C)–C; and SS (280–360 rpm) –D. With the use of CCRD of RSM in Design Expert 11.1.0.1 software [27], 30 experimental runs were generated for extrusion cooking. All experimental runs were analyzed for their responses to SME, WAI, WSI, TC, BD, ER, OA, and hardness. The multiple regression models were used to analyze the results from the experimental data, which illustrated the effects of variables in the derived models. The experimental data were fitted to the chosen models, and the regression coefficients were obtained.
The regression analysis was used for the experimental conditions (independent variables) and represented by BR, MC, BT, and SS, respectively. They were compared to the responses/dependent variables, SME, BD, WAI, WSI, total color, hardness, ER, and OA of the extrudates for the assessment and interactive effects. The lack of fit test of the models was used to judge the adequacy of model fit. Three-dimensional (3D) plots were generated on RSM to assess the changes in the responses with respect to the processing factor.

3. Results and Discussion

3.1. Effect of Blend Ratio, Moisture Content, Barrel Temperature, and Screw Speed on the Extrudates

The process parameters of the input data of the response surface analysis are presented in Table 2.

3.1.1. Specific Mechanical Energy (SME)

Starch conversion occurs more quickly with a high SME, leading to better expanded product, as observed by Singh et al. [18]. From Table 2, the SME values for the extrusion conditions of the experimental runs ranged between 47.10 and 102.27 Wh/kg. The low SME range observed is desirable and was because of the 2% vegetable oil added in the extrusion process, which is in agreement with the observations made by Yu [31] and Dogan [32]. Equation (7) shows the SME expressed as a linear equation.
S M E = 77.44 2.58 B R 13.70 M C + 2.07 B T + 11.16 S S
Equation (7) depicts that regression terms of BR and MC had a negative effect on SME while BT and SS had positive effect. The ANOVA (Table 3) showed that MC and SS were the significant linear regression terms for the model (p < 0.05). Response surface plots for SME in Figure 1a show a decrease in SME with an increase in the cowpea proportion of the BR and increase in MC, while SME increased with an increase in BT and SS, as shown in Figure 1b,c. The SME decreases when there is an increase in the cowpea proportion of the BR due to the effect of easier flow for the melt at a high mass flow during extrusion. This was in agreement with the observation of Zhang et al. [33] using soy protein isolate and Rivera. The decrease in SME because of an increase in MC could be attributed to the fact that high MC acts as a softening agent and lubricant according to Yu [31], Matysiak et al. [34], and Reshi et al. [23].
The positive linear effect of BT that resulted in an increase in SME was not affirmative to the finding of Reshi et al. [23]; however, the reason for this could be because of differences in the crop used, method of sample preparation, extrusion conditions, and configuration of the extruder. The positive linear SS coefficients indicated that SME increases as SS increase due to the increasing shearing force within the screws. According to Meng et al. [35], hydrogen bonds within starch granules are ruptured by significant mechanical stress, hence allowing gelatinization to occur.

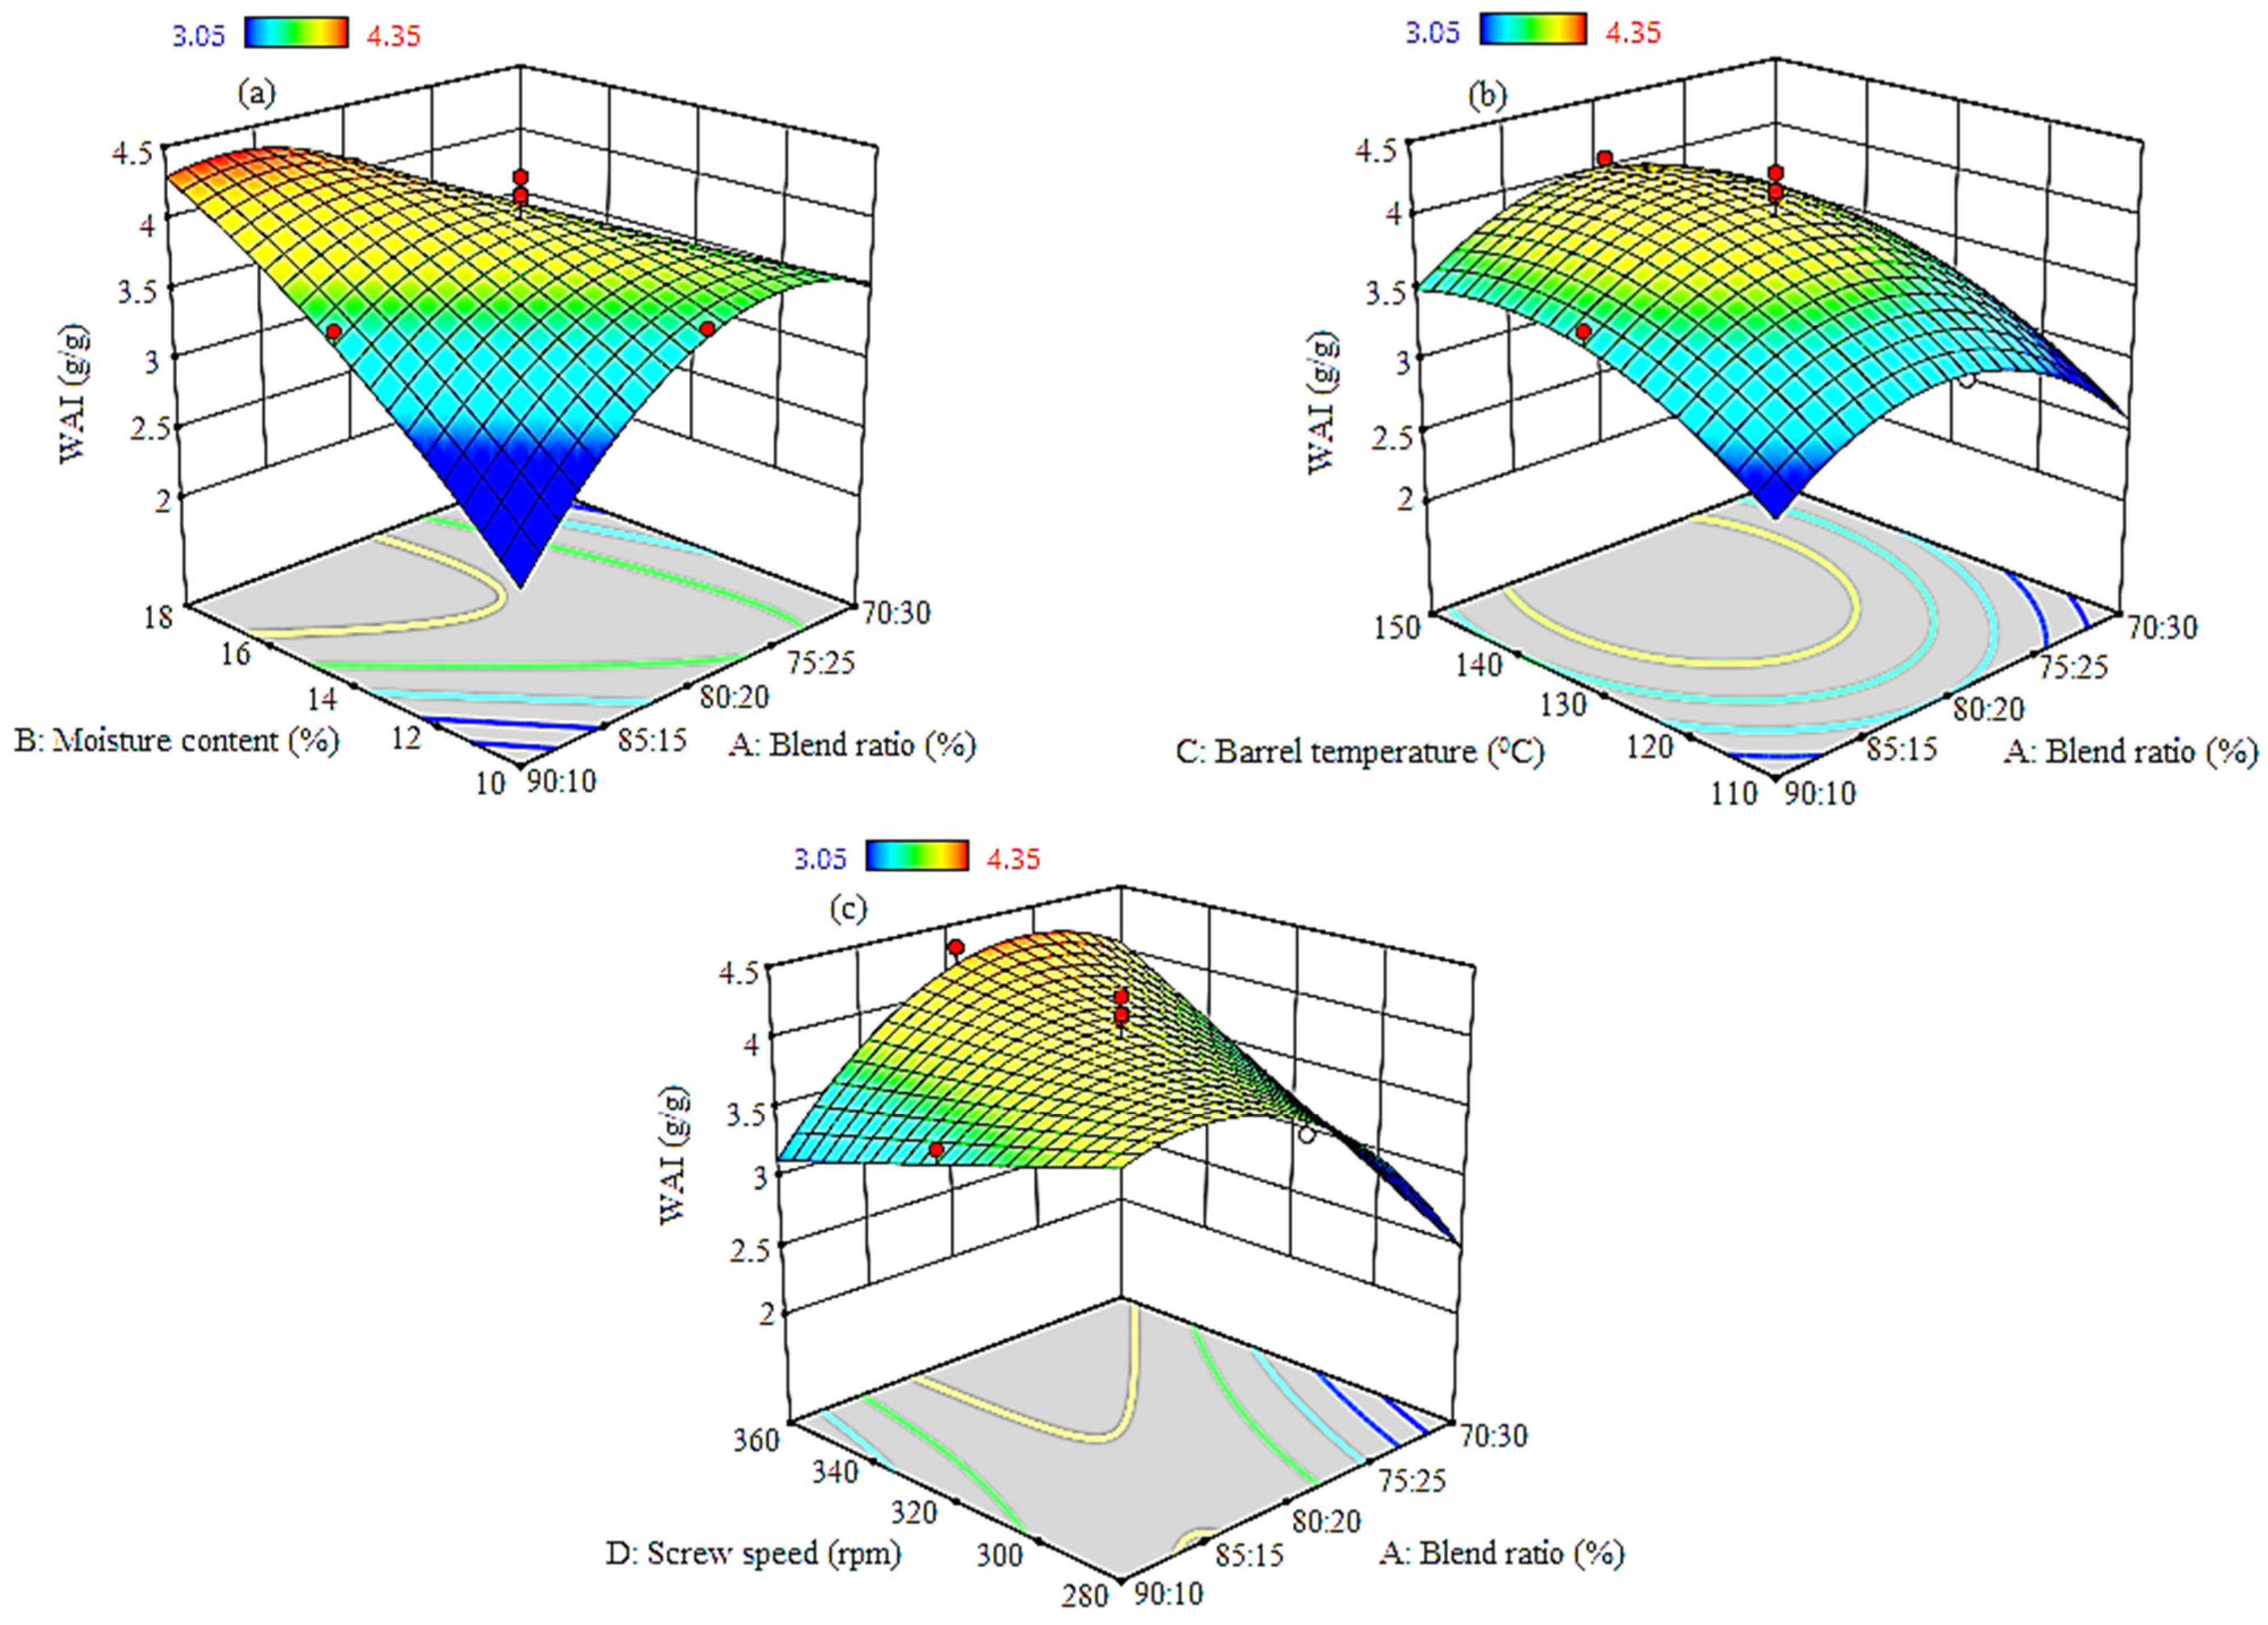
3.1.2. Water Absorption Index (WAI)

WAI refers to the weight of the gel generated after the starch has swelled in excess water, as well as the amount of polysaccharide obtained from the starch polymer when excess water is added to it [36]. The starch granules went through transformation during extrusion cooking in the presence of heat energy [37]. The WAI values ranged from 3.05 to 4.35 g/g (Table 2). The fitted quadratic equation for WAI is shown in Equation (8).
W A I = 4.00 0.1167 B R + 0.2517 M C + 0.3383 B T + 0.2017 S S 0.7050 B R M C + 0.0200 B R B T + 0.5850 B R S S 0.0150 M C B T + 0.4100 M C S S 0.2150 B T S S 0.6058 B R 2 0.1758 M C 2 0.3308 B T 2 + 0.0042 S S 2
The quadratic regression Equation (8) depicts that BR had a negative effect on WAI, whereas MC, BT, and SS had a positive effect on WAI. The ANOVA (Table 4) showed that MC, BT, BR × MC, BR × SS, and BR2 were the significant quadratic regression terms (p < 0.05) for the model. The response surface plots for WAI in Figure 2a showed an increase in WAI with an increase in cowpea proportion of the BR up to 80:20 at the lowest MC, though it has the highest value of 4.35 g/g at an MC of 18 and BR of 90:10. Generally, WAI increased with an increase in MC, BT, and SS, as shown in WAI Figure 2b,c. From Equation (8), the interactive effect of the increase in BR × BT, BR × SS, and MC × SS resulted in an increase in WAI. However, WAI decreased with an increase in BR × MC, MC × BT, and BT × SS. The increase in the cowpea proportion in the BR led to a decrease in WAI at the lowest SS. At a constant BR of 90:10, an increase in MC increases the WAI. Jakkanwar [9] observed that WAI increases along with BT and FMC up to a point and then decreases as a result of increased dextrinization.
It was observed that with an increase in MC from 10 to 12%, WAI was low. However, with a further increase in MC from 12 to 18%, an increase in WAI occurred. According to Reshi et al. [23], a high MC has a plasticizing effect on starch and hence has a large control over starch breakdown. The increase in BT increases WAI (2.86–3.5 g/g). This is most likely due to a higher temperature, which enhanced dextrinization, which is in agreement with the observation of Jakkanwar et al. [9]. This result was comparable to the findings of Yousf et al. [38] who used a BT of 120 to 150 °C on rice carrot RTES. Higher SS caused starch granules to break apart, allowing more water molecules to reach the hydrophilic regions, therefore reducing WAI.

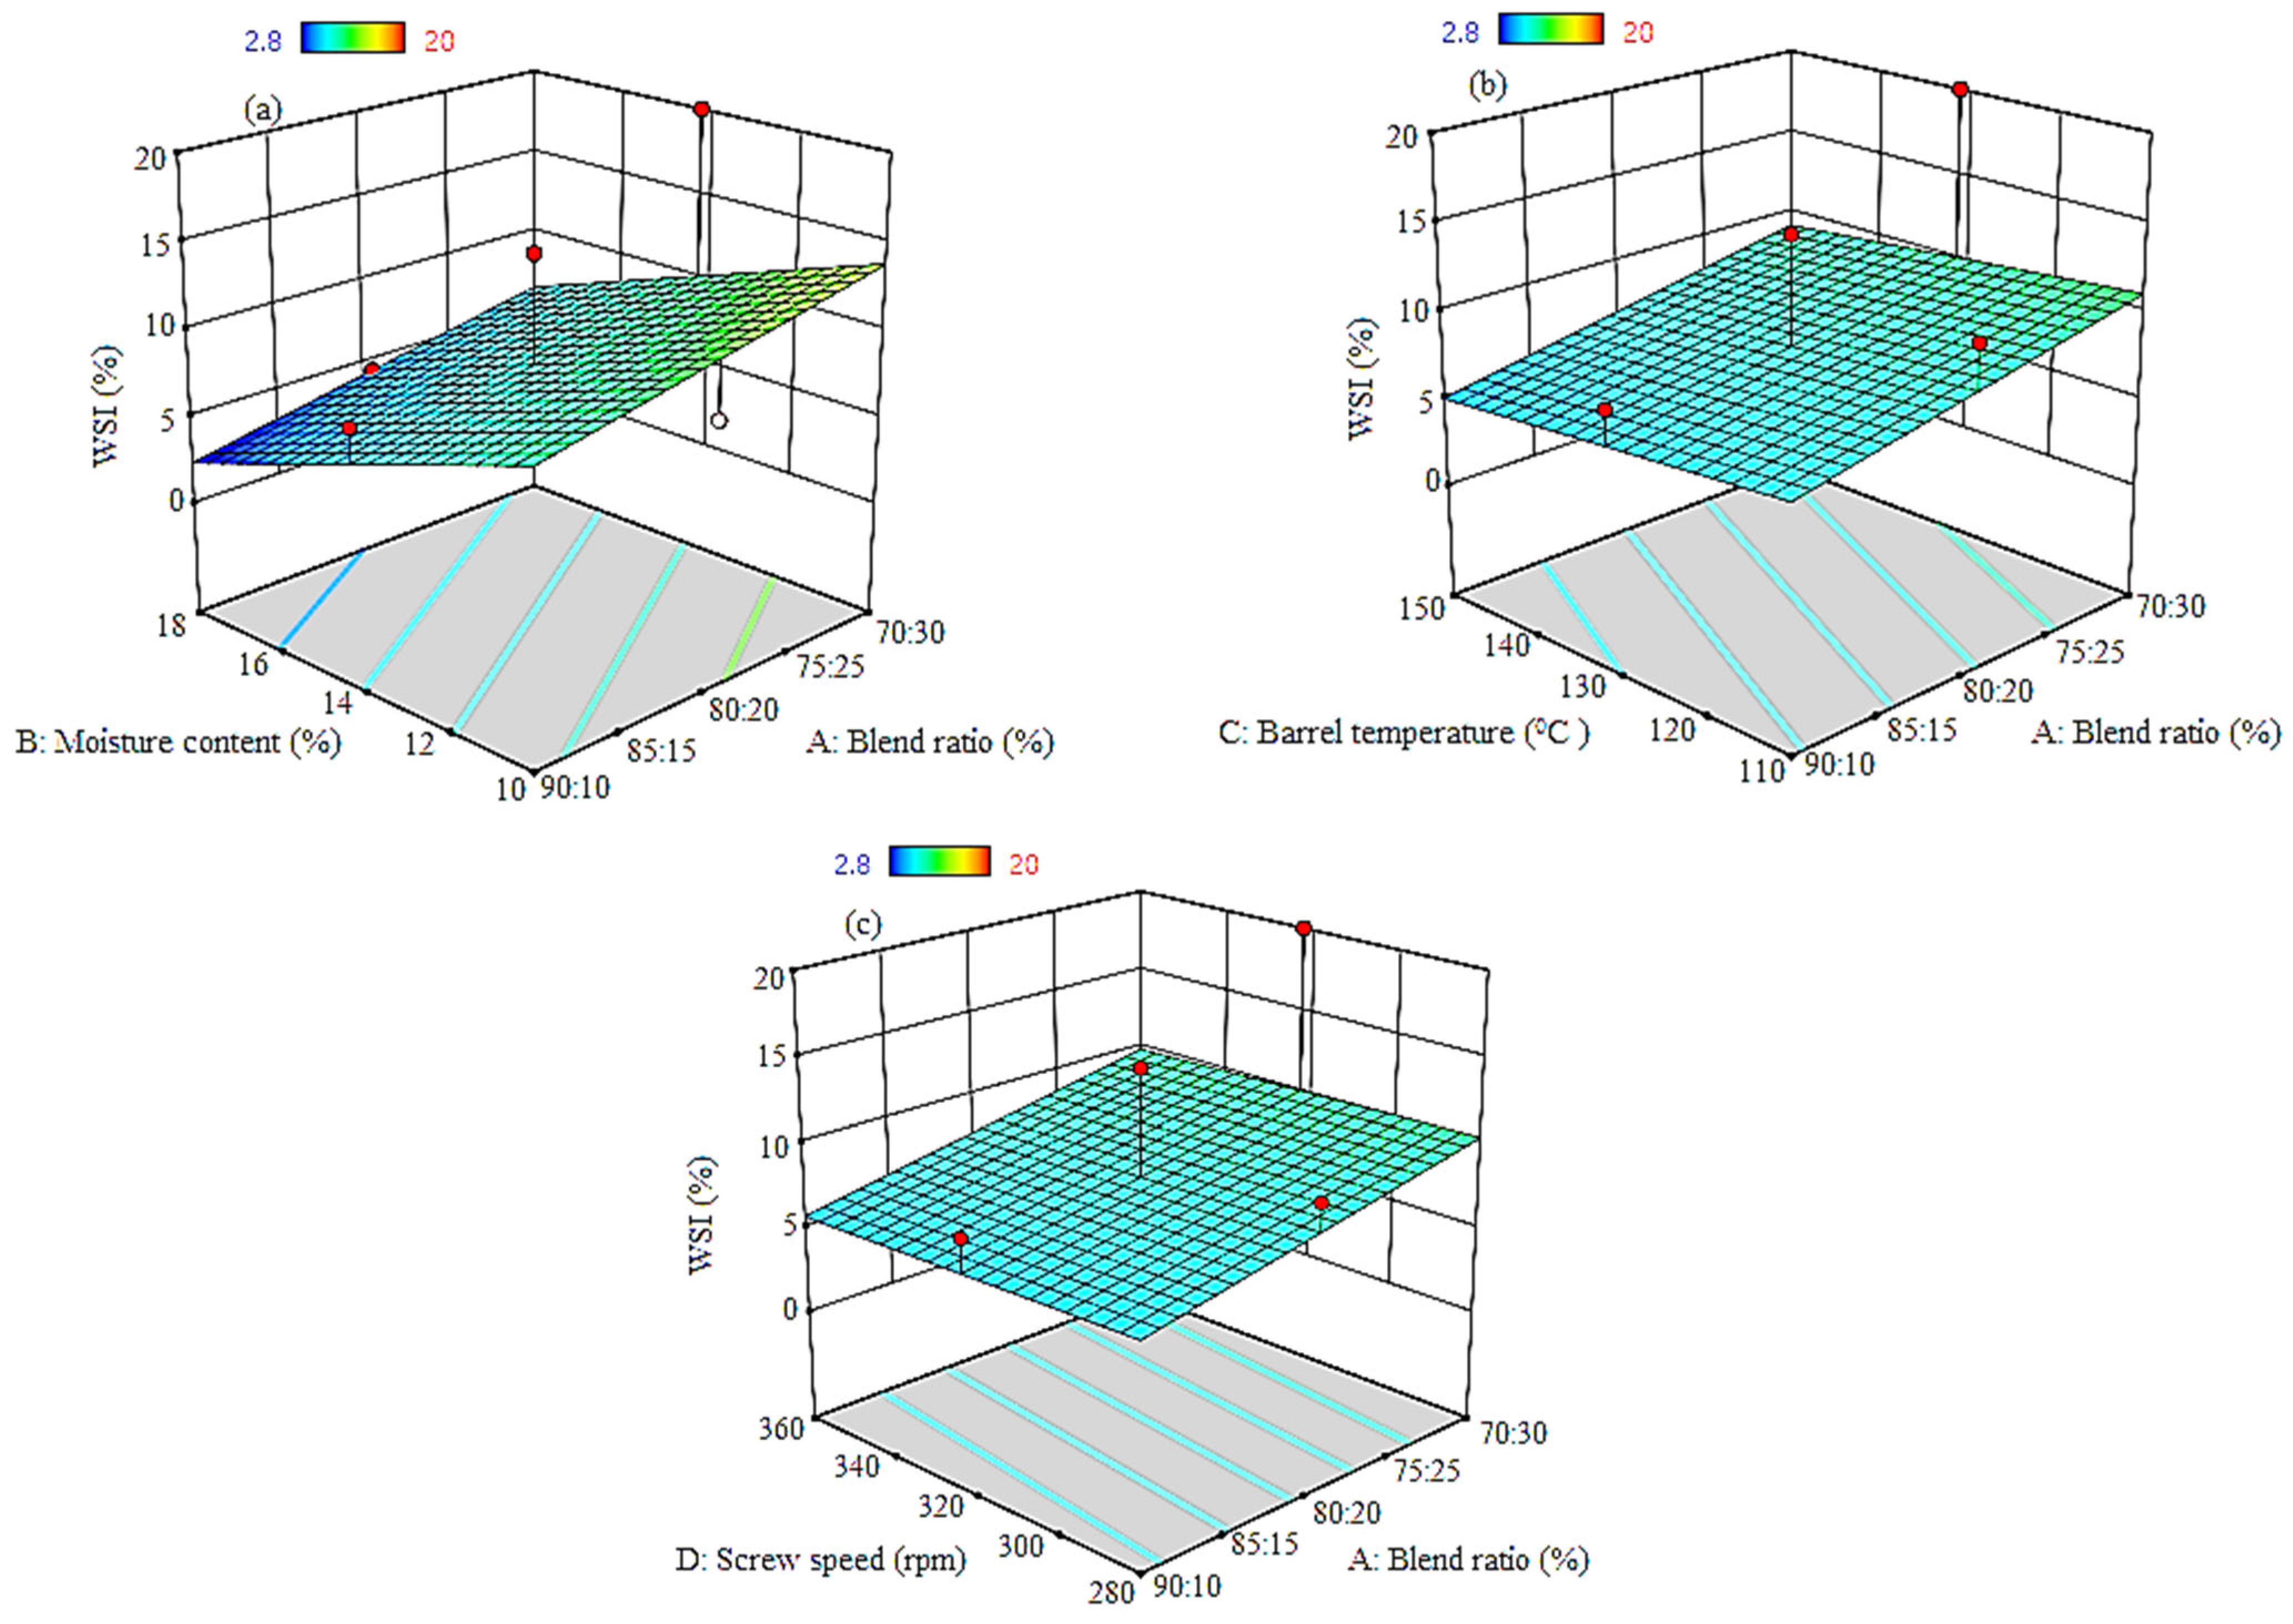
3.1.3. Water Solubility Index (WSI)

WSI of the extrudates ranged between 2.8 and 20% (Table 5). The linear equation for WSI is shown in Equation (9).
W S I = 8.07 + 2.07 B R 3.67 M C 0.9333 B T 0.2667 S S
WSI indicates starch breakdown through dextrinization, and is associated with the presence of water-soluble molecules [15]. The WSI of the extrudates ranged from 2.8% to 20% (Table 5). The linear regression in Equation (9) shows that BR had a positive effect on WSI, while MC, BT, and SS had a negative effect on WSI. The ANOVA showed that MC was the significant linear regression term (p < 0.05) for the model. The response surface plots of WSI in Figure 3a show an increase in WSI with an increase in cowpea proportion of the BR, while WSI decreased with an increase in MC, BT, and SS, as shown in WSI Figure 3b,c. At a constant MC, an increase in cowpea proportion in BR (90:10 and 70:30) increased WSI from 9.6 to 13.7%. This can be attributed to the fibrous and higher protein content in the feed combination, which is in agreement with the observation of Yousf et al. [38]. Whereas, at a constant BR, the increase in MC from 10 to 18% decreased WSI from 9.6 to 2.5%, due to a greater gelatinization of starch and plasticizing effect. Lower MC led to an increase in WSI, likely due to higher starch degradations, as observed by Reshi et al. [23] and Sibel and Fahrettin [39].

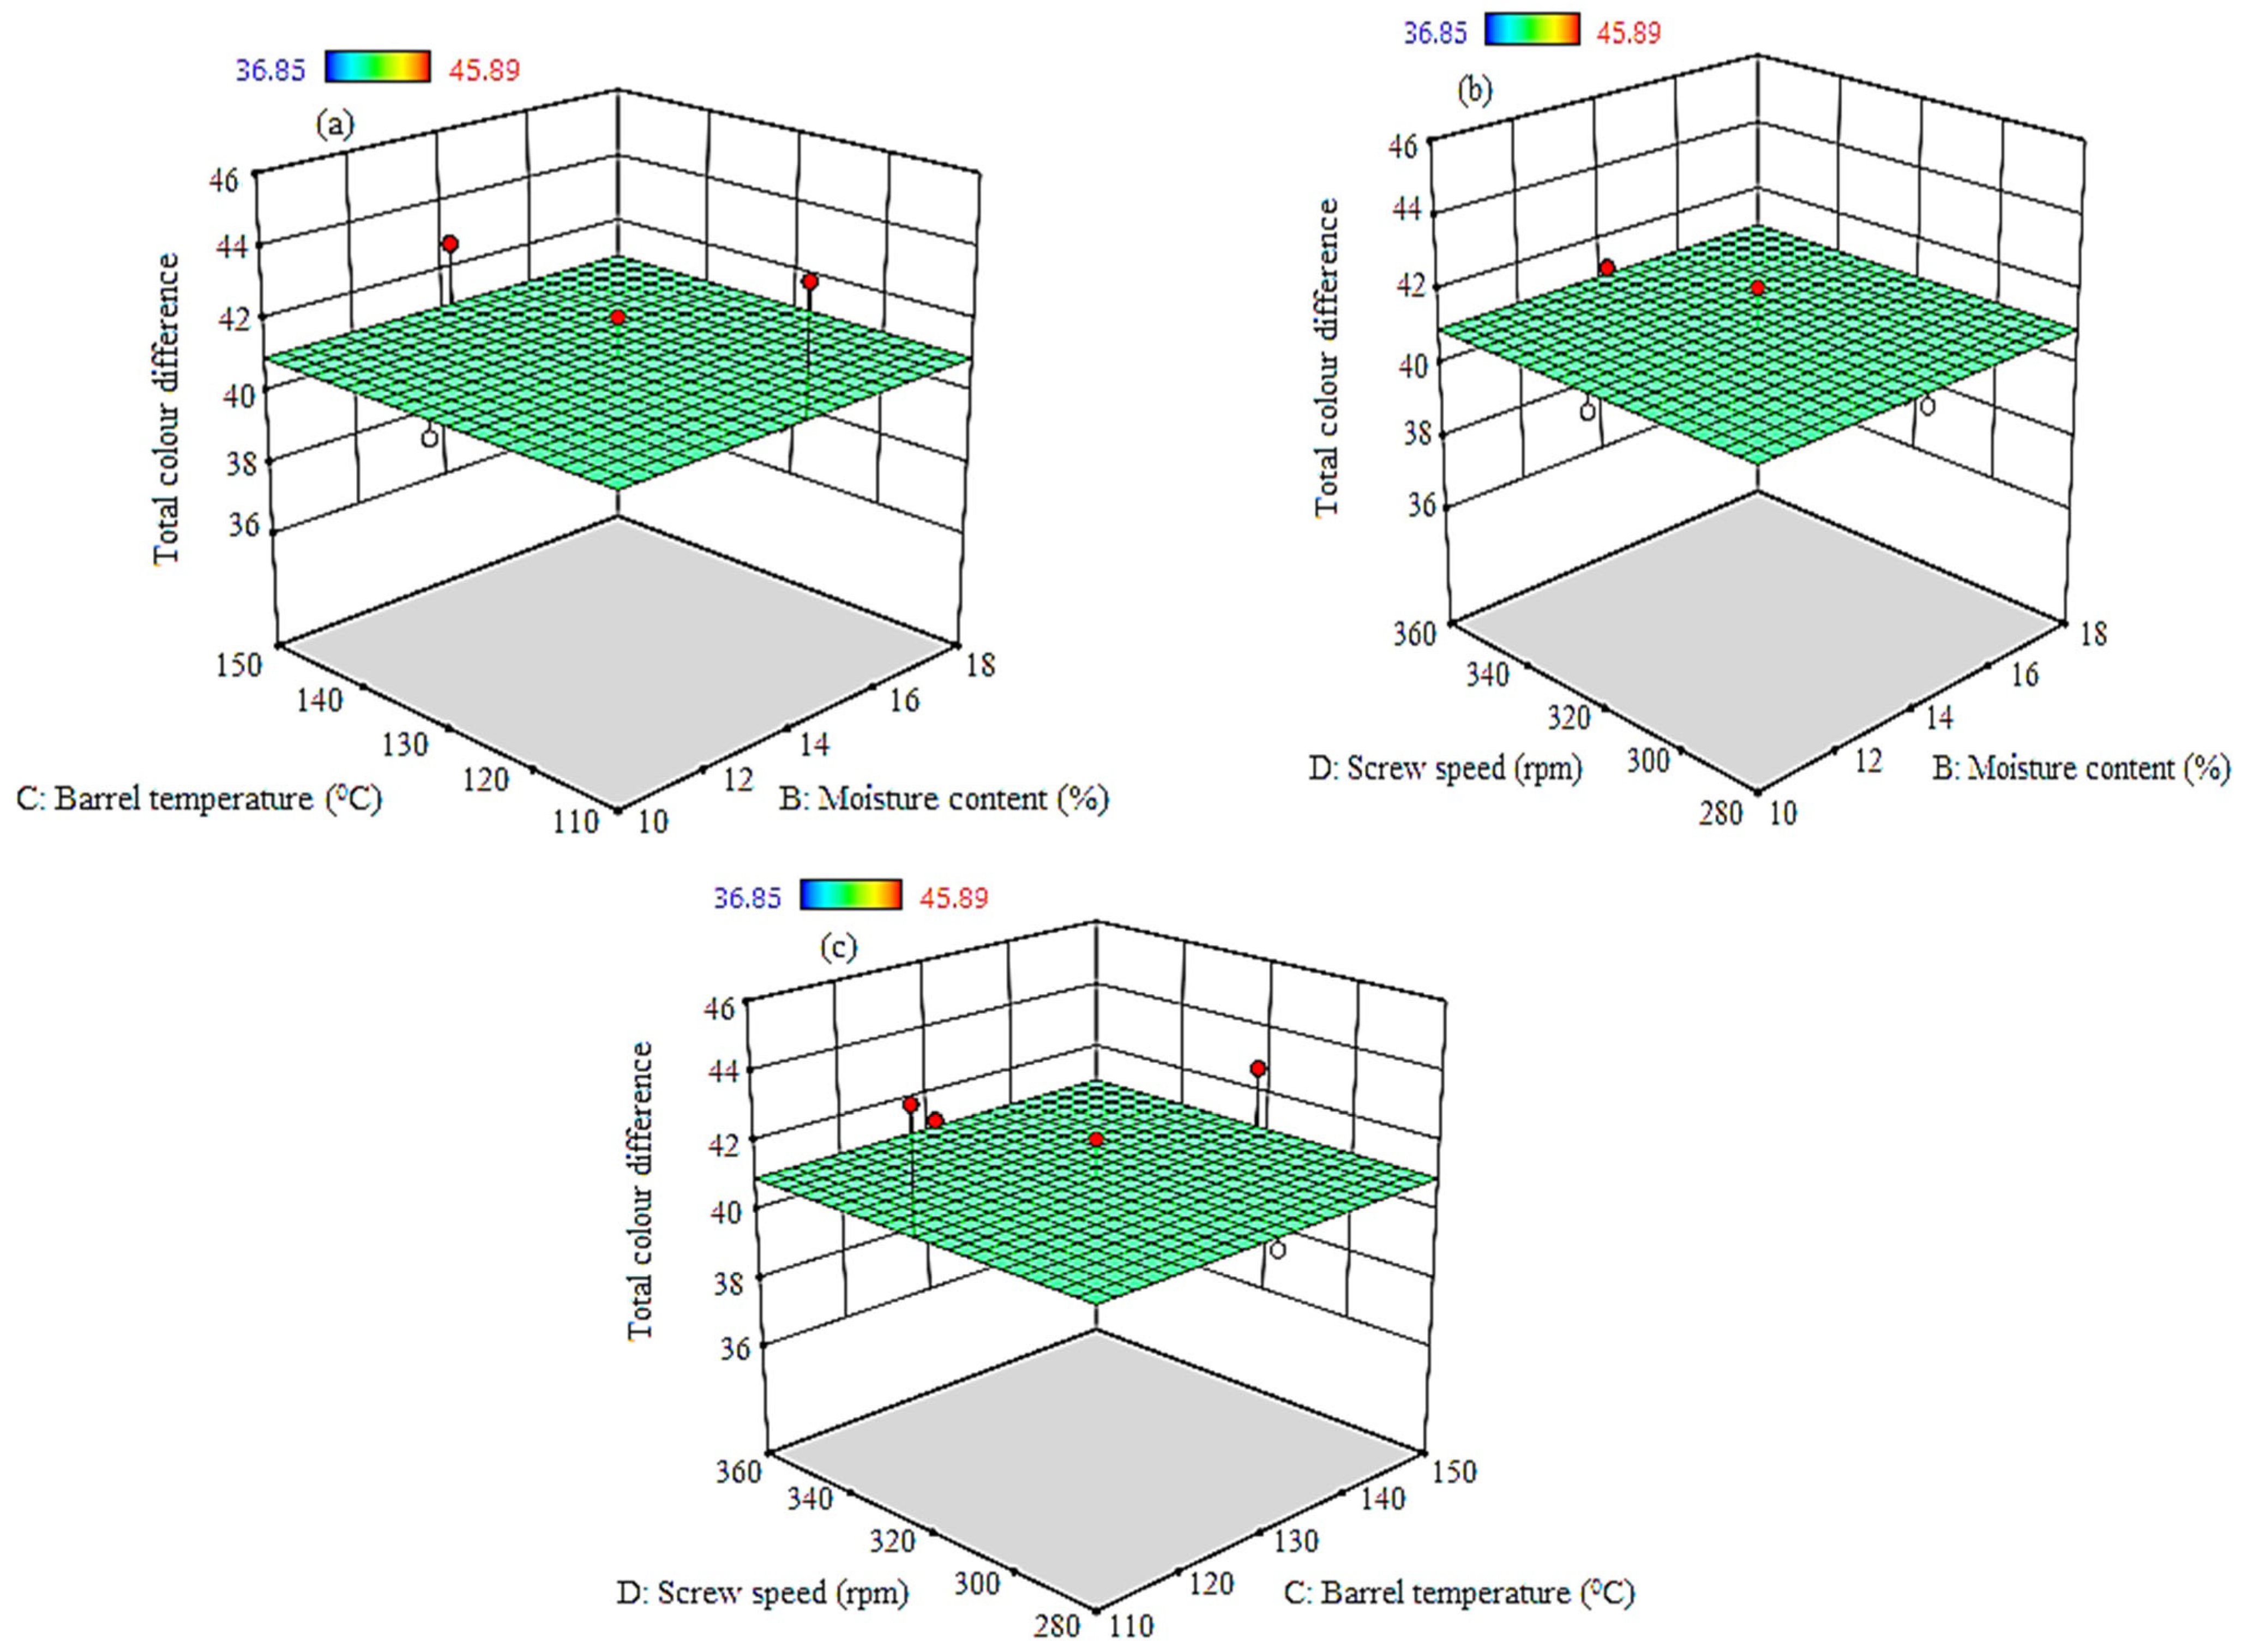
3.1.4. Total Color (TC)

An increase in BR, MC, BT, and SS had no significant effect (p > 0.05) on TC, as seen in Equation (10), and Figure 4a–c depicts that BR, BT, and SS had a negative effect on TC while MC had a positive effect. The minimum and maximum TC 36.85 and 45.89 were obtained at the same BR of 75:25, 12% MC, and SS of 300 rpm but BT of 140 and 120 °C, respectively, as shown in Table 2. The no significant difference (p > 0.05) in TC was observed across the processing variables, which was inconsistent with the finding of Cuj-Laines et al. [40], who recorded a significant rise in ∆E with a temperature increase from 110 to 190 °C due to Maillard reactions on carbohydrates and protein at higher temperatures resulting in darkening of products.
T C = 273 0.24 BR + 1.09 MC 2.51 BT 0.462 SS + 0.017 BR 2 0.05 MC 2 + 0.00970 BT 2 + 0.00071 SS 2

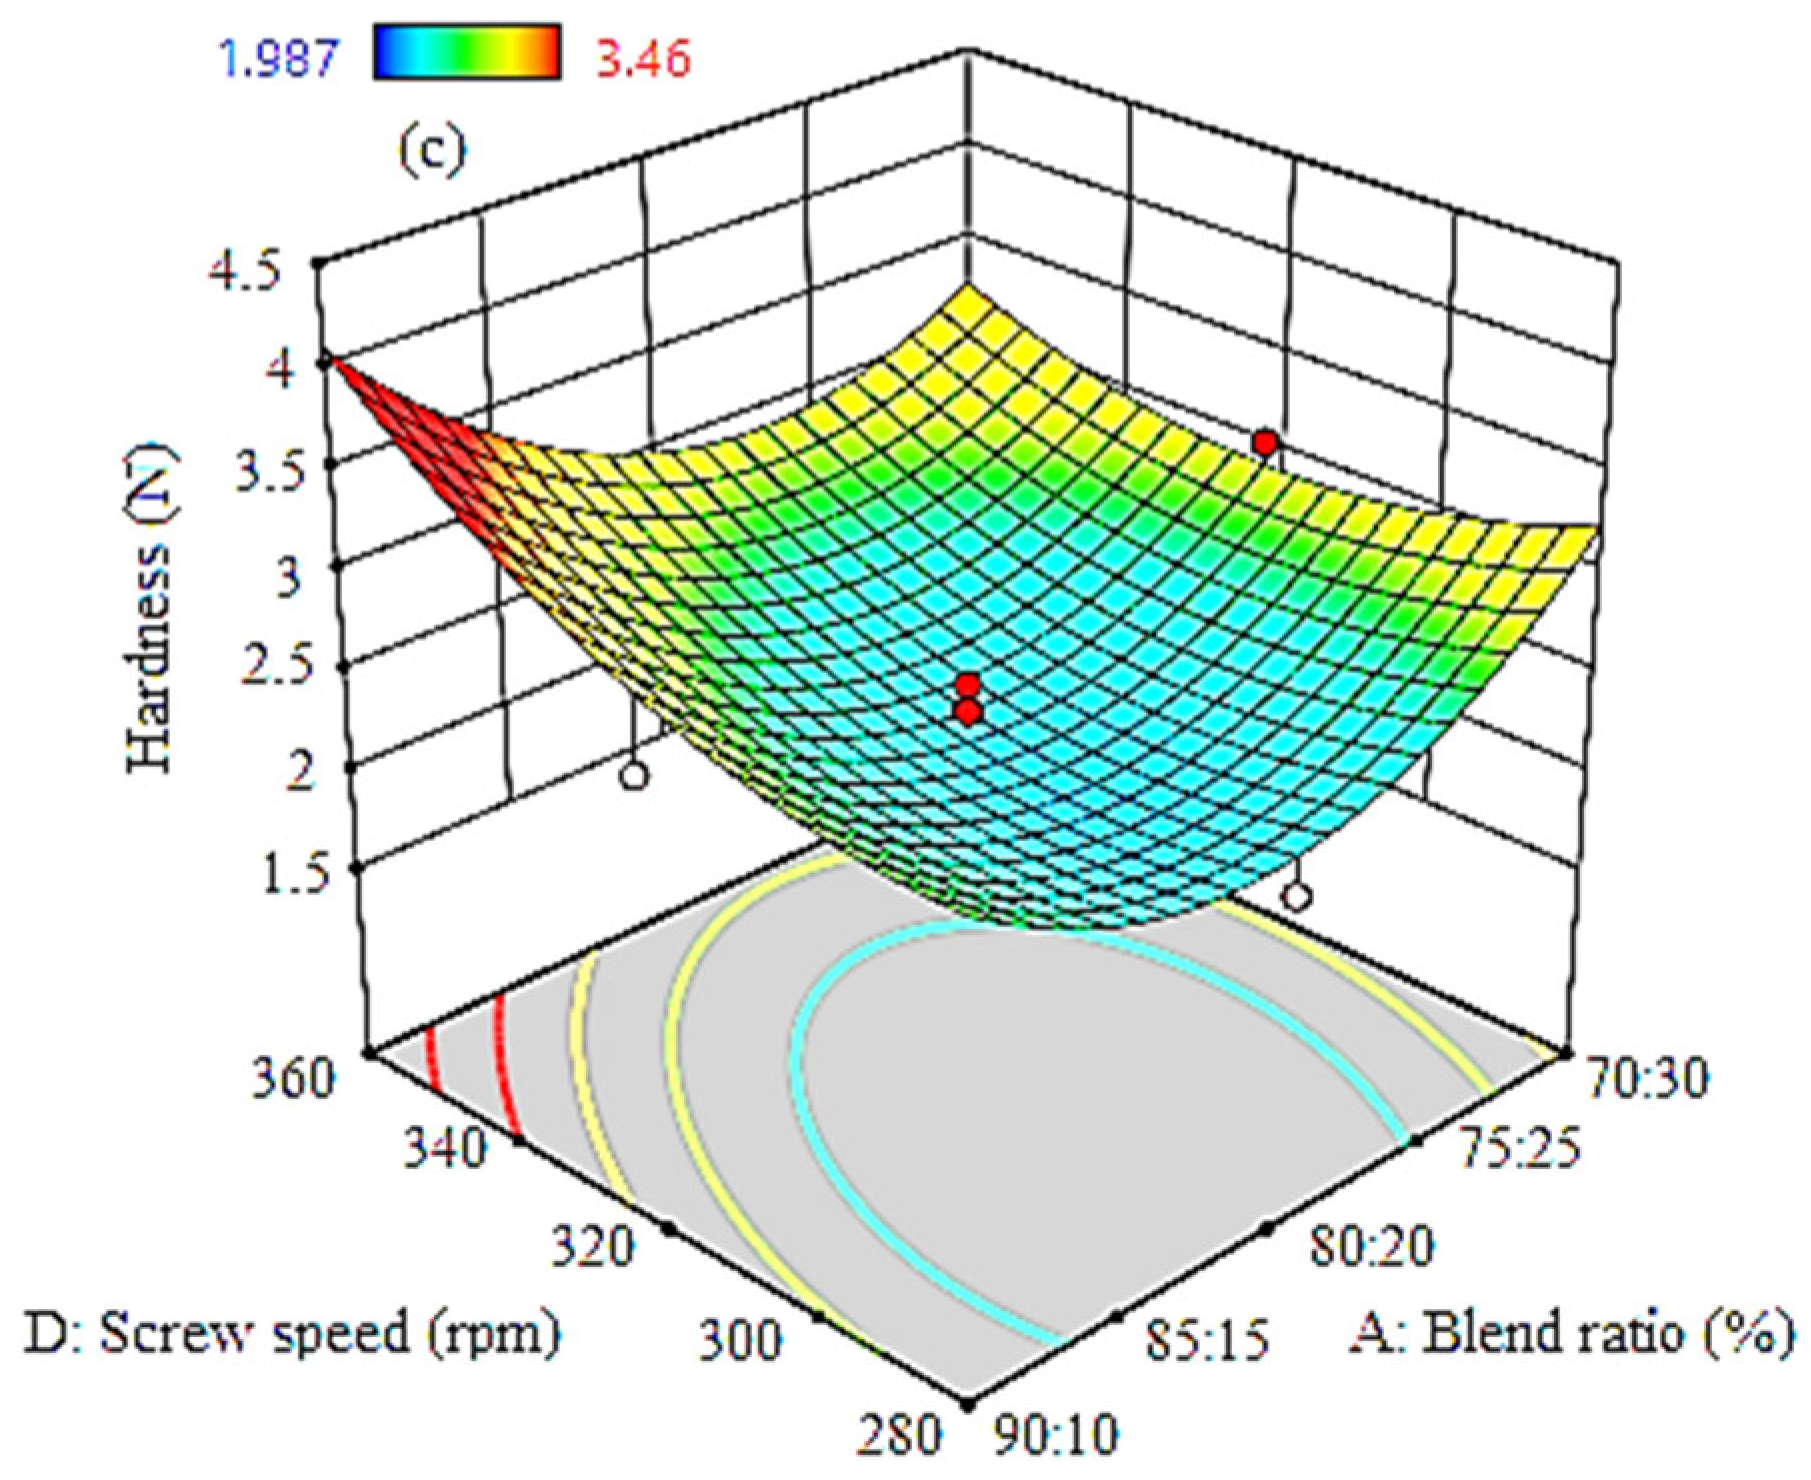
3.1.5. Hardness (HD)

HD values for the extrudates ranged between 1.987 N and 3.46 N (Table 2). Equation (11) shows the significant fitted quadratic equation of HD.
H D = 2.31 0.1084 B R + 0.1411 M C 0.0194 B T + 0.3209 S S + 0.2053 B R M C + 0.3293 B R B T 0.3027 B R S S + 0.2827 M C B T + 0.9208 M C S S 0.2522 B T S S + 0.7086 B R 2 + 0.3036 M C 2 + 0.2671 B T 2 + 0.3481 S S 2
The quadratic Equation (11) depicts that BR and BT had a negative effect on HD, but MC and SS had a positive effect on HD. The ANOVA (Table 6) showed that the interaction of MC × SS was significant in the quadratic regression (p < 0.05) terms for the model. The response surface plots of the HD in Figure 5a,b showed a decrease in HD with an increase in cowpea proportion of the BR up to 20% and an increase in BT. HD equally increased with an increase in MC and SS, as shown in HD Figure 5a,c. At a constant MC, an increase in the cowpea proportion of the BR resulted in a gradual decrease from 90:10 to 80:20 of the HD. However, with a further increase in the cowpea proportion to 25%, there was a steep increase in HD. At a constant BR, an increase in MC increased HD. This was because of the reduction in expansion caused by the high MC. This observation was the same for a chickpea-based extrudate, according to Meng et al. [35].
At a constant BR, an increase in SS resulted in a gradual increase in hardness from 2.8 to 4.1 N, as shown in HD Figure 5c. This observation was against the result obtained by Reshi et al. [23] and Meng et al. [35]. They observed that an increase in SS reduced hardness because increased SS favors starch depolymerization and bubble generation; thus, the hardness of the extrudate decreases with increased SS. The interactive effect of the increase in BR × MC, BR × BT, MC × BT, and MC × SS resulted in an increase in hardness, while BT × SS and BR × SS decreased hardness, as shown in the regression Equation (11).

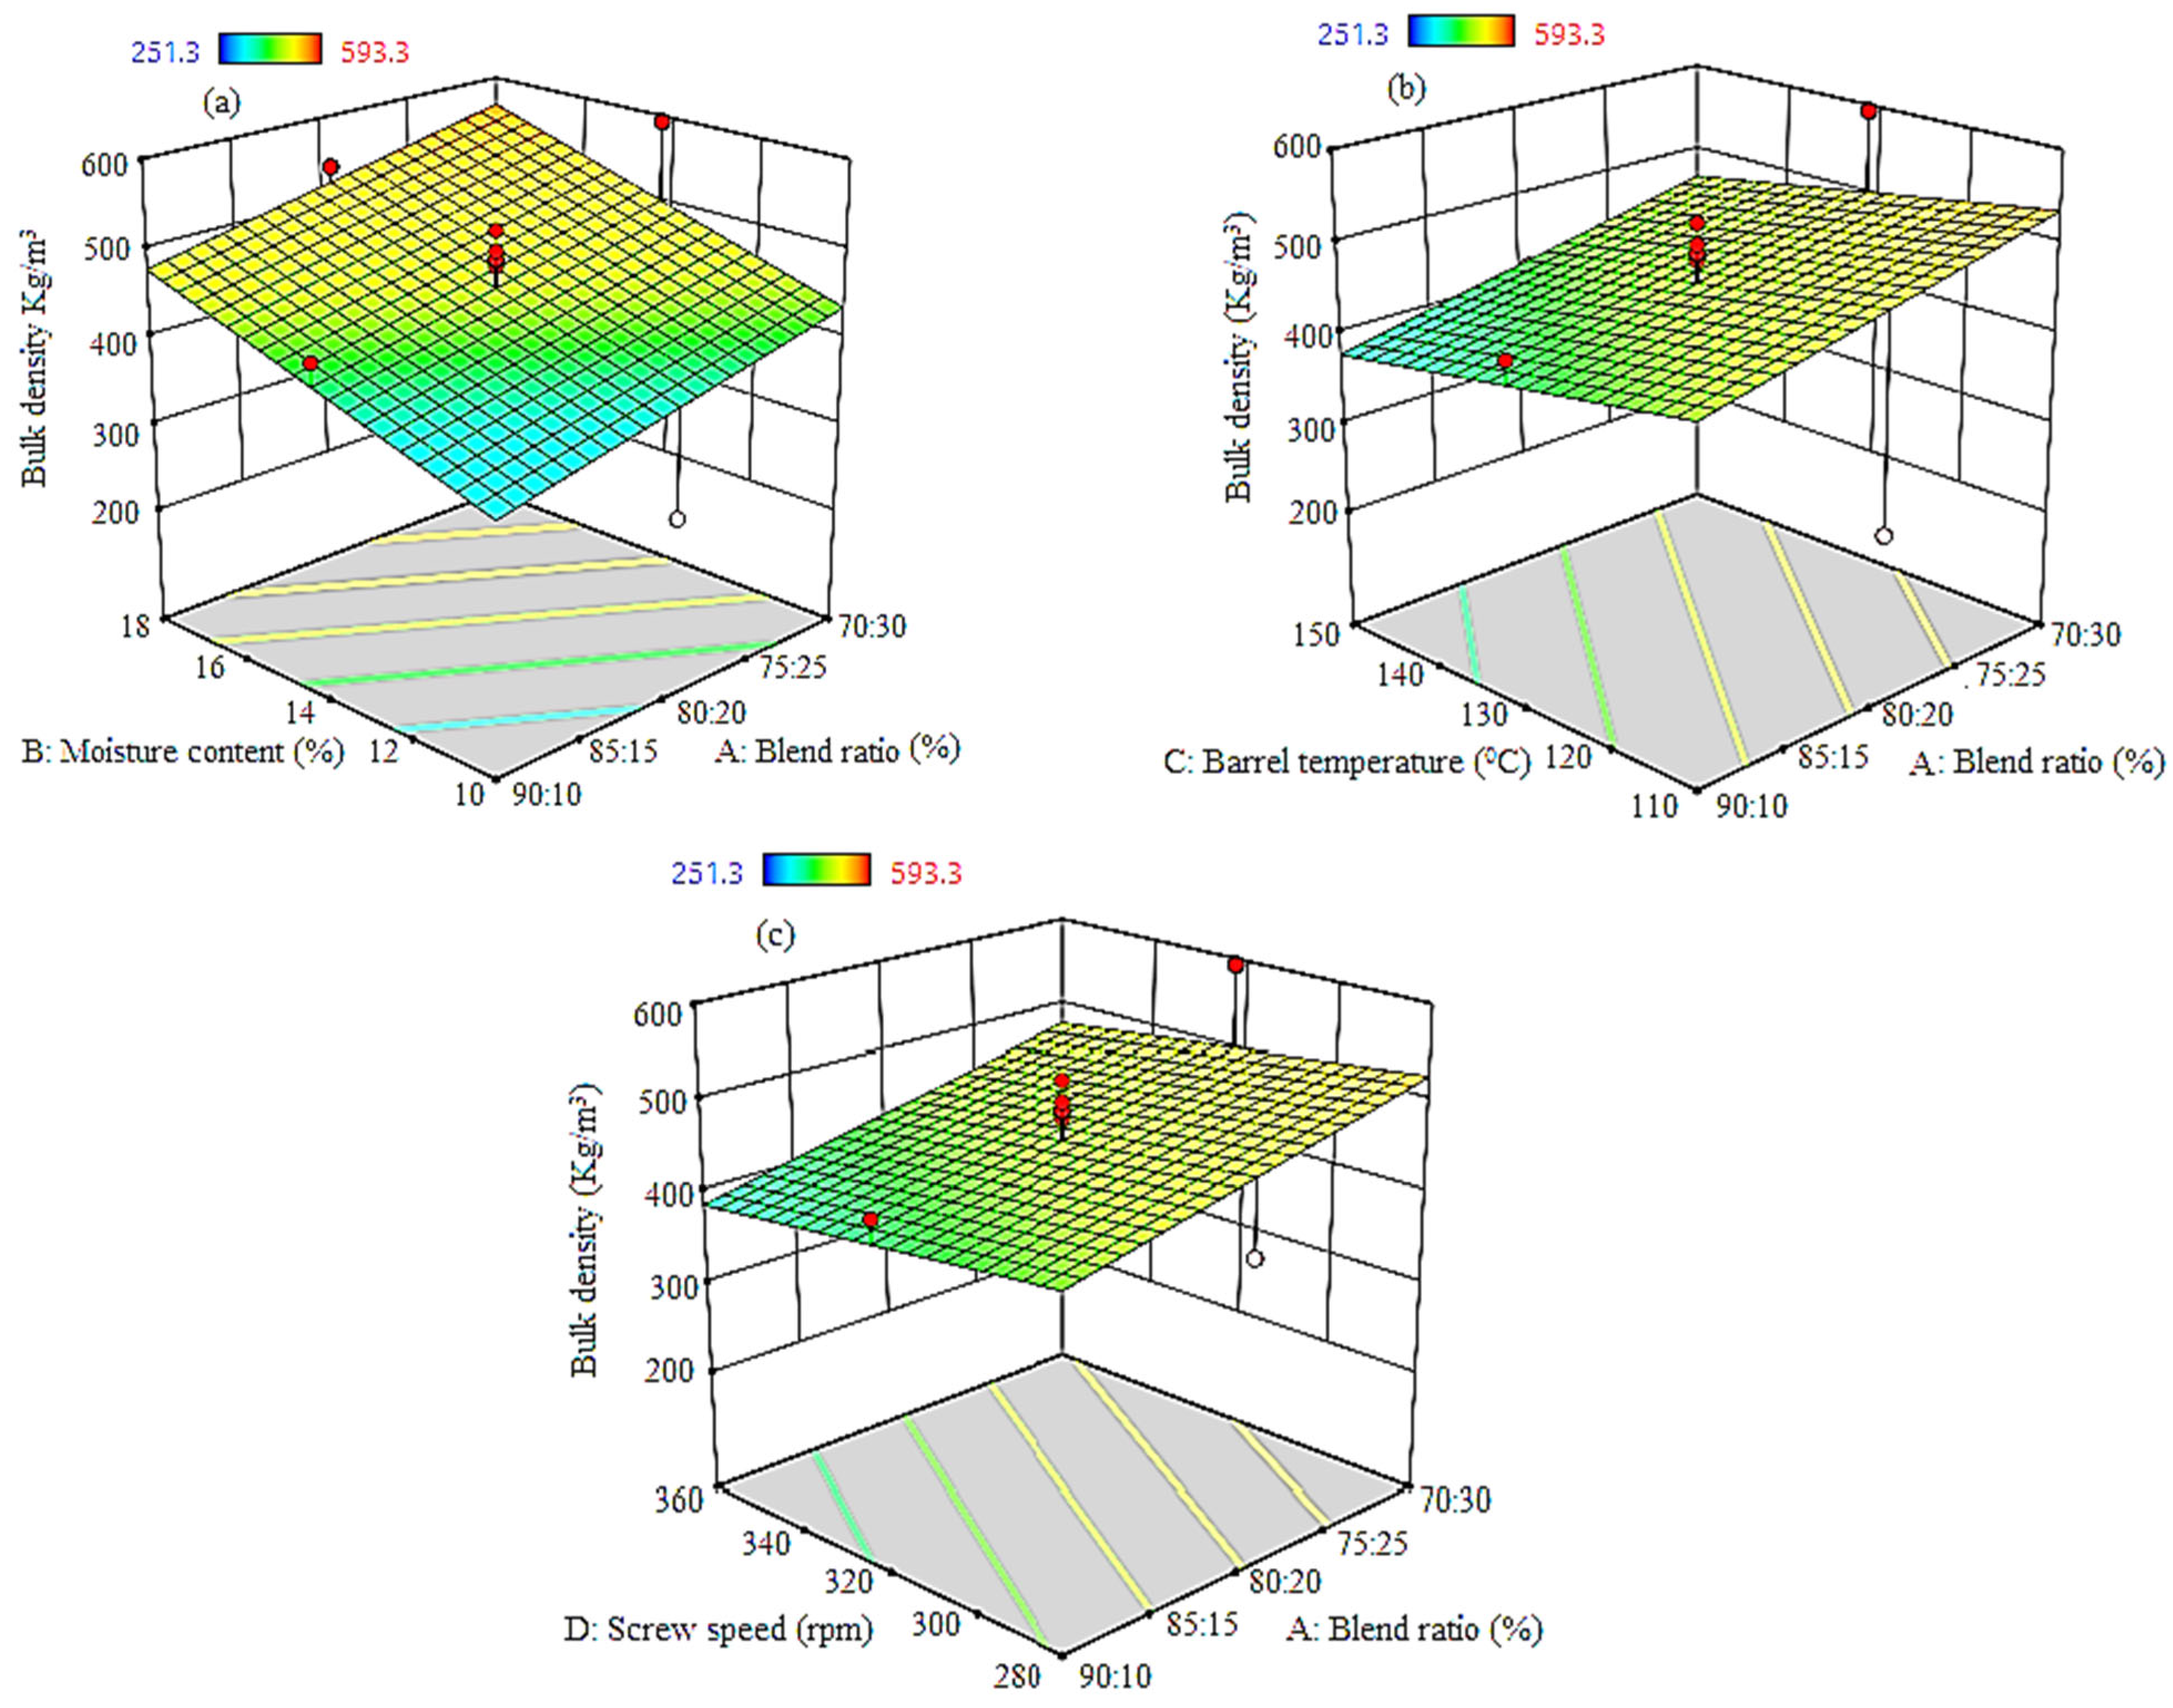
3.1.6. Bulk Density (BD)

The BD is crucial in the quality control of food products, especially RTES. It shows the volumetric expansion of the products and is used in the food sector to determine the design of packaging materials for food products [23,41]. The BD values for the extrudates ranged between 0.251 and 0.593 g/cm3 (Table 2). The linear equation for BD is shown in Equation (12).
B u l k   d e n s i t y = 456.25 + 45.05 B R + 66.42 M C 33.37 B T 23.88 S S
The linear regression Equation (12) shows that BR and MC had a positive effect on BD, while BT and SS had a negative effect. The ANOVA (Table 7) showed that there was no significant linear regression (p > 0.05) term in the model equation. The response surface plots of BD in Figure 6a showed an increase in BD with an increase in the cowpea proportion of the BR and MC, while a decrease in BD was observed due to the increase in SS and BT, as shown in BD Figure 6b,c. The increase of cowpea proportion in the BR led to an increase in the BD because cowpea is denser than rice. Cowpea contains higher protein and fiber content and therefore, an increase in cowpea resulted in an increase in B. A similar observation was reported by Altaf et al. [42] using rice and chickpea as base products. An increase in MC at a constant BR increases the BD because there is an increase in FMC during extrusion resulting in a reduction of the elastic property of the dough by condition of the melt. This reduced gel formation and decreased the expansion, thereby resulting in an increase in the BD of extrudates. Hagenimana et al. [43] observed that an increase in the MC of RTES increases the BD. The BD decreases when BT is increased due to the high stored energy for the flash-off of highly heated water provided by high temperature as extrudates exit the die. The rise in BT resulted in moisture loss at the exit which caused the extrudate to become lighter in weight, as reported by Köksel [44].

3.1.7. Expansion Ratio (ER)

The expansion ratio (ER) is the degree of puffiness of an extrudate when exiting the die due to the presence of the atmospheric air which leads to a quick flash-off of internal moisture [23,41]. ER ranged between 2.26 and 3.06 mm (Table 2). Equation (13) shows the linear equation of ER.
E R = 2.51 0.2308 B R 0.0692 M C + 0.1592 B T 0.0375 S S
The linear regression Equation (13) depicts that BR, MC, and SS had a negative effect on ER, whereas BT had a positive effect. The ANOVA (Table 8) showed that BR and BT were the significant linear (p < 0.05) regression terms for the model. The response surface plots for the expansion ratio in Figure 7a show a decrease in ER with an increase in cowpea proportion in the BR and an increase in MC. An increase in BT increased ER whereas an increase in SS led to a decrease in ER, as shown in Equation (13). An increase in the cowpea proportion of the BR reduces the ER (2.8–2.3 mm). An increase in the cowpea proportion of the BR increased the protein content, which influences the expansion of the starch polymer due to the generation of starch–protein complexes. As a result, the number of accessible molecules present in water for the creation of bubbles is reduced, and expansion is restricted, as observed by de Mesa et al. [45], with Pandey et al. [37] and Robin et al. [46] also confirming this finding. At a constant BR, an increase in MC reduced the ER because cowpea has a high water-holding capacity, which hinders moisture loss at the exit and suppressed bubble formation, resulting in a denser product with less puffiness, which is in agreement with Reshi et al. [23]. The increase in SS, on the other hand, led to a drop in the ER. The negative effect of increased SS on ER is ascribed to shorter residence time and inadequate temperature increase in the molten mix, as observed by Rathod and Annapure [24]. This obstructs expansion by flash vaporization at the die according to Kaur et al. [47].

3.1.8. Overall Acceptance (OA)
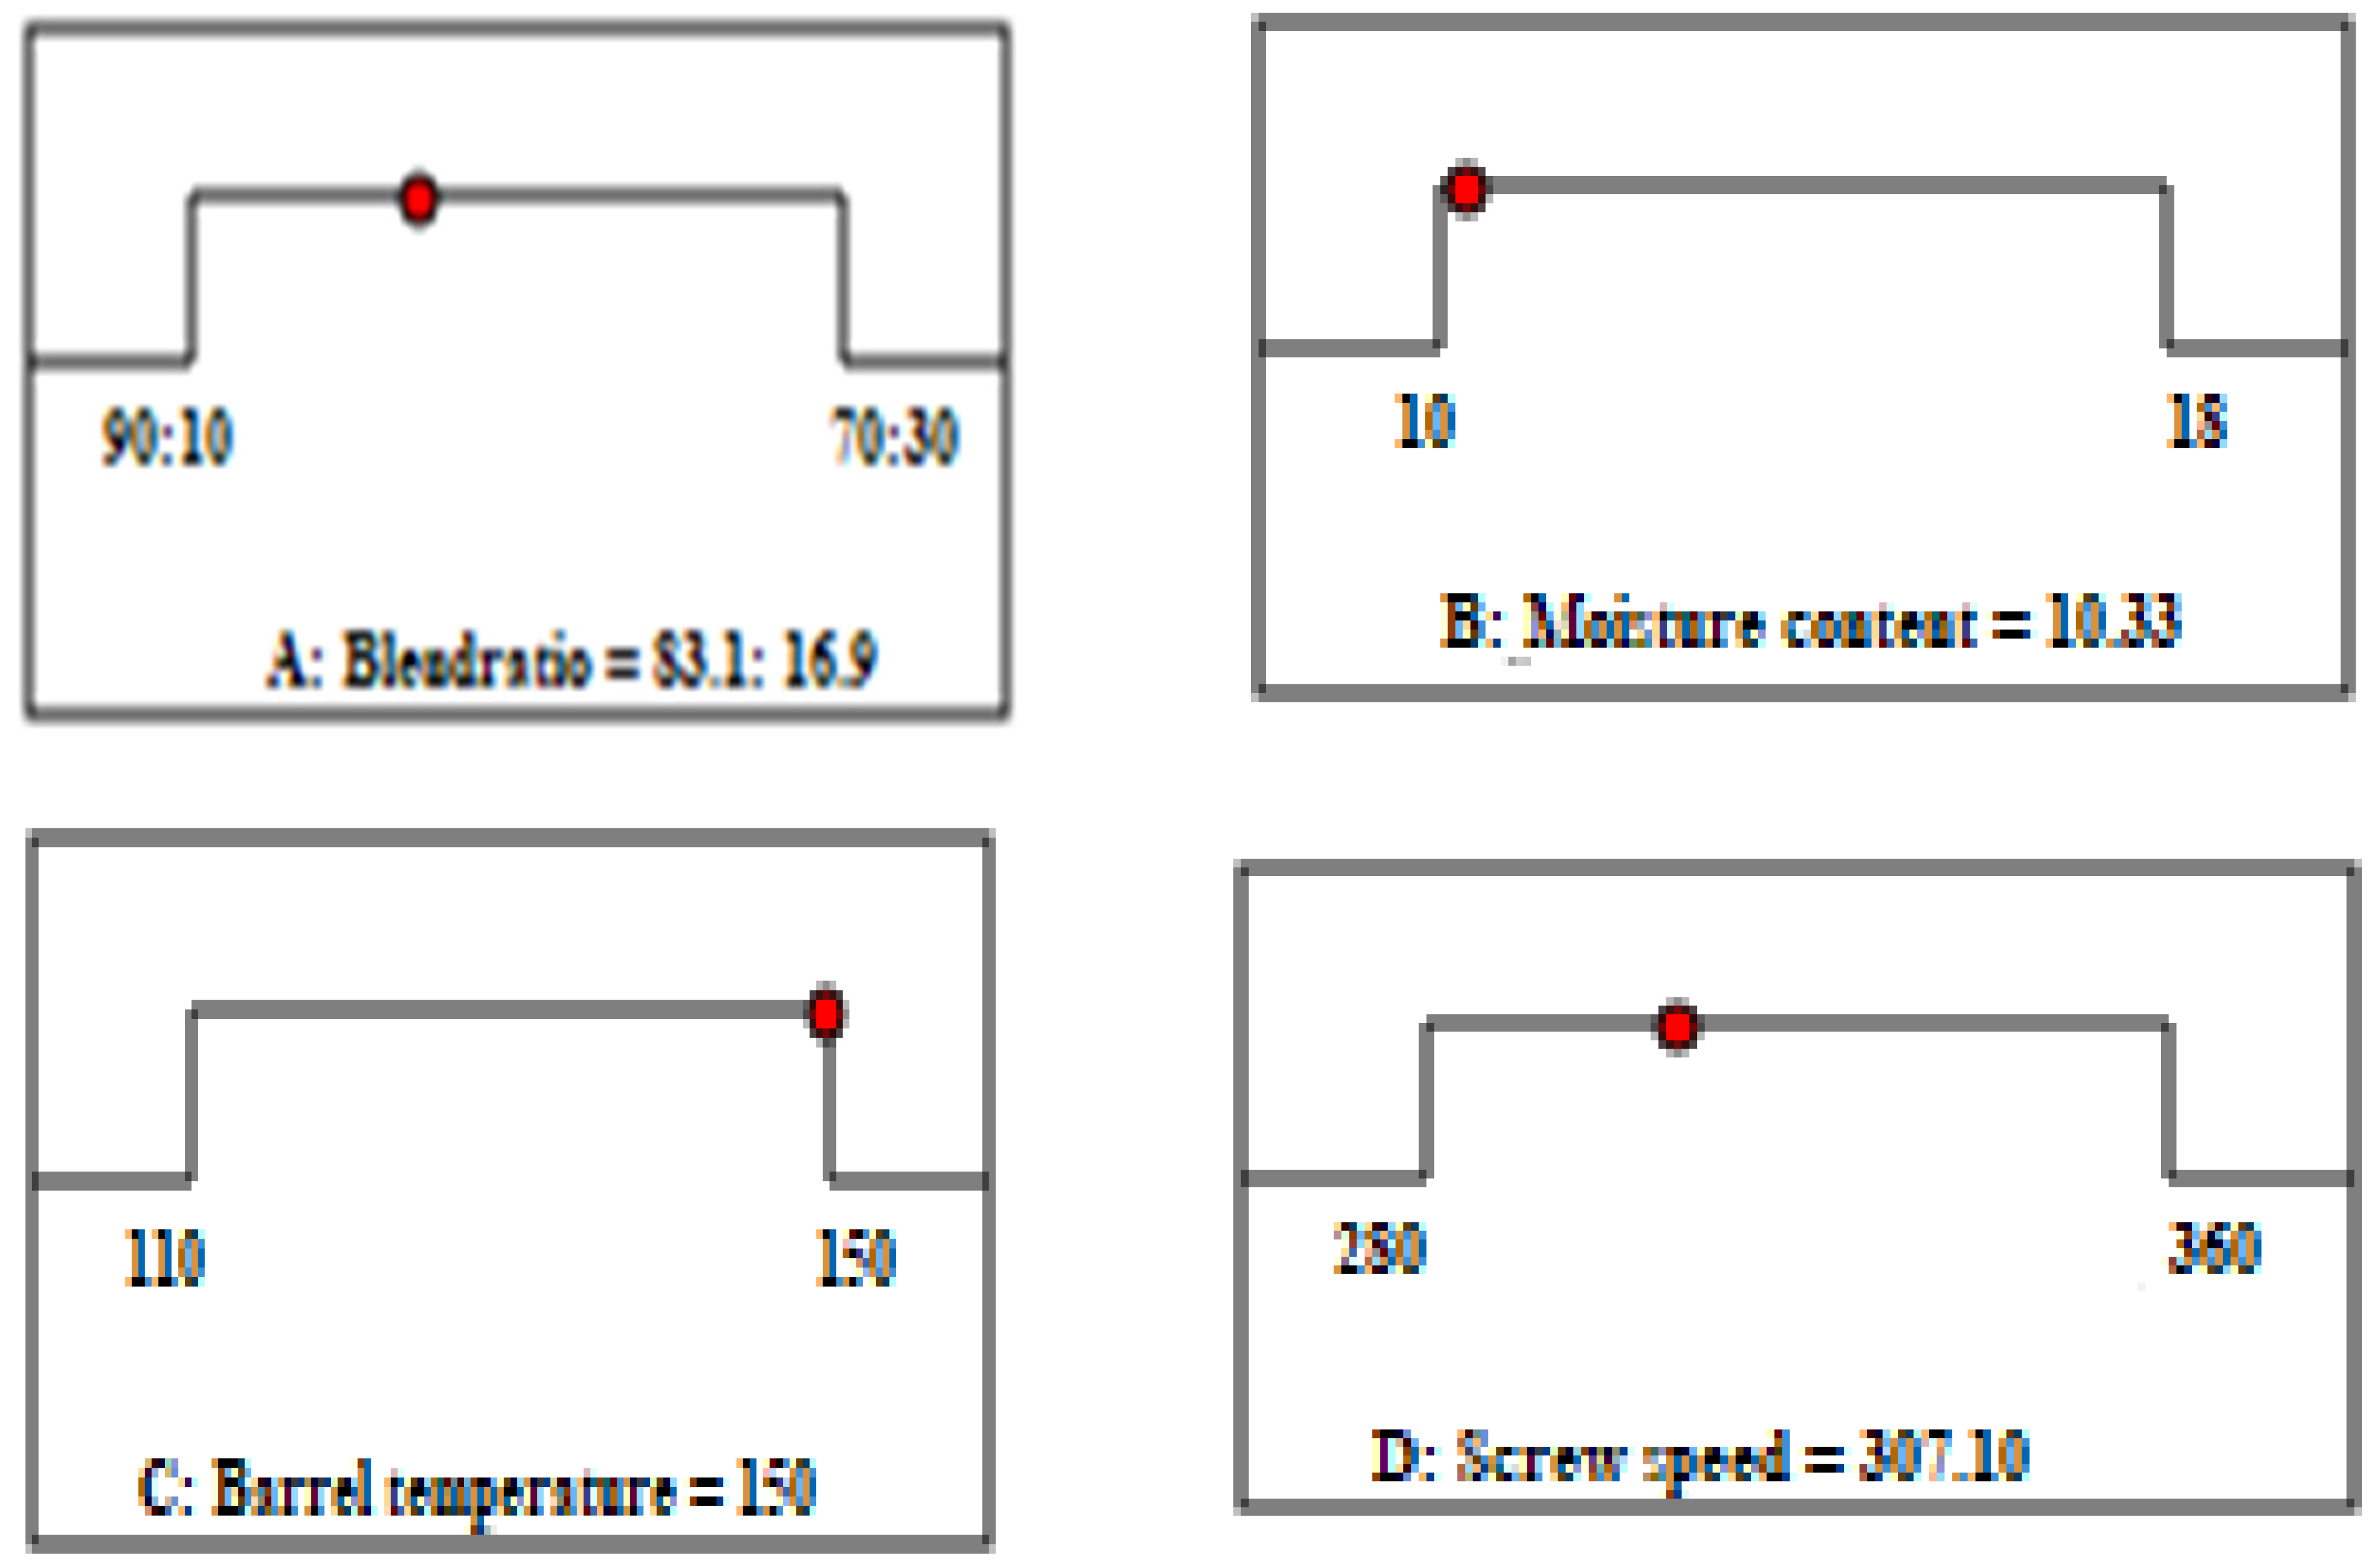
The value for OA ranged between 5.2 and 8.1 for runs 4 to 23, respectively (Table 2). The linear equation for sensory property (OA) is given in Equation (14).
O A = 6.73 0.0917 B R 0.900 M C + 0.19197 B T 0.4417 S S
From Equation (14), it is shown that BR, MC, and SS had a negative effect on the OA of the extrudates, while only BT had a positive effect. The ANOVA (Table 9) shows that MC was the significant linear (p < 0.05) regression term for the model. The response surface plot for OA in Figure 8a,c showed that an increase in cowpea proportion of the BR resulted in an increase in MC. An increase in SS resulted in a decrease in OA. This is because an increase in the cowpea proportion of the BR reduced the expansion of the extrudates, thereby resulting in a reduction in OA. However, the increase in BT increased the OA of the extrudates by the panelist assessment, as shown in Figure 8b. This is because higher temperature increases the expansion of the extrudates and the consumer’s preference is for a puffier snack. From the results, it was obvious that extrudates can be produced by using a rice–cowpea composite with good sensory acceptability. The extrudate with the BR 85:15, MC 12%, BT 140 °C, and SS 300 rpm had the most acceptable performance according to the panelists.

3.2. Optimization

The numerical optimization produces desirable physical qualities with improved nutritional properties of the RTES. The optimum values for the responses were obtained using the Design Expert 11.1.0.1 software [27]. The values were set at 83:17 BR, 10.3% MC, 150 °C BT, and 307.1 rpm SS, with a desirability index of 0.737 on a scale of 0 to 1. (Figure 9).
The significance difference between the proximate and mineral composition of the RTES and raw materials was evaluated. The results of the proximate composition and mineral composition of the raw materials (broken rice and cowpea flour) and the optimized RTES are presented in Table 10 and Table 11. From the results presented in Table 11, it was revealed that sodium increased significantly (p < 0.05) for the optimized snack, mainly due to the introduction of salt (NaCl), while the iron, phosphorus, manganese, and copper of the optimized RTES were decreased. This may be due to the variety of materials used, the MC, and the BT range. Table 12 shows the regression values of all the process parameters with WAI having the highest value of 0.706.

4. Conclusions

The physicochemical qualities of twin-screw extruded cereal-based snacks were affected by the extrusion parameters studied (BR, BT, MC, and SS). The results obtained suggested that SS and MC affect SME. BR, SS, and MC affect HD, while WSI is affected by BR, MC, BT, and SS; only BR and BT influence ER and only MC influences OA. The optimal conditions were BR (83:17), MC (10.3%), BT (150 °C), and SS (307.1 rpm) with a combined desirability of 0.737 on a scale of 0–1. The addition of cowpea into the broken rice mix for the development of RTES improved the dietary fiber and overall acceptability, with a value of 6.73 on a 9-point hedonic scale. The MC was observed to have the highest impact on the response parameters and should be kept between the range of 10.3 and 12%. Further investigation should be conducted into the quality of the developed RTES, and shelf-life studies should be conducted.

Author Contributions

Conceptualization, A.A.O. and E.P.D.; methodology, A.A.O., E.P.D., O.I.M., and C.E.O.; software, E.P.D.; validation, T.A.A. and M.K.; formal analysis, E.P.D. and M.K.; investigation, E.P.D.; resources, M.K. and M.S.; data curation, E.P.D.; writing—original draft preparation, E.P.D. and M.K.; writing—review and editing, M.K., M.S., C.E.O., A.A.O. and O.I.M.; visualization, C.O.A. and T.A.A.; supervision, A.A.O., O.I.M., T.A.A. and C.E.O. All authors have read and agreed to the published version of the manuscript.

Funding

This research received no external funding.

Data Availability Statement

The datasets generated during and/or analyzed during the current study are available from the corresponding author upon reasonable request.

Conflicts of Interest

The authors declare that they have no known competing financial interests or personal relationships that could have appeared to influence the work reported in this paper.

References

  1. Pasqualone, A.; Costantini, M.; Teodora, E.C.; Carmine, S. Use of Legumes in Extrusion Cooking: A Review. Foods 2020, 9, 958. [Google Scholar] [CrossRef]
  2. Nicklas, T.A.; Yang, S.J.; Baranowski, T.; Zakeri, I.; Berenson, G. Eating patterns and obesity in children: The Bogalusa Heart Study. Am. J. Prev. Med. 2003, 25, 9–16. [Google Scholar] [CrossRef] [PubMed]
  3. Patil, S.S.; Brennan, C.S.; Mason, S.L.; Brennan, C.S. The effects of fortification of legumes and extrusion onthe protein digestibility of wheat based snack. Foods 2016, 5, 26. [Google Scholar] [CrossRef] [PubMed] [Green Version]
  4. Hegazy, H.S.; El-Bedawey, A.E.A.; Rahma, E.H.; Gaafar, A.M. Effect of extrusion process on nutritional, functional properties and antioxidant activity of germinated chickpea incorporated corn extrudates. Am. J. Food Sci. Nutr. Res. 2017, 4, 59–66. [Google Scholar]
  5. Gilani, G.S.; Xiao, C.W.; Cockell, K.A. Impact of antinutritional factors in food proteins on the digestibilityof protein and the bioavailability of amino acids and on protein quality. Br. J. Nutr. 2012, 108, S315–S332. [Google Scholar] [CrossRef] [Green Version]
  6. Urbano, G.; López-Jurado, M.; Aranda, P.; Vidal-Valverde, C.; Tenorio, E.; Porres, J. The role of phytic acid inlegumes: Antinutrient or beneficial function? J. Physiol. Biochem. 2000, 56, 283–294. [Google Scholar] [CrossRef]
  7. Doblado, R.; Frias, J.; Vidal-Valverde, C. Changes in vitamin C content and antioxidant capacity of raw and germinated cowpea (Vignasinensis var. carilla) seeds induced by high pressure treatment. Food Chem. 2007, 101, 918–923. [Google Scholar] [CrossRef]
  8. Danbaba, N.; Nkama, I.; Badau, M.H. Application of Response Surface Methodology (RSM) and Central Composite Design (CCD) to Optimize Minerals Composition of Rice Cowpea composite blends during Extrusion Cooking. Int. J. Food Sci. Nutr. Eng. 2015, 5, 40–52. [Google Scholar]
  9. Jakkanwar, S.A.; Rathod, R.P.; Annapure, U.S. Development of cowpea-based (Vigna unguiculata) extruded snacks with improved in vitro protein digestibility. Int. Food Res. J. 2018, 25, 804–813. [Google Scholar]
  10. Wikipedia Contributors. Rice. Wikipedia. Wikimedia Foundation. Available online: https://en.wikipedia.org/wiki/Rice (accessed on 5 June 2023).
  11. Kubala, J. What Is the Healthiest Type of Rice? Available online: https://www.healthline.com/nutrition/healthiest-rice (accessed on 5 June 2023).
  12. Okunola, A.A.; Adekanye, T.A.; Adewumi, A.D.; Ashamu, F.F. Assessment of rice processing operations in Ekiti State, Nigeria. Int. J. Civ. Eng. Technol. 2019, 10, 2197–2204. [Google Scholar]
  13. Grasso, S. Extruded snacks from industrial by-products: A review. Trends Food Sci. Technol. 2020, 99, 284–294. [Google Scholar] [CrossRef]
  14. Dar, A.H.; Sharma, H.K.; Kumar, N. Effect of frying time and temperature on the functional properties of carrot pomace, pulse powder and rice flour based extrudates. Int. J. Food Eng. 2014, 10, 139–147. [Google Scholar] [CrossRef]
  15. Hussain, S.Z.; Singh, B. Physical properties of refabricated rice as affected by extrusion: A response surface analysis. Cereal Foods World 2015, 60, 171–176. [Google Scholar] [CrossRef]
  16. Okunola, A.A.; Isaac-Bamgboye, A.; Olayanju, T.M.A.; Osueke, C.O.; Alahassan, E.A. Development of a rice cleaner cum grader for cottage processors in Nigeria. Int. J. Mech. Eng. Technol. 2018, 9, 2339–2351. [Google Scholar]
  17. Tosh, S.M.; Yada, S. Dietary fibres in pulse seeds and fractions: Characterization, functional attributes and applications. Food Res. Int. 2010, 43, 450–460. [Google Scholar] [CrossRef]
  18. Singh, B.; Rachna Hussain, S.Z.; Sharma, S. Response Surface Analysis and Process Optimization of Twin-Screw Extrusion Cooking of Potato-Based Snacks. J. Food Process. Preserv. 2014, 39, 270–281. [Google Scholar] [CrossRef]
  19. Elina, M.; Cornelio, N.N.; Henry, L.; Theobald, C.E.M. Sensory evaluation of extruded quality protein maize-based supplementary foods. Afr. J. Food Sci. 2016, 10, 105–111. [Google Scholar] [CrossRef] [Green Version]
  20. Olaniran, A.F.; Okonkwo, C.E.; Osemwegie, O.O.; Iranloye, Y.M.; Afolabi, Y.T.; Alejolowo, O.O.; Nwonuma, C.O.; Badejo, T.E. Production of a complementary food: Influence of cowpea soaking time on the nutritional, antinutritional, and antioxidant properties of the cassava-cowpea-orange-fleshed potato blends. Int. J. Food Sci. 2020, 2020, 8873341. [Google Scholar] [CrossRef] [PubMed]
  21. AOAC. Association of Official Analytical Chemist Official Methods of Analysis, 18th ed.; Current through Revision 2, 2007 (Online); AOAC International: Gaithersburg, MD, USA, 2005. [Google Scholar]
  22. Hussain, S.Z.; Ali, F.; Jabeen, R.; Zargar, I. Twin screw extrusion cooking of lotus rhizome and broken rice flour blends: A response surface analysis. J. Sci. Ind. Res. 2017, 76, 485–493. [Google Scholar]
  23. Reshi, M.; Shafiq, F.; Hussain, S.Z.; Naseer, B.; Amin, T. Physicochemical properties of iron-fortified, low glycemic index (GI) barley based extruded ready-to-eat snacks developed using twin-screw extruder. J. Food Process. Preserv. 2020, 44, e14606. [Google Scholar] [CrossRef]
  24. Rathod, R.P.; Annapure, U.S. Effect of extrusion process on ant nutritional factors and protein and starch digestibility of lentil splits. LWT-Food Sci. Technol. 2015, 66, 114–123. [Google Scholar] [CrossRef]
  25. Thakur, R.R.; Shahi, N.C.; Mangaraj, S.; Lohani, U.C.; Chand, K. Development of an organic coating powder and optimization of process parameters for shelf life enhancement of button mushrooms (Agaricus bisporus). J. Food Process. Preserv. 2011, 45, e15306. [Google Scholar] [CrossRef]
  26. Okunola, A.A.; Okunola, C.O.; Ofuya, T. Acceptability and sensory evaluation of maize and cowpea products stored with some essential oils. Int. J. Agric. Res. Food Prod. 2019, 4, 30–35. [Google Scholar]
  27. Stat-Ease Inc. Design Expert 11.1.0.1 Software, Stat-Ease Design Expert 11.1.0.1 Latest Scene and P2P Download; Stat-Ease, Inc.: Minneapolis, MN, USA, 2018. [Google Scholar]
  28. Seth, D.; Rajamannickam, G. Development of extruded snacks using soy, sorghum, millet and rice blend—A response surface methodology approach. Int. J. Food Sci. 2012, 47, 1526–1531. [Google Scholar] [CrossRef]
  29. Wani, S.A.; Kumar, P. Development and parameter optimization of health promising extrudate based on fenugreek oat and pea. Food Biosci. 2016, 14, 34–40. [Google Scholar] [CrossRef]
  30. IBM. SPSS, 21.0 Version Statistical Software; IBM Corporation: Armonk, NY, USA, 2012. [Google Scholar]
  31. Yu, L. Extrusion Processing of Protein Rich Food Formulations; Department of Food Science and Agricultural Chemistry McGill University: Montreal, QC, Canada, 2011; pp. 1–209. [Google Scholar]
  32. Dogan, H.; Gueven, A.; Hicsasmaz, Z. Extrusion cooking of lentil flour (Lens culinaris–Red)–corn starch–corn oil mixtures. Int. J. Food Prop. 2013, 16, 341–358. [Google Scholar] [CrossRef] [Green Version]
  33. Zhang, J.; Liu, L.; Zhu, S.; Wang, Q. Texturization behaviour of peanut–soy bean/wheat protein mixtures during high moisture extrusion cooking. Int. J. Food Sci. Technol. 2018, 53, 2535–2541. [Google Scholar] [CrossRef]
  34. Matysiak, A.; Wójtowicz, A.; Oniszczuk, T. Process Efficiency and Energy Consumption During the Extrusion of Potato and Multigrain Formulations. Agric. Eng. 2018, 22, 49–57. [Google Scholar] [CrossRef] [Green Version]
  35. Meng, X.; Threinen, D.; Hansen, M.; Driedger, D. Effects of extrusion conditions on system parameters and physical properties of a chickpea flour-based snack. Food Res. Int. 2010, 43, 650–658. [Google Scholar] [CrossRef]
  36. Kongolo, J.I.; Da Silva, L.S.; Wokadala, O.C.; Du Plessis, B.; Husselman, J.; Ngcobo, M.E.; Emmambux, N.M.; Daneel, M. Pasting, thermal, gel texture, resistant starch and colour properties of unripe banana flour from 10 desert banana varieties cultivated in South Africa. J. Food Meas. Charact. 2017, 11, 1056–1064. [Google Scholar] [CrossRef]
  37. Pandey, S.; Kumar, A.; Rao, P.S. Optimization, modeling, and characterization study for the physicochemical properties of raw banana and defatted soy composite extrudates. Food Chem. 2021, 339, 127865. [Google Scholar] [CrossRef] [PubMed]
  38. Yousf, N.; Nazir, F.; Salim, R.; Ahsan, H.; Sirwal, A. Water solubility index and water absorption index of extruded product from rice and carrot blend. J. Pharmacogn. Phytochem. 2017, 6, 2165–2168. [Google Scholar]
  39. Sibel, Y.; Fahrettin, G. Response surface methodology for evaluation of physical and functional properties of extruded snack foods developed from food-by-products. J. Food Eng. 2008, 86, 122–132. [Google Scholar]
  40. Cuj-Laines, R.; Hernández-Santos, B.; Reyes-Jaquez, D.; Delgado-Licon, E.; Juárez-Barrientos, J.M.; Rodríguez-Miranda, J. Physicochemical properties of ready-to-eat extruded nixtamalized maize-based snacks enriched with grasshopper. Int. J. Food Sci. Technol. 2018, 53, 1889–1895. [Google Scholar] [CrossRef]
  41. Nagaraju, M.; Tiwari, V.K.; Sharma, A. Effect of extrusion on physical and functional properties of millet based extrudates: A review. J. Pharmacogn. Phytochem. 2021, 9, 1850–1854. [Google Scholar]
  42. Altaf, U.; Hussain, S.Z.; Qadri, T.; Iftikhar, F.; Naseer, B.; Rather, A.H. Investigation on mild extrusion cooking for development of snacks using rice and chickpea flour blends. J. Food Sci. Technol. 2020, 58, 1143–1155. [Google Scholar] [CrossRef]
  43. Hagenimana, A.; Ding, X.; Fang, T. Evaluation of rice flour modified by extrusion cooking. J. Cereal Sci. 2006, 43, 38–46. [Google Scholar] [CrossRef]
  44. Köksel, H.; Ryu, G.-H.; Basman, A.; Demiralp, H.; Ng, P.K.W. Effects of extrusion variables on the properties of waxy hulless barley extrudates. Food/Nahrung 2004, 48, 19–24. [Google Scholar] [CrossRef]
  45. de Mesa, N.J.E.; Alavi, S.; Singh, N.; Shi, Y.-C.; Dogan, H.; Sang, Y. Soy protein-fortified expanded extrudates: Baseline study using normal corn starch. J. Food Eng. 2009, 90, 262–270. [Google Scholar] [CrossRef]
  46. Robin, F.; Theoduloz, C.; Gianfrancesco, A.; Pineau, N.; Schuchmann, H.P.; Palzer, S. Starch transformation in bran-enriched extruded wheat flour. Carbohydr. Polym. 2011, 85, 65–74. [Google Scholar] [CrossRef]
  47. Kaur, A.; Kaur, S.; Singh, M.; Singh, N.; Shevkani, K.; Singh, B. Effect of banana flour, screw speed and temperature on extrusion behaviour of corn extrudates. J. Food Sci. Technol. 2014, 52, 4276–4285. [Google Scholar] [CrossRef] [PubMed]
Figure 1. 3D response surface plot of specific mechanical energy (SME) against (a) blend ratio versus moisture content, (b) blend ratio and barrel temperature, (c) blend ratio versus screw speed.
Processes 11 02159 g001
Figure 2. 3D response surface plot of water absorption index as against (a) blend ratio versus moisture content, (b) blend ratio versus barrel temperature, (c) blend ratio versus screw speed.
Processes 11 02159 g002
Figure 3. 3D response surface plot of water solubility index against (a) blend ratio versus moisture content, (b) blend ratio versus barrel temperature, (c) blend ratio versus screw speed.
Processes 11 02159 g003
Figure 4. 3D response surface plot of total colour against (a) moisture content versus barrel temperature, (b) moisture content versus screw speed, (c) barrel temperature versus screw speed.
Processes 11 02159 g004
Figure 5. 3D response surface plot of hardness against (a) blend ratio versus moisture content, (b) blend ratio versus barrel temperature, (c) blend ratio versus screw speed.
Processes 11 02159 g005aProcesses 11 02159 g005b
Figure 6. 3D response surface plot of bulk density against (a) blend ratio versus moisture content, (b) blend ratio versus barrel temperature, (c) blend ratio versus screw speed.
Processes 11 02159 g006
Figure 7. 3D response surface plot of expansion ratio against (a) blend ratio versus moisture content, (b) blend ratio versus barrel temperature, (c) blend ratio versus screw speed.
Processes 11 02159 g007aProcesses 11 02159 g007b
Figure 8. 3D response surface plot of overall acceptance against (a) blend ratio versus moisture content, (b) blend ratio versus barrel temperature, (c) blend ratio versus screw speed.
Processes 11 02159 g008
Figure 9. Proximate and minerals of the raw materials and optimized snack.
Processes 11 02159 g009
Table 1. Numerical optimization variables.
NameGoalLower LimitUpper LimitLower WeightUpper WeightImportance
BRin range70:3090:10113
MCin range10.0018.00113
BTin range110.00150.00113
SSin range280.00360.00113
SMEMinimize47.10102.27113
BDMinimize251.30593.30113
ERMaximize2.263.06113
HDMinimize1.993.46113
WAIin range3.054.35113
WSIin range2.8020.00113
TCin range36.8545.89113
OAMaximize5.208.10113
Abbreviations: BR = blend ratio (% of gram), MC = moisture content (% wet basis), BT = barrel temperature (°C), SS = screw speed (rpm), SME = specific mechanical energy ( W h k g ), BD = bulk density ( k g m 3 ), ER = expansion ratio (mm), HD = hardness, WAI = water absorption index (g/g), WSI = water solubility index (%), TC = total color (∆E), and OA = overall acceptance.
Table 2. Experimental data of ready-to-eat snacks for response surface analysis.
RunBR
(%)
MC
(%)
BT
(°C)
SS
(rpm)
SME
(Wh/kg)
WAI
(g/g)
WSI
(%)
TCHD
(N)
BD
(Kg/m³)
ER
(mm)
OA
180:201013032092.163.638.440.481.99266.82.937.55
275:251614034084.864.066.841.583.02354.32.475.3
380:201413028066.33.711040.622.14396.92.586.7
485:151612034084.864.037.640.023.23541.42.495.2
580:201413036082.944.334.841.162.89309.82.486.25
685:151614034073.984.264.441.383.46413.32.696.45
780:201413032077.823.973.640.22.31498.42.386.9
885:151614030065.284.352.839.12.14443.22.566.9
980:201413032075.783.783.640.712.31489.32.436.65
1075:251614030074.883.342.845.722.86481.52.275.85
1185:151212030084.483.387.644.53.08441.42.545.65
1275:251612030065.283.391037.852.05508.42.417.45
1380:201413032077.824.175.239.772.32521.52.387.05
1475:251212030080.643.331045.892.55506.52.477.35
1580:201813032055.34.054.437.422.965412.615.45
1685:151214034084.863.0516.840.432.82434.62.566.3
1775:251212034087.043.589.639.082.76536.12.46.1
1870:301413032077.823.212039.393.03593.32.266.9
1980:201413032077.823.6414.442.122.134812.427.4
2075:251214030065.283.7610.436.852.94513.22.397.15
2180:201413032077.824.296.440.622.45489.22.427.7
2280:201415032065.284.07642.732.23416.92.327.5
2385:151214030084.483.951244.522.98361.32.788.1
2490:101413032088.063.61839.962.73437.32.867.5
2580:201411032047.13.311.644.542.6251.33.067.45
2685:151612030071.043.615.2392.54554.22.685.75
2780:201413032077.824.146.837.642.17487.72.286.9
2875:251612034076.163.756.841.562.9581.52.315.8
2985:151212034097.923.377.640.13.01449.82.467.6
3075:2512140340102.274.198.444.32.29386.32.477.05
Table 3. ANOVA for response surface models for specific mechanical energy of extruded RTE snack.
Specific Mechanical Energy (Linear)
SourceSSDfMSF-Valuep-Value
Model1937.824484.466.010.0016significant
A-BR39.96139.960.49570.4879
B-MC1125.4611125.4613.960.0010
C-BT25.69125.690.31860.5775
D-SS746.721746.729.260.0054
Residual2015.542580.62
Lack of Fit159.56246.653.060.1081not significant
Pure Error3.4750.6936
Cor Total 3953.3729
Abbreviations: BR = blend ratio (% of gram), MC = moisture content (% dry basis), BT = barrel temperature (°C), SS = screw speed (rpm).
Table 4. ANOVA for response surface models for water absorption index of extruded RTE snack.
Water Absorption Index (Quadratic)
SourceSSDfMSF-Valuep-Value
Model3.22140.22974.180.0047significant
A-BR0.081710.08171.480.2418
B-MC0.380010.38006.910.0190
C-BT0.686810.686812.490.0030
D-SS0.244010.24404.4400.0524
AB0.497010.49709.040.0089
AC0.000410.00040.00730.9332
AD0.342210.34226.220.0248
BC0.000210.00020.00410.9498
BD0.168110.16813.060.1009
CD0.046210.04620.84050.3738
A20.629210.629211.440.0041
B20.053010.05300.96370.3418
C20.187610.18763.140.0846
D20.00010.0000.00050.9817
Residual0.8250150.0550
Lack of Fit0.5135100.05140.82430.6296not significant
Pure Error0.311550.0623
Cor Total4.0429
Abbreviations: BR = blend ratio (% of gram), MC = moisture content (% dry basis), BT = barrel temperature (°C), SS = screw speed (rpm), AB = BR × MC, AC = BR × BT, AD = BR × SS, BC = MC × BT, BD = MC × SS, CD = BT × SS.
Table 5. ANOVA for response surface models for water solubility index of extruded RTE snack.
Water Solubility Index (Linear)
SourceSSDfMSF-Valuep-Value
Model111.95427.991.970.01308significant
A-BR25.63125.631.800.1918
B-MC80.67180.675.670.0252
C-BT5.2315.230.36710.5500
D-SS0.426710.42670.03000.864
Residual355.922514.24
Lack of Fit275.072013.750.85050.6444not significant
Pure Error80.85516.17
Cor Total467.87
Abbreviations: BR = blend ratio (% of gram), MC = moisture content (% wet basis), BT = barrel temperature (°C), SS = screw speed (rpm).
Table 6. ANOVA for response surface models for hardness of extruded RTE snack.
Hardness (Quadratic)
SourceSSDFMFF-Valuep-Value
Model3.09140.22062.480.0459significant
A-BR0.070510.07050.79330.3872
B-MC0.119410.11941.340.2646
C-BT0.002310.00230.02540.8754
D-SS0.617910.61796.950.0187
AB0.042110.04210.4730.507
AC0.108410.1081.2200.2869
AD0.091710.0911.0300.326
BC0.079910.0790.8990.358
BD0.847810.8479.5400.007
CD0.063610.0630.7150.410
A20.860810.8609.6800.007
B20.158010.1581.7800.202
C20.122310.1221.3810.259
D20.207810.2072.340.147
Residual1.33150.0889
Lack of Fit1.54100.15432.710.1416not significant
Pure Error0.038450.0077
Cor Total4.4229
Abbreviations: BR = blend ratio (% of gram), MC = moisture content (% wet basis), BT = barrel temperature (°C), SS = screw speed (rpm).
Table 7. ANOVA for response surface models for bulk density of extruded RTE snack.
Bulk density (Linear)
SourceSSDfMSF-Valuep-Value
Model48746.54412186.641.830.15584not significant
A-BR12177.02112177.021.820.1889
B-MC26467.04126467.043.960.0575
C-BT6680.0116680.011.000.3267
D-SS3422.4813422.480.51270.4806
Residual1.669 × 105256675.52
Lack of Fit1.659 × 105208293.0140.340.0003significant
Pure Error1027.835205.57
Cor Total2.156 × 10529
Abbreviations: BR = blend ratio (% of gram), MC = moisture content (% wet basis), BT = barrel temperature (°C), SS = screw speed (rpm).
Table 8. ANOVA for response surface models for expansion ratio of extruded RTES.
Expansion Ratio (Linear)
SourceSSDfMSF-Valuep-Value
Model0.508840.12725.320.0031significant
A-BR0.319710.319713.360.0012
B-MC0.028710.02871.200.2838
C-BT0.152010.15206.350.0185
D-SS0.008410.00840.35270.5579
Residual0.5980250.0239
Lack of Fit26.01201.301.550.3314not significant
Pure Error0.015650.0031
Cor Total2.156 × 10529
Abbreviations: BR = blend ratio (% of gram), MC = moisture content (% wet basis), BT = barrel temperature (°C), SS = screw speed (rpm).
Table 9. ANOVA for response surface models for overall acceptance of extruded RTES.
Overall Acceptance (Linear)
SourceSSDfMSF-Valuep-Value
Model6.3041.583.230.0287significant
A-BR0.050410.05040.10340.7504
B-MC4.8614.869.970.0041
C-BT0.220410.22040.45220.5075
D-SS1.1711.172.400.1338
Residual12.19250.4875
Lack of Fit11.45200.57263.900.0687not significant
Pure Error0.735050.1470
Cor Total18.4929
Abbreviations: BR = blend ratio (% of gram), MC = moisture content (% wet basis), BT = barrel temperature (°C), SS = screw speed (rpm).
Table 10. Proximate composition of optimized snack and the raw materials.
SamplesMC (%)CP (%)TA (%)CF (%)CFAT (%)CHO (%)
Rice flour10.1 ± 0.02 c13.11 ± 0.01 b4.68 ± 0.01 c2.96 ± 0.06 b8.56 ± 0.01 c60.54 ± 0.10 b
Cowpea flour7.98 ± 0.01 b24.48 ± 0.03 c4.01 ± 0.01 b2.49 ± 0.01 a7.94 ± 0.03 b53.11 ± 0.05 a
Optimized extrudate5.99 ± 0.04 a6.73 ± 0.01 a0.96 ± 0.02 a3.04 ± 0.02 b2.60 ± 0.04 a80.70 ± 0.01 c
MC = moisture content, CP = crude protein, TA = total ash, CF = crude fiber, CFAT = crude fat, CHO = carbohydrate. Values are given as mean ± standard deviation. Values with different superscripts are significantly different at (p < 0.05).
Table 11. Mineral composition of optimized snack and the raw materials before extrusion.
SamplesFe (mg/100kg)P
(mg/100kg)
Mn (mg/100kg)Cu (mg/100kg)Na
(mg/100kg)
Rice flour0.46 ± 0.012 b110.89 ± 0.19 c0.07 ± 0.00 b0.078 ± 0.00 a0.02 ± 0.00 a
Cowpea flour0.53 ± 0.042 c106.57 ± 1.27 b0.06 ± 0.00 b0.8 ± 0.00 b0.02 ± 0.00 a
Optimized extrudate0.41 ± 0.07 a16.21 ± 0.03 a0.02 ± 0.00 a0.06 ± 0.01 a23.44 ± 0.04 b
Fe = iron, P = phosphorus, Mn = manganese, Cu = copper, Na = sodium. Values are given as mean ± standard deviation. Values with different superscripts are significantly different at (p < 0.05).
Table 12. Regression table.
RegressionSMEWAIWSITCHDBDEROA
SD8.902.23453.772.420.298281.700.15470.6982
R20.49020.79580.23930.42160.69840.22610.24970.3408
Mean77.443.788.0740.972.64456.252.516.73
Adj. R20.40860.60530.11760.00000.41690.10220.37330.2354
C.V %11.596.2146.775.9211.3117.916.1610.37
Pred. R20.20380.1570−0.0912−0.0702−0.6999−0.18690.20580.0115
PRESS3147.573.41510.53182.377.522.556 × 1050.879118.28
Adeq.prec.8.04827.27654.7607NA5.11225.05817.86596.3150
Abbreviations: SME = specific mechanical energy ( W h k g ), BD = bulk density ( k g m 3 ), ER = expansion ratio (mm), HD = hardness, WAI = water absorption index (g/g), WSI = water solubility index (%), TC = total color (∆E) and OA = overall acceptance.
Disclaimer/Publisher’s Note: The statements, opinions and data contained in all publications are solely those of the individual author(s) and contributor(s) and not of MDPI and/or the editor(s). MDPI and/or the editor(s) disclaim responsibility for any injury to people or property resulting from any ideas, methods, instructions or products referred to in the content.

