Article

Vibration Scale Model of a Converter Transformer Based on the Finite Element and Similarity Principle and Its Preparation

1
School of Electrical Engineering, Shandong University, Jinan 250061, China
2
Shandong Electric Power Equipment Co., Ltd., Jinan 250061, China
*
Author to whom correspondence should be addressed.
Processes 2023, 11(7), 1969; https://doi.org/10.3390/pr11071969
Submission received: 12 June 2023 / Revised: 26 June 2023 / Accepted: 27 June 2023 / Published: 29 June 2023
(This article belongs to the Topic Advances in Power Science and Technology)

Abstract

:
A similarity criterion suitable for studying the vibration characteristics of converter transformers is proposed based on comprehensive consideration of geometric dimensions, electric field, magnetic field, force field, sound field, and coupling field interface interactions. By comparing the magnetic field, stress, displacement, sound field distribution, and vibration characteristics of the scale model of the converter transformer with the initial model, the reliability of the similarity criterion was determined. Based on the vibration similarity criterion of the converter transformer, a prototype of the proportional model was designed and manufactured, and vibration signals under no-load and load conditions were tested. These signals correspond to the vibration signals of the iron core and winding in the finite element model, respectively. Through comparative analysis, the reliability of the prototype and the vibration similarity model of the converter transformer has been proven, which can provide an accurate and effective laboratory research platform for in-depth research on the vibration and noise of the converter transformer and equipment protection.

1. Introduction

In recent years, with the acceleration of human economic and social development, energy and environmental issues have become more severe, and the imbalance between electricity load and energy base has become increasingly serious. The rapid development of high-voltage direct current transmission technology has made great contributions to solving this problem [1,2,3,4,5,6,7]. Converter transformers, which withstand mixed AC and DC voltages during operation, are key equipment in DC transmission systems. The harmonic and DC components they bear during operation are also higher than ordinary power transformers, and the risks of core saturation and resonance effects are higher, resulting in more serious vibration and noise problems [8,9,10,11,12]. Researchers have been committed to studying the generation mechanism and vibration suppression of converter transformer vibration, but they are still troubled by its variable testing environment, numerous electric/magnetic field analyses, and complex vibration propagation processes. The mechanism of internal vibration generation and propagation in converter transformers still needs further research, and the effectiveness of vibration suppression is limited. The safety and reliability of converter stations need to be further improved [13,14,15,16].
The large volume and expensive price of converter transformers make it impractical to conduct in-depth and effective vibration research on them in laboratory environments. Establishing a large-scale experimental vibration platform for power equipment is an effective method to solve these problems. It can not only increase the feasibility of experimental mechanism research, but also reduce the computational time and burden of the experiment. However, the consistency between the operation and vibration characteristics of the equipment after proportional deceleration and the actual operating equipment is currently a challenging issue [17,18]. The similarity model method based on similarity theory can effectively solve the problems of economy and timeliness of the test, and can be used to verify new technologies, design, and manufacturing difficulties that have not been considered in the process of testing, and predict the performance indicators of the entire system [19,20]. From the above, it can be seen that, based on the principle of similarity, reducing the equipment volume proportionally is a feasible solution to solve the problem of difficulty in conducting internal vibration characteristics research on large-capacity converter transformers. However, currently, most proportional model designs for power devices consider only geometric dimensions and a small number of electrical parameters with similar derivation, and lack consideration of electromagnetic and mechanical parameters of vibration [21]. For the moment, there is no similarity theory proposed to study the vibration characteristics of converter transformers, nor any related research on designing and compiling scale models of converter transformers based on similarity methods. How to derive the similarity criteria for converter transformers comprehensively and reasonably and how to modify them in practical applications need to be discussed in detail.
The deep application of finite element technology provides a convenient and effective research platform for the analysis and research of large-scale power equipment involving complex internal structures and multi-physical field interface effects. Reference [22] analyzed the monopole ionization field in DC wires through full multi-grid measurements. Reference [23] constructed a generator power prediction model based on the finite element method and compared the results with neural network algorithms, proving the effectiveness of the model. Reference [24] established a two-dimensional physical model of the transformer and quantitatively analyzed the direction and magnitude of the force on the transformer winding under low load and overload. Reference [25] established a finite element model of a three-phase five-column converter transformer, applied different DC components to the model, studied the changes in magnetic flux and force of the converter transformer under different DC components, and quantified its loss characteristics.
From the above research, it can be seen that the application of finite element technology in the coupling field effect of transformers has become very mature. However, the finite element model of the converter transformer used in current research is too idealized in the modeling process, without refining and distinguishing between the core lamination structure and the winding form. This integrated core and winding structure can quickly obtain uniformly distributed magnetic field morphology and calculation results for vibration characteristics, meeting the operational requirements of composite ideal transformers. However, electromagnetic and vibration calculation results that require details and consider coupling boundary effects cannot be convincing [17,26,27]. Considering the significant differences in structure and nonlinear characteristics between the actual operation of the converter transformer and the ideal transformer, especially when calculating the internal structure coupling field interface interaction and nonlinear force loss under different external excitation conditions, using the ideal converter transformer model can cause unacceptable calculation errors [28,29]. Therefore, when using the finite element method for coupling calculation of the field interface of the converter transformer, the design cannot be blindly simplified [30].
Firstly, based on the similarity principle, the similarity criteria of the electromagnetic field and structural mechanics were derived. Secondly, based on the structure and operating parameters of a single-phase dual-winding current transformer in operation, the contribution of the oil tank structure, the lamination form of the iron core, the entanglement and winding form of the winding, and the force characteristics of the pad between the winding cakes were fully considered. Furthermore, in order to verify the reliability of the similarity criterion, a similarity model of the converter transformer was established based on the physical model of the converter transformer mentioned above. A comprehensive comparison was made between the electromagnetic field, mode of vibration, force, and displacement distribution characteristics of the scale model and the initial model of the converter transformer. Finally, a proportional prototype of a converter transformer with a similarity coefficient of 1:5 was designed and prepared based on the similarity criterion. The basic experimental items and vibration characteristics were analyzed, further verifying the reliability and engineering practicality of the similarity criterion.

2. Similarity Principle

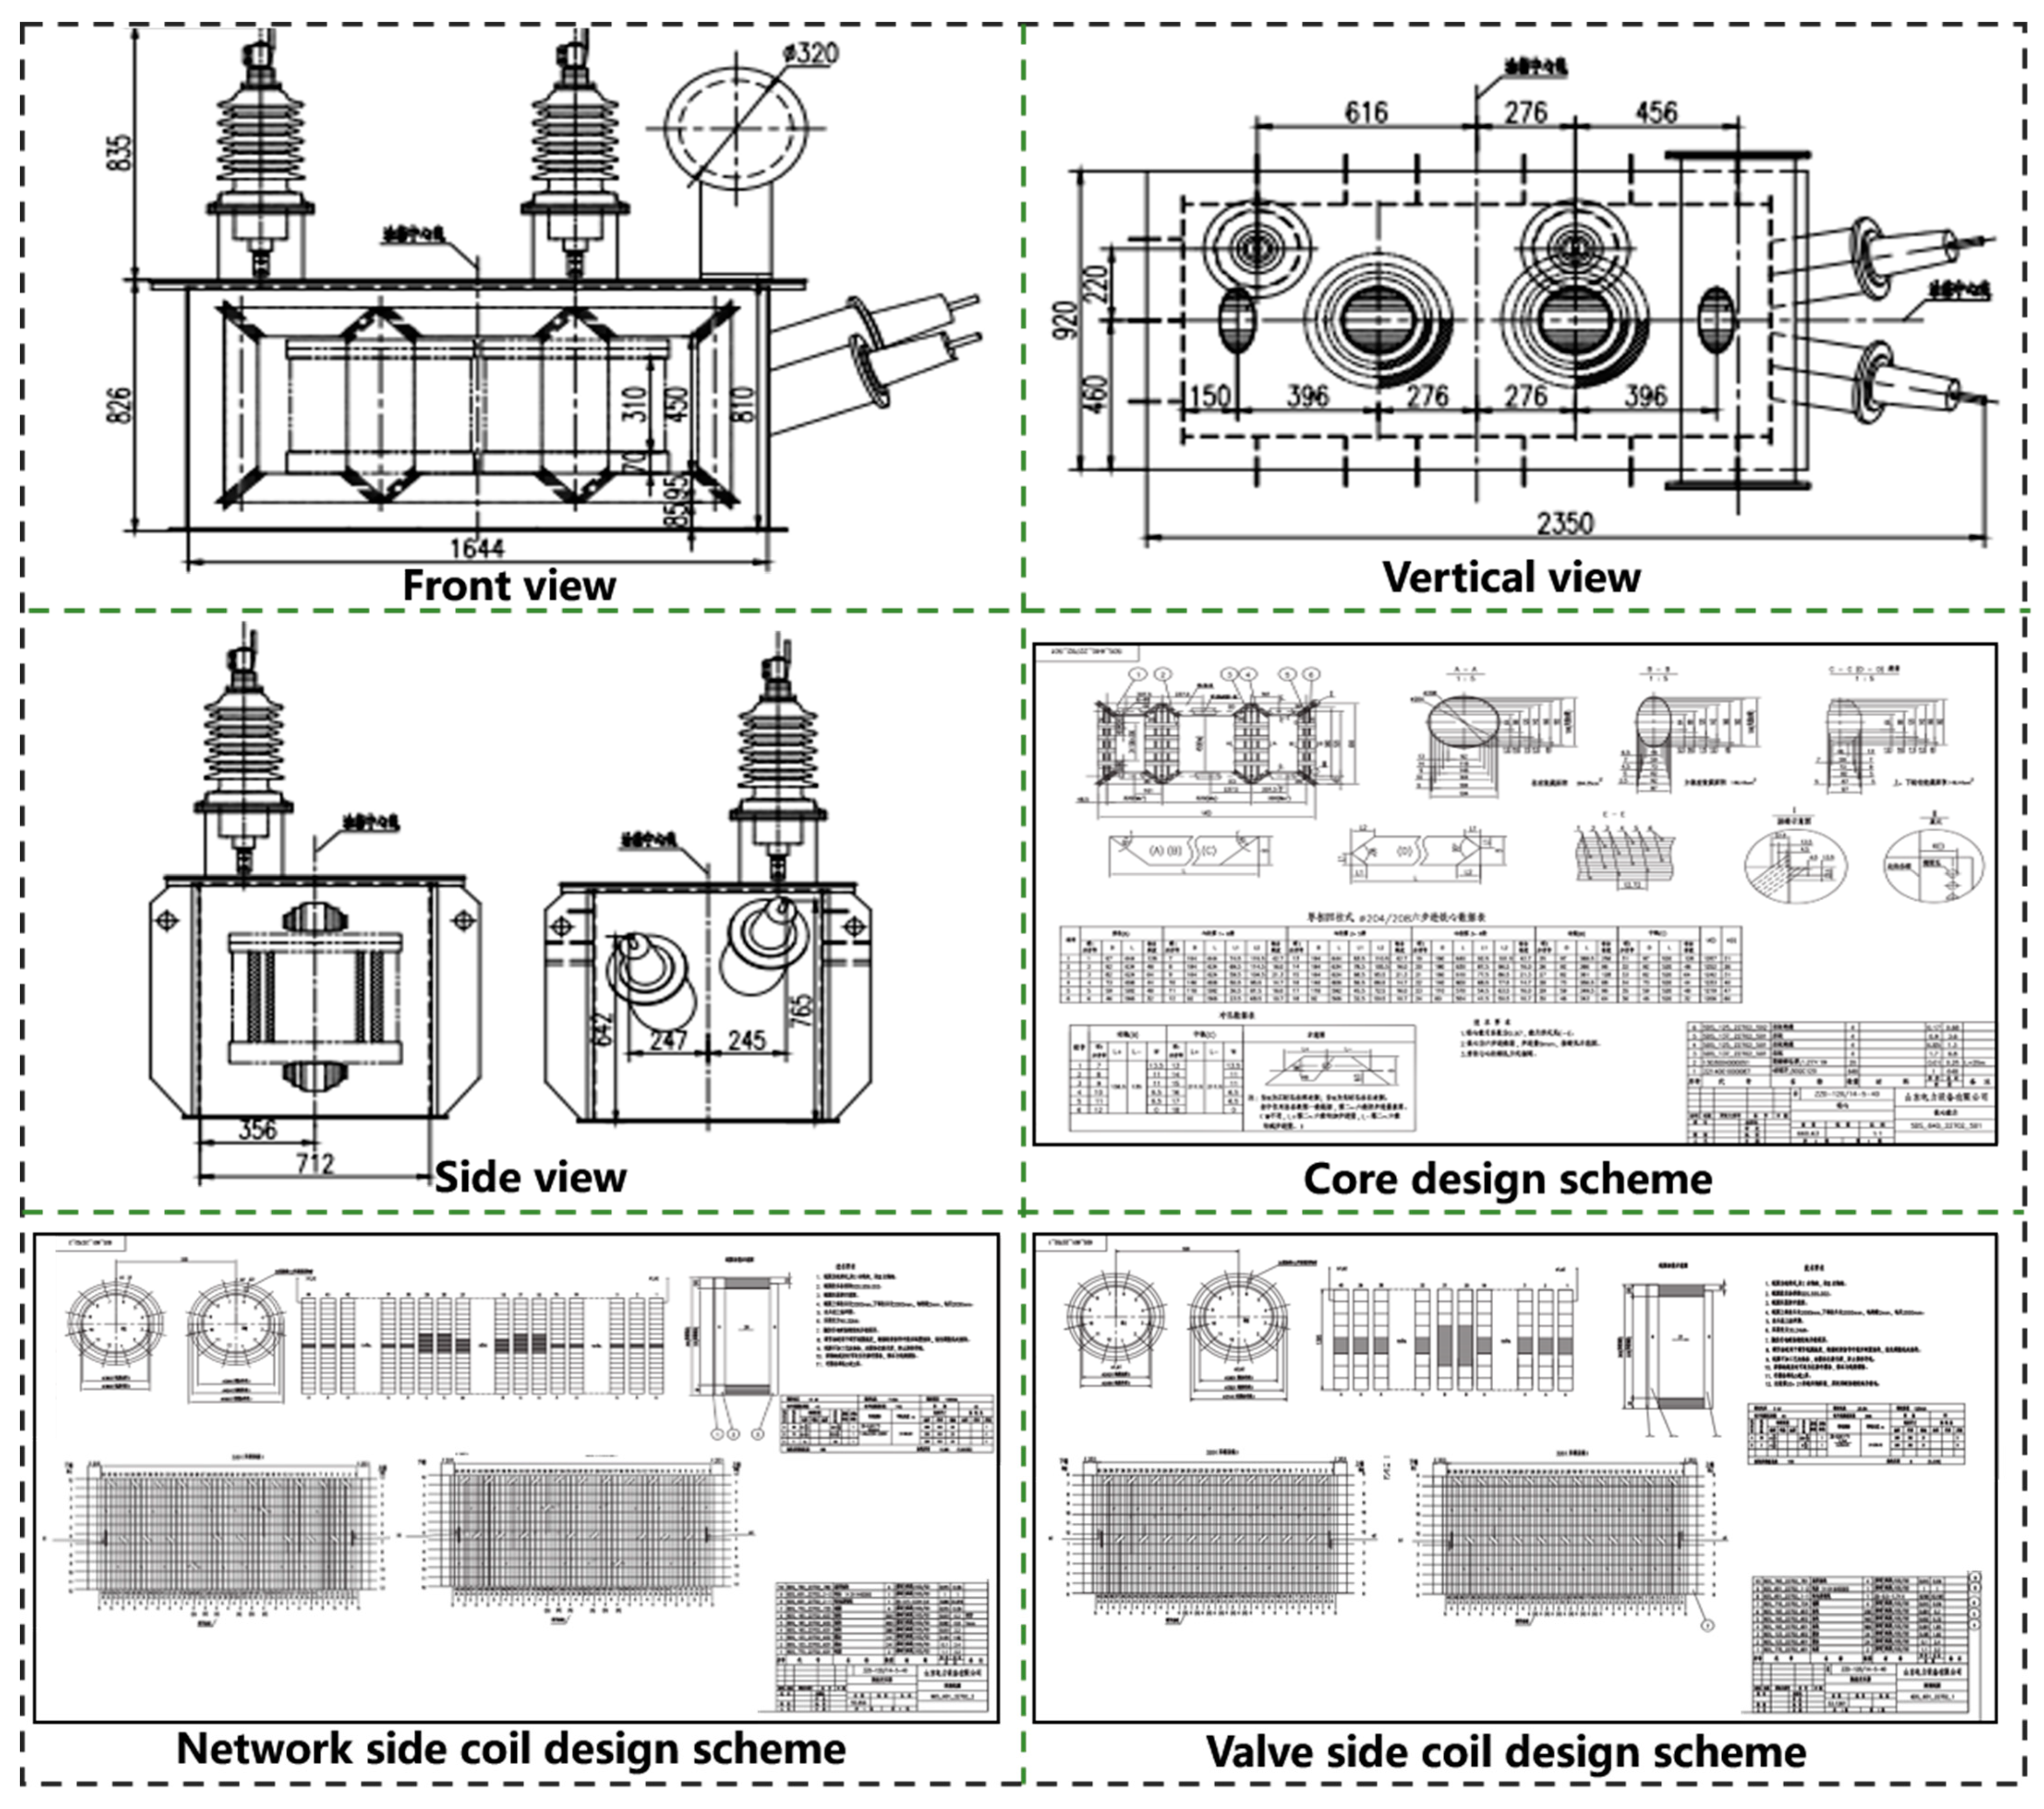
2.1. Geometric Similarity

Based on the principle of similarity, the full size of the converter transformer should be proportionally reduced, that is, the overall geometric length l of length, width, height, and radius should be changed to l′ = kl. So, the corresponding overall geometric area S becomes S′ = k2S, and the overall volume V becomes V′ = k3V.

2.2. Similarity of Structural Mechanics

The quality and volume of the model have a significant impact on the overall modal distribution of the model, which can easily alter the original resonance effect of the model, thereby affecting the final vibration distribution characteristics of the model. Therefore, it is necessary to discuss the structural parameters such as the natural frequency of the model. For mass M, due to the material density of scale models ρ, the model volume remains unchanged and decreases to three times the original k3, so M′ becomes:
M = k 3 M
For the stiffness coefficient K, it shall meet the following requirements before and after similarity:
K = k K
So. the natural frequency ω0′ of scale models becomes:
ω 0 = k K k 3 M = 1 k K M

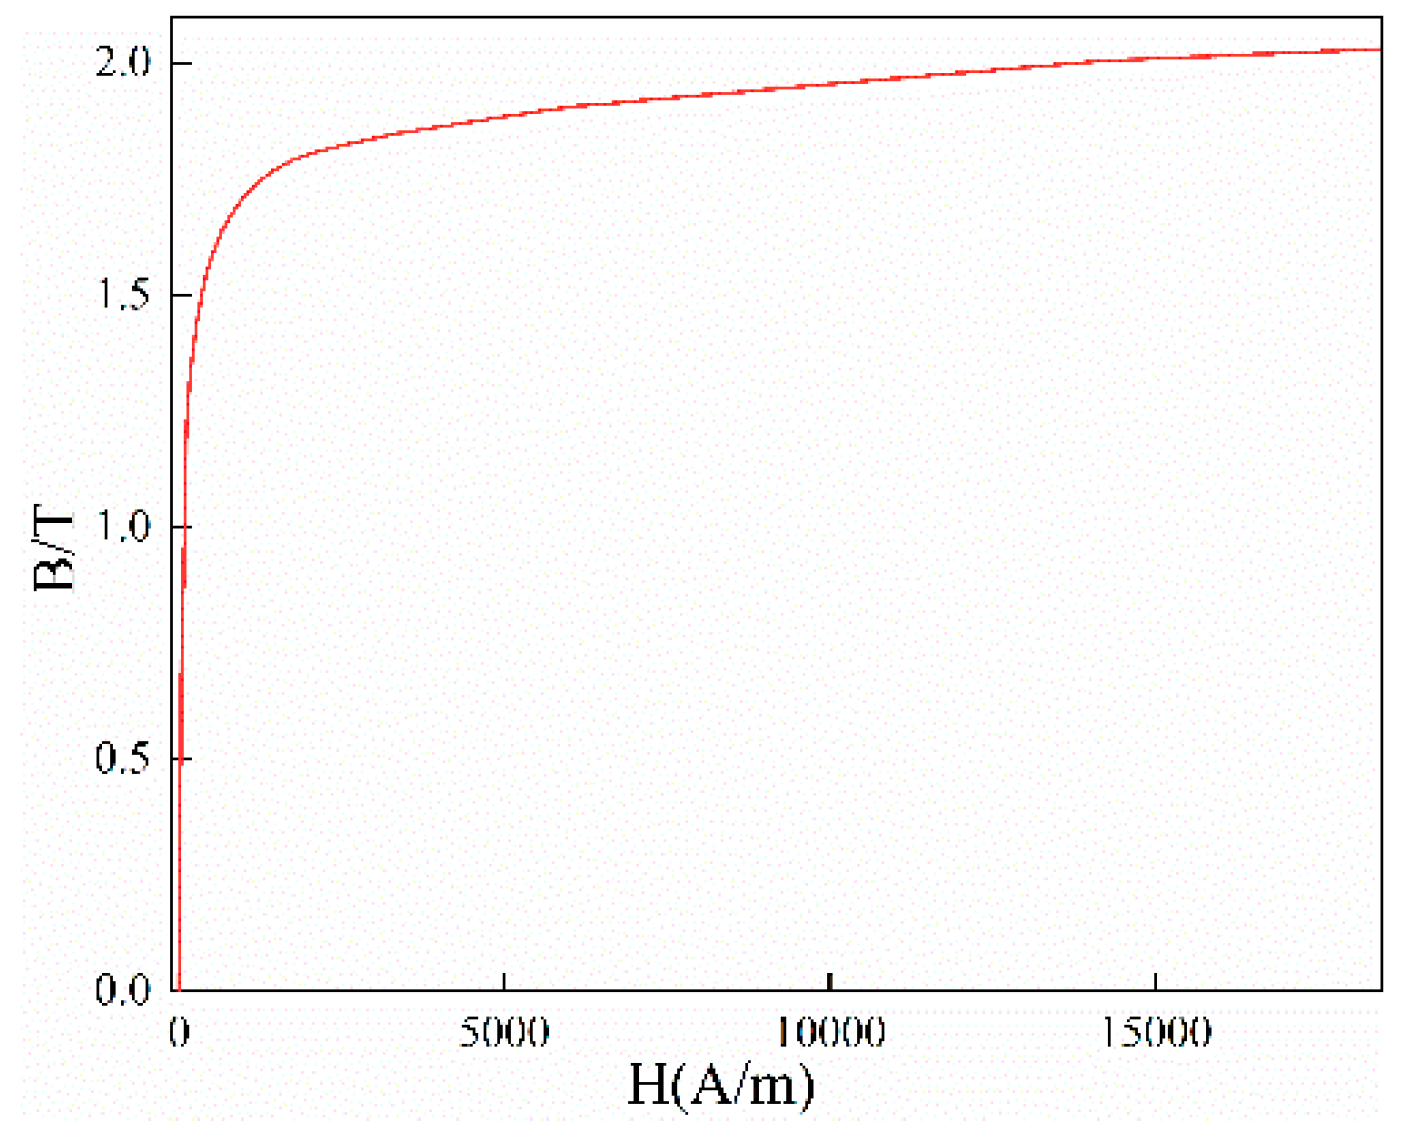
2.3. Similarity of Electromagnetic Field

Supposing that the current density J′ of the scale model of the converter transformer is equal to the current density J of the initial model, to ensure the controllability of excitation and the controllability of reducing winding losses:
J = I S = I S = J
The sectional area of similar winding S′ = k2S, then the current strain of similar winding is:
I = k 2 I
The integral form of Ampere’s law is:
B d l = μ 0 N I
where B is the magnetic flux density, N is the number of turns, and μ0 is the vacuum permeability.
The magnetic flux density is one of the main indexes considered in the design of the converter transformer core, which should be selected in the linear area of the B-H curve, and the magnitude of the magnetic flux density affects the working characteristics and vibration characteristics of the core. Based on the operation characteristics of the converter transformer, the core material generally works between 1.5–1.8 T. As the amplitude of I decreases after the model is reduced, in order to reach the linear working area of the hysteresis loop more easily, the number of coil turns is increased from N to k−1N, and the magnetic flux density obtained after similarity should be:
B = B
It is worth emphasizing that through the electromagnetic field similarity criterion, the working current density and magnetic field intensity of the scale model are consistent with the prototype, which can effectively ensure the similarity of the working characteristics of the converter transformer before and after scaling.
The same winding material is used before and after the similarity, so the winding conductivity remains unchanged, but at the same time, the length of the winding decreases to k times, and the cross-sectional area of the winding decreases to k2 times. Therefore:
R = 1 σ l S = 1 σ k l k 2 S = R k
Based on Ohm’s circuit law, the proportional model has the following voltage:
U = I R = k U
Assuming that the operating frequency of the power supply is unchanged before and after the similarity, we can judge whether the similar process between the above parameters is balanced by the relationship between the main magnetic flux and the operating voltage when the converter transformer works normally:
U = 4.44 f N B S
According to Formulas (4)–(9), U′ = kU, N′ = k−1N, B′ = B, S′ = k2S, and f′ = f are brought into Formula (10). The equation is balanced on both sides of the equals sign, and the similarity criterion is correct.

2.4. Similarity of Solid Mechanics

According to the principle of the vibration mechanics model, the winding is regarded as an elastic mass. The gasket and insulation structure together are equivalent to the spring damping element, that is, the winding is equivalent to the rigid body structure with mass m, the gasket between windings is equivalent to the spring element K, and the insulation block and compression structure are equivalent to the spring KB and KH respectively. Assuming that the damping coefficient between windings is C, the governing equation of winding vibration can be obtained as follows [31]:
M d 2 z d t 2 + C d z d t + K z = F + M g
where M is the mass matrix, C′ is the damping matrix, K′ is the elastic matrix, z is the displacement, g is the acceleration of gravity.
The force acting on a moving charge in a magnetic field is called the Lorentz force, which is the force exerted by the magnetic field on the moving charge in the wire. The Ampere force is the macroscopic manifestation of the Lorentz force, which is the force acting on the charged wire in the magnetic field. When alternating current is applied, a leakage of magnetic field that varies with the power frequency is generated around the winding. The moving charge in the winding is subjected to the action of the alternating magnetic field. During the positive and negative half cycles of the power supply, they are subjected to opposing forces, resulting in two vibrations occurring within one power frequency. The leakage flux through the winding is divided into axial and radial components. The axial leakage flux interacts with the winding current to generate radial electromagnetic force Fx, and the radial leakage flux interacts with the winding current to generate axial electromagnetic force Fz, which can be expressed as:
F x = i B x 2 π r
F z = i B z 2 π r
After similarity, the winding radius r = kr, magnetic flux density B′ = B, and winding current i′ = k2i. Therefore, we obtain the electromagnetic force Fl′ = k4Fl on the winding of the converter transformer after similarity.
The vibration model of silicon steel sheet under alternating magnetic field is as follows:
D 0 4 v x 4 + 2 4 v x 2 y 2 + 4 v y 4 = ω sin 2 ω t Δ l x v 1 2 E λ Z 3 d V
where D0 is the bending stiffness of silicon steel sheet, ν is the Poisson’s ratio of the material, x and y are the transverse and longitudinal dimensions of two-dimensional silicon steel sheet, respectively, ω is angular frequency, t is the time, lx is the elongation, E is the elastic modulus of the material, λZ is the axial magnetostriction coefficient, V is the volume element.
Nowadays, the gaps between silicon steel sheets in the iron cores used in converter transformers are becoming smaller and smaller, and the stacking method is more advanced. The Maxwell stress between silicon steel sheets can be ignored, so the main contribution of iron core vibration is the magnetostrictive effect of ferromagnetic materials under alternating electric fields. The magnetostrictive force caused by the magnetostrictive effect in both parallel and vertical directions can be expressed as:
F c = F c m a x s i n 2 ω t = 0.5 ( H 2 τ μ τ )
where Fc is the magnetostrictive force and Fcmax is the amplitude of the electromagnetic force caused by magnetostriction. Therefore, the force magnitude Fc′ on the iron core changes to Fc′ = kFc.

3. Finite Element Physical Model and Its Similarity Process

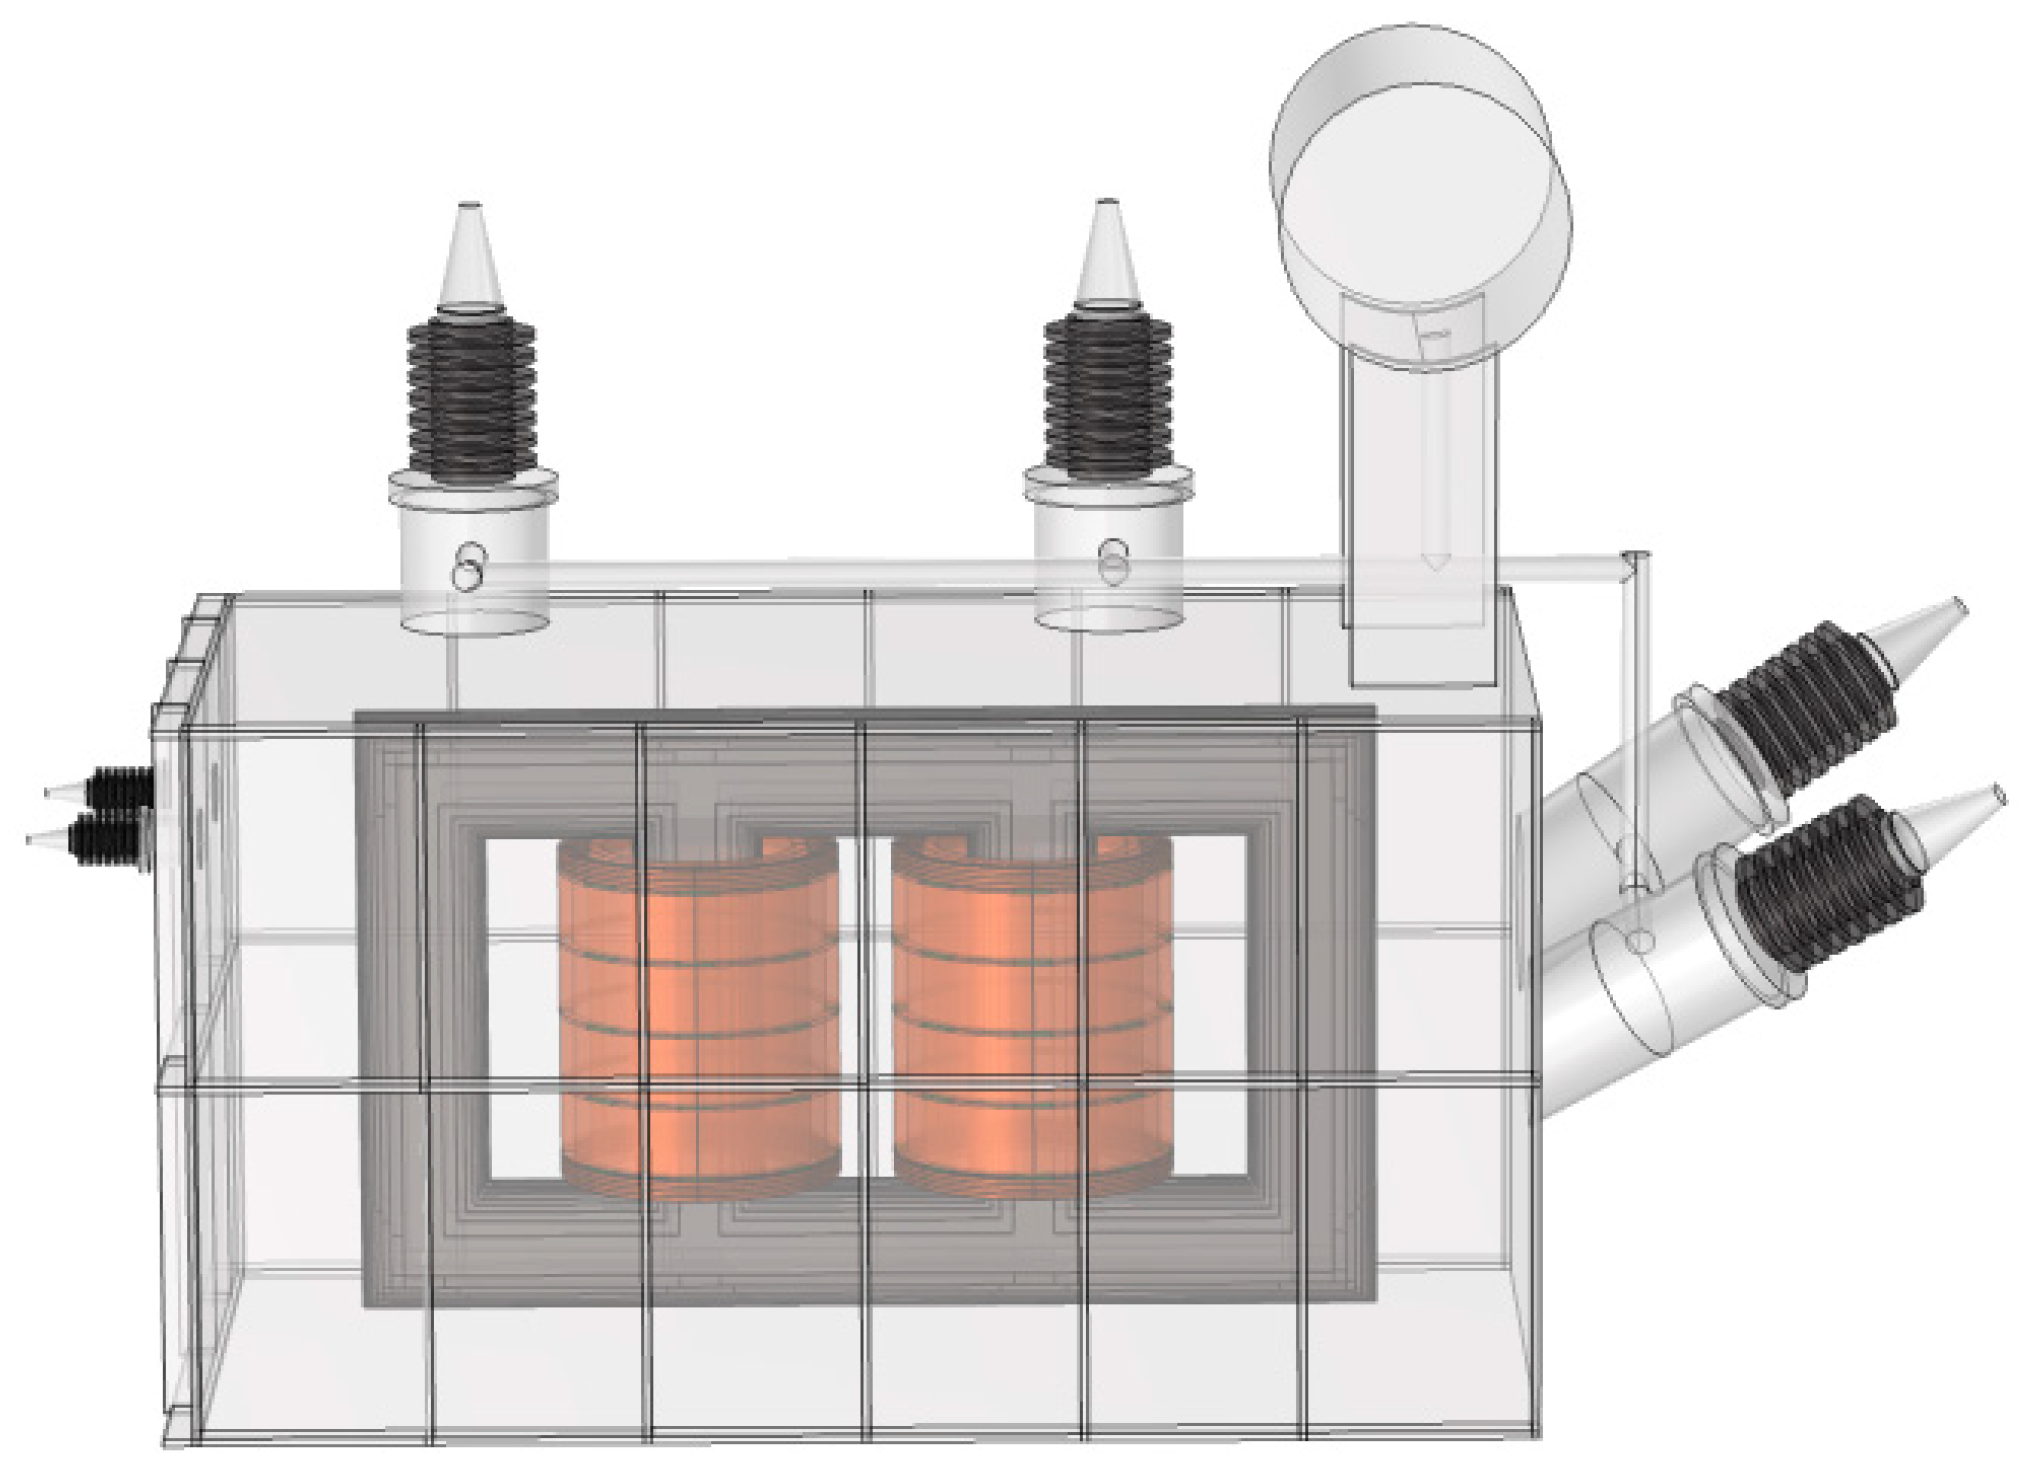
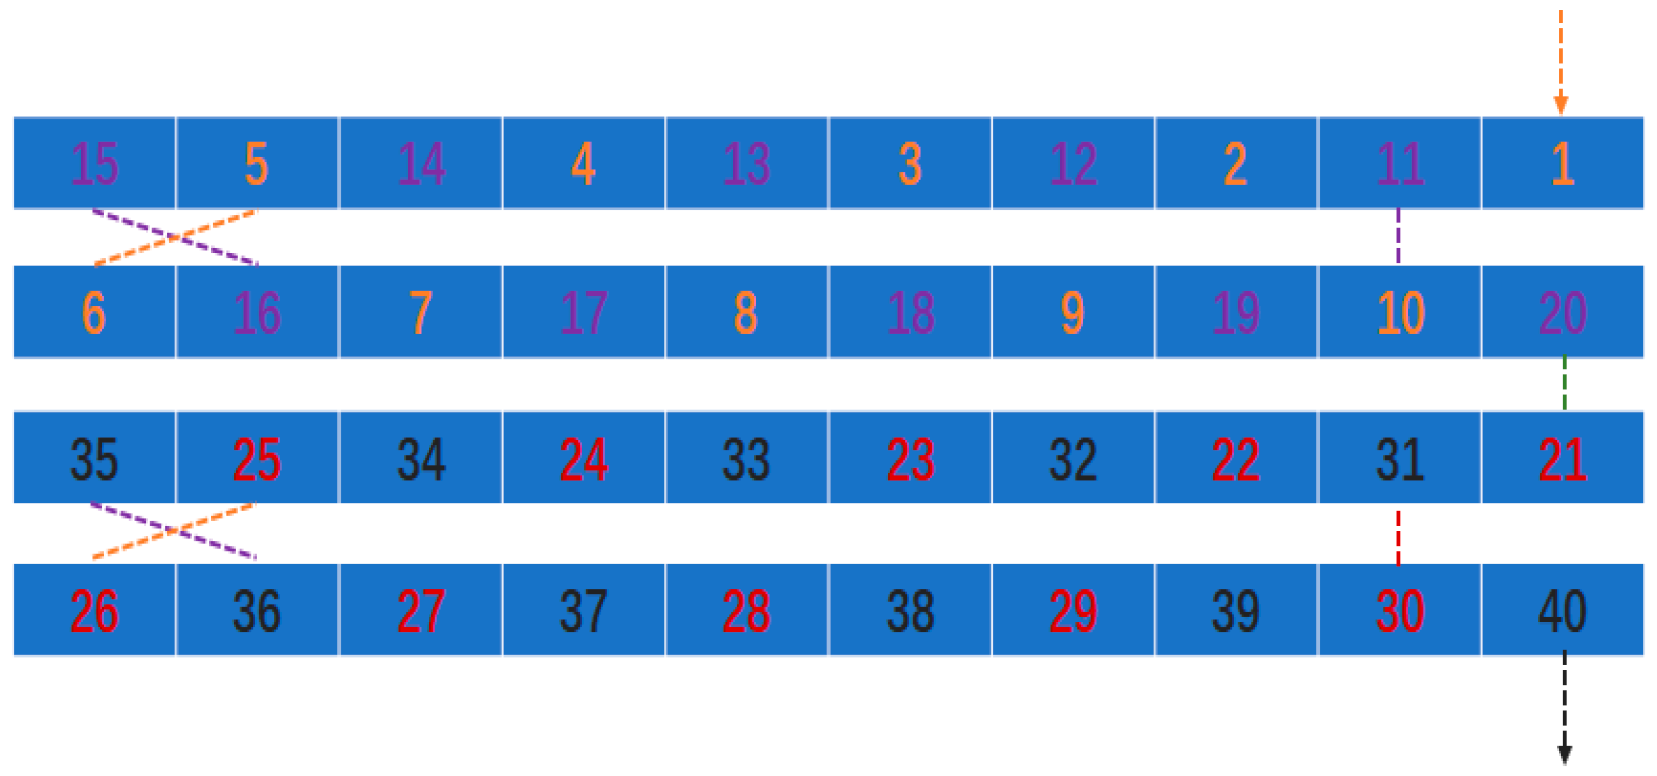
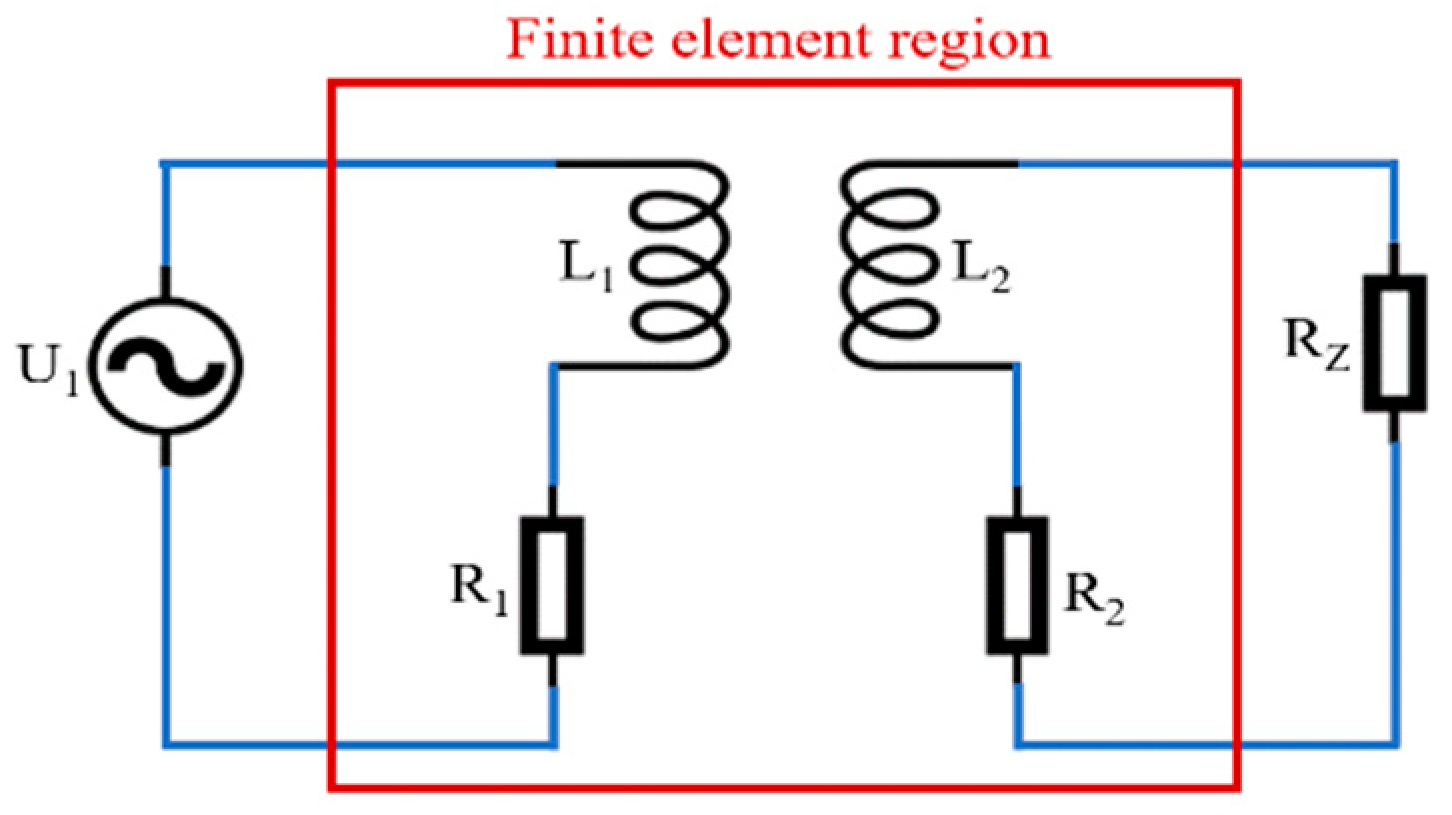
3.1. Finite Element Model of Electric-Magnetic-Force Multi-Field Coupling for Converter Transformer

According to a 500 kV converter transformer in operation (ZZDFPZ-415000/500-800), a three-dimensional physical model of the converter transformer with multi-field coupling was established using the finite element simulation platform, as shown in Figure 1. The model was simplified according to the design drawings and was designed as a single-phase double winding structure with two main columns and two side columns. Fixture replacement can be neglected with fixed constraints, but the winding entanglement structure, distribution form of winding pads, and iron core lamination form that have a significant impact on the vibration characteristics of the model cannot be omitted. The material property parameters of the model are listed in Table 1.
Considering the time cost, the computational complexity and convergence speed of the model are optimized, and some details are simplified without affecting the vibration characteristics. The core material is the main contribution to the nonlinearity of the converter transformer. It is necessary to define the values of B and H at each location based on the B-H curve of the silicon steel sheet to ensure the reliability of the model. The B-H curve used for the definition is shown in Figure 2.
The design of the winding structure should consider not only the arrangement between each turn of the winding and the position of the cushion blocks, but also the trajectory of current flow in the winding cake, which is one of the main difficulties in finite element modeling. The windings of the high-voltage transformers currently in operation are mostly wound continuously, as shown in Figure 3. By using the field–circuit coupling method, as shown in Figure 4, the specified conduction path of excitation is set according to the node order to achieve a winding mode of entangled–continuous–entangled.
The current flow sequence of the winding is shown in Figure 5. The overall appearance structure of the winding is shown in Figure 6, and the geometric parameters of each part of the winding are listed in Table 2.
In order to save time and computational resources, the physical model of the converter transformer was divided into 1/2 models along the longitudinal section. The 1/2 model was meshed, and the winding, iron core, and pad were subjected to ultra-fine free tetrahedral structural dissection. Other areas were subjected to plane triangle and sweep operations.

3.2. Vibration Scale Model of Converter Transformer

Based on the similarity criterion, a 1/5 scale model of the converter transformer was established, and the geometric parameters are shown in Table 2. The magnetic flux density distribution, stress distribution and vibration characteristics of the converter transformer model and its scale model were calculated, and the calculation results are compared and analyzed.

4. Analysis and Discussion on Simulation Results of Finite Element Scale Model of Converter Transformer

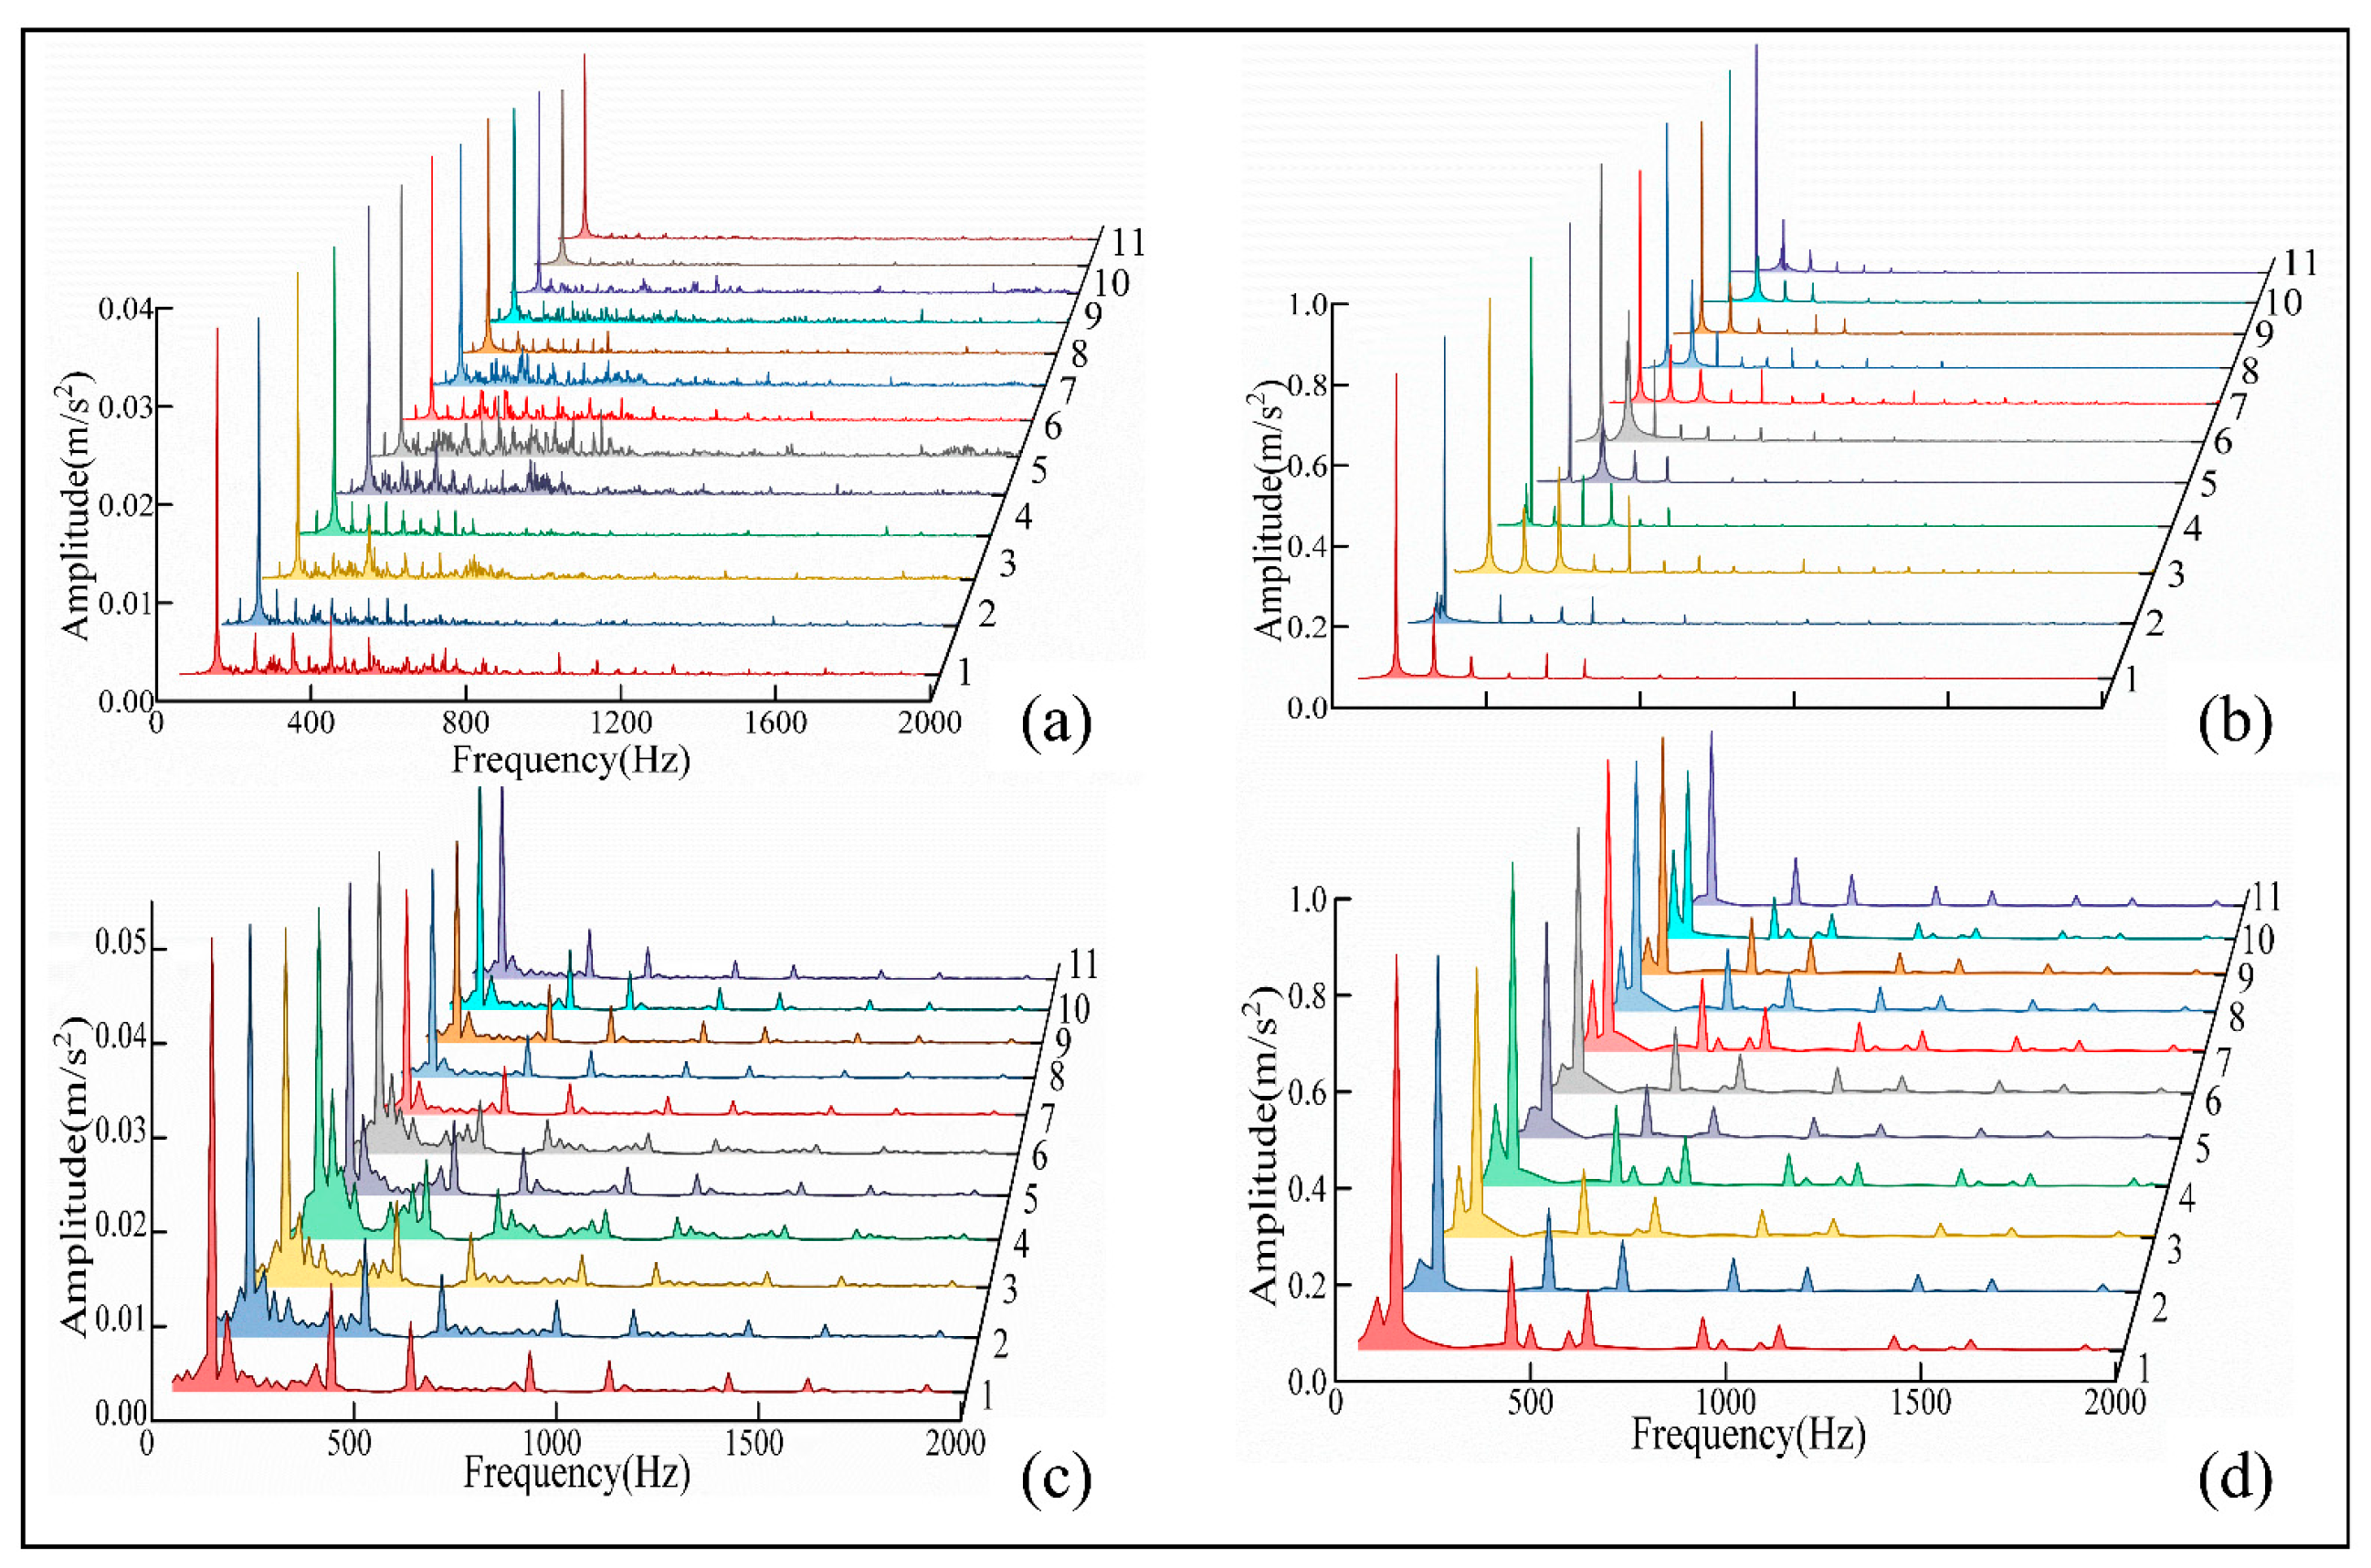
4.1. Similarity of Modal Shapes

Mode of vibration was the first structural characteristic to be verified after the converter transformer geometry transformation. In order to improve the universality of modal analysis, in addition to the initial model and 1/5 similarity model, a 1/2 similarity model was also established and analyzed, and the first six natural frequency distributions of the model core and winding under three geometric sizes were obtained, which are listed in Table 3 and Table 4, respectively. By comparing the modal shapes of the models with three geometric sizes, it was found that the modal distributions of the windings and iron cores under each size were roughly the same, and the natural frequency showed an inverse trend to the similarity coefficient. The law follows the derivation of Formula (3). In order to reduce the generation of resonance effects during operation, mode has become one of the main parameters considered in the transformer design process. The natural frequencies of the core and winding are both staggered from the power frequency, avoiding resonance, indicating that the structural design of the model is relatively reasonable.
The winding and core modes of the initial model, the 1/5 model, and the 1/2 model are shown in Figure 7a–c and Figure 7d–f, respectively. As the model scale decreases proportionally, the modal distribution pattern of the model does not change much, and the natural frequency changes of each size of model follow the load similarity criterion.

4.2. Distribution Characteristics of Electromagnetic Fields in Similar Processes

The changes of the magnetic field intensity distribution of the core and winding in the process of model similarity were calculated and compared, and are depicted in Figure 8 and Figure 9. As depicted in Figure 8, the change of core magnetic flux density distribution in the process of similarity can be ignored, and the amplitude of magnetic flux density basically remained unchanged, which is consistent with the conclusion of the similarity criteria. The leakage flux density distributions of the initial model and 1/5 scale model are shown in Figure 9. Through comparison, it was found that the model did not change the spatial distribution trend of the leakage flux in the similar process, and the amplitude variation law of the leakage flux density of both models meets the proposed electromagnetic field similarity criterion.

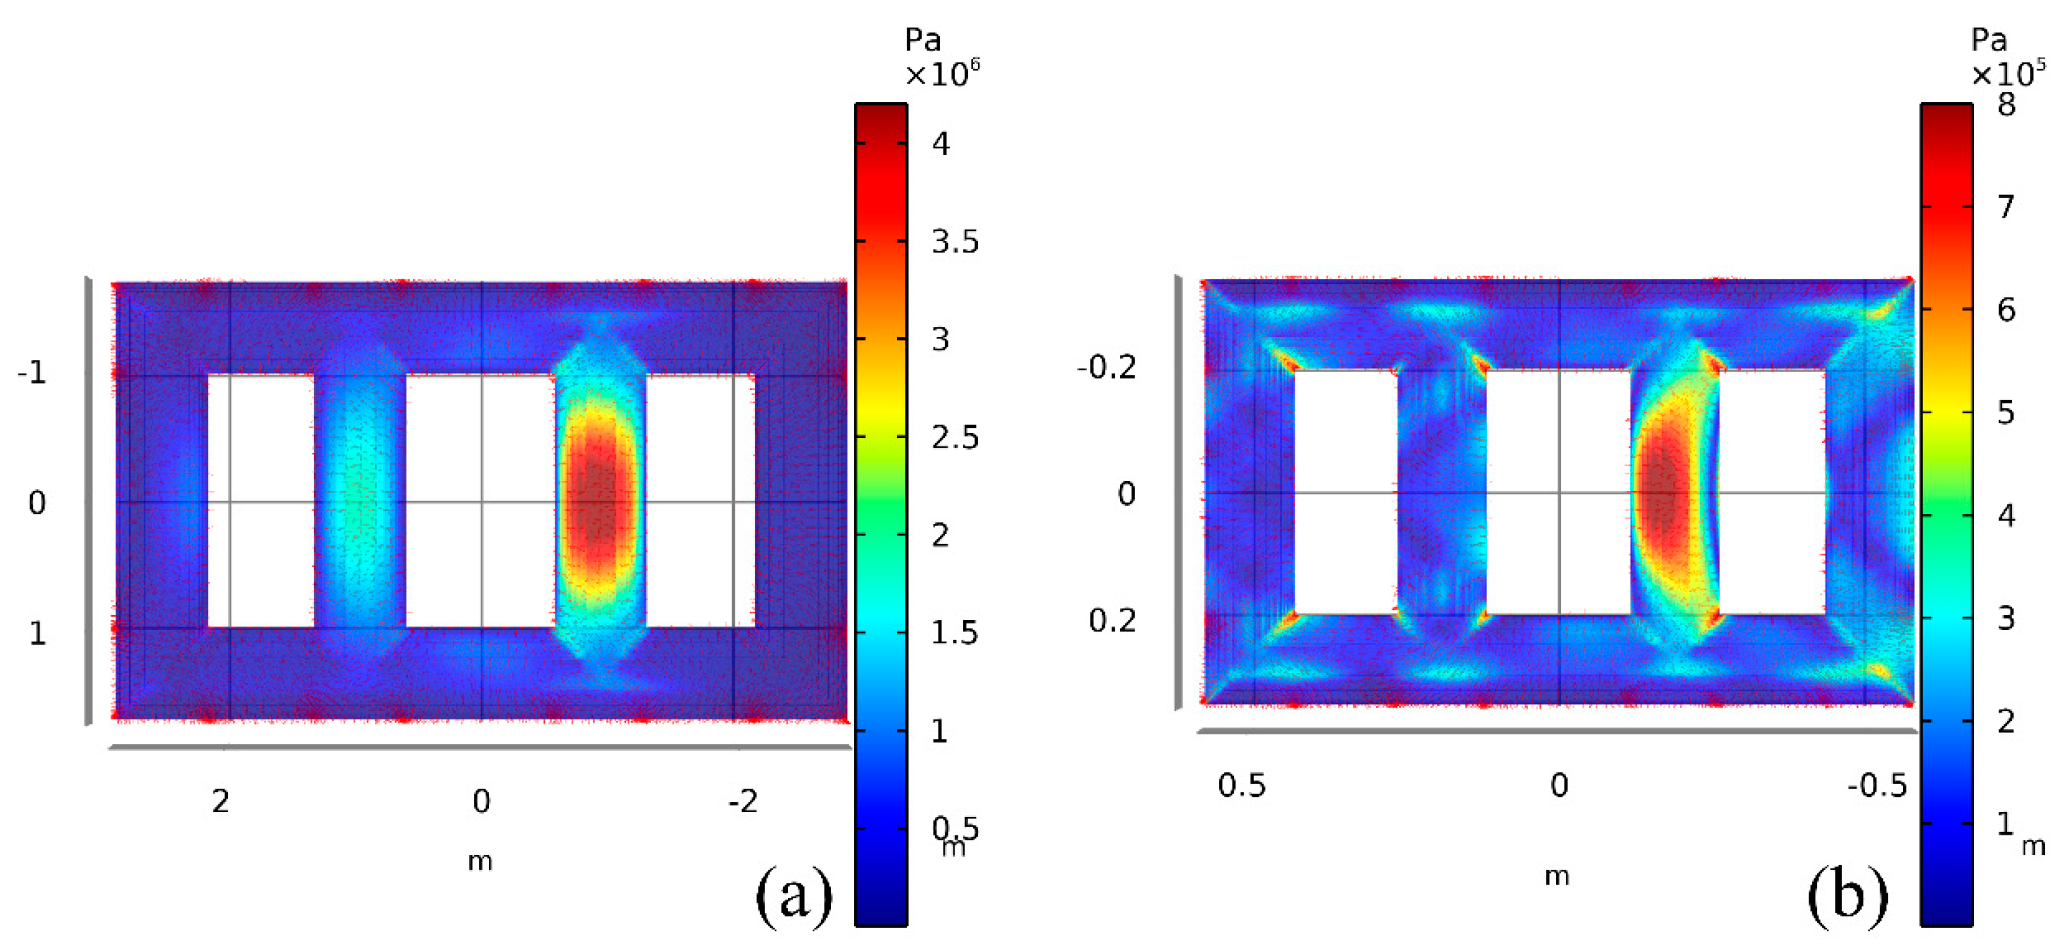
4.3. Stress and Displacement Distribution Characteristics in Similar Processes

Figure 10 compares the stress distribution characteristics of the iron core during similar processes. Comparing the two figures in Figure 10, it can be found that there is a difference in stress amplitude between the initial model and the scale model, but the stress distribution characteristics of the two are basically the same. Before and after similarity, the areas with greater stress on the iron core are distributed in the middle of the main column. The four points with the maximum force amplitude are distributed in the corner of the core window near the winding, similar to the analysis of magnetic field distribution. The stress threshold of the iron core in the scale model is roughly equal to the initial model, which is mainly affected by the magnetostrictive force of the magnetic domain under alternating magnetic fields. According to Formula (11), it is proportional to the square of the voltage. Since the voltage remains constant during similar processes, the force on the solid iron core remains unchanged. The distribution and amplitude change of the force on the core meet the similarity criterion [32].
The converter transformer winding stress distribution is depicted in Figure 11. The stress distribution of the winding in the similar model is basically the same as the initial model, and the direction of action of the stress points is also the same. The stress amplitude of the winding in the scale model is about k3 times that of the initial model. The amplitude of the numerical winding before and after the similarity keeps an appropriate corresponding relationship in the order of magnitude.
Figure 12 and Figure 13 depict the displacement distribution characteristics of the initial model and the proportional model iron core and winding, respectively. Comparing the two figures in Figure 12, it can be found that the displacement distribution characteristics and deformation trend of the iron core do not change much during similar processes, and the change trend of displacement amplitude is the same as that of stress. The main contribution of core displacement comes from the magnetostrictive effect of the magnetic domains inside the core under alternating magnetic fields, which is proportional to the square of the voltage. During similar processes, this law remains unchanged.
From Figure 13, it can be seen that the deformation trend of the windings in the initial model and scale models is the same. The main contribution of winding displacement comes from the combined Lorentz force on electrons in an alternating magnetic field, and the leakage flux density depends on the current, so its variation pattern is the same as that of current in similar processes. Figure 13 shows a trend of outward stretching in both the original and scale models, showing maximum values of winding shape variables in the middle. The radial electromagnetic force of the winding exerts a stretching effect on it, causing its deformation direction to expand outward.
A hemispherical air domain with a radius of 10 m was added to the converter transformer model before and after scaling, and a perfect matching layer with a thickness of 1 m was set up to conduct frequency domain analysis of the sound field. As shown in Figure 14, before scaling, the sound pressure distribution of the converter transformer was between ±64 Pa, and after scaling, the sound pressure distribution was between ±33 Pa. The sound pressure frequencies were mainly 100, 200, and 300 Hz, and the 100 Hz component was the largest. The sound pressure distribution shows that the lateral sound pressure value is greater than the front and greater than the top. The maximum sound pressure levels before and after scaling appear at 68 dB and 23.2 dB, respectively. The sound pressure distribution shows attenuation outward along the center of the hemisphere, with the fastest attenuation above, indicating that the sound pressure distribution characteristics before and after scaling were normal.

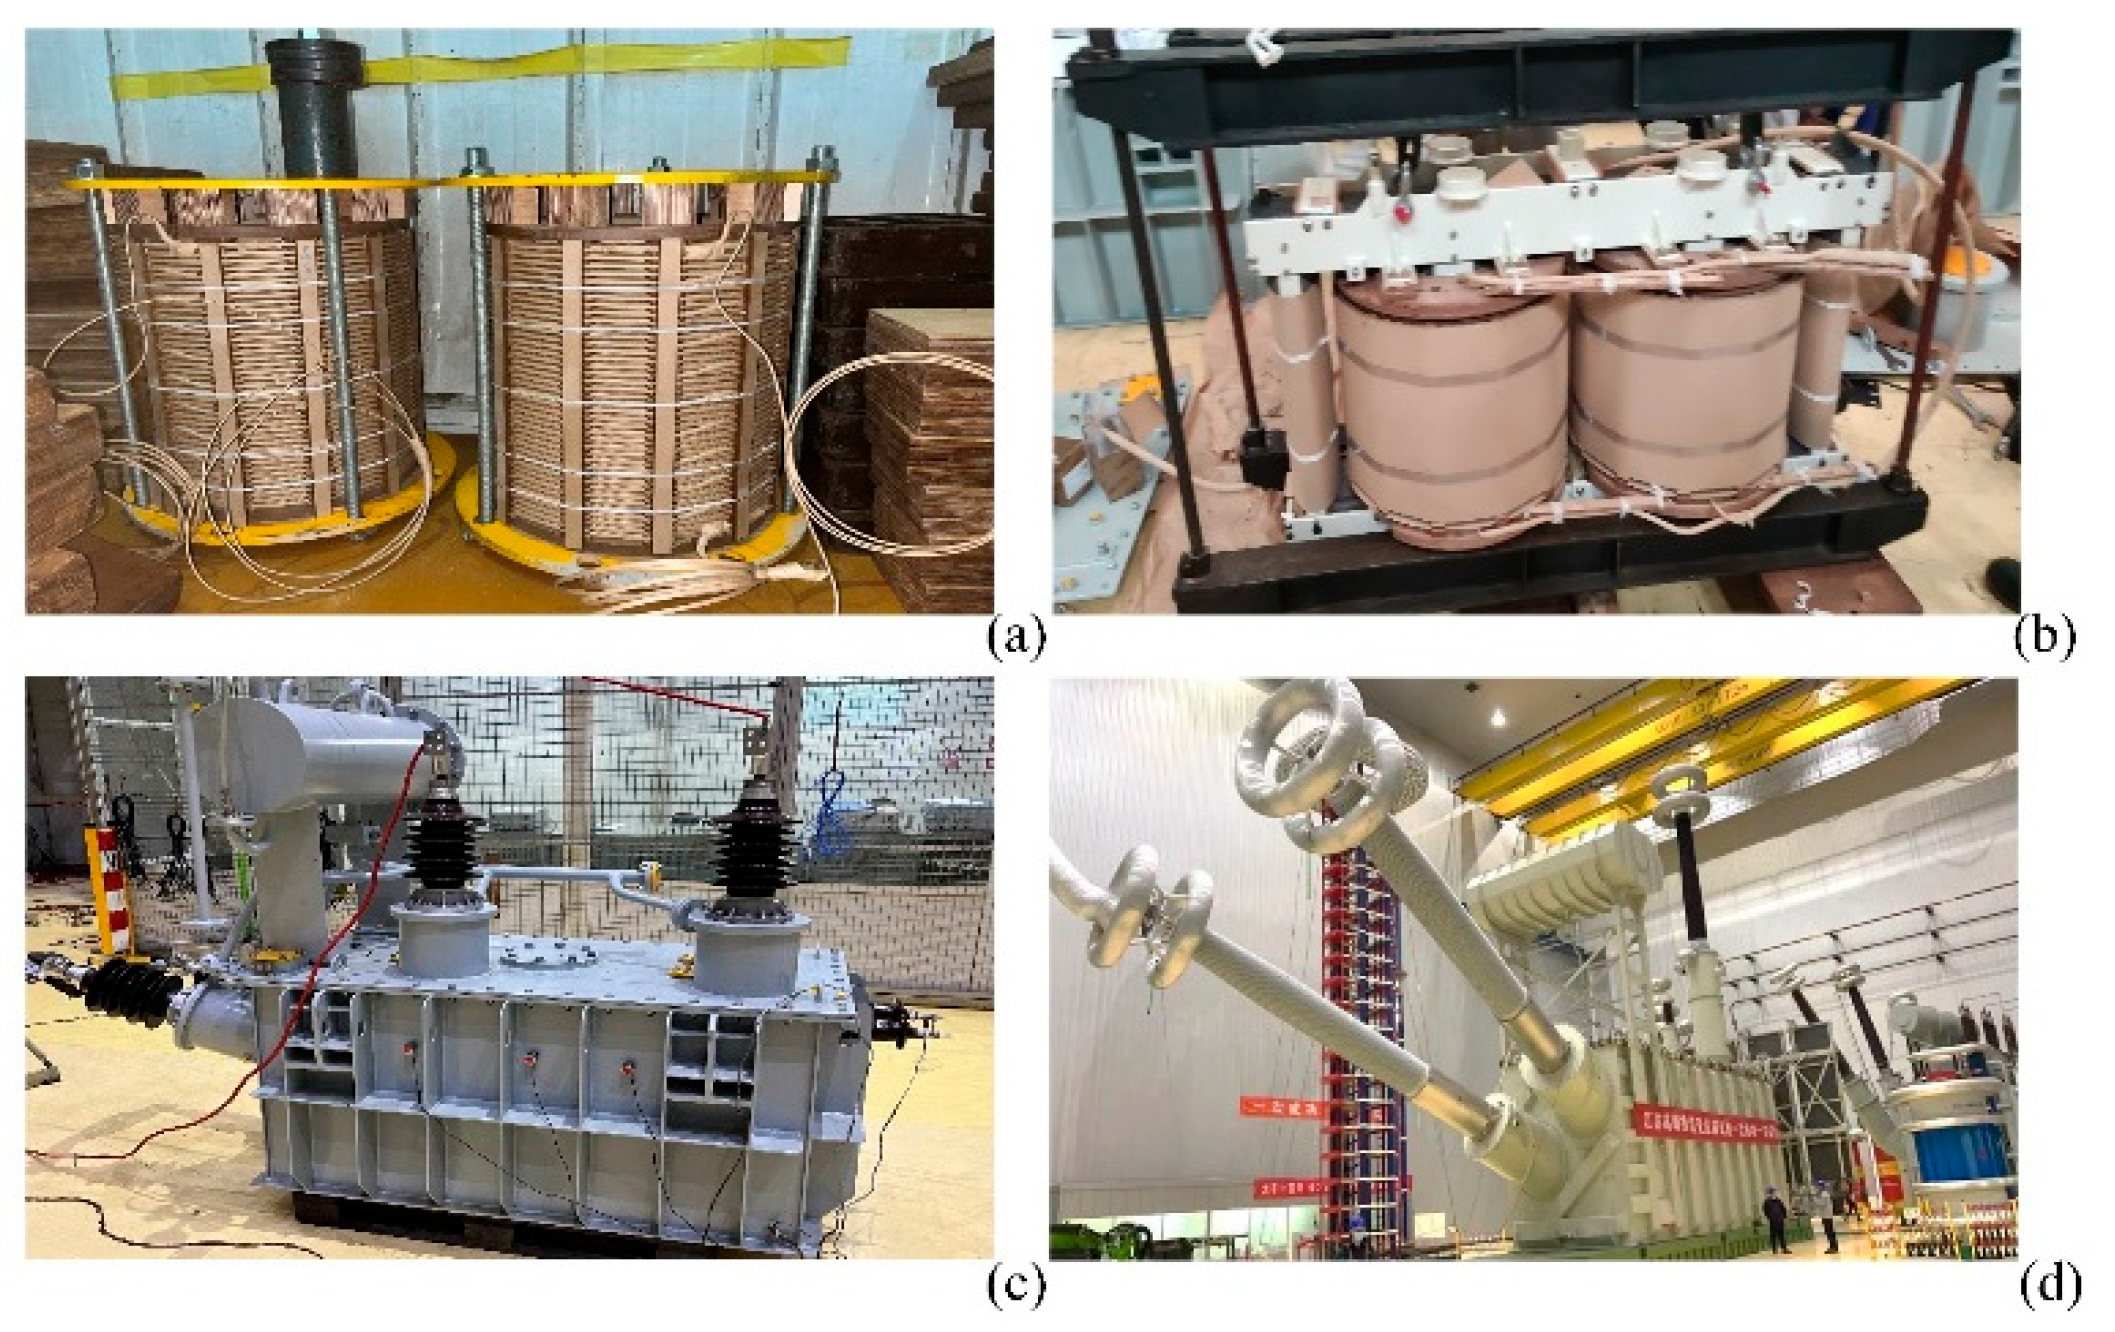
5. Preparation of Scale Prototype

According to the similarity criterion, a scale prototype of converter transformer with a scale of 1:5 was designed and manufactured. The prototype was designed as single-phase double winding, on load voltage regulation, with a rated voltage ratio of 100/30 kV. The relevant design parameters are shown in Table 5.
Figure 15 shows the design drawing of the scale prototype converter transformer. The iron core diameter is 204/208 mm, and the design type is two main columns and two side columns. The six-step stacking method is adopted. The step amount is 9 mm, and the lamination form is 1, 3, 5, 2, 4, and 6. The casting structure is selected as the positioning method, and the casting ring/locating nail is directly connected with the clamp.
After the reduction of the converter transformer, considering the spatial distribution, it is impractical to raise the number of winding turns to several. When designing the converter transformer scale prototype, we tried to use another way to remove the part of the equivalent winding that had not increased. Because the magnetic field distribution is mainly affected by the number of turns, namely Formulas (6) and (10), when other parameters were fixed, we replaced the silicon steel sheet material (30QG120) to approximately replace the effect of winding turns on B. The coil structure has been designed as a valve net, two-column type, with column 1 winding to the right and column 2 winding to the left. The inner diameter of the valve side coil is 260 mm, the outer diameter is 302 mm, the radial dimension is 21 mm, and the reactance height is 320 mm. The inner diameter of the coil at the grid side is 398 mm, the outer diameter is 454 mm, the radial size is 28 mm, and the reactance height is 320 mm, all of which are divided into 12 grades. The preparation process and physical images of the proportional prototype are shown in Figure 16a–c, and the corresponding converter transformer of the prototype is shown in operation in Figure 16d.
Since the angle correlation between the vibration signal loss and its transmission time is stronger than that of the sensor, the measuring point was set as far as possible perpendicular to the sound source (winding and iron core). In view of the position of the low-voltage bushing above the oil tank and the distribution of iron core fasteners above the oil tank, only two measuring points above the oil tank, namely point 10 and point 11, were selected. Figure 17 depicts the distribution of measuring points of the converter transformer scale prototype.
The vibration signals of each measuring point of the prototype were processed by FFT, and the frequency domain diagrams of no-load and load vibration signals of each measuring point were obtained, as shown in Figure 18a,b. The frequency domain signals of the vibration acceleration at the corresponding points of the finite element proportional model under no-load and load conditions were extracted and are shown in Figure 18c,d, in order to compare and analyze the simulated and measured signals more intuitively.
As shown in Figure 18, the vibration acceleration signal distribution of the finite element scale model based on the similarity principle was basically the same as the actual prepared scale prototype. Both no-load and load conditions, regardless of the main frequency or amplitude range, exhibited a certain degree of similarity. Among them, the similarity between the average acceleration amplitude of each measuring point under load and the simulation results exceeded 80%, and the similarity between the average acceleration amplitude of each measuring point under no load and the simulation results was close to 90%, proving that the standards proposed in this article are reliable for guiding product design and preparation. At the same time, sound pressure testing was conducted on the prototype of the scale prototype of the converter transformer, and the average sound pressure level was 24 dB, which is basically consistent with the scale simulation model, and proves that the criteria proposed in this paper are reliable for guiding the design and preparation of products.

6. Conclusions

1. Different from the traditional geometric similarity criteria in previous studies, the similarity criteria suitable for studying the vibration mechanism of converter transformers were derived by comprehensively considering the electromagnetic field and structural mechanics.
2. Considering the coupling effect of electric field, magnetic field, and solid mechanics, and the contribution of the core lamination mode, entangled–continuous–entangled winding structure, and gasket on vibration characteristics, a finite element model of a converter transformer was established.
3. The modal transformation laws of similar pre- and post-converter transformers were derived and verified, providing theoretical support for the study of resonance avoidance mechanisms based on scale models.
4. Based on the similarity criterion, a finite element similarity model of the converter transformer was established, and the electromagnetic and vibration characteristics of the model during the similarity process were compared, verifying the reliability of the similarity criterion.
5. The proportional model prototype of the converter transformer was designed and prepared, and basic experimental projects and vibration characteristics analyses were conducted on the prototype. The results were compared with simulation research to further verify the reliability of the similarity criterion and provide a reference for the design of the proportional model prototype of high-voltage power equipment.
6. This scale model can serve as an experimental platform for studying the vibration mechanism of converter transformers, making it possible to analyze the vibration characteristics of internal components of high-power equipment in a laboratory environment. At the same time, more convenient testing and experimental scheme layout greatly saves time and computational costs, and has great engineering application value.
The vibration similarity model for converter transformers proposed in this paper can provide a reliable laboratory research platform for studying the mechanism and suppression of vibration and noise in converter transformers, it can save a lot of time and computational costs for conducting relevant vibration mechanism experiments, and has certain reference value for experimental research on proportional models of other power equipment.

Author Contributions

Conceptualization, L.Z. (Li Zhang); methodology, L.Z. (Liang Zou); software, L.Z. (Liang Zou); validation, Y.S.; formal analysis, H.W.; investigation, Y.S.; resources, L.Z. (Li Zhang); data curation, L.Z. (Li Zhang); writing—original draft preparation, H.W.; writing—review and editing, H.W.; visualization, Y.S.; supervision, L.Z. (Li Zhang); project administration, L.Z. (Li Zhang); funding acquisition, Y.S. All authors have read and agreed to the published version of the manuscript.

Funding

This work was supported by the Key R&D Program of Shandong Province (2021CXGC010210).

Institutional Review Board Statement

Not applicable.

Informed Consent Statement

Not applicable.

Data Availability Statement

Not applicable.

Conflicts of Interest

The authors declare that they have no known competing financial interests or personal relationships that could have appeared to influence the work reported in this paper.

References

  1. Zhang, P.; Li, L.; Cheng, Z.; Tian, C.; Liu, Y. Simulation and experimental comparison of core vibration of shunt reactor and transformer model. J. Electrotech. 2018, 33, 9. [Google Scholar]
  2. Makmud, M.Z.H. Optimal Design of Corona Ring for 132 kV Insulator at High Voltage Transmission Lines Based on Optimisation Techniques. Energies 2023, 16, 778. [Google Scholar]
  3. Kell, D. HVDC to Grow Rapidly. Nat. Gas Electr. 2015, 31, 11–18. [Google Scholar] [CrossRef]
  4. Ghilman, R.; Al-Majali, H.D. Performance analysis of multi-level high voltage direct current converter. Int. J. Electr. Comput. Eng. 2022, 12, 1368–1376. [Google Scholar]
  5. Mohan, M. A comprehensive review of DC fault protection methods in HVDC transmission systems. Prot. Control Mod. Power Syst. 2021, 6, 1–20. [Google Scholar]
  6. Yang, B.; Liu, B.; Zhou, H.; Wang, J.; Yao, W.; Wu, S.; Shu, H.; Ren, Y. A critical survey of technologies of large offshore wind farm integration: Summary, advances, and perspectives. Prot. Control Mod. Power Syst. 2022, 7, 233–264. [Google Scholar] [CrossRef]
  7. Husin, H.; Zaki, M. A critical review of the integration of renewable energy sources with various technologies. Prot. Control Mod. Power Syst. 2021, 6, 37–54. [Google Scholar]
  8. Acarolu, H.; Márquez, G.; Pedro, F. High voltage direct current systems through submarine cables for offshore wind farms: A life-cycle cost analysis with voltage source converters for bulk power transmission. Energy 2022, 249, 123713. [Google Scholar] [CrossRef]
  9. Zhao, Y.; Crossley, P. Impact of dc bias on differential protection of converter transformers. Int. J. Electr. Power Energy Syst. 2020, 115, 105426.1–105426.10. [Google Scholar] [CrossRef]
  10. Liu, X.; Wu, J.; Jiang, F.; Wang, Y.; Zhang, C.; Hui, Y. Electromagneto-mechanical numerical analysis and experiment of transformer influenced by DC bias considering core magnetostriction. J. Mater. Sci. Mater. Electron. 2020, 31, 16420–16428. [Google Scholar] [CrossRef]
  11. Weiser, B.; Pfützner, H.; Anger, J. Relevance of magnetostriction and forces for the generation of audible noise of transformer cores. IEEE Trans. Magn. 2000, 36, 3759–3777. [Google Scholar] [CrossRef]
  12. Jiang, P.; Zhang, Z.; Dong, Z.; Wu, Y.; Xiao, R.; Deng, J.; Pan, Z. Research on distribution characteristics of vibration signals of ±500 kV HVDC converter transformer winding based on load test. Int. J. Electr. Power Energy Syst. 2021, 132, 107200. [Google Scholar] [CrossRef]
  13. Weiser, B.; Hasenzagl, A.; Booth, T.; Pfützner, H. Mechanisms of noise generation of model transformer cores. J. Magn. Magn. Mater. 1996, 160, 207–209. [Google Scholar] [CrossRef]
  14. Bilgundi, S.K.; Sachin, R.; Pradeepa, H.; Nagesh, H.B.; Kumar, M.V.L. Grid power quality enhancement using an ANFIS optimized PI controller for DG. Prot. Control Mod. Power Syst. 2022, 7, 26–39. [Google Scholar] [CrossRef]
  15. Kitagawa, W.; Ishihara, Y.; Todaka, T.; Nakasaka, A. Analysis of structural deformation and vibration of a transformer core by using magnetic property of magnetostriction. Electr. Eng. Jpn. 2010, 172, 19–26. [Google Scholar] [CrossRef]
  16. He, J.; Chen, K.; Li, M.; Luo, Y.; Liang, C.; Xu, Y. Review of protection and fault handling for a flexible DC grid. Prot. Control Mod. Power Syst. 2020, 5, 151–165. [Google Scholar] [CrossRef]
  17. Guillod, T.; Kolar, J.W. Medium-frequency transformer scaling laws: Derivation, verification, and critical analysis. CPSS Trans. Power Electron. Appl. 2020, 5, 18–33. [Google Scholar] [CrossRef]
  18. Zhang, P.; Li, L.; Cheng, Z.; Tian, C.; Han, Y. Study on vibration of iron core of transformer and reactor based on maxwell stress and anisotropic magnetostriction. IEEE Trans. Magn. 2019, 55, 9400205. [Google Scholar] [CrossRef]
  19. Stephen, A.S.; Ross, C. Scale model studies of AC substation electric fields. IEEE Trans. Power Appar. Syst. 1979, 98, 926–939. [Google Scholar]
  20. Brubaker, M.A.; Lindgren, S.R.; Frimpong, G.; Walden, J.M. Streaming electrification measurements in a 1/4-scale transformer model. IEEE Trans. Power Deliv. 1999, 14, 978–985. [Google Scholar] [CrossRef]
  21. Piantini, A.; Janiszewski, J.M.; Borghetti, A.; Nucci, C.A.; Paolone, M. A Scale Model for the Study of the LEMP Response of Complex Power Distribution Networks. IEEE Trans. Power Deliv. 2007, 22, 710–720. [Google Scholar] [CrossRef]
  22. Li, Q.; Wang, X.; Zhang, L.; Lou, J.; Zou, J. Modelling methodology for transformer core vibrations based on the magnetostrictive proper-ties. IET Electr. Power Appl. 2012, 6, 604–610. [Google Scholar] [CrossRef]
  23. Zou, L.; Gong, P.; Zhang, L.; Zhao, T.; Li, Q. Scale reduction test and model simplification of space magnetic field of dry-type air core reactor. High Volt. Technol. 2014, 40, 8. [Google Scholar]
  24. Pu, Z.H.; Ruan, J.J.; Du, Z.Y.; Zhang, Y.D. Analysis of voltage distribution characteristics in hvdc converter transformer winding based on the reduced-scale model. IEEE Trans. Magn. 2014, 50, 1–5. [Google Scholar] [CrossRef]
  25. Zhang, X.; Liu, X.; Guo, F.; Xiao, G.; Wang, P. Calculation of DC Bias Reactive Power Loss of Converter Transformer via Finite Element Analysis. IEEE Trans. Power Deliv. 2020, 36, 751–759. [Google Scholar] [CrossRef]
  26. Yao, Y.; Koh, C.S.; Ni, G.; Xie, D. 3-D nonlinear transient eddy current calculation of online power transformer under DC bias. IEEE Trans. Magn. 2005, 41, 1840–1843. [Google Scholar]
  27. Wang, T.; Xie, Q.; Zhang, Y.; Du, Z.; Ruan, J.; Tan, D.; Zhu, L. Research on scaling relationship of power transformer based on similarity theory. New Technol. Electr. Energy 2015, 34, 5. [Google Scholar]
  28. Moses, A.J.; Anderson, P.I.; Phophongviwat, T. Localized Surface Vibration and Acoustic Noise Emitted from Laboratory-Scale Transformer Cores Assembled from Grain-Oriented Electrical Steel. IEEE Trans. Magn. 2016, 52, 1–15. [Google Scholar] [CrossRef]
  29. Shilyashki, G.; Pfützner, H.; Hamberger, P.; Aigner, M.; Kenov, A.; Matkovic, I. Spatial distributions of magnetostriction, displacements and noise generation of model transformer cores. Int. J. Mech. Sci. 2016, 118, 188–194. [Google Scholar] [CrossRef]
  30. Garcia, B.; Burgos, J.C.; Alonso, A. Transformer Tank Vibration Modeling as a Method of Detecting Winding Deformations-Part I: Theoretical Foundation. IEEE Trans. Power Deliv. 2006, 21, 157–163. [Google Scholar] [CrossRef]
  31. Baravati, P.R.; Moazzami, M.; Hosseini, S.M.H.; Mirzaei, H.R.; Fani, B. Achieving the exact equivalent circuit of a large-scale transformer winding using an improved detailed model for partial discharge study. Int. J. Electr. Power Energy Syst. 2022, 134, 107451. [Google Scholar] [CrossRef]
  32. Gao, Y.; Muramatsu, K.; Hatim, M.J.; Fujiwara, K.; Ishihara, Y.; Fukuchi, S.; Takahata, T. Design of a Reactor Driven by Inverter Power Supply to Reduce the Noise Considering Electromagnetism and Magnetostriction. IEEE Trans. Magn. 2010, 46, 2179–2182. [Google Scholar] [CrossRef]
Figure 1. Finite element model of multi-field coupling for converter transformer.
Processes 11 01969 g001
Figure 2. Determination of B-H curve of silicon steel sheet corresponding to reference converter transformer.
Processes 11 01969 g002
Figure 3. Entangled winding-wire turn arrangement.
Processes 11 01969 g003
Figure 4. Field–circuit coupling method.
Processes 11 01969 g004
Figure 5. Current sequence of entangled winding.
Processes 11 01969 g005
Figure 6. Single-phase winding model.
Processes 11 01969 g006
Figure 7. Modal distribution of iron core and winding: (a) original model winding; (b) 1/2 model winding; (c) 1/5 model winding; (d) Original model iron core; (e) 1/2 model iron core; (f) 1/5 model iron core.
Processes 11 01969 g007
Figure 8. Magnetic flux density distribution of (a) initial model and (b) scale model.
Processes 11 01969 g008
Figure 9. Leakage flux density of (a) initial model and (b) scale model.
Processes 11 01969 g009
Figure 10. Stress distribution of (a) iron core of initial model and (b) scale model.
Processes 11 01969 g010
Figure 11. Force distribution of winding of (a) initial model and (b) scale model.
Processes 11 01969 g011
Figure 12. Core displacement distribution of (a) initial model and (b) scale model.
Processes 11 01969 g012
Figure 13. Winding displacement distribution of (a) initial model and (b) scale model.
Processes 11 01969 g013
Figure 14. (a) Initial model sound pressure distribution; (b) Sound pressure distribution of Scale model; (c) Initial model sound pressure level distribution; (d) Scale model sound pressure level distribution.
Processes 11 01969 g014
Figure 15. Design drawing of scale prototype.
Processes 11 01969 g015
Figure 16. Prototype preparation and vibration characteristics testing: (a) Winding preparation; (b) Assembly of iron core winding; (c) Complete prototype appearance; (d) Refer to converter transformer.
Processes 11 01969 g016
Figure 17. Distribution of measuring points.
Processes 11 01969 g017
Figure 18. Frequency domain diagram of vibration signal of prototype and simulation model: (a) prototype no-load; (b) prototype load; (c) simulated no-load; (d) simulated load.
Processes 11 01969 g018
Table 1. The material property parameters of the model.
NameIron CoreWindingSpacerInsulating Oil
Density (kg/m3)787089401117895
Young’s modulus (GPa)612.61-
Poisson’s ratio0.450.340.38-
Conductivity (S/m)1.12 × 1075.99 × 10711
Relative permittivity111-
Table 2. Geometry parameters of initial model and scale model.
ParametersInitial ModelSimilitude Model
Yoke length (m)6.721.344
Core height (m)3.60.72
Winding wire cake height (m)1.7640.353
Winding radius at grid side (m)0.6640.133
Radius of valve side winding (m)0.4680.094
Table 3. Natural frequency distribution of the core.
Natural FrequencyInitial Model
(Hz)
1/2 Model
(Hz)
1/5 Model
(Hz)
First order77.46155.06373.64
Second order114.55229.28563.93
Third order138.76277.58673.93
Fourth order240.83481.991203.96
Fifth order271.62548.291358.53
Sixth order316.01632.021593.26
Table 4. Natural frequency distribution of the winding.
Natural FrequencyInitial Model
(Hz)
1/2 Model
(Hz)
1/5 Model
(Hz)
First order77.53155.22387.62
Second order88.78196.67428.94
Third order115.64229.58573.14
Fourth order138.79277.58693.93
Fifth order168.62337.24842.95
Sixth order240.78481.571203.57
Table 5. Design parameters of scale prototype.
ParameterName/ValueParameterName/Value
ModelZZD-800/100-30Rated voltage ratio100/30 kV
Impedance>2%Impedance deviation+2.5%
Temperature riseWinding hot spot 78 KTemperature riseHot spot of iron core and metal parts 80 K
Insulation levelValve side neutral point LI60AC35 DC40Insulation levelMeshwork side LI60AC35
Load lossPk ≤ 15 kWNo load lossPo ≤ 2 kW Io ≤ 2%
Connection groupIi0 (YNY0)Noise level55 dB (A)
Disclaimer/Publisher’s Note: The statements, opinions and data contained in all publications are solely those of the individual author(s) and contributor(s) and not of MDPI and/or the editor(s). MDPI and/or the editor(s) disclaim responsibility for any injury to people or property resulting from any ideas, methods, instructions or products referred to in the content.

