Abstract
Azadirachta indica has several medicinal uses, especially its leaves. Over 4000 years ago, Ayurvedic medicine used it for its therapeutic benefits. This study examined the biological activity of Neem crude extracts and green-chemically produced Ag-NPs. TPCs and TFCs were measured for polyphenolic burden in consecutive extracts. DPPH, ABTS, and FRAP experiments measured antioxidant and antimicrobial activity against seven strains of food-borne pathogenic bacteria and eight mycotoxigenic fungi. At 1000 μg/mL, ethanolic and aqueous extracts of Neem leaves had 80.10% and 69.41% in DPPH and 71.42% and 74.61% in ABTS assays for the antioxidant activity, compared to 93.58% for BHT. At 800 μg/mL, both extracts showed antioxidant activity with 57.52 and 57.87 μM in the FRAP assay, compared to 139.97 μM for Ascorbic acid. Both extracts demonstrated antimicrobial activity with 0.02 to 0.35 mg/mL as antibacterials, 0.03 to 2.17 mg/mL as antifungals, and 0.04 to 0.42 mg/mL as antibacterials. Compared to Neem crude extract, Neem Ag-NPs had the lowest MIC values as antibacterials and antifungals at 0.05 to 0.07 mg/mL and 0.07 to 0.20 mg/mL, respectively. Neem Ag-NPs and crude extract boost antioxidant and antibacterial properties.
1. Introduction
Azadirachta indica (Neem) is a rapidly growing evergreen tree commonly found in India, Africa, and America. Because of its medicinal characteristics, it has been used in Ayurvedic medicine for over 4000 years [1]. A heated water extract of the flower and leaf is administered orally to treat hysteria and used remotely to treat wounds. Diabetes is treated using dried flowers. High-temperature water extract from dried fruits treats skin diseases and ulcers locally and remotely. Because of their insecticidal characteristics, leaves are maintained long with woolen and other materials. To reduce heat, leaves are used as a poultice, and their mixture is used as a clean wash to aid in healing wounds and ulcers [2]. Neem oil strengthens hair, improves the liver’s capacity, detoxifies the blood, and manages blood glucose levels. Neem leaves have been used to treat skin inflammation such as eczema, and Azadirachtin is the most important and important ingredient in Neem [2].
It has also been reported that HPLC examination of Neem leaves revealed the presence of different phenolic acids and flavonoids in Neem leaf aqueous extract. They discovered rutin at 0.78 g/mg DW, gallic acid at 5.31 g/mg DW, and caffeic acid at 0.01 g/mg DW. It has also been observed that Neem leaves include chlorogenic acid, cinnamic acid, ferulic acid, naringenin, taxifolin, kaempferol, and vanillin, which could explain the involvement of Neem leaf extracts in many biological activities [3]. The cell-reinforcing effect has been attributed to medicinal herbs [4]. At the start of several illnesses, free radicals or re-oxygenic species are one of the main culprits. Regardless, the balancing of radicals’ excessive movement is one of the key advances in disease anticipation. Cancer prevention drugs settle/deactivate radical extremists regularly before they attack target bio-cells [5] and play a part in beginning an antioxidative catalyst that controls the harm caused by free radicals/responsive oxygen species.
Significant research was done to assess in vitro cancer prevention agent movement in various crude extracts of the leaves of Azadirachta indica (Neem), and the cell reinforcement limit of different unrefined extracts was as per the following: chloroform > butanoic > ethyl acetate > hexane > methanolic separates. The effect of the current finding proposed that the chloroform crude extracts of Neem could be utilized as a characteristic cell reinforcement [6]. An investigation proved that the Azadirachta indica leaves had an antibacterial ability against some foodborne pathogenic bacteria, which likewise cause Ophthalmic contamination [7], for example, Staphylococcus aureus, Staphylococcus pyogenes, Escherichia coli, and Pseudomonas aeruginosa. The leaf extracts of Azadirachta indica (Neem) were screened for antifungal action against various dermatophytes, Trichophyton, and Epidermophyton floccosum, and they indicated high capability in hindering these organisms [8]. Nanoparticles have shown controlled properties of dynamic fixing discharge and moderate debasement, making them more effective in controlling plant infection and vermin [9], indicating an increment in the surface territory. Silver is a metal utilized in applications extending from traditional to gastronomy [10]. In this research, Neem green-chemically synthesized Ag-NPs and Neem crude aqueous extract were the same synthesized and characterized Ag-NPs and crude extract obtained in our latest study [3,11].
The current work set out to compare the efficacy of green-chemically synthesized Ag-NPs as antimicrobial agents to that of both successive leaf extracts and crude extracts, as well as to determine which contained the highest levels of polyphenolic load and antioxidant activity in Neem leaves. Different Neem successive extracts of varying polarity were used against many bacterial and fungal strains or in other antioxidant assays to determine which extracts had the greatest antimicrobial efficacy across the board. This study also looked at the antioxidant potential of these extracts at varying concentrations to identify the extract with the lowest total cost.
2. Materials and Methods
2.1. Processing of Plant Samples
Neem was procured from a government nursery located on the Cairo-Fayoum Road. The botanical specimens were identified at the Department of Pharmacology, National Research Centre (NRC) Herbarium. The voucher number is not available. The plant components were subjected to a triple washing process using distilled water, followed by the removal of excess water through exportation. Subsequently, the plant specimens were weighed and desiccated within a controlled environment featuring active insulation and ambient temperature conditions spanning fourteen days. The dried specimens were weighed and subsequently pulverized with a grinder. The fine powder samples were preserved in air-tight canisters shielded from light and kept at a temperature of −20 °C until they were utilized for subsequent procedures.
2.2. Successive Extraction
The granulated plant material of Neem leaves, weighing 100 g, was obtained through successive extractions using solvents with varying degrees of polarity. The solvents used were Hexane with a relative polarity value of 0.01, followed by Petroleum ether 0.117, ethyl acetate 0.228, absolute ethanol 0.654, and water 1.00. The extractions were carried out with continuous stirring in a shaker. All extracts, except for the aqueous extract, underwent purification by utilizing Whatman No. 1 filter paper. The filtrates were subjected to concentration at a temperature of 40 °C under reduced pressure utilizing a rotary vacuum evaporator (RE 400 with RE 400 DB, Stuart, 8 mbar, 230 V 50–60 Hz, Flow rate 181/min) and subsequently preserved in glass vials. The obtained semi-solid extracts were preserved in the refrigerator until their subsequent utilization. The aqueous filtrate underwent purification by utilizing the Buchner funnel, followed by centrifugation, and ultimately subjected to the freeze-drying apparatus for dehydration.
2.3. Antioxidant Activity of Neem Leaves
2.3.1. Total Phenolic Content (TPC) Analysis
Total phenolic content was quantified by utilizing the Folin–Ciocalteu reagent [12] with minor adjustments. At the outset, a quantity of four milligrams of plant extracts was measured, and subsequently, each non-polar extract was solubilized in a significant quantity of DMSO. The final volume was then adjusted to 2 mL using double distilled water. Multiple stocks of the plant extracts were then prepared, each with a concentration of 2000 μg/mL. A volume of 0.5 mL of extracts was combined with an equal volume of Folin–Ciocalteu reagent (0.33 M), followed by adding 2 mL of sodium carbonate (8 g Na2CO3/40 mL) to the resulting mixture. The mixture was then incubated in the dark at room temperature for 90 min. The experiments were conducted in triplicate. The spectrophotometer was utilized to measure the absorbance of the color developed at a wavelength of 650 nm, with the blank re-agent serving as the reference. The standard curve preparation involved the dissolution of 1 milligram of gallic acid (GA) in 10 milliliters of distilled water. A series of dilutions were performed on the stock standard solution, with gallic acid being utilized at concentrations ranging from 10 to 100 μg/mL. The overall phenolic content was quantified by denoting the amount in micrograms of gallic acid equivalent per gram of dry extract (μg of GAE/g of extract).
2.3.2. Total Flavonoid Content (TFC) Analysis
Determining flavonoid contents in each plant extract was done using the aluminum chloride colorimetric method with minor adjustments [12]. At the outset, a quantity of four milligrams of plant extracts was measured and subsequently dissolved in a substantial volume of DMSO, with each non-polar extract being treated in this manner. The resulting solution was then made up to a total volume of two milliliters with double distilled water. Following this, multiple stocks of the plant extracts were prepared, each with a concentration of 2000 micrograms per milliliter. A volume of 0.5 mL of extracts was introduced into a set of test tubes, and the experiment was conducted in triplicate. Subsequently, 0.5 mL of distilled water was added to each test tube. The test tubes were vortexed and administered 0.3 mL of sodium nitrite (1 g NaNO2/20 mL). The test tubes were vortexed again and left to stand for 5 min at ambient temperature. A volume of 0.3 mL of a solution containing aluminum chloride (2 g AlCl3/20 mL) was uniformly dispensed into each test tube. The contents of the test tubes were then thoroughly mixed using a vortex mixer and left to stand undisturbed at ambient temperature for 5 min. Each test tube was treated with 2 mL of a 1 M NaOH solution, followed by thorough vortexing. The test tubes were then incubated in a dark environment at room temperature for 15 min. Subsequently, the spectrophotometer was utilized to measure the absorbance of the developed color against the blank reagent at a wavelength of 510 nm. A concentration range of 100:1000 μg/mL was employed for Quercetin as a standard. The quantification of the overall phenolic content was denoted in units of micrograms of Quercetin equivalent per gram of dry extract, abbreviated as μg of QE/g of extract.
2.3.3. (2,2-diphenyl-1-picrylhydrazyl DPPH Radical Scavenging Protocol)
The DPPH scavenging capacity of Neem leaves extract was evaluated using a method slightly modified from a previous study [13]. Various concentrations of Neem extracts were prepared in multiple small bottles with volumes ranging from 0.2 mL to 1.0 mL. Each small bottle was supplemented with methanol to achieve a total volume of 1 mL, followed by thorough vortexing of all the bottles. A volume of 0.1 mL was extracted from each bottle and transferred into a set of test tubes. The analysis was conducted in triplicate. Each test tube was supplemented with 0.9 mL of methanol. A 1 mL methanolic solution of 0.1 mM DPPH was introduced to successive extracts of Neem leaves. The test tubes were subjected to vortexing once more, followed by a 30-min incubation period in the absence of light at ambient temperature. The spectrophotometric measurement of the absorbance of the resultant color produced by the reaction with the blank reagent was conducted at a wavelength of 517 nm. BHT was employed as a conventional antioxidant. The capacity to scavenge DPPH radical was assessed utilizing the subsequent equation:
As (A⁰ is -ve Ctrl absorption and A¨ is sample absorption).
2.3.4. (2,2′-Azinobis (3-ethylebenzothiozoline-6-sulphonic Acid) ABTS Radical Scavenging Protocol)
The ABTS scavenging capacity of successive extracts of Neem leaves was evaluated using a slightly modified method [14]. Multiple successive dilutions of Neem extracts were prepared in vials of varying sizes (0.2 mL, 0.4 mL, 0.6 mL, 0.8 mL, and 1.0 mL). A 1 mL volume was achieved in each small bottle by adding ethanol and thoroughly vortexing all bottles. A volume of 0.1 mL was extracted from each bottle and transferred into a set of test tubes. The analysis was conducted in triplicate. Each test tube was supplemented with 0.9 mL of ethanol. The ABTS ethanolic solution was synthesized through the reaction of 7 mM ABTS aqueous solution and 2.45 mM K2S2O8, commonly known as potassium per-sulfate, under dark conditions for approximately 16 h at room temperature. The reagent solution underwent dilution in ethanol resulting in an absorption value of (0.7 ± 0.02) at 734 nm. A volume of 2 mL of ABTS ethanolic solution was introduced into each test tube, followed by vortexing. The test tubes were then allowed to stand in the dark at ambient temperature for 30 min. The spectrophotometer was utilized to determine the absorption of the color observed against the blank reagent, measured at a wavelength of 734 nm. BHT was employed as a conventional antioxidant. The ability to scavenge the ABTS radical was assessed utilizing the subsequent equation:
As (A⁰ is -ve Ctrl absorption and A¨ is sample absorption).
2.3.5. Fe3+ Reducing Antioxidant Power (FRAP) Protocol
The antioxidant potential of successive extracts of Neem leaves was evaluated through Fe3+ reduction [15]. The FRAP reagent was synthesized by combining TPTZ and ferric chloride in 300 mM acetate buffer with a ratio of 10:1:1 for samples. TPTZ was first dissolved in 10 mM HCl to achieve a concentration of 10 mM TPTZ. The resulting reagent was prepared at a pH of 3.6. Various serial dilutions of plant extracts were generated in vials of varying sizes, including 0.1 mL, 0.2 mL, 0.4 mL, and 0.8 mL. Deionized water that had undergone distillation was introduced into individual small bottles to achieve a total volume of 1 mL. The small bottles were then subjected to thorough vortexing. A volume of 0.1 mL was extracted from each bottle and transferred to a set of test tubes. The analysis was conducted in triplicate. A volume of 0.9 mL was introduced into the successive extracts of Neem leaves, followed by thorough vortexing of all the test tubes. Subsequently, a volume of 2 mL of FRAP reagent was introduced into each of the test tubes. The contents of the test tubes were thoroughly mixed using a vortex mixer and subsequently allowed to incubate in the dark at ambient temperature for 30 min. The spectrophotometer was utilized to estimate the absorption of the color developed against the blank reagent at a wavelength of 593 nm. The equation for FRAP value can be expressed as:
2.4. Crude Aqueous Extraction and Green-Chemically Synthesis and Characterization of Ag-NPs from Neem
The methodology employed in this study involved using neem crude aqueous extraction and green-chemically synthesized Ag-NPs, as previously described in our earlier research [3]. The aqueous extract of Neem was procured through the utilization of de-ionized water. The sample underwent filtration through a Buchner funnel and centrifugation at 6000 revolutions per minute. Subsequently, the sample was subjected to freeze-drying to achieve complete desiccation. The study describes a novel approach for synthesizing green-chemically Ag-NPs. The method involves the preparation of a crude Neem extract under low-temperature conditions (80–90 °C) with a concentration of 10% using Milli Q water. The resulting extract is then combined with a mixture of 1 mM AgNO3 and 1 mM NaBH4 in a ratio of 1:2:3 [Under heating Neem crude extract (100 g powdered Neem/L) + 1 mM AgNO3 + 1 mM NaBH4], respectively, to produce the Ag-NPs. The Ag-NPs synthesized through green chemistry methods underwent characterization through various techniques, including UV–VIS, Zeta potential, particle size, and TEM analysis.
2.5. Antimicrobial Activity of Neem Leaves
2.5.1. Tested Microorganisms
A study was conducted to investigate the inhibitory properties of Neem extracts on seven strains of bacteria known to cause foodborne illnesses. The study involved the examination of seven bacterial strains, comprising three Gram-positive bacteria, namely, Staphylococcus aureus ATCC 13565, Staphylococcus sciuri 2–6, and Bacillus cereus EMCC 1080, and four Gram-negative bacteria, namely Salmonella enterica SA19992307, Salmonella typhi ATCC 25566, Escherichia coli 0157 H7 ATCC 51659, and Pseudomonas aeruginosa NRRL B-272. The stock cultures were incubated on slant nutrient agar at a temperature of 37 °C for 24 h, after which they were stored in a refrigerator until subsequent utilization. Antifungal testing was conducted using a total of eight species of mycotoxigenic fungi, namely Aspergillus flavus NRR 3357, Aspergillus ochraceus ITAL 14, Aspergillus niger IMI288550, Aspergillus westerdijikia CCT 6795, Aspergillus carbonarius ITAL 204, Aspergillus parasiticus SSWT 2999, Fusarium proliferatum MPVP 328, and Penicillium verrucosum BFE 500. The stock cultures were incubated for 5 days on slant potato dextrose agar (PDA) at a temperature of 25˚C and subsequently stored in a refrigerated environment until subsequent utilization.
2.5.2. Disc Diffusion Technique
A culture of microorganisms was introduced into a tube containing 4 to 5 mL of tryptic soy broth (TSB) from the 24-h incubated slant nutrient agar of each bacterial species. The broth culture is subjected to incubation for 2–6 h at a temperature of 35 °C until the turbidity level matches the standard 0.5 McFarland BaSO4. The conventional turbidity density was evaluated using a spectrophotometer with a wavelength of 625 nm. The sensitivity analysis of Neem extracts was conducted using diverse bacterial cultures, as reported in reference [16]. The nutrient agar was dispensed into Petri dishes in a volume of 20 mL, and bacterial cultures were obtained from TSB using cotton swabs. The discs were carefully transferred onto the seeded plates using sterile forceps. Dimethyl sulfoxide (DMSO) was utilized as a negative control, while Tetracycline at a concentration of 500 µg/mL was employed as a positive control. Subsequently, the plates that had been inoculated were subjected to incubation at a temperature of 37 °C for 24 h. After the incubation period, the clear zone’s diameter, including the disc’s diameter, was measured to represent the inhibition zones.
The fungal strains were cultivated on potato dextrose agar (PDA) and incubated at 25 °C for 5 days. Petri dishes of medium labeled as “YES” were inoculated with 0.05 mL of individual fungal cultures and evenly spread utilizing a sterile L-glass rod. The extract-laden discs were carefully positioned on the seeded plates using sterile forceps. A negative control was executed utilizing DMSO, while a positive control was implemented utilizing the commercially available fungicide Miconazole (1000 units/mL). The plates that underwent injection were incubated for 24 to 48 h at a temperature of 25 °C. Following the experimental period, the antifungal efficacy was evaluated by quantifying the inhibition zone (mm) concerning the targeted fungus, as documented in reference [17]. The experimental treatments were conducted in triplicate, and the results were determined as means of the experimental outcomes.
2.5.3. Determination of Minimum Inhibitory Concentration (MIC)
The determination of MIC was conducted through the utilization of a tube dilution method [18,19]. The bacterial species under investigation were subjected to a 24-h culture, which was subsequently diluted in 10 mL of tryptic soy broth (TSB) using the 0.5 McFarland standard to achieve an inoculum of 108 CFU mL−1. A series of culture tubes containing varying concentrations of Neem extracts ranging from 5000 µg/mL to 10.0 µg/mL were prepared using DMSO. A volume of 0.1 mL of bacterial cell suspension was introduced into each tube, which was then subjected to incubation at 37 °C for 24 h. The growth of inoculum in the broth was determined by measuring the turbidity of the broth. The minimum inhibitory concentration (MIC) was defined as the lowest extract concentration that prevented the test organism’s growth. Microbial inhibition assays were conducted on the fungal samples [20,21]. Neem extracts were dissolved individually at varying concentrations in 0.5 mL of 0.1% Tween 80 (Merck, Darmstadt, Germany). The resulting solutions were then combined with 9.5 mL of PDA that was heated to 45 °C and poured into a 6 cm Petri dish. The plates that were made ready were centrally inoculated with a 3 μL fungal suspension having a concentration of 108 CFU mL−1 and conforming to the 0.5 McFarland standard. The plates were subjected to incubation at a temperature of 25 °C for 24–48 h.
2.6. Statistical Analysis
The experimental procedures in this investigation involved processing all assessments in triplicate, and the resulting data were presented as the mean value accompanied by the standard error. The statistical analysis was conducted using the Web Agri Stat Package (WASP) at the ICAR: Central Coastal Agricultural Research Institute. The IC50 value was determined through the utilization of described relations. The study employed one-way variation analysis (ANOVA) to examine inter-group differences. The least significant difference (LSD) test was utilized with a significance level of 5% (p < 0.05) [22].
3. Results
3.1. Polyphenolic Burden in Neem Leaves Successive Extracts
Plants synthesize diverse secondary metabolites, among which the phenolic compounds represent a prominent class. The quantification of the total phenol content (TPC) and the total flavonoid content (TFC) of Neem leaves successive extracts was conducted, as illustrated in Figure 1. The Neem plant exhibited varying levels of total phenol content (µg/g GAE) across different extracts, with the petroleum ether extract showing the lowest concentration at 22.69 µg/g and the ethanolic extract exhibiting the highest concentration at 52.57 µg/g. The ethyl acetate extract also showed a significant 42.52 µg/g concentration. The ethanolic, ethyl acetate and aqueous extracts exhibited a higher concentration of total phenol content, indicating the presence of polar phenolic compounds. However, there was no statistically significant difference in the total phenol content between the hexane and petroleum ether extracts. The Neem plant exhibited a range of total flavonoid content, expressed in Quercetin equivalents, with values ranging from 146.07 µg/g in the petroleum ether extract to 774.73 µg/g in the aqueous extract. The aqueous extract exhibited superior outcomes to the ethanolic and ethyl acetate extracts, with recorded values of 582.07 and 521.40 µg/g, respectively. The petroleum ether extract exhibited the lowest concentration of flavonoids at 146.07 µg/g, while the hexane extract displayed a significantly higher concentration of 480.07 µg/g.
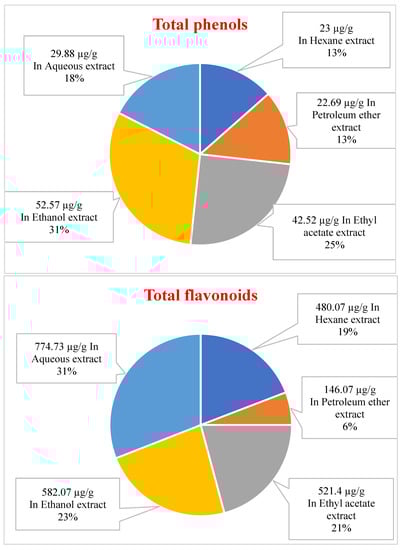
Figure 1.
The total amount of plant phenols content (µg/g plant extract as Gallic acid equivalent) and plant flavonoid content (µg/g plant extract as Quercetin equivalent) of different extracts from Neem.
3.2. Antioxidant Activity of Neem Leaves
3.2.1. DPPH and ABTS Radical Scavenging Activity of Neem Successive extracts
The results in Table 1 showed Neem different extracts’ DPPH radical scavenging activity. The DPPH scavenging free radical percent ranged from 45.03% at 200 µg/mL to 55.82% at 1000 µg/mL with IC50 463.35 µg/mL in hexane extract, to 44.15% at 200 µg/mL and 80.10% at 1000 µg/mL with IC50 281.03 µg/mL for ethanolic extract, where the DPPH scavenging free radical percent of BHT standard ranged from 76.81% at 200 µg/mL to 95.98% at 1000 µg/mL.

Table 1.
Neem successive extracts scavenging activity using DPPH assay.
The results in Table 2 showed Neem different extracts’ ABTS radical scavenging activity. The ABTS scavenging free radical percent ranged from 4.18% at 200 µg/mL to 52.69% at 1000 µg/mL with IC50 991.31 µg/mL in petroleum ether extract, to 25.06% at 200 µg/mL and 74.61% at 1000 µg/mL with IC50 608.5 µg/mL for ethanolic extract, where the ABTS scavenging free radical percent of BHT standard ranged from 47.36% at 200 µg/mL to 93.58% at 1000 µg/mL with IC50 240.04 µg/mL.
Table 2.
Neem successive extracts scavenging activity using ABTS assay.
3.2.2. Ferric Reducing Antioxidant Power of Neem Successive Extracts
The results in Table 3 showed the FRAP value (µM) of Neem successive extracts. The FRAP value (µM) ranged from 2.89 µM at 100 µg/mL to 18.79 µM at 800 µg/mL in hexane extract, to 8.36 µM at 100 µg/mL and 57.87 µM at 800 µg/mL within the ethanolic extract, where the FRAP value (µM) of ascorbic acid standard ranged from 72.8 µM at 100 µg/mL to 139.97 µM at 800 µg/mL.
Table 3.
FRAP value (µM) of Neem successive extracts.
3.3. Characterization of Green-Chemically Synthesized Ag-NPs from NEEM
According to the preparation and characterization of green-chemically Ag-NPs from Neem in our latest research by Solaiman et al. (2020), it was clear that the UV–VIS spectrum of Neem-synthesized Ag-NPs gave a maximum absorbance at 436 nm after 24 h of incubation in the dark, the average diameter of them was 70.36 d.nm, and they were negatively charged as zeta potential value was about −12.6 mV. Ag-NPs ranged from 8.34–13.7 nm in size and were spherical [3] in shape according to electron micrographs by TEM.
3.4. Antimicrobial Activity of Neem Leaves
3.4.1. Antimicrobial Activity of Neem Leaves’ Successive Extracts
The antibacterial and antifungal activities of Neem extracts against foodborne pathogenic bacteria and mycotoxigenic fungi were reported by Disc Diffusion Method, and the results are shown in Table 4 and Table 5. After noting the performance and the ability of extracts of a polar nature while measuring the antioxidant ability of different Neem extracts, especially the ethanolic and aqueous extracts, the ability of these extracts against different microbes was followed, taking it as the primary measure to which the power of the rest of the extracts against the different pathogenic bacterial and fungal strains was attributed. The successive leaf extracts of Neem also showed different abilities to inhibit the growth of the pathogenic bacterial and fungal strains, as shown in Table 4 and Table 5. B. cereus, Staph. sciuri, Staph. aureus and E. coli have been highly inhibited by ethyl acetate extract with an inhibition zone of 12.16, 11.5, 11.33, and 11 mm, respectively. The contribution of the non-polar extracts acting as a high antibacterial agent was shown in petroleum ether against P. aeruginosa with an inhibition zone of 9.5 mm, and the aqueous and ethanolic extracts came at the back of the arrangement with an inhibition zone of 12.5 and 11.16 mm against S. typhi and S. enterica, respectively. Although the high polarity extracts of the Neem plant (aqueous and ethanolic extracts) have shown little contribution as antibacterial agents compared to the less polar ethyl acetate extract, aqueous and ethanolic extracts showed a great ability to inhibit the growth of mycotoxigenic fungi like A. flavus, A. parasiticus, A. niger, A. westerdijikia, and P. verrucosum, which were inhibited by aqueous extract with an inhibition zone of 8.5, 9.17, 9.33, 10.33, and 9.83 mm, respectively. A. flavus and A. parasiticus have been inhibited by ethanolic extract, which has also shown great ability as an antifungal agent like aqueous extract. They were inhibited with an inhibition zone of 8.5 and 9 mm, respectively.
Table 4.
Antibacterial activity of Neem successive extracts against different bacterial strains by Disc Diffusion Method.
Table 5.
Antifungal activity of Neem successive extracts against different fungal strains by Disc Diffusion Method.
As illustrated in Figure 2, the hexane extract of Neem exhibited effects within the range of 0.67 to 1.83 mg/mL, and no notable distinction was observed among various concentrations concerning all food-borne pathogenic bacteria. The extract from petroleum ether exhibited the most substantial efficacy against E. coli, with a minimum inhibitory concentration (MIC) of 0.83 mg/mL. Staphylococcus aureus was inhibited at a MIC of 0.75 mg/mL, while the most potent activity with the lowest MIC value of 0.04 mg/mL was observed against Bacillus cereus. The ethyl acetate extract exhibited the most significant activity against Pseudomonas aeruginosa, with a minimum inhibitory concentration (MIC) value of 0.18 mg/mL. The second highest activity was observed against Salmonella typhi, with a MIC value of 0.33 mg/mL.
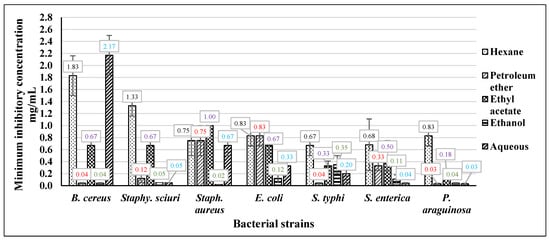
Figure 2.
The MIC of Neem different extracts against foodborne pathogenic bacteria.
Conversely, the lowest activity was observed against Staphylococcus aureus, with the highest MIC value of 1 mg/mL. The ethanolic extract of Neem exhibited notable efficacy against various foodborne pathogenic bacteria, with activity levels ranging from 0.02 mg/mL to 0.35 mg/mL. Notably, no significant variance in effectiveness was observed across the diverse concentrations tested. The aqueous extract demonstrated notable activity against Pseudomonas aeruginosa and Salmonella enterica, exhibiting values of 0.03 mg/mL and 0.04 mg/mL, respectively. Conversely, the extract displayed the least activity against Bacillus cereus, with a recorded value of 2.17 mg/mL.
As depicted in Figure 3, the Neem hexane extract exhibited considerable efficacy, with its impact spanning from 0.03 mg/mL to 0.27 mg/mL, and no discernible variation was observed across different concentrations against all mycotoxigenic fungi. The results obtained from the petroleum ether extract indicated that the maximum MIC value was recorded at 0.83 mg/mL against A. carbonarius. However, the most potent activity with the lowest MIC value was observed at 0.04 mg/mL against A. westerdijikia. The ethyl acetate extract exhibited the greatest activity level against F. proliferatum, as indicated by a minimum inhibitory concentration (MIC) value of 0.12 mg/mL. A. carbonarius and P. verrucosum also displayed notable activity, with a MIC value of 0.42 mg/mL. Conversely, the least activity was observed against A. parasiticus, with a MIC value of 1.33 mg/mL. The ethanolic extract exhibited notable efficacy against various mycotoxigenic fungi, with effects ranging from 0.04 mg/mL to 0.12 mg/mL. Notably, no significant differences were observed between the diverse concentrations tested.

Figure 3.
The MIC of Neem different extracts against mycotoxigenic fungi.
3.4.2. Antimicrobial Activity of Neem Green-Chemically Synthesized Ag-NPs and Neem Crude Aqueous Extract
In our latest research [3], Ag-NPs were prepared in a newly developed method using the under-heating crude aqueous extract of Neem, 1 mM AgNO3 solution, and 1 mM NaBH4 solution as a chemical reductant but in 50% of the concentration, it is used within chemical methods to synthesize nanoparticles. Green-chemically obtained Ag-NPs were characterized by different analytical devices such as; UV–VIS spectroscopy, TEM, FTIR, and Zeta potential and particle size distribution. The green-chemically synthesized Ag-NPs were spherical (8.34–13.7 nm), well-sized (70.36 d.nm), negatively charged (−12.6 mV), and the FTIR spectra showed many functional groups of different phytochemical constituents which were involved in the process of Ag-NPs. These Ag-NPs obtained by the newly developed green-chemical method were tested as antioxidant and anti-inflammatory agents and compared to the crude aqueous extract from Neem.
In this current study, the antimicrobial activity of the previously synthesized and characterized Ag-NPs (the same ones), the different successive extracts, and the crude aqueous extract of the Neem plant all were tested as antimicrobial agents to identify the antimicrobial activity of them parallelly with the antioxidant and anti-inflammatory activities that were estimated [3]. The antibacterial and antifungal activities of Neem crude aqueous extract and Neem-synthesized Ag-NPs against different pathogenic bacterial and fungal strains were reported by Disc Diffusion Method, and the results were represented in Table 6 and Table 7. After noting the performance and the ability of extracts of a polar nature while measuring the ability of different Neem successive extracts as antioxidants and antimicrobial agents, especially the aqueous extract because it was the most commercial one, crude aqueous extraction was performed, and Ag-NPs were prepared from the under heating aqueous extract from Neem in a new developed green-chemically method, to follow the ability of the synthesized Ag-NPs and crude aqueous extract compared to the successive polar extracts, especially successive aqueous extract from Neem. The determination was performed against different foodborne pathogenic bacteria and different mycotoxigenic fungi.
Table 6.
Antibacterial activity of Neem crude aqueous extract and Neem-synthesized Ag-NPs against different bacterial strains by Disc Diffusion Method.
Table 7.
Antifungal activity of Neem crude aqueous extracts and Neem-synthesized Ag-NPs against different fungal strains by Disc Diffusion Method.
The study found that the crude leaf aqueous extract from Neem did not elicit significant variations in the responses of different strains. The maximum inhibition was observed against P. aeruginosa, with an inhibition zone of 9 mm, while the minimum inhibition was observed against E. coli, with an inhibition zone of 7 mm. The synthesized Ag-NPs from Neem exhibited superior inhibitory properties against various foodborne pathogenic bacteria compared to Neem crude aqueous extract. The response of diverse bacterial strains to the Ag-NPs was similar, with the highest inhibition observed against P. aeruginosa, resulting in an inhibition zone of 12.17 mm, and the lowest inhibition observed against Staph. aureus resulting in an inhibition zone of 9.67 mm. The study observed that among the Gram-positive foodborne pathogenic bacteria utilized, P. aeruginosa exhibited the highest level of sensitivity.
The study found that various mycotoxigenic fungi responded similarly to the crude leaf aqueous extract derived from Neem. Notably, the highest level of inhibition was observed in A. parasiticus, A. niger, and F. proleferatum, with an identical inhibition zone of 8.33 mm. Conversely, the lowest inhibition zone was recorded in A. flavus, which measured 7.25 mm. The silver nanoparticles (Ag-NPs) derived from Neem demonstrated superior inhibitory properties compared to the crude aqueous extract of Neem in suppressing the growth of various mycotoxigenic fungi. Among the fungi tested, A. westerdijikia exhibited the highest degree of inhibition by the Ag-NPs from Neem, with an inhibition zone measuring 17.25 mm. A. flavus also displayed a notable inhibition zone, albeit less significant, measuring 12.67 mm.
The findings of this investigation, as illustrated in Figure 4, indicate that Neem Ag-NPs exhibit the most potent activity against foodborne pathogenic bacteria. This is evidenced by their lowest minimum inhibitory concentration (MIC) values ranging from 0.05 mg/mL to 0.07 mg/mL. Furthermore, there is no discernible variation in the responses of diverse foodborne pathogenic bacterial strains to the various concentrations of Neem Ag-NPs. The aqueous extract obtained from Neem leaves exhibited varying minimum inhibitory concentration (MIC) values against different bacterial strains. The MIC values of the Neem crude aqueous extract ranged from 0.15 mg/mL to 0.83 mg/mL.
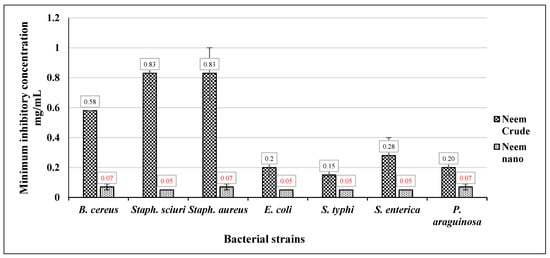
Figure 4.
The MIC of Neem crude aqueous extract and Neem Ag-NPs against foodborne pathogenic bacteria.
As shown in Figure 5, Neem Ag-NPs showed the highest activity against the mycotoxigenic fungi, as they had the lowest MIC values, but it was noticed that the response of the foodborne pathogenic bacterial strains to Neem Ag-NPs was higher than the mycotoxigenic fungi. Neem Ag-NPs showed the highest effect against the different strains of mycotoxigenic fungi, with MIC values ranging from 0.07 mg/mL to 0.2 mg/mL. The crude leaf aqueous extract from Neem showed high activity as the MIC values of Neem crude leaf aqueous extract ranged from 0.42 mg/mL to 1.17 mg/mL, but that activity was much fewer than the Neem Ag-NPs.
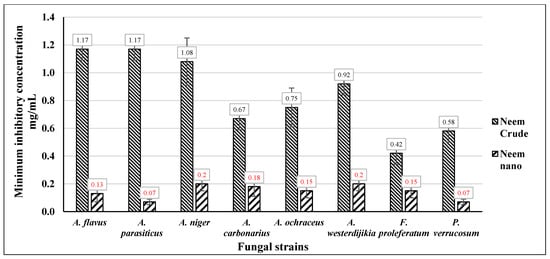
Figure 5.
The MIC of Neem crude aqueous extract and Neem Ag-NPs against mycotoxigenic fungi.
4. Discussion
The previous results of total flavonoid content suggested the presence of many polar compounds in Neem. It has been reported that the total phenolic content in the methanolic extract of Neem leaves was 4.9 mg GAE/g [23], and these results were much higher than those determined in polar extracts like ethanolic and aqueous in the current study. They also determined a relatively high amount of total flavonoid content in an acetone–water extract with 2.6 mg QE/g, which was much higher than the determined flavonoid content in non-polar extracts like hexane and petroleum ether of the current study. In our latest research [3], we reported that the HPLC analysis of Neem leaves indicated the presence of various phenolic acids and flavonoids in the aqueous extract of Neem leaves. We found rutin, chlorogenic acid, gallic acid, caffeic acid, cinnamic acid, ferulic acid, naringenin, taxifolin, kaempferol, and vanillin. The compound with the highest proportion in the crude aqueous extract of Neem was rutin with 8457.88 µg/g, followed by gallic acid with 1396.71 µg/g, and the previous findings proved that the polar extracts of Neem leaves were rich in phenolics compounds which explained the different biological role of Neem leaf different extracts and also the synthesized Ag-NPs using the reducing power of the phytoconstituents of this plant.
DPPH and ABTS are spectrophotometric move-based electron examines utilized to gauge a cell reinforcement’s capacity to lessen an oxidant whose tone was changed if decreased. The level of variety in color (either an ascent or a fall in the assimilation of the example at a particular wavelength) was connected with the cell reinforcement (antioxidant) consistency in the sample. As indicated by the DPPH examination, the current investigation detailed that all extracts of Neem demonstrated free radicals restraining impact to a certain degree. Their particular capabilities were most likely from various phytochemicals, which responded with various free radicals in one unique way. In DPPH and ABTS examination, various leaves’ extracts were utilized, which were thought to have a more drawn-out life expectancy contrasted with other plant parts and being the site of energy creation along these lines face a high size of oxidative harm, required more prominent cancer prevention agent producing and their capacity to go about as a shield [24]. Additionally, various solvents with different polarities have been used, which probably extracted different classes of compounds. Ethanolic and aqueous extracts exhibited the highest radical scavenging activity, followed by ethyl acetate extract in both samples. Previous studies have suggested Neem extracts from polar solvents were likely to exhibit increased antioxidant activity [25]. This study revealed that the DPPH and ABTS radical scavenging activities found a dose–response relationship; the activity increased as the concentration increased for various extracts from Neem.
FRAP examination decides the capacity of the plant extract to take ferric particles down shorthand. The improvement in assimilation at 593 nm is due to the arrangement of the color identified with the ferrous-tripyridyltriiazine (TPTZ) part from the oxidizable colorless ferric particles employing the activity of cell reinforcement (antioxidant) offering electrons [26]. Various solvents with different polarities were used, so they could probably extract diverse compounds that could act as reductants. Aqueous and ethanolic extracts exhibited the highest potency to reduce ferric ions, followed by ethyl acetate extract. A long distance from polar solvents’ extracts will come to the nonpolar ones, and it was thought that this low ability of nonpolar solvents’ extracts to reduce ferric ions because the most phytochemical burden of these yields was considered fatty molecules [3].
Looking at the results of DPPH, ABTS, and FRAP together, it was noticed that the differences in the extracts’ antioxidant potency could be related to differences found in the polyphenolic composition [24]. The extracts’ cell reinforcement intensity was appraised based on two integral measures, specifically the decrease of the potency and the antiradical activity. It has been noticed that extracts obtained from leaves contain fundamentally unique polyphenolic molecules, which permitted them to respond indistinguishably from these three tests and yield exceptionally corresponding results [26]. In particular, the high antiradical activity of ethanolic and aqueous extracts in Neem may be explained by the higher concentration of flavanol because flavanols were known to be exceptionally cancer prevention agents in a few frameworks [27]. Their content was significantly correlated with anti-radical activity, but the association with reduction of power was not consistent [28]. Other studies showed that the different types of flavanols (monomers; type of dimers) significantly affected DPPH’s scavenging free radical efficiency, suggesting flavanol dimers to be more effective than monomers [29], it was also with ABTS. Therefore, blended outcomes could not be governed by synergism or opposition between the diverse polyphenols processed in the extracts [30]. Because of the recovery of a compound with a higher oxidation potential, to the detriment of another compound with a fewer oxidation potential, the adversarial manifestation of antagonistic effects [3,31] was also shown by the donation of H atoms. Mixing effects of pure antioxidants [32] or antioxidants in combination with extracts [31] were reported in the same section and were based on a reduction in strength estimation.
An elevated risk in bacterial strains resistant to many antimicrobials requires renewed efforts and experiments to find efficient antimicrobial agents against these different pathogenic bacteria resistant to or less susceptible to current and conventionally known antibiotics [32]. Many plants have been empirically researched for antioxidant activities and shown that a wide range of plant products can prevent pathogenic bacterial growth. Many of these agents appear to have distinct mechanisms of action from those of currently used antibiotics [33]. It has been reported that ethanolic and methanolic extracts of A. indica (Neem) were found to show better sensitivity compared to Erythromycin as a currently used antibiotic [34]. Neem (Azadirachta indica) leaves had excellent potential for bioactive components, provided that its extracts played a critical place as very good antibacterial agents, and reported that the plant was useful in justifying the use of these parts of the plant in simple medical care [35]. Neem leaves extracts may be used for medicinal purposes and could be useful for preventing the growth of the Streptococcus sobrinus, which causes [36]. Plant antibiotic principles have undergone various changes in alkaloids, glycosides, flavonoids, and saponins, and these antibiotic concepts are plant defense systems against pathogens [37]. It has been reported that Neem leaf powder ethanolic and methanolic extracts had a high ability to inhibit the growth of different foodborne bacterial strains [38], such as; E. coli, Pseudomonas aeruginosa, Salmonella typimurium, Staph. Aureus, and Bacillus pumillus. Previous results agreed with these results, as Neem leaf powder ethanolic extract had the highest ability to inhibit the growth of different foodborne bacterial strains, as it had the lowest MIC values compared to the other different extracts, which also showed efficient ability as antifungal agents, but fewer than the ethanolic extract. In the current study, it was found that Neem leaf powder ethanolic extracts had the highest ability to inhibit the growth of different mycotoxigenic fungi, as they had the lowest MIC values compared to the other different extracts, especially in the case of aqueous extract, which showed very high antibacterial activity parallel with the ethanolic extract. The antimicrobial activity of Neem leaves may be due to the fact that some alkaloids, terpenoids, flavonoids, tannins, and saponins have often had a therapeutic effect and have been used as medicines and psychoactive substances. Previous active compounds have also been known to be pharmacologically active against liver toxins, cancers, viruses, and other microbes. Antifungal activity Neem leaf powder non-polar extracts have been screened for their contents of large medicinal compounds that have been attributed to microbial pathogens [36,37,38].
The elimination of pathogens in food processing is followed by storage and packing. Several research teams have recently demonstrated that neem leaf extracts, oil, and other plant-based compounds like turmeric and curcumin may be incorporated into food preservation films manufactured from polyethylene or sustainable materials like seaweed [39]. The composite films produced exhibit stability on shelves, can obstruct the infiltration of detrimental ultraviolet light, and demonstrate an improved capacity to combat Candida albicans and various Gram-negative and Gram-positive bacteria and fungi. These findings have been reported by Oyekanmi et al. (2021) and Subbuvel and Kavan (2021) [40,41].
Recent research has demonstrated that A. indica inhibits food-spoiling fungi: The following studies demonstrate that Neem leaves inhibited the production of aflatoxins by Aspergillus parasiticus during long-term rice, wheat, and maize storage [42] (Sultana et al., 2015). Numerous Neem seed, bark, and leaf extracts suppressed three significant potato-spoiling fungi, Aspergillus niger, Fusarium oxyporium, and Pythium spp., by 72–100%, according to Subbuvel et al. (2022) [43]. Hamad et al. (2021) discovered that aqueous neem leaf extract inhibited A. niger and A. parasiticus in vivo while detoxifying aflatoxin B1 and ochratoxin A [44].
The antimicrobial properties of Neem-synthesized Ag-NPs were tested [45] against Gram-negative bacteria E. coli and Gram-positive bacteria Staphylococcus aureus at various concentrations of synthesized Ag-NPs (0, 2.5, 5, and 10 mg/mL). It has been confirmed that there has been a significant drop in the presence of both E. coli and Staph. aureus in case of increasing the concentration of Ag-NPs. At a concentration of 10 mg/mL, Ag-NPs could completely inhibit the growth of Staph. aureus. However, only concentrations of 5 µg/mL and 10 µg/mL of Ag-NPs were enough to completely kill the Staph. Aureus, which was clearly noticed from the complete absence of colonies in the plates. The E. coli showed very few colonies at 10 mg/mL. Hence, the synthesized Ag-NPs from A. indica leaves extract at concentrations of 5 µg/mL and 10 µg/mL could fulfill a good antimicrobial activity against both E. coli and Staph. aureus. Silver nanoparticles are widely used as antimicrobial agents, and their exact inhibition mechanism is still difficult to ascertain. One probable explanation is that silver nanoparticles bind to the cell surface membrane, and the bacterial cells’ respiratory function and permeation become unbalanced [46]. The negatively charged E. coli is easily evacuated by Ag+ ions [47], thereby interrupting enzymatic reactions in the cell surface membrane and contributing positively to the denaturation of protein and cellular damage [48]. Reactive oxygen species (ROS) such as singlet oxygen O2 and hydroxyl radical OH are produced by silver nanomaterials, which are considered toxicants to the bacteria [49].
Regarding this study, a critical point must be declared. The aim of experimenting with different Neem successive extracts of different and varying degrees of polarity against many microbial strains, whether bacterial or fungal; the aim was to investigate the successive extracts in which the positive effect is most common against the largest number of microbial strains, which were the aqueous and ethanolic extracts, emphasizing the possibility that sometimes a greater effect of the hexane, petroleum ether or ethyl acetate extracts was found against one or more of the tested microbial strains. In addition to investigating Neem successive extracts in which the positive effect is most common against the largest number of microbial strains, there was a crucial purpose to reach the least economical cost successive extract, then to use it to produce silver nanoparticles at the lowest possible producing cost. Sometimes, it may be found that the ethanolic extract was more capable and efficient than the aqueous extract in inhibiting free radicals (on an antioxidant level) or inhibiting the growth of different microbes. However, it is still more economically costly than the aqueous extract.
Comparing the results of inhibiting the antibacterial and antifungal strains by Neem different successive extracts, Neem crude aqueous extract and synthesized Ag-NPs, the superiority of aqueous, ethanolic, and ethyl acetate extracts can be observed compared to the less polar ones (hexane and petroleum ether) against most bacterial and fungal strains while emphasizing that in a few times, the superiority of hexane and petroleum ether extracts can be observed against few bacterial and fungal strains. The complete superiority of Neem Ag-NPs compared to Neem crude aqueous extract is also observed. Eventually, the results showed an impressive efficiency for Neem Ag-NPs compared to Neem ethanolic and aqueous extracts against different foodborne pathogenic bacteria and mycotoxigenic fungi. According to MIC results with different bacterial strains, Neem Ag-NPs seem to be more effective than aqueous, ethanolic, and crude extracts. The shared equal contribution of ethanolic and aqueous extracts with Neem Ag-NPS against some bacterial strains cannot be overlooked. In the case of different fungal strains, Neem Ag-NPs shared the same capabilities with ethanolic and aqueous extracts. So, the results showed relatively higher efficiency for Neem Ag-NPs compared to Neem ethanolic and aqueous extracts, especially against different foodborne pathogenic bacteria.
Looking at the results of antibacterial and antifungal activities for Neem crude aqueous extract and synthesized Ag-NPs from Neem, it is thought that the antibacterial activity of the crude aqueous extract against different Gram-positive and negative foodborne pathogenic bacteria was caused by affecting the growth, survival, and cell permeability of these bacteria, as the activity showed by the crude extracts may be related to some extent differences found in the polyphenolic composition of the crude extracts, which may have allowed some molecules in and kept other molecules out. On the other side, the antifungal activity of the crude extract may be caused by inhibiting the growth of mycelia and conidial accessibility through some of the extents of phytochemical constituents. It was suggested that through interactions with the cell membrane, these specific molecules induced the production of ROS and caused cell death in the fungi [50]. According to the synthesized Ag-NPs from Neem, several researchers have described that Ag-NPs can engage with the surface of bacterial membranes and modify membrane permeability, invade bacterial cells, converse with ion channels and modulate enzymes, cause dramatic misconfigurations, or penetrate cells that produce Ag+ ions, which can lead to ROS production, triggering cell damage [50]. Additionally, Neem Ag-NPs released silver ions in bacterial cells, which increased their bactericidal activity. The activity of Ag-NPs may be related to the preferred attack of the electron transport chain by Ag-NPs, a cell differentiation that consequently leads to cell death. Metal decomposition could induce [51] the development of randomly oriented pits in the extracellular matrix and alter the permeation due to the progressive release of lipopolysaccharides and protein complexes, or maybe the loss of DNA replication and affirmation of ribosomal subunits proteins in the case of foodborne pathogenic bacteria, and could also cause chaos in the progress of fungal mycelia growth and conidial viability.
5. Conclusions
The present study aimed to assess the antioxidant potential of various successive extracts obtained from Neem leaves using three distinct protocols, namely, DPPH, ABTS, and FRAP. The study’s findings indicated that the successive polar extracts from Neem leaves exhibited a substantial amount of total phenolics and flavonoids, which could be attributed to their diverse biological activities. The findings indicate a positive correlation between the concentration of the extract and its antioxidant activity. The study investigated the antimicrobial properties of various successive extracts obtained from Neem leaves, including crude aqueous extract and synthesized Ag-NPs. Results indicated that successive polar extracts exhibited greater antimicrobial activity than non-polar ones. The antimicrobial efficacy of green-synthesized Ag-NPs was superior to that of raw extracts.
Furthermore, it was observed that Neem Ag-NPs demonstrated greater antimicrobial activity compared to Neem crude extract. The results of our study suggest that under certain conditions, synthesized silver nanoparticles (Ag-NPs) derived from Neem have the potential to be utilized in various biomedical applications. This is in comparison to other Neem extracts, including successive extracts and crude aqueous extract, due to the significant cytotoxicity exhibited by the synthesized Ag-NPs at the highest concentrations. Neem has much potential as a therapeutic agent for bacterial illnesses resistant to standard medical care. According to the existing research, it will be crucial to conduct further research using animal models to determine whether Neem-based products are compatible with current antibiotic regimens or are effective as stand-alone treatments.
Author Contributions
Conceptualization, M.A., M.A.-S.A. and K.D.; methodology, software, validation, formal analysis, investigation, M.A., D.A.M. and K.D.; resources, Z.T.; data curation, writing—original draft preparation, M.A. and M.A.-S.A.; writing—review and editing, K.D. and Z.T.; visualization, M.A.; supervision, N.M.A., E.A.M. and K.D.; resources, Z.T. and K.D.; project administration, Z.T.; funding acquisition, Z.T. All authors have read and agreed to the published version of the manuscript.
Funding
This research received no external funding.
Data Availability Statement
All data are available within the manuscript.
Conflicts of Interest
The authors declare no conflict of interest.
Abbreviations
| ABTS | 2,2′-azinobis (3-ethylebenzothiozoline-6-sulphonic acid |
| Ag-NPs | Silver nanoparticles |
| BHT | Butylated hydroxyl toluene |
| CFU | Colony forming unit |
| DMSO | Dimethyl sulfoxide |
| DPPH | 2,2′-diphenyl-1-picrylhydrazyl |
| FRAP | Ferric reducing antioxidant power |
| GAE | Gallic acid equivalents |
| HPLC | High-performance liquid chromatography |
| LSD | Least significant difference |
| MIC | Minimum inhibitory concentration |
| PDA | Potato dextrose agar |
| QE | Quercetin equivalents |
| ROS | Reactive oxygen species |
| SE | Standard error |
| TEM | Transmission Electron Microscopy |
| TFC | Total flavonoid content |
| TPC | Total phenolics content |
| TPTZ | 2,4,6-tripyridyl-s-triazine |
| TSB | Tryptic soy broth |
| YES | Yeast Extract with Supplements (Medium) |
References
- Kumar, V.S.; Navaratnam, V. Neem (Azadirachta indica): Prehistory to contemporary medicinal uses to humankind. Asian Pac. J. Trop. Biomed. 2013, 3, 505–514. [Google Scholar] [CrossRef]
- Septiyani, R.; Wibowo, C. Identification of Active Compounds and Testing the Antioxidant Properties of Neem Leaf Extract. AIP Conf. Proc. 2019, 2094, 020034. [Google Scholar]
- Solaiman, M.A.; Ali, M.A.; Abdel-Moein, N.M.; Mahmoud, E.A. Synthesis of Ag-NPs Developed by Green-Chemically Method and Evaluation of Antioxidant Activities and Anti-Inflammatory of Synthesized Nanoparticles against LPS-Induced NO in RAW 264.7 Macrophages. Biocatal. Agric. Biotechnol. 2020, 29, 101832. [Google Scholar] [CrossRef]
- Fitzgerald, M.; Heinrich, M.; Booker, A. Medicinal Plant Analysis: A Historical and Regional Discussion of Emergent Complex Techniques. Front. Pharmacol. 2020, 10, 1480. [Google Scholar] [CrossRef] [PubMed]
- Nunes, C.; Barreto, A.M.; Menezes, D.P.S.; Leandro, D.L.; Souza, P.M.; Pereira, D.L.; Vieira, I.; Barros, O.D. Plants as Sources of Anti-Inflammatory Agents. Molecules 2020, 25, 3726. [Google Scholar] [CrossRef] [PubMed]
- Hossain, M.A.W.; Al-Toub, A.S.; Weli, A.; Al-Riyami, Q.A. Identification and Characterization of Chemical Compounds in Different Crude Extracts from Leaves of Omani Neem. J. Taibah Univ. Sci. 2013, 7, 181–188. [Google Scholar] [CrossRef]
- Vashist, H.; Jindal, A. Antimicrobial Activities of Medicinal Plants-Review. Int. J. Pharm. Biomed. Res. 2012, 3, 222–230. [Google Scholar]
- Natarajan, V.; Pushkala, S.; Karuppiah, V.P.; Prasad, P.V. Anti dermatophytic activity of Azardirachta indica (Neem) by invitro study. Indian J. Pathol. Microbiol. 2002, 45, 311–313. [Google Scholar]
- Ahmed, M.; Decsi, K.; Tóth, Z. Different Tactics of Synthesized Zinc Oxide Nanoparticles, Homeostasis Ions, and Phytohormones as Regulators and Adaptatively Parameters to Alleviate the Adverse Effects of Salinity Stress on Plants. Life 2022, 13, 73. [Google Scholar] [CrossRef]
- Singh, A.; Gautam, P.K.; Verma, A.; Singh, V.; Shivapriya, P.M.; Shivalkar, S.; Sahoo, A.K.; Samanta, S.K. Green Synthesis of Metallic Nanoparticles as Effective Alternatives to Treat Antibiotics Resistant Bacterial Infections: A Review. Biotechnol. Rep. 2020, 25, 00427. [Google Scholar] [CrossRef]
- Ahmed, M.; Marrez, D.A.; Abdelmoeen, N.M.; Mahmoud, E.A.; Abdel-Shakur Ali, M.; Decsi, K.; Tóth, Z. Proximate Analysis of Moringa Oleifera Leaves and the Antimicrobial Activities of Successive Leaf Ethanolic and Aqueous Extracts Compared with Green Chemically Synthesized Ag-NPs and Crude Aqueous Extract against Some Pathogens. Int. J. Mol. Sci. 2023, 24, 3529. [Google Scholar] [CrossRef]
- Khan, M.; Khan, Y.S.; Rafatullah, M.; Sarjadi, M.; Razlan, M. Determination of Total Phenolic Content, Total Flavonoid Content and Antioxidant Activity of Various Organic Crude Extracts of Licuala Spinosa Leaves from Sabah, Malaysia. ASM Sci. J. 2018, 11, 53–58. [Google Scholar]
- Wright, R.J.; Lee, K.S.; Hyacinth, H.I.; Hibbert, J.M.; Reid, M.E.; Wheatley, A.O.; Asemota, H.N. An Investigation of the Antioxidant Capacity in Extracts from Moringa Oleifera Plants Grown in Jamaica. Plants 2017, 6, 48. [Google Scholar] [CrossRef] [PubMed]
- Liang, L.; Cai, S.; Gao, M.; Chu, X.; Pan, X.; Gong, K.; Xiao, C.; Chen, Y.; Zhao, Y.; Wang, B.; et al. Purification of Antioxidant Peptides of Moringa Oleifera Seeds and Their Protective Effects on H2O2 Oxidative Damaged Chang Liver Cells. J. Funct. Foods 2019, 64, 103698. [Google Scholar] [CrossRef]
- Xu, Y.B.; Chen, G.L.; Guo, M.Q. Antioxidant and Anti-Inflammatory Activities of the Crude Extracts of Moringa Oleifera from Kenya and Their Correlations with Flavonoids. Antioxidants 2019, 8, 296–318. [Google Scholar] [CrossRef] [PubMed]
- Bauer, A.W.; Kirby, W.M.; Sherris, J.C.; Turck, M. Antibiotic Susceptibility Testing by a Standardized Single Disk Method. Am. J. Clin. Pathol. 1966, 45, 493–496. [Google Scholar] [CrossRef]
- Medeiros, M.; Oliveira, D.; Rodrigues, D.; Freitas, D. Prevalence and antimicrobial resistance of Salmonella in chicken carcasses at retail in 15 Brazilian cities. Rev. Panam. Salud Public 2011, 30, 555–560. [Google Scholar] [CrossRef]
- Marrez, D.A.; Naguib, M.; Sultan, Y.Y.; Higazy, A.M. Antimicrobial and Anticancer Activities of Scenedesmus Obliquus Metabolites. Heliyon 2019, 5, 01404. [Google Scholar] [CrossRef]
- Wiegand, I.; Hilpert, K.; Hancock, R.E. Agar and broth dilution methods to determine the minimal inhibitory concentration (MIC) of antimicrobial substances. Nat. Protoc. 2008, 3, 163–175. [Google Scholar] [CrossRef]
- Marrez, D.; Sultan, Y. Antifungal Activity of the Cyanobacterium Microcystis Aeruginosa against Mycotoxigenic Fungi. J. Appl. Pharm. Sci. 2016, 6, 191–198. [Google Scholar] [CrossRef]
- Perrucci, S.; Macchioni, F.; Cecchi, F.; Cioni, P.L.; Morelli, I.P.; Pampiglione, S. Acaricidal Activity of Aqueous Extracts of Camomile Flowers, Matricaria Chamomilla, against the Mite Psoroptes Cuniculi. Med. Veter. Entomol. 2004, 18, 205–207. [Google Scholar]
- Grech, V. WASP (Write a Scientific Paper): Advanced Statistical Analyses. Early Hum. Dev. 2018, 123, 37–38. [Google Scholar] [CrossRef] [PubMed]
- Biney, E.; Nkoom, M.; Darkwah, W.K.; Puplampu, J. High-Performance Liquid Chromatography Analysis and Antioxidant Activities of Extract of Azadirachta Indica (Neem) Leaves. Pharmacogn. Res. 2020, 12, 29–34. [Google Scholar]
- Sulastri, E.; Zubair, M.; Anas, N.; Abidin, S.; Hardani, R.; Yulianti, R.A.; Aliyah. Total Phenolic, Total Flavonoid, Quercetin Content and Antioxidant Activity of Standardized Extract of Moringa Oleifera Leaf from Regions with Different Elevation. Pharmacogn. J. 2018, 10, 104–108. [Google Scholar] [CrossRef]
- Al Akeel, R.; Mateen, A.; Janardhan, K.; Gupta, V.C. Analysis of Anti-Bacterial and Antioxidative Activity of Azadirachta Indica Bark Using Various Solvents Extracts. Saudi J. Biol. Sci. 2017, 24, 11–14. [Google Scholar] [CrossRef]
- Bedlovicova, Z.; Strapáč, I.B.M.; Salayová, A. A Brief Overview on Antioxidant Activity Determination of Silver Nanoparticles. Molecules 2020, 25, 3191. [Google Scholar] [CrossRef]
- Makris, D.P.; Boskou, G.; Andrikopoulos, N.K. Polyphenolic Content and in Vitro Antioxidant Characteristics of Wine Industry and Other Agri-Food Solid Waste Extracts. J. Food Compos. Anal. 2007, 20, 125–132. [Google Scholar] [CrossRef]
- Panche, A.N.; Diwan, A.D.; Chandra, S.R. Flavonoids: An overview. J. Nutr. Sci. 2016, 5, 47. [Google Scholar] [CrossRef]
- Karvela, E.; Makris, D.P.; Kalogeropoulos, N.; Karathanos, V.T.; Kefalas, P. Factorial Design Optimization of Grape (Vitis Vinifera) Seed Polyphenol Extraction. Eur. Food Res. Technol. 2009, 229, 731–742. [Google Scholar] [CrossRef]
- Villaño, D.; Fernández-Pachón, M.; Moyá, M.; Troncoso, A.; García-Parrilla, M. Radical Scavenging Ability of Polyphenolic Compounds towards DPPH Free Radical. Talanta 2007, 1, 230–235. [Google Scholar] [CrossRef]
- Aoun, M.; Makris, D.P. Binary Mixtures of Natural Polyphenolic Antioxidants with Ascorbic Acid: Impact of Interactions on the Antiradical Activity. Int. Food Res. J. 2012, 19, 603–606. [Google Scholar]
- Karvela, E.; Makris, D.P. Assessment of the Reducing Effects in Mixtures of Grape (Vitis vinifera) Seed Extracts with α-Tocopherol Using Response Surface Methodology. J. Microbiol. Biotechnol. Food Sci. 2012, 2, 771–787. [Google Scholar]
- Salman, M.T.; Khan, R.A.; Shukla, I. Antimicrobial Activity of Nigella Sativa Linn. Seed Oil against Multi-Drug Resistant Bacteria from Clinical Isolates. Nat. Prod. Radiance 2008, 7, 10–11. [Google Scholar]
- Mostafa, A.A.; Al-Askar, A.A.; Almaary, K.S.; Dawoud, T.M.; Sholkamy, E.N.; Bakri, M.M. Antimicrobial Activity of Some Plant Extracts against Bacterial Strains Causing Food Poisoning Diseases. Saudi J. Biol. Sci. 2018, 25, 361–366. [Google Scholar] [CrossRef]
- Saradhajyothi, K.; Subbarao, B. Antimicrobial potential of the extracts of the leave of Azadirachta indica, Linn. Nat. Sci. Biol. 2011, 3, 65–69. [Google Scholar]
- Mohashine, B.M.; Michiko, N.S.M.; Tsutomu, S. Antibacterial Effects of the Crude Azadirachta indica Neem Bark Extract on Streptococcus sobrinus. Pediatr. Dent. J. 1997, 7, 61–64. [Google Scholar]
- Hafiza, R.E. Peptides Antibiotics. Lancet 2000, 349, 418–422. [Google Scholar]
- Maragathavalli, S.; Brindha, S.; Kaviyarasi, S.; Annadurai, B.G.; Gangwar, S.K. Antimicrobial Activity in Leaf Extract of Neem. Int. J. Secur. Netw. 2012, 3, 110–113. [Google Scholar]
- Ahmed, W.; Azmat, R.; Khojah, E.; Ahmed, R.; Qayyum, A.; Shah, A.N. The Development of a Green Innovative Bioactive Film for Industrial Application as a New Emerging Technology to Protect the Quality of Fruits. Molecules 2022, 27, 486. [Google Scholar] [CrossRef]
- Ezeonu, C.S.; Tatah, V.S.; Imo, C.; Mamma, E.; Mayel, M.H.; Kukoyi, A.J. Inhibitory Effect of Aqueous and Ethanolic Extracts of Neem Parts on Fungal Rot Disease of Solanum Tuberosum. Pak. J. Biol. Sci. 2019, 22, 206–213. [Google Scholar] [CrossRef] [PubMed]
- Hamad, G.M.; Mohdaly, A.A.A.; El-Nogoumy, B.A.; Ramadan, M.F.; Hassan, S.A.; Zeitoun, A.M. Of Aflatoxin B1 and Ochratoxin A Using Salvia Farinacea and Azadirachta Indica Water Extract and Application in Meat Products. Appl. Biochem. Biotechnol. 2021, 193, 3098–3120. [Google Scholar] [CrossRef]
- Oyekanmi, A.A.; Kumar, U.S.U.; HPS, A.K.; Olaiya, N.G.; Amirul, A.A.; Rahman, A.A.; Nuryawan, A.; Abdullah, C.K.; Rizal, S. Functional Properties of Antimicrobial Neem Leaves Extract Based Macroalgae Biofilms for Potential Use as Active Dry Packaging Applications. Polymers 2021, 13, 1664. [Google Scholar] [CrossRef]
- Subbuvel, M.; Kavan, P. Preparation and Characterization of Polylactic Acid/Fenugreek Essential Oil/Curcumin Composite Films for Food Packaging Applications. Int. J. Biol. Macromol. 2022, 194, 470–483. [Google Scholar] [CrossRef] [PubMed]
- Sultana, B.; Naseer, R.; Nigam, P. Utilization of Agro-Wastes to Inhibit Aflatoxins Synthesis by Aspergillus Parasiticus: A Biotreatment of Three Cereals for Safe Long-Term Storage. Bioresour. Technol. 2015, 197, 443–450. [Google Scholar] [CrossRef]
- Asimuddin, M.; Shaik, M.; Syed, F.; Siddiqui, M.R.; Alwarthan, A.; Jamil, K.; Khan, M. Azadirachta Indica Based Biosynthesis of Silver Nanoparticles and Evaluation of Their Antibacterial and Cytotoxic Effects. J. King Saud Univ. Sci. 2020, 32, 648–656. [Google Scholar] [CrossRef]
- Kvitek, L.; Panacek, A.; Soukupova, J.; Kolar, M.; Vecerova, R.; Prucek, R.; Holecová, M.; Zbořil, R. Effect of surfactant and polymers on stability and antibacterial activity of silver nanoparticles (NPs). J. Phys. Chem. 2008, 112, 5825–5834. [Google Scholar] [CrossRef]
- Gogoi, S.; Gopinath, P.; Paul, A.; Ramesh, A.; Ghosh, S.C.; Chattopadhyay, A. Green Fluorescent Protein-Expressing Escherichia Coli as a Model System for Investigating the Antimicrobial Activities of Silver Nanoparticles. Langmuir 2006, 22, 9322–9328. [Google Scholar] [CrossRef] [PubMed]
- Pal, S.; Tak, Y.K.; Song, J.M. Does the Antibacterial Activity of Silver Nanoparticles Depend on the Shape of the Nanoparticle? A Study of the Gram-Negative Bacterium Escherichia Coli. Appl. Env. Microbiol. 2007, 73, 1712–1720. [Google Scholar] [CrossRef]
- Carlson, C.; Hussein, S.M.; Schrand, A.M. Unique cellular interaction of silver nanoparticles: Size-dependent generation of reactive oxygen species. J. Phys. Chem. B 2008, 112, 13608–13619. [Google Scholar] [CrossRef] [PubMed]
- Batista, A.B.; Oliveira, J.T.; Gifoni, J.M.; Pereira, M.L.; Almeida, M.G. New Insights into the Structure and Mode of Action of Mo-CBP 3, an Antifungal Chitin-Binding Protein of Moringa Oleifera Seeds. PLoS ONE 2014, 9, e111427. [Google Scholar] [CrossRef]
- Dakal, T.C.; Kumar, A.; Majumdar, R.S.; Yadav, V. Mechanistic basis of antimicrobial actions of silver nanoparticles. Front. Microbiol. 2016, 7, 1831. [Google Scholar] [CrossRef] [PubMed]
Disclaimer/Publisher’s Note: The statements, opinions and data contained in all publications are solely those of the individual author(s) and contributor(s) and not of MDPI and/or the editor(s). MDPI and/or the editor(s) disclaim responsibility for any injury to people or property resulting from any ideas, methods, instructions or products referred to in the content. |
© 2023 by the authors. Licensee MDPI, Basel, Switzerland. This article is an open access article distributed under the terms and conditions of the Creative Commons Attribution (CC BY) license (https://creativecommons.org/licenses/by/4.0/).