1. Introduction
The walnut is an edible seed/nut/stone fruit [
1]. It is the primary nut crop of India and was also known by the name “royal nut”. China was the main global producer of walnuts in 2021/2022, with over 1.1 million metric tonnes produced. The United States came in second with around 657.7 thousand metric tonnes of walnut production. The production of India was 36 thousand metric tonnes. The major walnut producer state is Jammu and Kashmir, which contributes 91.16% of the total production of India. The walnut tree is a good source of products, i.e., dried fruit, green walnut, kernels, bark, leaves, and shells, which can be utilized in food, pharmaceutical, and cosmetic industries. Among these, walnut kernels are the most desired application part of the walnut fruit, which is used in the production of biscuits, bread, cakes, etc. [
2,
3]. While processing the nut, the by-product is generated in the form of a walnut hull. However, the walnut hull could be considered a highly futuristic and profitable candidate for phytochemical extraction. A careful processing and detailed investigation of the walnut hull should be considered to utilize value-added compounds. The phytochemical constituents in walnuts and their products possess various biological activities, including laxative, anti-proliferative, anti-bacterial, anti-septic, anti-fungal, anti-cancer, diuretic, antioxidant, anti-inflammatory, and anti-cancer actions [
2,
4,
5,
6].
MAE has been applied to extract several volatile compounds from different raw materials [
7]. The MAE uses a high-energy microwave, which heats the sample rapidly due to the movement of liquid molecules. It enhances the characteristic capillary porosity that results in the interaction of the solvent with the plant cells and, subsequently, releases the substances from the plant cell into the solvent. In previous studies conducted by various research organizations, the MAE technique has unveiled excellent characteristics, such as reduced equipment size, increased extract yield, and reduced thermal gradient [
8]. MAE can extract bioactive compounds more rapidly by reducing the use of an organic solvent which is why it is also known as green technology [
9].
There is limited scientific evidence that walnut hulls can be used to extract phytochemicals. These walnut hulls have a wealth of nutritional benefits that are brought to use for a wide range of applications, including natural food coloring, product development, cosmetics, and biomedical research. In this context, black walnut hull extract could be a useful alternative for enhancing, expanding, and promoting its benefits for future applications. Extraction of natural colors from their origin is the most important stage in natural dye applications as the efficiency of the extraction method strongly influences the color depth and hence the dyeing behavior of the material to which it is used [
10]. With this theory, our research is designed to investigate the use of MAE as a green extraction technique alternative to the conventional extraction process. Furthermore, the extraction condition and parameters of MAE were optimized using RSM statistical model. Additionally, this study categorizes and explains the fundamental aspects of the microwave-assisted extraction method’s operating mechanism, then rates and analyzes them according to how effectively they function. Extractions can be predicted and optimized with the use of mathematical models. The models can give insight into the physical and chemical principles in effect during the extraction process, allowing for more precise control over extraction parameters. This model addresses the interaction between matrix and solvent–solute concentrations and suggested that equilibrium was reached during the extraction process. The rate of extraction was also modeled in the proposed model. The model may be used to find the optimal extraction duration and temperature. By optimizing the yield, quality, and sustainability of the extraction process, mathematical models can lead to more efficient and effective procedures. The novelty of this work is to use the walnut hull waste for the extraction of phytochemicals economically using a method development approach.
2. Material and Methods
2.1. Collection of Raw Materials
Walnut was collected from local shop of the region of Nainital, Uttarakhand, India. The hull was removed by using a razor-sharp knife. The walnut hull was then dried using a Tray drier (SS 96 TRAY DRYER, Material Grade: SS-304) at 50 °C for 24 h. After drying, the walnut hull was subjected to size reduction in the hammer mill equipment (HM-05 stainless steel). The powdered hull sample was further screened using hand sieving to the particle size range of 3 levels viz. 150, 300, and 450 µm (Micrometer). The solvent used for extraction was ethanol. These three samples were then kept in air-tight glass jars until further analyses.
2.2. Chemicals and Equipment
All chemicals used during the experimentation were AR grade, and various equipment used during the study are electronic balance (MSW, 10A/VA Delhi Mettler AE 166), tray drier (Rays scientific instruments), magnetic stirrer (BEXCO, B07N6LM446), microwave oven (Model MC-7148MS), hammer mill (S: G, 1MT/H to 40MT/H), and spectrophotometer (Lasanay LI-2904).
2.3. Response Surface Methodology
The Box–Behnken Design (BBD) of response surface methodology is a combination of mathematical and statistical methods based on the fitting of polynomial equations to experimental data. For the designed experiments, a three-level-three factor BBD was applied to determine and optimize the MAE for extraction of phytochemicals and volatile compounds.
2.4. Experimental Procedure
The microwave-assisted extraction study was carried out in two phases. The initial phase consists of optimizing MAE extraction parameters. The independent variables used for the experiment include microwave power (160, 320, and 480 W), treatment time (2, 3, and 4 min), solvent volume (20, 30, and 40 mL), and particle size of raw material (150, 300, and 450 µm). At various combinations of the independent variables, the four dependent variables were analyzed.
The conventional extraction was carried out in a water bath using standard solvents (distilled water and 50% ethanol, (v/v)), yielding a dried powdered plant material/solvent ratio of 1:20. The extraction time was set at 30 min at 50 °C. After extraction, all samples were centrifuged (6000 rpm, 10 min) in a laboratory centrifuge (LC 320), and the supernatant was collected for further analysis.
Both extracts were evaluated for the following analyses.
2.4.1. Determination of Extraction Yield
The extraction yield (%) measures the solvent’s effectiveness in extracting specific components from the original material and is defined as the quantity of extract recovered in mass relative to the initial amount of sample. It was established for each approach that was examined. The extraction yield was measured by weighing the dry extract after drying [
10]. The yield of the extracted material was estimated as follows:
2.4.2. Determination of Total Phenolic Content (TPC)
The TPC was measured using the Folin–Ciocalteu method, as described by researchers [
7,
11]. The reagent was diluted with distilled water in a ratio of 1:10, and 0.5 mL of each extracted sample was mixed with 2.5 mL of 10% Folin–Ciocalteu reagent. A volume of 2.5 mL of 7.5% sodium carbonate was added to the above-mentioned mixture, and the reaction mixture was left to rest at room temperature for 30 min to acquire blue color. The absorbance of the blue color was measured using a UV-Visible spectrophotometer at 765 nm. The phenolic content was evaluated using Gallic acid as a standard at values ranging from 0 to 20, 40, 60, 80, and 100 g/mL. The total polyphenol content was measured in milligrams of Gallic acid equivalent (GAE) per gram of extract [
7]. Each extract was analyzed in triplicate.
2.4.3. Determination of Total Flavonoid Content
The aluminum chloride colorimetric technique [
7] was modified to estimate flavonoid content. Then, 1 ml of the extract was mixed at room temperature for 30 min with 3 mL of methanol, 0.2 mL of 10% aluminum chloride, 0.2 mL of 1M potassium acetate, and 5.6 mL of distilled water. The same procedure was performed to create a sample blank, but distilled water was substituted for aluminum chloride. The absorbance was measured at 420 nm. The standard was quercetin (1 mg/mL). The standard curve was used to calculate the flavonoid content, which was represented as quercetin equivalent (mg/g of the isolated molecule). Each extract was analyzed in triplicate.
2.4.4. Determination of DPPH Radical Scavenging Activity
An aliquot of 1.5 mL of sample solution was combined with 1.5 mL of methanolic solution of DPPH (0.2 mM) with methanol as a control. The reaction mixture was incubated in the dark at room temperature for 30 min. The absorbance of the resultant solution was measured at 517 nm. Each extract was examined in triplicate [
12]. The DPPH scavenging capability of the tested sample was estimated as follows:
2.5. Second Phase
In the second phase, the optimized results from the 2 extraction methodologies were compared. The thick brown colored filtrate collected after extraction was filled in the centrifuge tubes for centrifugation for further clarification. The filtrate was then centrifuged for 15 min at 8000 rpm. After centrifugation, the slurry (sample + solvent mix) was filtered using Whatman No. 1 filter paper to separate the solid residue and liquid extract. After complete filtration, the solid residue was retained on the filter paper. The filtrate was then stored overnight at 80 °C in a hot air oven for drying to remove moisture. Later, the extract was stored at room temperature in powdered form for further analysis. For the analysis section, apart from three dependent variables, the color strength was also included for quantitative as well as qualitative characteristics of the extract from the walnut hull. GC-MS was performed for the optimized sample to characterize the different compounds present in the walnut hull extract. Scanning Electron Microscopy (SEM) was also conducted for the dried hull powder before extraction, the residue left after the extraction of bioactive compounds, and the residue remaining after the extraction.
2.5.1. Gas Chromatography–Mass Spectrometry (GC-MS)
In this investigation, the GC-MS technique was employed to detect the phyto-components present in the extract [
13]. This extract was GC-MS analyzed with a GC SHIMADZU QP2010 system with a gas chromatograph interfaced to a mass spectrometer (GC-MS) equipped with an Elite-1 fused silica capillary column. SPME (Solid Phase Microextraction) was used to inject the sample. An electron ionization energy system with an ionization energy of 70 eV was used for GC-MS detection. The carrier gas was helium gas (99.999%) at a constant flow rate of 1.51 mL/min and an injection volume of 1 l (split ratio: 10). The temperature of the injector was 240 °C, and the temperature of the ion source was 200 °C. The oven temperature was set to 70 °C (isothermal for 3 min), then increased to 300 °C for 10 min. Mass spectra were collected at 70 eV with a scanning interval of 0.5 s and a scan range of 40–1000 m/z. The total running time for the GC was 45 min. Each component’s relative percentage amount was estimated by comparing its average peak area to the total areas. A GC MS solution ver.2.53 was used to handle mass spectra and chromatograms. Component identification the National Institute of Standards and Techniques (NIST08s), WILEY8, and FAME databases were used to interpret the mass spectrum GC-MS. The unknown component’s spectrum was compared to the known component’s spectrum stored in the NIST08s, WILEY8, and FAME libraries. The name, molecular formula, molecular weight, and structure of the component of the test material were ascertained. Each extract was analyzed in triplicate.
2.5.2. Scanning Electron Microscopy (SEM) Analysis
SEM analysis was conducted to analyze the effect of both extraction techniques on the morphology of the peel. The walnut hull powder samples after extraction by two different methods were observed using SEM for full-form morphological characterization by the method described by [
14]. The powder after extraction was observed using SEM (Quanta 200, FEI company) available in the College of Veterinary Sciences, GBPUAT. Before SEM analysis, powder samples were collected and dried in an oven at 60 °C until a constant mass was attained. Sample particles were fixed to a specified carbon film support, and their shape and surface characteristics were examined using a GSED detector in environmental mode (ESEM). The structural difference can be determined utilizing the SEM images generated following analysis, which were then compared for the structural difference.
2.6. Statistical Data Analysis
The model was created using the response surface approach and the Design Expert 10.0.1 version [Design Expert v12 by Stat-Ease, Inc. (Suite 480, Minneapolis, MN, USA)]. The data were fitted with the complete second-order model given in the following equation, and the model’s adequacy was checked using R2 (coefficient of multiple determination) and Fisher’s F-test. The parametric influence on various responses was achieved by interpreting created models. A second-order response function with four independent variables has the generic formula:
The experimental data were analyzed using multiple regression analysis to construct response functions and acquire variable parameters optimized matching to the best outcomes. The software calculated the values of model coefficients and related statistics, such as lack of fit and p-value. The likelihood of significance is represented by the value of p. A model with lower p-values was deemed superior. Models with p-values less than 0.1 were approved. The influence of independent factors on the answers was graphically analyzed using contour plots. The combination of two independent variables was chosen while the other two remained at their optimal values achieved through numerical optimization. In addition to contour graphs, perturbation graphs are used to visualize the divergence of the independent variables at the optimum point. Experiments were carried out to confirm the ideal findings provided by the Design Expert 10.0.1 program. The optimized values were validated and forecasted, and the actual values were compared to establish the model’s validity and ideal outcomes.
3. Result and Discussion
An intensive study was conducted for process optimization for the extraction of phytochemicals from the walnut hull by employing the microwave extraction technique. The experimental plan was based on the Box–Behnken Design (BBD) of Response Surface Methodology (RSM) to evaluate optimized values, and the experiments were performed accordingly.
This entire study was conducted in two phases. In the first phase, the dried walnut hull powder was used for phytochemical extraction that contains volatile compounds, and the extract was analyzed quantitatively and qualitatively using various responses, such as Extract yield, TPC, TFC, and DPPH Antioxidant activity. In the second phase, the optimized extract sample was qualitatively characterized for GC-MS and SEM analysis for the presence and identification of the volatile compounds.
Experimental data of the extraction study was analyzed statistically, as well as graphically, followed by optimization of independent variables for getting the best results. Regression analysis of variables was obtained employing RSM with BBD for all variables. ANOVA was employed to critically investigate/examine the models. A full second-order model was fitted into each response and was further utilized to interpret the significance of variables in the response. If the model was found adequate, the best-fit equation was generated as a means to draw contour plots to indicate the effect of independent variables on the linear and interactive responses graphically. Finally, conclude with the optimization of different process conditions using software 10.0.1. Optimization was conducted to generate the optimum points of the independent variables for the best possible combinations of independent variables. Furthermore, actual experiments were performed at optimal points and compared with optimized results to verify the model.
3.1. Statistical Analysis of Walnut Hull Extract
Box–Behnken Design (BBD) approach of Response Surface Methodology (RSM) was used for designing experiments. A total of 29 experiments were conducted and analyzed for four responses, which comprised extract yield, Total Phenolic Content (TPC), Total Flavonoid Content (TFC), and DPPH antioxidant activity. Results of the experimental data showing the effect of all independent variables on the responses are presented in
Table 1 and
Table 2. Besides this analysis, the data was optimized for the best results. The optimized sample was further analyzed using Gas Chromatography–Mass Spectrometry (GC-MS) for qualitative analysis identification of the volatile compounds. Scanning Electron Microscopy (SEM) was also conducted for the optimized results of MAE and control.
Table 2 suggests the difference in extract yield for predicted and actual value was 19%, 0.271% for TPC, 0.567% for TFC, and for the antioxidant activity, it was −2.8%. The results of
Table 1 for responses were analyzed numerically, statistically, and graphically. The values of the process parameters in the model were analyzed statistically to check significant effects on the particular responses. The graphical analysis of all the responses, and optimization of the process parameters were carried out. Finally, the optimized data was compared with the actual experiments to check the statistical validation/significance of the model [SPSS version 14.0 (SPSS, Inc., Chicago, IL, USA)].
3.2. Response Surface Methodology Analysis
3.2.1. Extract Yield
Walnut extract yield is the most important responsibility, as is the treasure for all the bioactive compounds. The extract yield obtained ranged from 26.67% to 44.99%, as indicated in
Table 1. The hull sample yielded the highest extract yield of 44.99% when microwave power was set to 320 W, microwave duration was set to 3 min, solvent volume was set to 1:20, and particle size was set to 150 µm. The minimum extraction yield, on the other hand, was obtained under the independent variable conditions of microwave power at 160 W, microwave time at 2 min, solvent volume at 1:30, and particle size at 300 m. When this current study’s extract yield was compared to the previous studies, the extract yield decreased when the period and microwave power was increased [
15].
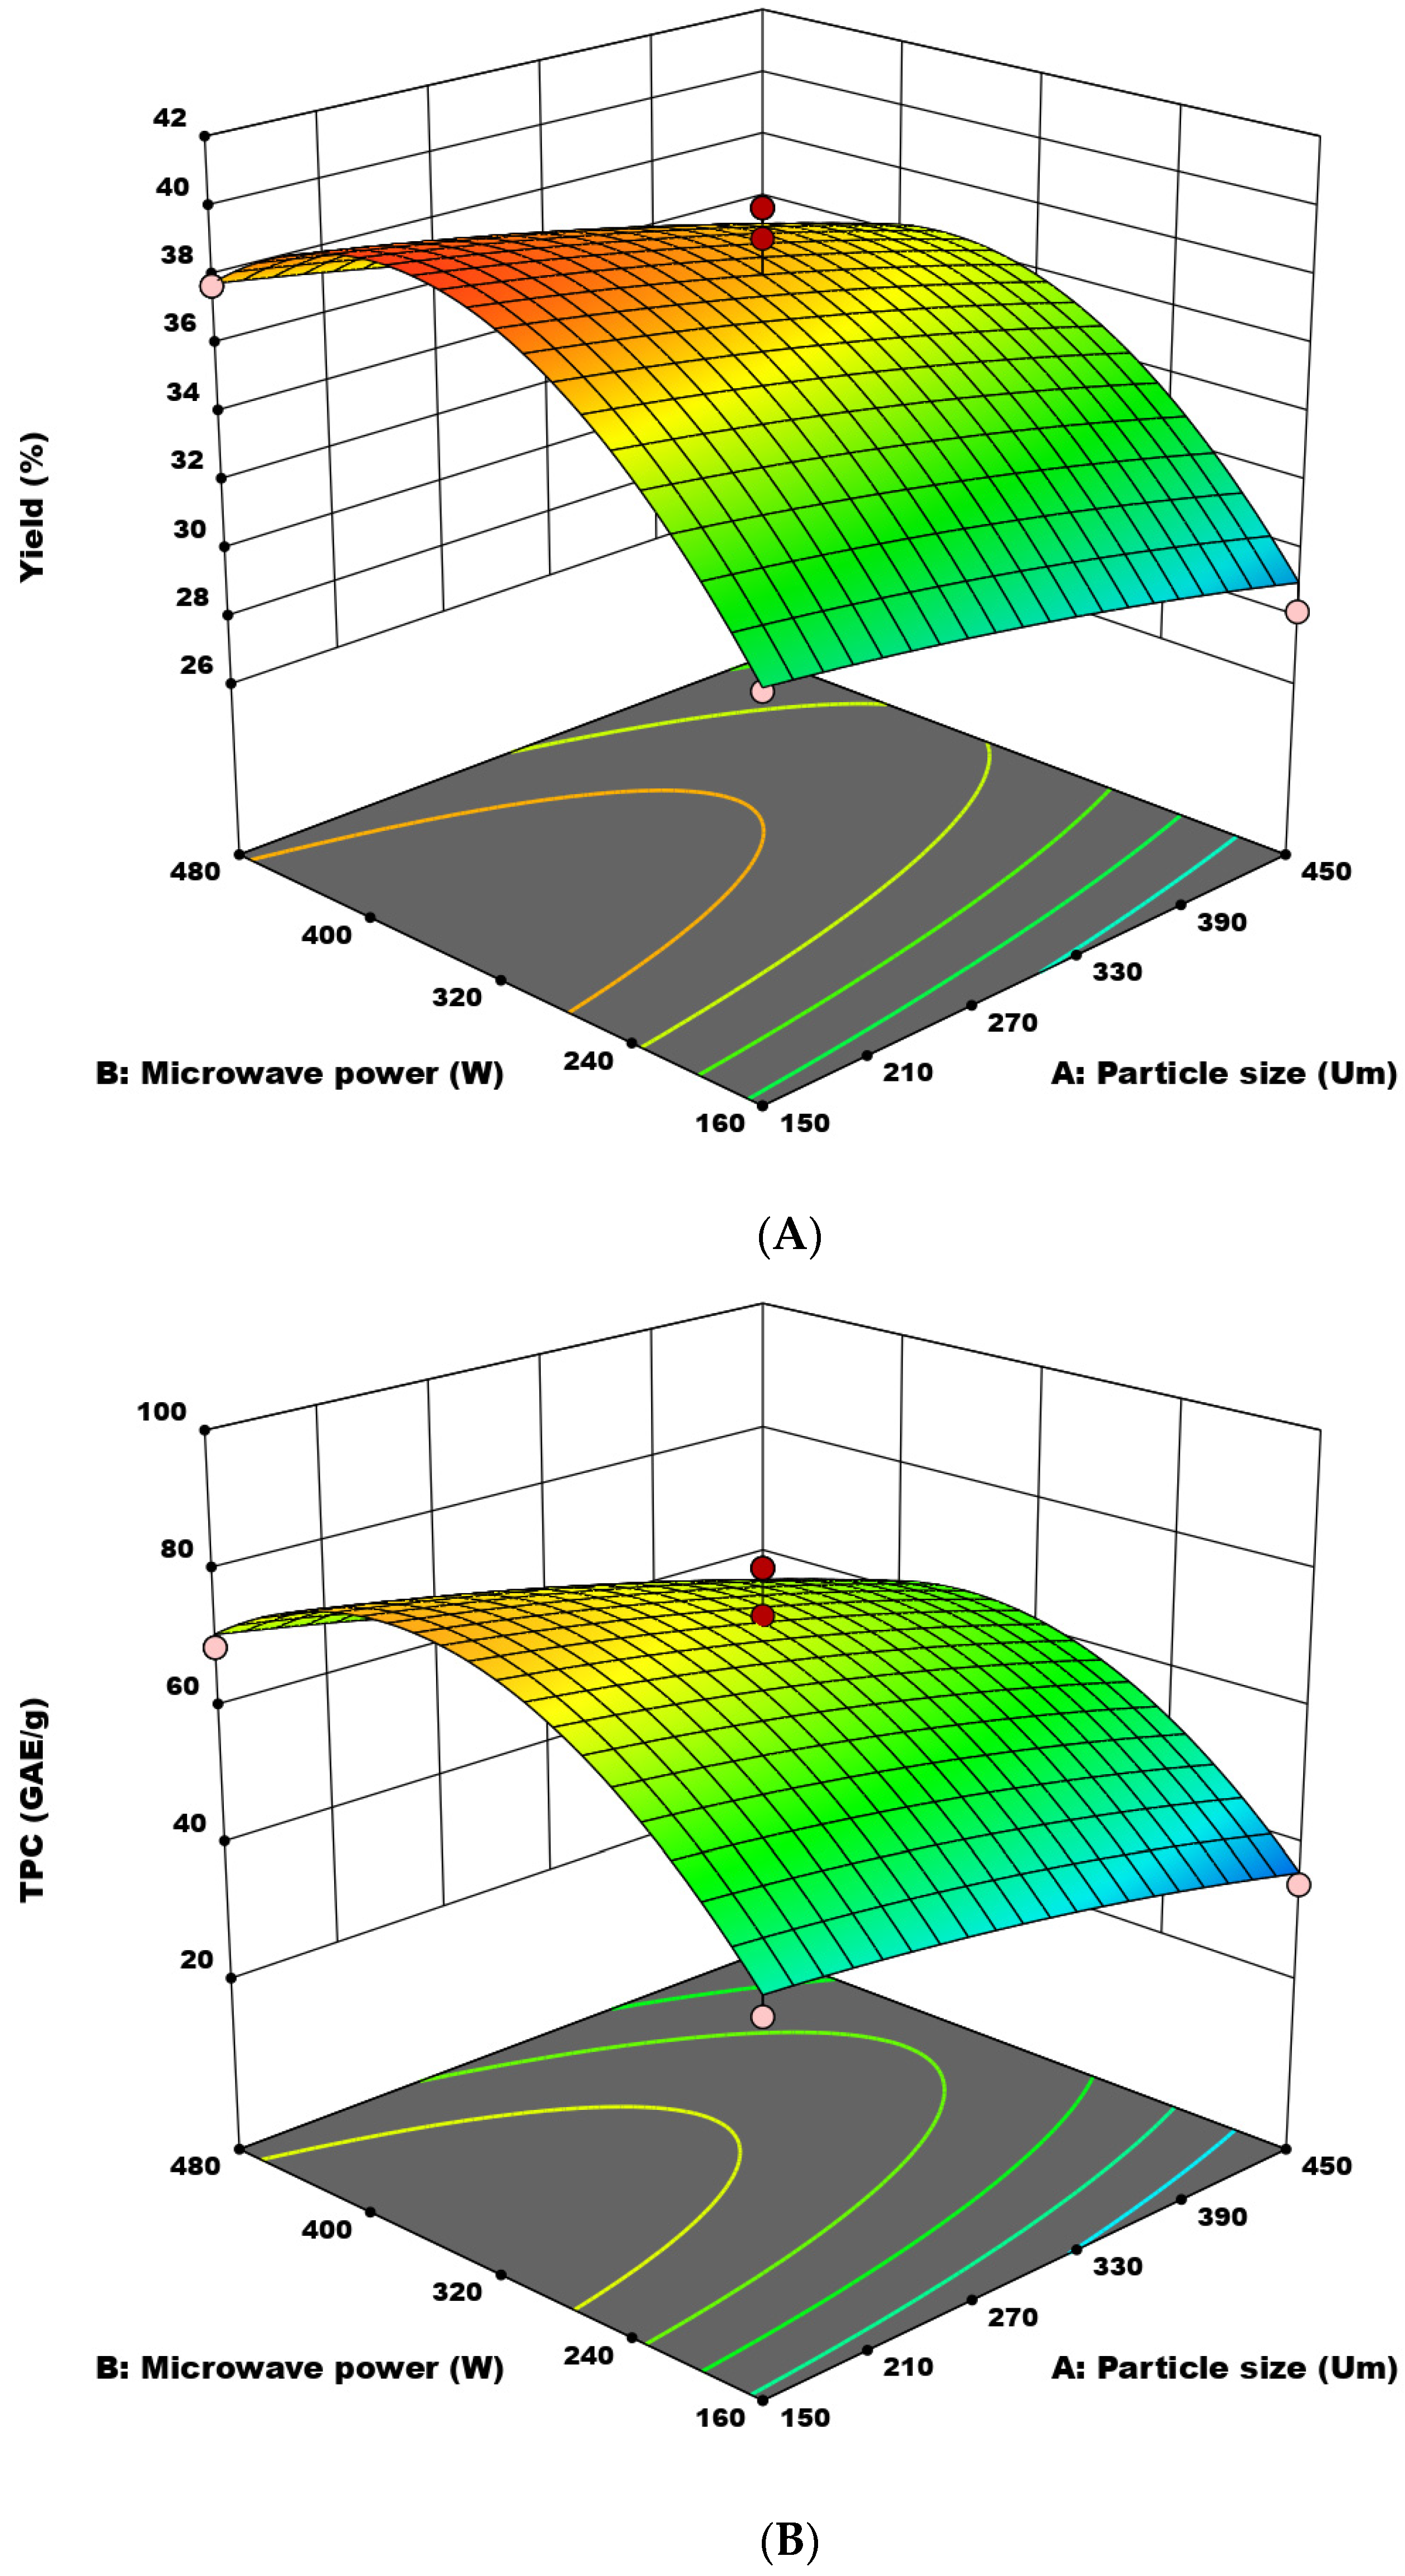
The extract yield increased when microwave power, time, and solid solvent increased, but after a prolonged period, the extract yield started decreasing due to the loss and degradation of components shown in
Figure 1A. The highest extract yield obtained was with 150 µm particle size, and the solid/solvent ratio was 1:40.
The extract yield changes with particle size, and the graph demonstrates that extract yield falls as particle size increases from 150 µm to 450 µm. The bigger the interfacial surface between the solid and the solvent, the greater the rate of material transfer from the sample to the solvent. This is owing to the solvent’s better accessibility over the smaller-sized solute/substrate interface. As a result, the total solvent extraction of dye in microwave processing conditions increases.
The graph illustrates that as microwave power increases, extract yield increases, but as power goes further, total yield drops in the region of 160 W to 480 W. It was shown that extraction power had a beneficial impact on extraction yield. However, extended microwave irradiation may cause deterioration of the extract due to the warming of the solute and solvent combination, according to the same research.
The graph illustrates that extract yield grows with increasing time and decreases with increasing time in subsequent phases, ranging from 2 to 4 min. The center level was determined to have the highest extract yield. Later time intervals resulted in a drop in microwave radiation per particle as solvent volume increased, resulting in a relatively modest dielectric heating effect and, hence, lower microwave radiation efficacy. The extract yield drops when the solid-to-solvent ratio increases from 20 to 40. According to Xing et al. [
16], this is due to the increased solubility of solute particles over a longer period, which reduces the viscosity of the extraction solvent and so accelerates the release and dissolution of these compounds.
3.2.2. Total Phenol Content
Total phenolic content (TPC) is an important responsibility for the assessment of bioactive compounds present in walnut hull extract.
Table 1 shows the results of 29 experimental runs, which were performed as per the combinations given by the software (Design Expert 10.1.1) and their corresponding values for total phenolic content. Total phenol content was expressed in Gallic acid equivalent (mg of Gallic acid/g extract). The TPC obtained, as shown in
Table 1, ranged from 30.68 to 90.07mg GAE/g. The hull sample had a maximum TPC of 90.07% when microwave power was set to 320 W, microwave duration was set to 3 min, solvent volume was set to 1:20, and particle size was set to 150 m. The minimal TPC of 30.68%, on the other hand, was reached under the independent variable circumstances of microwave power at 160 W, microwave duration at 2 min, solvent volume at 1:30, and particle size at 300 µm.
At the linear level, the curve in
Figure 1B demonstrates that total phenolic content declines as particle size increases from 150 µm to 450 µm. The phenolic content increased as particle size decreased, suggesting that an increase in the surface area accessible for molecular transport contributes to a more extensive mass transfer of solutes across phases [
17]. As a result, the better the extraction efficiency and, consequently, the higher the phenol concentration of the resultant extracts, the smaller the particle size of walnut husk powder.
The graph demonstrates that total phenolic content increases as microwave power increases but that overall yield drops as power goes from 160 W to 480 W. This change is because the microwave activity of highly localized heating and pressure could have caused the selective migration of target compounds from the substrate to the solvent at a significant pace with comparable higher downstream processing output [
18]. On the flip side, at higher levels of microwave power supply, the sample experienced increased heating, causing degradation of the essential phenolic extracts. However, extended microwave power exposure may cause deterioration of the extract due to overheating of the solute and solvent combination.
The graph demonstrates that total phenolic content increases with increasing time and declines with increasing duration, ranging from 2 to 4 min. The total phenolic content was found to be optimum at the central level. Longer treatment in the microwave processing unit leads to a greater decrease in the TPC [
19]. Later on, the decrease in microwave radiation per particle for longer time intervals with the extraction media led to a very low dielectric heating effect, thus overall decreasing the effectiveness of microwave radiation.
3.2.3. Total Flavonoid Content
Total Flavonoid Content (TFC) is an important responsibility for the assessment of bioactive compounds present in a walnut hull extract.
Table 1 shows the results of 29 experimental runs, which were performed as per the combinations given by the software (Design Expert 10.1.1) and their corresponding values for total phenolic content. Total flavonoid content was expressed in Quercetin acid equivalent (mg of Quercetin acid/g extract). The TFC obtained, as shown in
Table 1, ranged from 8.98 to 20.06 mg QAE/g. A maximum TFC of 20.06% was recorded from the hull sample under experimental settings of 320 W microwave power, 3 min microwave duration, 1:20 solvent volume, and particle size of 150 µm. The smallest TPC of 8.98%, on the other hand, was attained under the independent variable circumstances of microwave power at 160 W, microwave duration at 2 min, solvent volume at 1:30, and particle size at 300 µm.
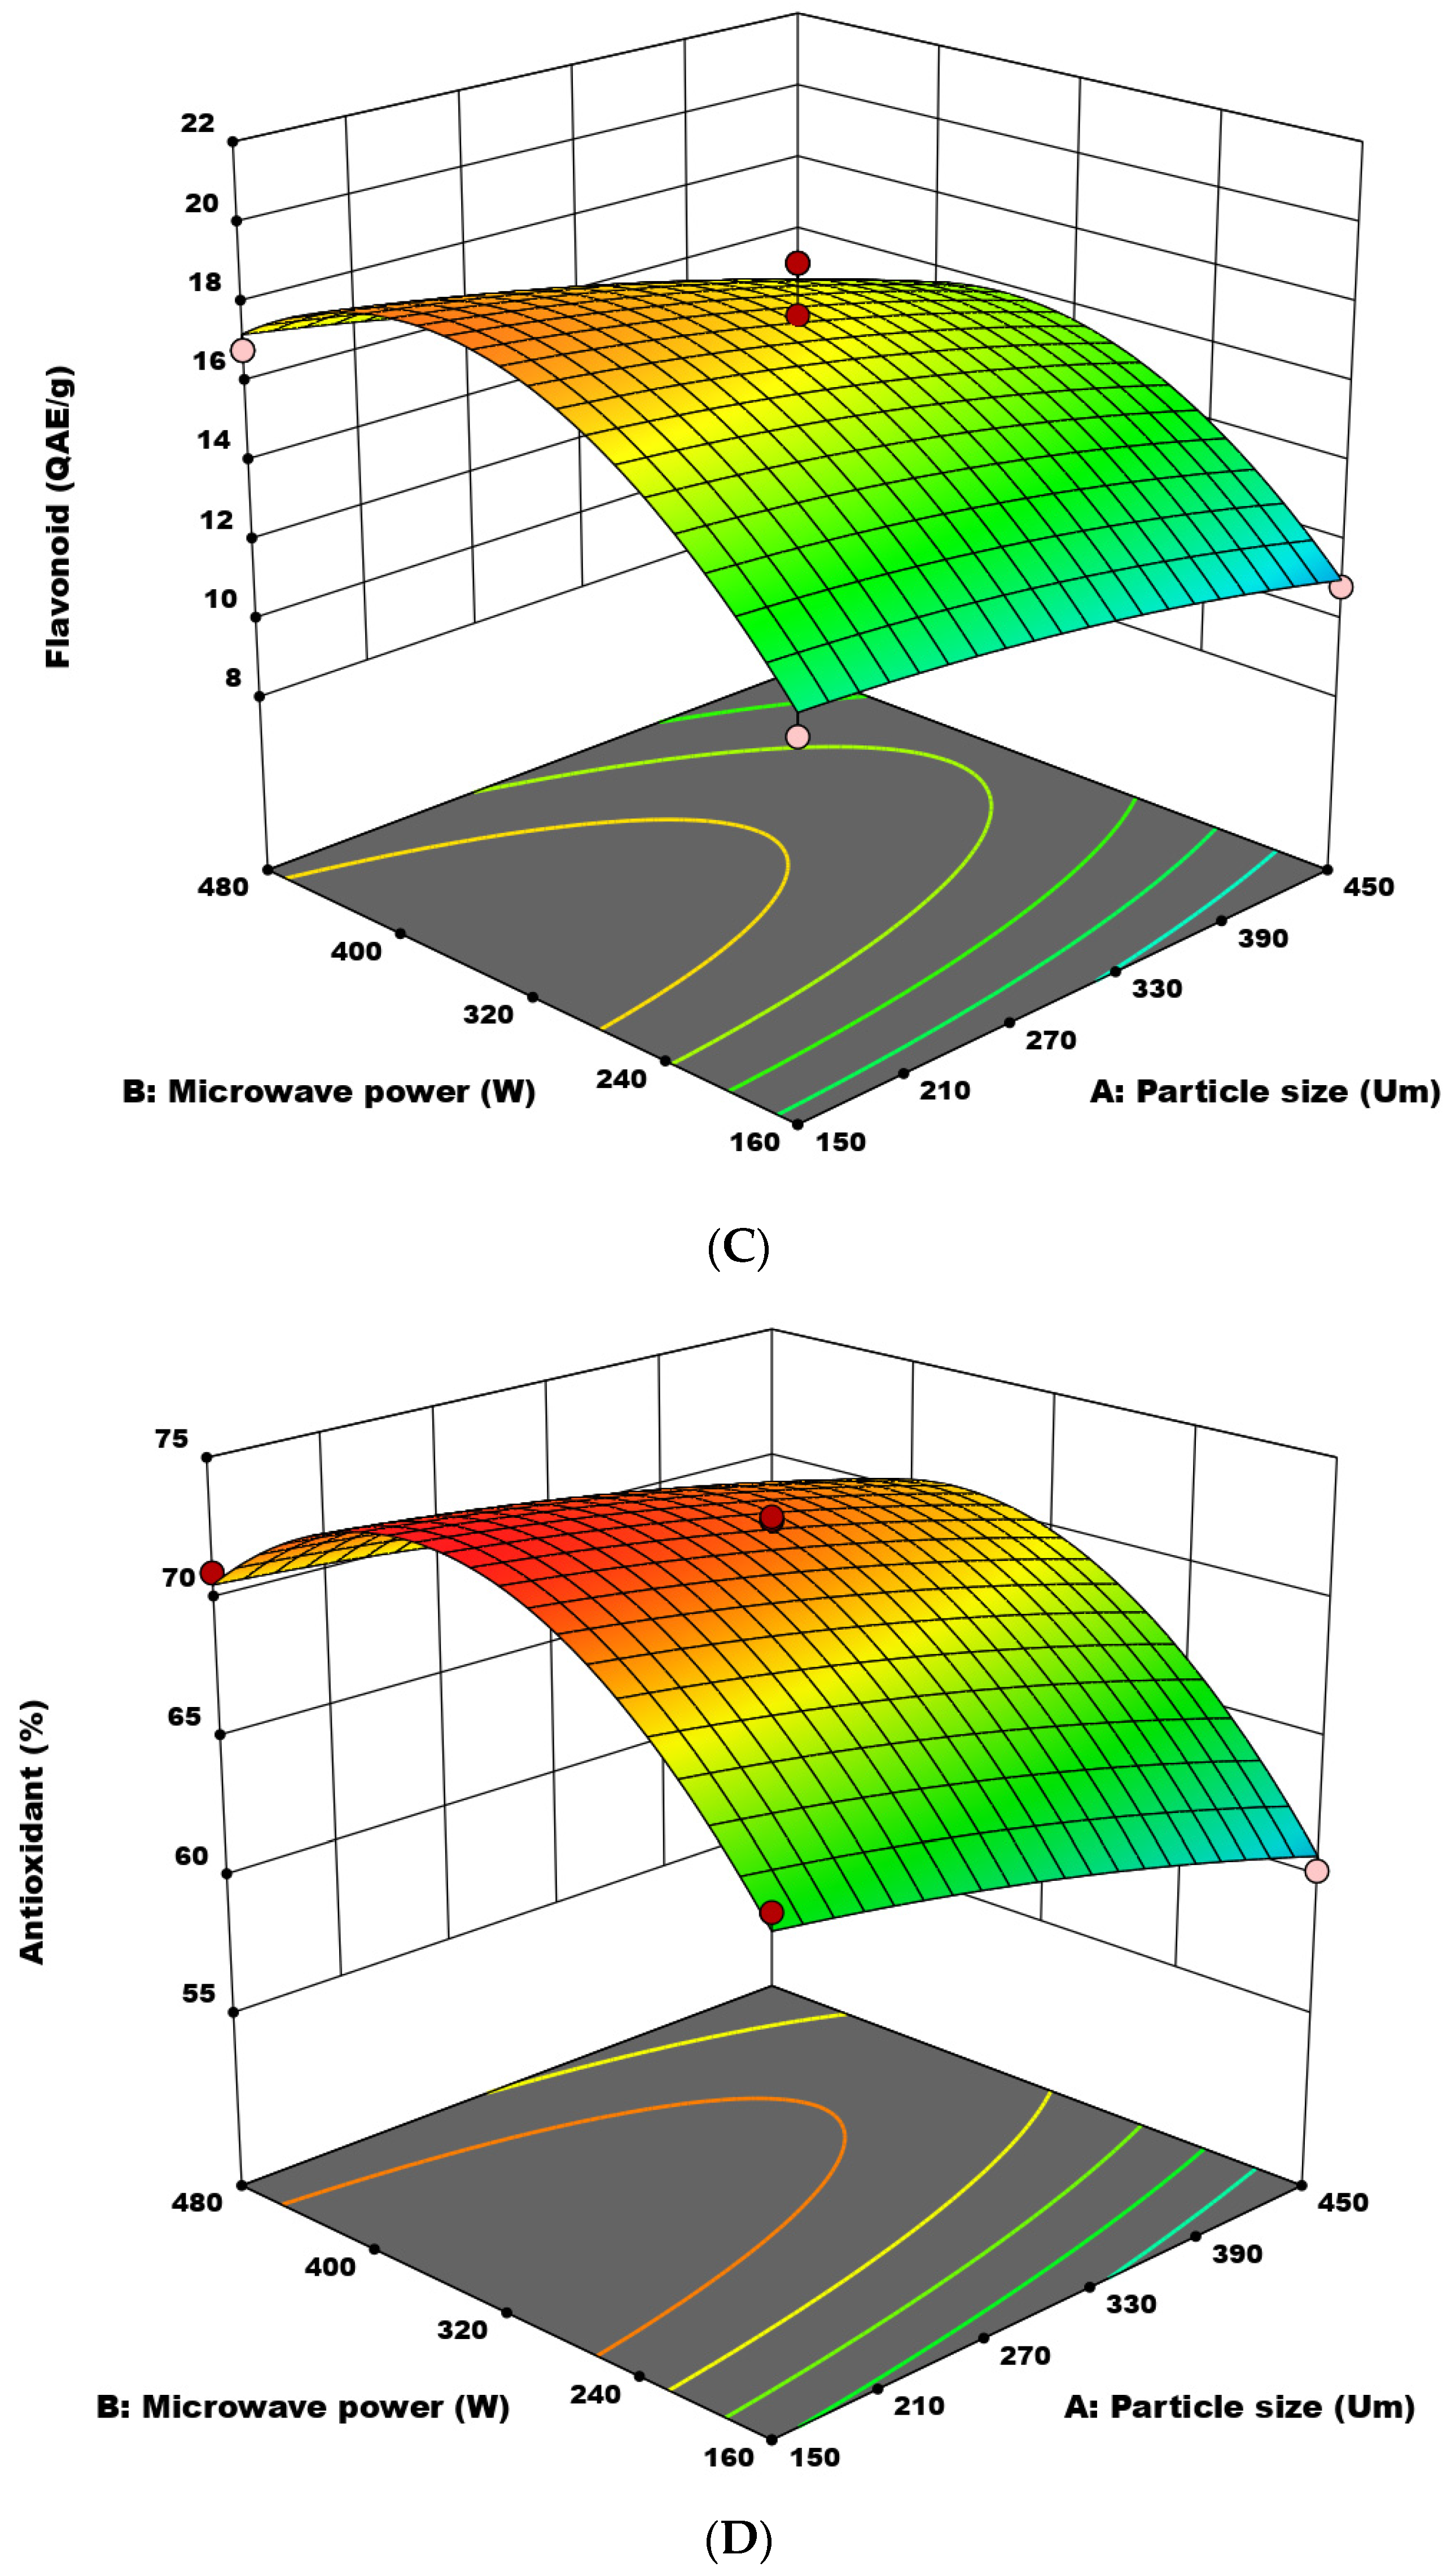
At the linear level, the curve in
Figure 1C demonstrates that total flavonoid concentration declines as particle size increases from 150 µm to 450 µm. The flavonoid content rose as particle size decreased, suggesting that an increase in the surface area accessible for molecular transport contributes to more extensive solute mass transfer across phases [
17]. As a result, the better the extraction efficiency and, consequently, the higher the flavonoid content of the resultant extracts, the smaller the particle size of walnut husk powder.
The graph shows total flavonoid content increases with the increase in microwave power, then after a subsequent increase in power, overall yield decreases in the range from 160W to 480W. The migration of target chemicals from the substrate to the solvent at a significant rate with equivalent greater downstream processing output was likely produced by microwave activity of highly localized heating and pressure [
18]. On the flip side, at higher levels of microwave power supply, the sample experienced increased heating, causing degradation of the essential flavonoid extracts. However, long exposure to microwave power may lead to loss of the extract due to overheating in the solute and solvent system.
The graph shows that total flavonoid content increases with prolonged time and, in later stages, decreases with a reduction in time, ranging from 2 min to 4 min. The total flavonoid content was found to be optimum at the central level. Longer treatment in the microwave processing unit leads to a greater decrease in the TFC [
19]. Later on, the decrease in microwave radiation per particle for longer time intervals with the extraction media led to a relatively low dielectric heating effect, thus overall reducing the effectiveness of microwave radiation.
3.2.4. Antioxidant Activity
Antioxidant activity is an important responsibility for the assessment of bioactive compounds present in walnut hull extract.
Table 1 shows the results of 29 experimental runs, which were performed as per the combinations given by the software (Design Expert 10.1.1) and their corresponding values for antioxidant activity. Antioxidant activity was expressed in percentage. The antioxidant activity obtained, as shown in
Table 1, ranged from 57.39 to 78.92%. The hull sample had the highest antioxidant activity of 78.92% when microwave power was set to 320 W, microwave duration was set to 3 min, solvent volume was set to 1:20, and particle size was set to 150 m. The minimal antioxidant activity of 57.39%, on the other hand, was found under the independent variable conditions of microwave power at 160 W, microwave duration at 2 min, solvent volume at 1:30, and particle size at 300 µm.
At the linear level, the graph in
Figure 1D demonstrates that antioxidant activity declines with increasing particle size in the region of 150 µm to 450 µm. The antioxidant activity rose as particle size decreased, implying that an increase in the surface area accessible for molecular transport contributes to a more extensive mass transfer of solutes across phases [
20]. As a result, the better the extraction efficiency and, hence, the radical scavenging activity of the resultant extracts, the smaller the particle size of walnut husk powder.
The graph shows that antioxidant activity increases with increasing microwave power, but overall yield decreases in the range of 160 W to 480 W. The rationale for this modification is that microwave activity of highly targeted heating and pressure could have created a substantial rate of selective migration of target chemicals from the substrate to the solvent with equivalent greater downstream processing output [
21]. On the flip side, at higher levels of microwave power supply, the sample experienced increased heating, causing degradation of the essential phenolic extracts. However, prolonged exposure to microwave power may lead to loss and degradation of the extracted colorant due to overheating in the solute and solvent system.
The graph shows antioxidant activity increases with increasing time and, in later stages, decreases with increasing time, ranging from 2 min to 4 min. The antioxidant activity was found optimum at the central level. Longer treatment in the microwave processing unit leads to a greater decrease in antioxidant activity [
22]. Later on, the decrease in microwave radiation per particle for longer time intervals with the extraction media led to a relatively low dielectric heating effect, thus overall reducing the effectiveness of microwave radiation.
The graph indicates that antioxidant activity decreases when the solid-to-solvent ratio increases from 20 to 40. Thermal degradation of heat-sensitive phenolic compounds decreases antioxidant activity [
23]. The decrease in antioxidant activity might be attributed to a change in the molecular structure of phenolic compounds, which may result in a decrease in extractability owing to the degree of polymerization [
24].
4. Optimization of Microwave-Assisted Extraction
Design Expert Software generated an optimized set of testing circumstances by defining the goals, as shown in
Table 3 and
Table 4. The anticipated optimum response variable findings were validated by carrying out the tests and then analyzing their qualities at optimized combinations of independent variables. The tests were carried out, and the actual values of all answers were compared to their expected values.
Table 1 shows the actual values of the replies, which were found to be closer to the anticipated values. As a result, the model was validated by concluding that the optimum set of conditions predicted by the model is right. The temperature of the substance being heated by microwave varies significantly with microwave power. The application of microwave radiation to a substance causes the molecules in that material to vibrate and produce heat. The amount of heat produced is directly related to the amount of microwave energy absorbed, which, in turn, is set by the microwave’s power setting. The dielectric characteristics and the specific heat capacity have a role in determining the amount of microwave power converted into a temperature.
5. Comparison of Overall Optimized Trends
The optimized values obtained using BBD of RSM were explained in detail in the previous section. The individual values showed optimized values of all the dependent variables by standardizing trends in the available data. The MAE processing optimized results were compared with conventional methodology. The result of MAE was better than the conventional method; this is due to a higher temperature and longer time leading to degradation of the extract yield, phenol, flavonoid content, and antioxidant activity.
6. Scanning Electron Microscopy (SEM)
The SEM analysis was applied to the extracted dye powder to observe the morphological changes before and after extraction from different treatments.
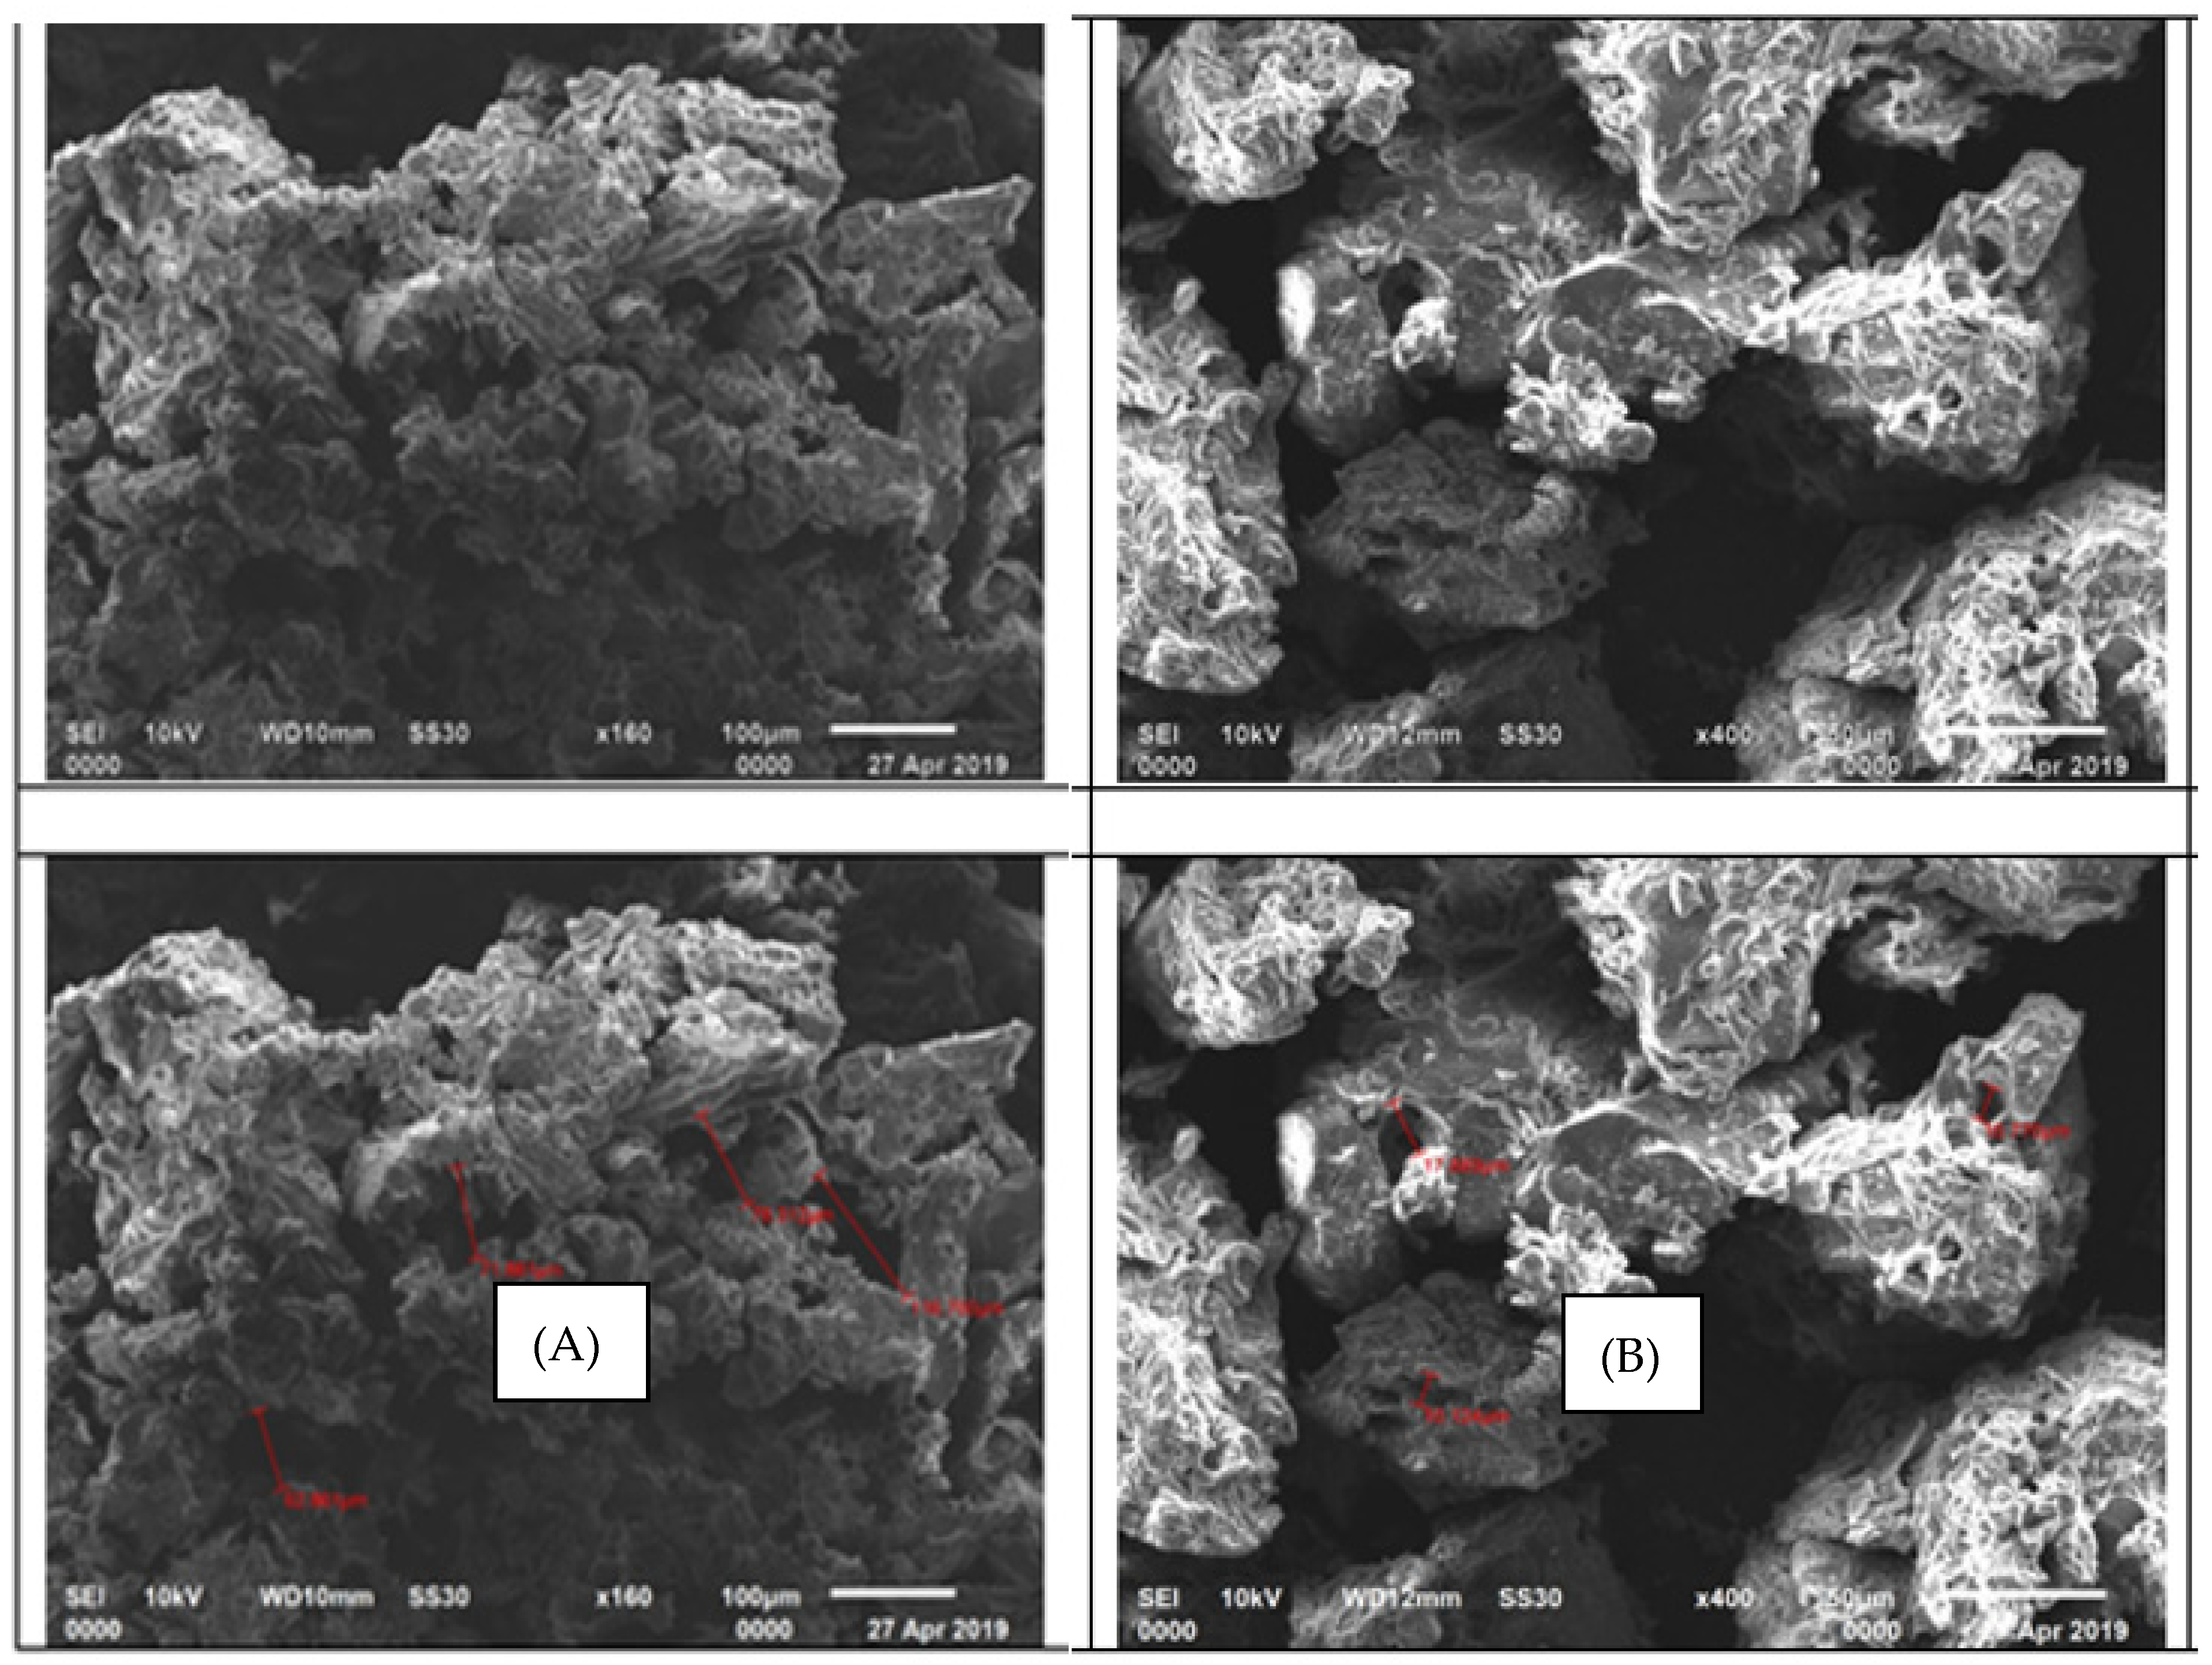
Figure 2 clearly depicts that the extraction efficiency is related to the physical changes of the sample, which also necessitates this analysis of examining and comparing the structural changes with the help of micrographs produced by scanning electron microscopy. In this present study, a total of three samples were analyzed for SEM analysis. The first sample (A) was the dye extracted after microwave treatment, as shown in
Figure 2; the second sample (B) was the dye extracted using conventional techniques.
SEM was used to examine the microstructure of dye tissue extracted from the walnut husk. The dye structure following MAE was looser than the structure after conventional extraction. The structure of the dye following MAE was looser than that after traditional extraction, as seen in the micrographs in
Figure 2A. It appears that the mechanical effects of internal heating based on conduction and dielectric polarization generated by microwave irradiation result in an explosive breakdown of the physical structure of extracted dye, serving the rapid discharge of solutes into the solvents. Microwave-assisted extraction of dye caused cell ruptures and damage, allowing more polyphenolic compounds from the powder to enter the extracted solvent. Anthocyanin pigments isolated from red raspberries using microwave-aided extraction yielded similar results [
25].
Figure 2B displays the micrographs with structural features of the dye extracted using a conventional technique. It can be observed from
Figure 2B that the extracted dye possessed a uniform and complete morphological structure without any significant destruction to the cell wall. It was also observed that the sample structure was more intact, with fewer pores or voids in the sample, and the overall structure of the dye was well structured and compact.
7. Gas Chromatography–Mass Spectrometry (GC-MS) of Walnut Hull Extract
Gas Chromatography–Mass Spectrometry (GC) is a technique used for the identification of phenolic compounds, such as phenolic acids [
26], flavonoids, and other bioactive compounds. GC-MS of bioactive compounds is very effective and quick in the analysis through enhanced resolution and separation of all compounds [
27]. In this present study, the optimized hull extract having the best results for the responses was selected for the GC-MS analysis to make an effort to characterize the walnut hull extract for the identification of the bioactive compounds. GC-MS results showed the presence of various compounds possessing a wide range of applications, such as antioxidants, antimicrobials, flavors, medicinal uses, and a lot more, as given in
Table 5 and
Table 6.
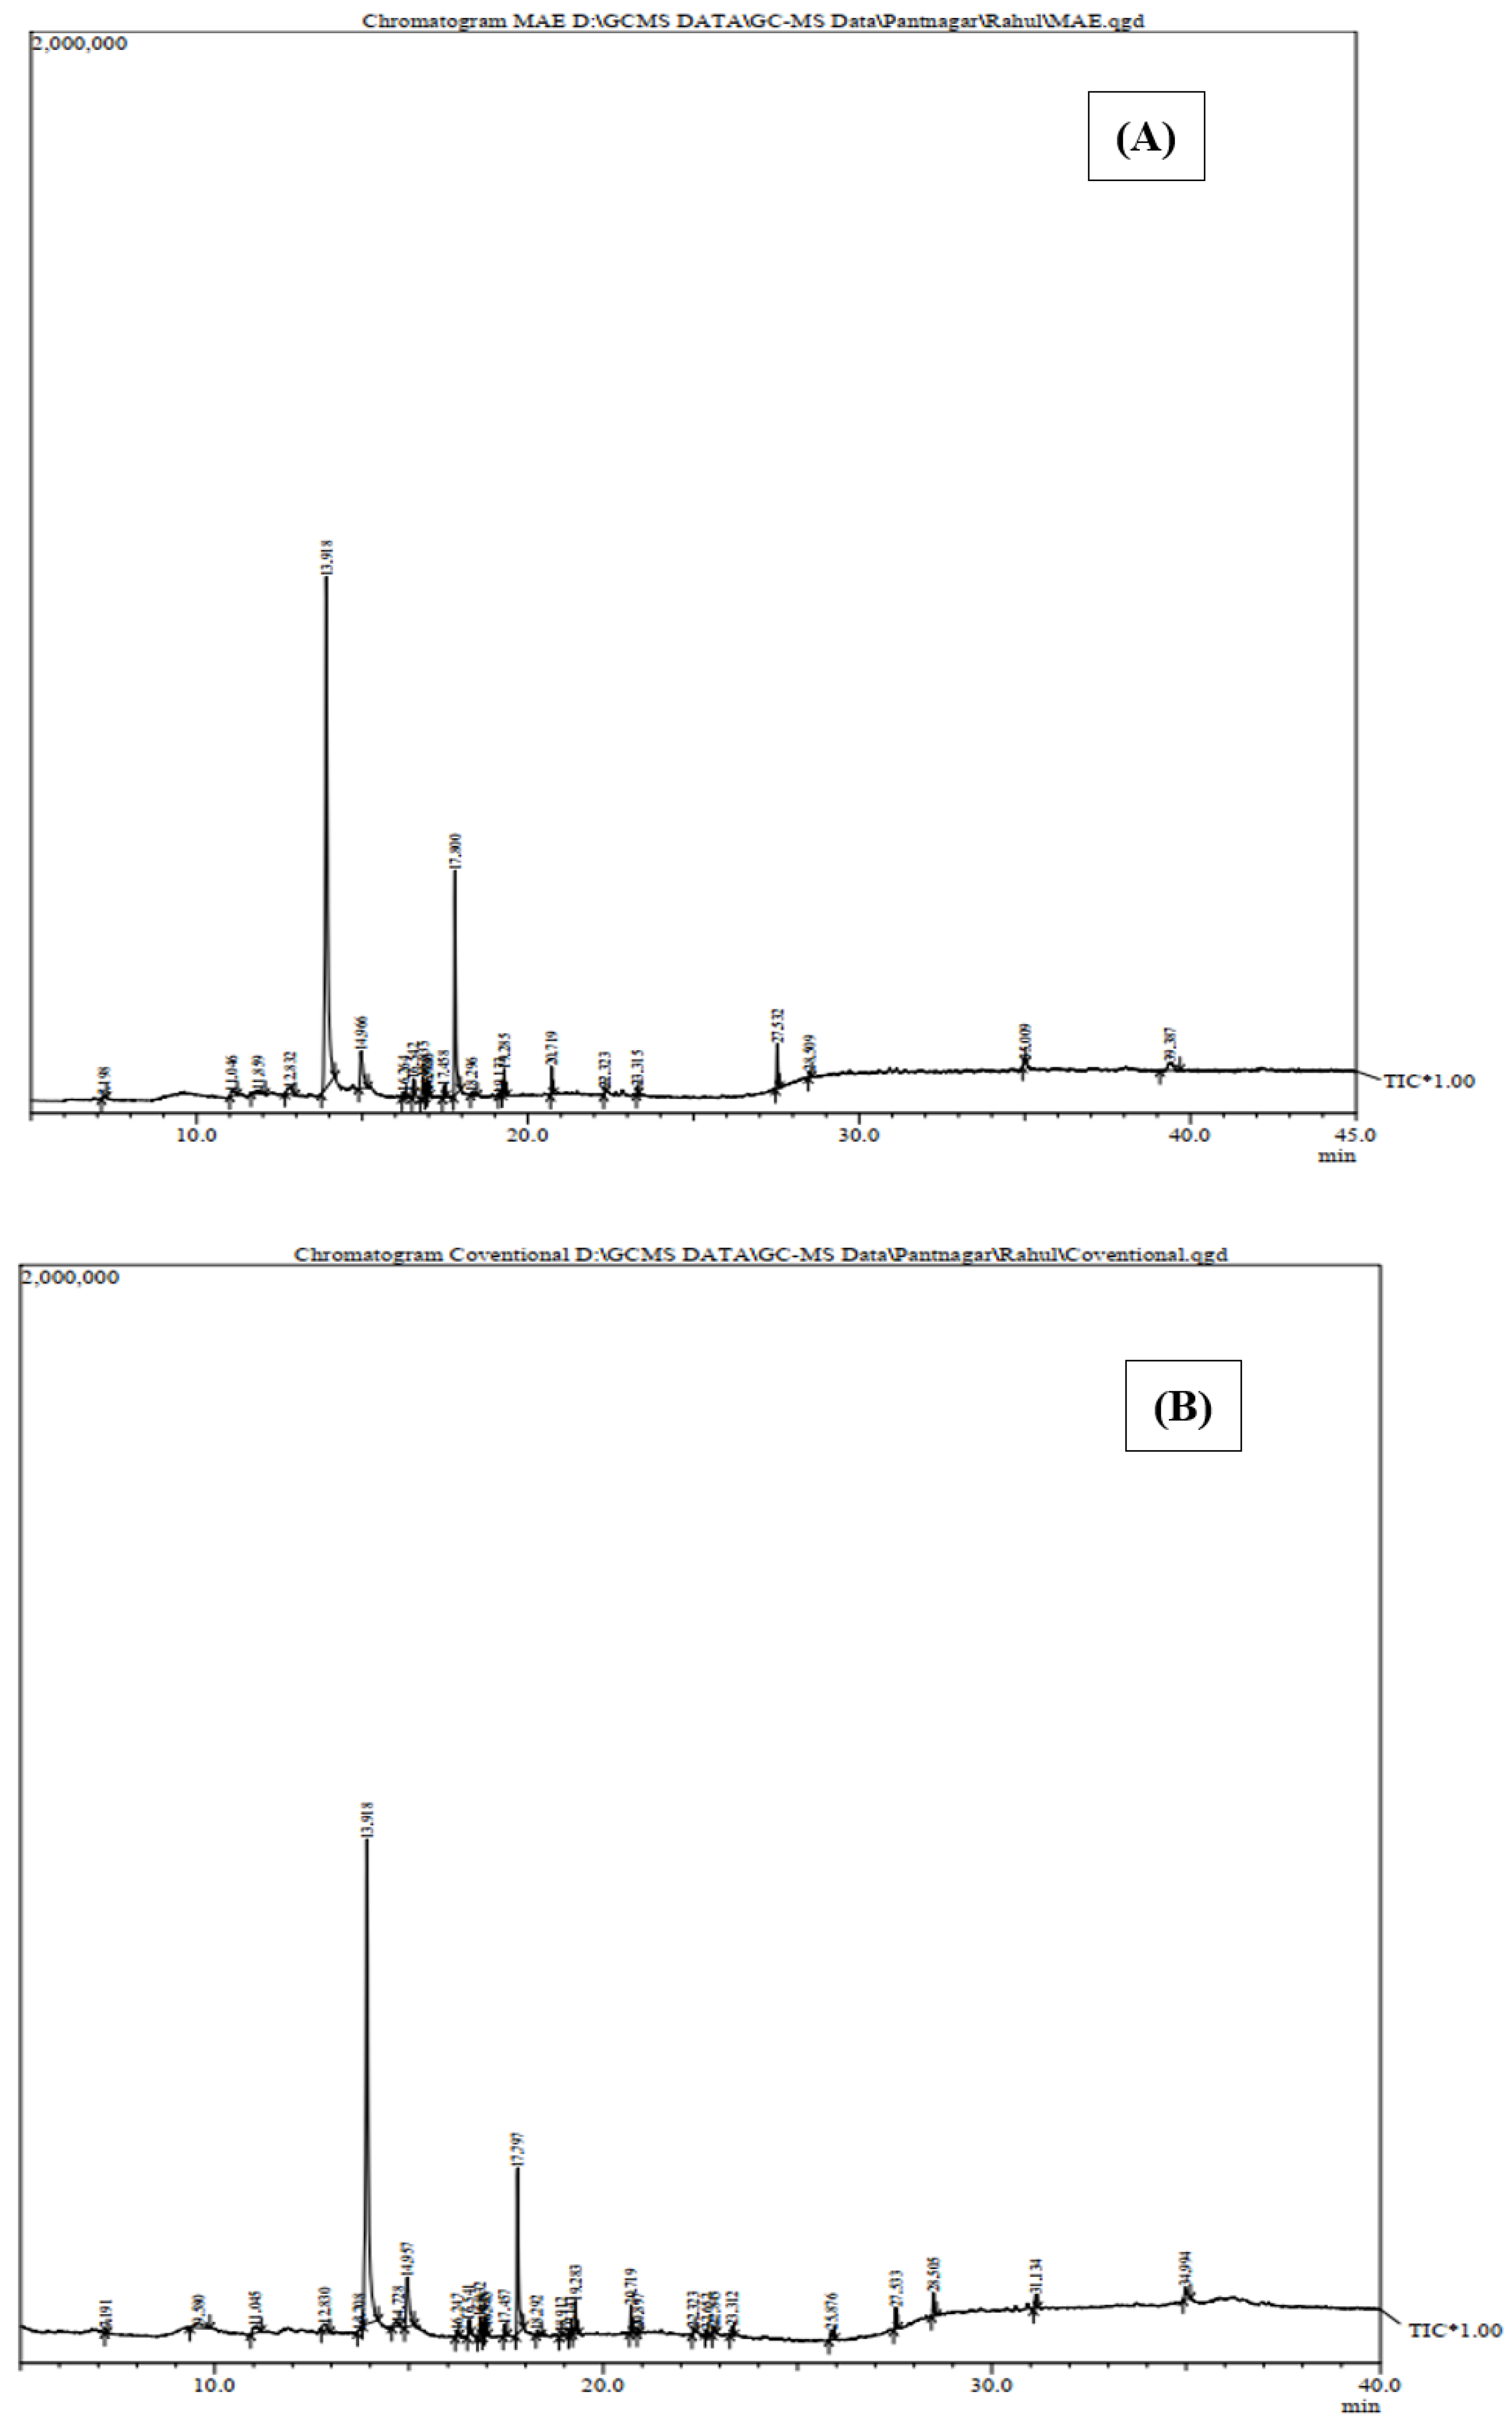
A total of 23 compounds were identified, in which most of the compounds were found in very fewer quantities with a peak area of less than 1% (
Figure 3A). Compound Hexadecanean processing aid was found in the highest quantity with a peak area of 61.03% [
28]. It was followed by Dibutyl phthalate, which is antimicrobial with an area of 15.34%. 2-CYCLOHEXEN-1-ONE,5-ETHYL-3-METHYL-4-PROPYLIDENE was also found in a good amount, with a peak area of 5.38% and was also responsible for antioxidant activity [
29]. Palmitic acid was also present in the sample, with a peak area of 1.35%. Besides these main bioactive compounds, other compounds were also present in a lesser amount, but their combined synergistic effect led to an increase in antioxidant activity.
A total of 30 compounds were identified, in which most of the compounds were found in very fewer quantities with a peak area of less than 1% (
Figure 3B). Compound Hexadecanean processing aid was found in the highest quantity with a peak area of 57.69% [
30]. It was followed by Dibutyl phthalate, which is antimicrobial with an area of 13.36% [
31]. 2-CYCLOHEXEN-1-ONE, 5-ETHYL-3-METHYL-4-PROPYLIDENE-was also found in a good amount, with a peak area of 6.85% and was also responsible for antioxidant activity [
30]. Palmitic acid was also present in the sample, with a peak area of 1.42%. Besides these main bioactive compounds, other compounds were also present in a lesser amount, but their combined synergistic effect led to an increase in antioxidant activity.
8. Conclusions
Several conventional extraction techniques, such as Soxhlet extraction, maceration, digestion, infusion, and percolation, have been used for the extraction of organic dyes. It began with conventional extraction methods with higher losses and low-quality dyes. In the later stages, novel extraction technologies were classified as novel thermal and non-thermal techniques. Among several organic sources for dye extraction, the walnut hull serves as a viable alternative. The criteria for selecting a walnut hull are based on its availability in the researcher’s geographical zone. In a similar context, the conventional method has been utilized before the research. SEM studies showed evident changes in the morphological structure of the optimized sample due to the breakage of the cells, thus an increased amount of yield and bioactive compounds in the extract, confirming the strong effect of MAE on extract yield when compared with the conventional method. Results of GC-MS showed the presence of several compounds (Hexadecane, Dibutyl phthalate, 2-CYCLOHEXEN-1-ONE, 5-ETHYL-3-METHYL-4-PROPYLIDENE) possessing the property processing aid, antimicrobial, and antioxidant properties, which confirm the extract is suitable for use in food for various applications.
Author Contributions
Conceptualization, R.S.; methodology, R.S. and P.S.; software, K.K.D.; validation, K.K.D. and A.; resources, S.A.M.; data curation, E.H.; writing—original draft preparation, R.S., P.S. and V.K.P.; writing—review and editing, B.K.; visualization, A. and S.A.M.; funding acquisition, B.K. All authors have read and agreed to the published version of the manuscript.
Funding
Project No. TKP2021-NKTA-32 has been implemented with support from the National Research, Development and Innovation Fund of Hungary, financed under the TKP2021-NKTA funding scheme.
Data Availability Statement
The data presented in this study are available on request from the corresponding author.
Acknowledgments
All the authors are thankful to National Research, Development and Innovation Fund of Hungary and Integral University, Lucknow for providing the research support and manuscript number IU/R&D/2023-MCN0001927.
Conflicts of Interest
The authors declare no conflict of interest.
References
- Wang, S.; Fu, W.; Han, H.; Rakita, M.; Han, Q.; Xu, Q. Optimization of Ultrasound-Assisted Extraction of Phenolic Compounds from Walnut Shells and Characterization of Their Antioxidant Activities. J. Food Nutr. Res. 2020, 8, 50–57. [Google Scholar]
- Jahanban-Esfahlan, A.; Ostadrahimi, A.; Tabibiazar, M.; Amarowicz, R. A Comparative Review on the Extraction, Antioxidant Content and Antioxidant Potential of Different Parts of Walnut (Juglans regia L.) Fruit and Tree. Molecules 2019, 24, 2133. [Google Scholar] [CrossRef]
- Medic, A.; Jakopic, J.; Solar, A.; Hudina, M.; Veberic, R. Walnut (J. regia) Agro-Residues as a Rich Source of Phenolic Compounds. Biology 2021, 10, 535. [Google Scholar] [CrossRef] [PubMed]
- Shahidi, F.; Ambigaipalan, P. Phenolics and polyphenolics in foods, beverages and spices: Antioxidant activity and health effects —A review. J. Funct. Foods 2015, 18, 820–897. [Google Scholar] [CrossRef]
- Embuscado, M.E. Spices and herbs: Natural sources of antioxidants—A mini review. J. Funct. Foods 2015, 18, 811–819. [Google Scholar] [CrossRef]
- Li, S.; Tan, H.-Y.; Wang, N.; Zhang, Z.-J.; Lao, L.; Wong, C.-W.; Feng, Y. The Role of Oxidative Stress and Antioxidants in Liver Diseases. Int. J. Mol. Sci. 2015, 16, 26087–26124. [Google Scholar] [CrossRef] [PubMed]
- Rodiah, M.H.; NurAsmaFhadhila, Z.; Kawasaki, N.; Noor Asiah, H.; Aziah, M.Y. Antioxidant Activity of Natural Pigment from Husk of Coconut. Pertanika J. Trop. Agric. Sci. 2018, 41, 441–451. [Google Scholar]
- Negi, T.; Kumar, Y.; Sirohi, R.; Singh, S.; Tarafdar, A.; Pareek, S.; Awasthi, M.K.; Sagar, N.A. Advances in bioconversion of spent tea leaves to value-added products. Bioresour. Technol. 2021, 346, 126409. [Google Scholar] [CrossRef]
- Awad, A.M.; Kumar, P.; Ismail-Fitry, M.R.; Jusoh, S.; Ab Aziz, M.F.; Sazili, A.Q. Green Extraction of Bioactive Compounds from Plant Biomass and Their Application in Meat as Natural Antioxidant. Antioxidants 2021, 10, 1465. [Google Scholar] [CrossRef]
- Muruganandam, L.; Krishna, A.; Reddy, J.; Nirmala, G.S. Optimization studies on extraction of phytocomponents from betel leaves. Resour. Technol. 2017, 3, 385–393. [Google Scholar] [CrossRef]
- Aiyegoro, O.A.; Okoh, A.I. Preliminary phytochemical screening and In vitro antioxidant activities of the aqueous extract of Helichrysum longifolium DC. BMC Complement. Altern. Med. 2010, 10, 21. [Google Scholar] [CrossRef] [PubMed]
- Al-Sayyed, H.F.; Al-Kurd, R.A.; Mahmoud, I.F.; AbdelQader, S.M.; Sweidan, D.H.; Rizeq, L.T.; Arafat, T.A.; Mwalla, M.M. Developing a database for total phenolic content, total flavonoid content, and antioxidant activity of Jordanian crops. Int. J. Food Prop. 2022, 25, 1290–1301. [Google Scholar] [CrossRef]
- Pakkirisamy, M.; Kalakandan, S.K.; Ravichandran, K. Phytochemical Screening, GC-MS, FT-IR Analysis of Methanolic Extract of Curcuma caesia Roxb (Black Turmeric). Pharmacogn. J. 2017, 9, 952–956. [Google Scholar] [CrossRef]
- Srujana, S.; Anjamma, M.; Alimuddin; Singh, B.; Dhakar, R.C.; Natarajan, S.; Hechhu, R. A Comprehensive Study on the Synthesis and Characterization of TiO2 Nanoparticles Using Aloe vera Plant Extract and Their Photocatalytic Activity against MB Dye. Adsorpt. Sci. Technol. 2022, 2022, 7244006. [Google Scholar] [CrossRef]
- Wang, X.; Yi, F.; Zhang, W.; Guo, X. Optimization of the Application of Walnut Green Peel Pigment in Wool Fiber Dying and Fixing Process under Microwave-assisted Condition. J. Nat. Fibers 2021, 19, 4854–4867. [Google Scholar] [CrossRef]
- Xing, C.; Cui, W.-Q.; Zhang, Y.; Zou, X.-S.; Hao, J.-Y.; Zheng, S.-D.; Wang, T.-T.; Wang, X.-Z.; Wu, T.; Liu, Y.-Y.; et al. Ultrasound-assisted deep eutectic solvents extraction of glabridin and isoliquiritigenin from Glycyrrhiza glabra: Optimization, extraction mechanism and in vitro bioactivities. Ultrason. Sonochemistry 2022, 83, 105946. [Google Scholar] [CrossRef]
- Mohammed, A.A.; Kareem, S.L.; Peters, R.J.; Mahdi, K. Removal of Amoxicillin From Aqueous Solution in Batch and Circulated Fluidized Bed System Using Zinc Oxide Nanoparticles: Hydrodynamic and Mass Transfer Studies. Environ. Nanotechnol. Monit. Manag. 2022, 17, 100648. [Google Scholar] [CrossRef]
- Alara, O.; Abdurahman, N.; Mudalip, S.A.; Olalere, O. Microwave-assisted extraction of Vernonia amygdalina leaf for optimal recovery of total phenolic content. J. Appl. Res. Med. Aromat. Plants 2018, 10, 16–24. [Google Scholar] [CrossRef]
- Hu, B.; Zhou, K.; Liu, Y.; Liu, A.; Zhang, Q.; Han, G.; Liu, S.; Yang, Y.; Zhu, Y.; Zhu, D. Optimization of microwave-assisted extraction of oil from tiger nut (Cyperus esculentus L.) and its quality evaluation. Ind. Crop. Prod. 2018, 115, 290–297. [Google Scholar] [CrossRef]
- Silva, E.D.S.; Junior, H.B.d.S.; Guedes, T.J.F.L.; Sandes, R.D.D.; Rajan, M.; Neta, M.T.S.L.; Narain, N. Comparative analysis of fresh and processed mango (Mangifera indica L., cv. “Maria”) pulps: Influence of processing on the volatiles, bioactive compounds and antioxidant activity. Food Sci. Technol. 2021, 42, e54020. [Google Scholar] [CrossRef]
- Djebari, S.; Wrona, M.; Boudria, A.; Salafranca, J.; Nerin, C.; Bedjaoui, K.; Madani, K. Study of bioactive volatile compounds from different parts of Pistacia lentiscus L. extracts and their antioxidant and antibacterial activities for new active packaging application. Food Control 2020, 120, 107514. [Google Scholar] [CrossRef]
- Li, M.; Zhu, X.; Tian, J.; Liu, M.; Wang, G. Dietary flavonoids from Allium mongolicum Regel promotes growth, improves immune, antioxidant status, immune-related signaling molecules and disease resistance in juvenile northern snakehead fish (Channa argus). Aquaculture 2018, 501, 473–481. [Google Scholar] [CrossRef]
- Karigidi, K.O.; Ojebode, M.E.; Olaiya, C.O. Effect of Cooking on Antioxidant and Enzymes Activity Linked to Carbohydrate Metabolism and Lipid Peroxidation of Eggplant (Solanum melongena). Pertanika J. Trop. Agric. Sci. 2018, 41, 1717–1730. [Google Scholar]
- Horváth, M.; Babinszky, L. Impact of selected antioxidant vitamins (Vitamin A, E and C) and micro minerals (Zn, Se) on the antioxidant status and performance under high environmental temperature in poultry. A review. Acta Agric. Scand. Sect. 2018, 68, 152–160. [Google Scholar] [CrossRef]
- Kumar, M.; Dahuja, A.; Sachdev, A.; Kaur, C.; Varghese, E.; Saha, S.; Sairam, K.V.S.S. Valorisation of black carrot pomace: Microwave assisted extraction of bioactive phytoceuticals and antioxidant activity using Box–Behnken design. J. Food Sci. Technol. 2019, 56, 995–1007. [Google Scholar] [CrossRef]
- Sabik, H.; Fortin, J.; Martin, N. Identification of pyrazine derivatives in a typical maple syrup using headspace solid-phase microextraction with gas chromatography–mass spectrometry. Food Chem. 2012, 133, 1006–1010. [Google Scholar] [CrossRef]
- Zhu, M.; Assmann, S.M. Metabolic Signatures in Response to Abscisic Acid (ABA) Treatment in Brassica napus Guard Cells Revealed by Metabolomics. Sci. Rep. 2017, 7, 12875. [Google Scholar] [CrossRef] [PubMed]
- Guo, X.; Ho, C.-T.; Schwab, W.; Song, C.; Wan, X. Aroma compositions of large-leaf yellow tea and potential effect of theanine on volatile formation in tea. Food Chem. 2018, 280, 73–82. [Google Scholar] [CrossRef] [PubMed]
- Münch, F.; Höllerer, C.; Klapproth, A.; Eckert, E.; Rüffer, A.; Cesnjevar, R.; Göen, T. Effect of phospholipid coating on the migration of plasticizers from PVC tubes. Chemosphere 2018, 202, 742–749. [Google Scholar] [CrossRef] [PubMed]
- Song, J.; Chen, Q.; Bi, J.; Meng, X.; Wu, X.; Qiao, Y.; Lyu, Y. GC/MS coupled with MOS e-nose and flash GC e-nose for volatile characterization of Chinese jujubes as affected by different drying methods. Food Chem. 2020, 331, 127201. [Google Scholar] [CrossRef]
- Sermakkani, M.; Thangapandian, V. GC-MS Analysis of Cassia italica Leaf Methanol Extract. Asian J. Pharm. Clin. Res. 2012, 5, 90–94. [Google Scholar]
| Disclaimer/Publisher’s Note: The statements, opinions and data contained in all publications are solely those of the individual author(s) and contributor(s) and not of MDPI and/or the editor(s). MDPI and/or the editor(s) disclaim responsibility for any injury to people or property resulting from any ideas, methods, instructions or products referred to in the content. |
© 2023 by the authors. Licensee MDPI, Basel, Switzerland. This article is an open access article distributed under the terms and conditions of the Creative Commons Attribution (CC BY) license (https://creativecommons.org/licenses/by/4.0/).


 ,
, 


