Abstract
Blends combine advantageous characteristics of each species, resulting in products with different flavors and nutritional substances. Moreover, transforming them into powder provides numerous advantages. This work evaluated the properties of three blended foam formulations made from the pulps of tropical red fruits (acerola, guava and pitanga) to determine the foam layer drying kinetics and thermodynamic properties. The foam formulations were prepared by mixing the three pulps in equal proportions (1:1:1), all added with 6% albumin and 1% stabilizing agent. The foams were analyzed for density, volumetric expansion, stability and porosity in six mixing times. Subsequently, they were subjected to drying in an oven with forced air circulation at 4 temperatures, with a layer 0.5 cm thick. Seven mathematical models were fitted to the drying kinetics experimental data to determine the effective diffusivity and thermodynamic properties of the samples. The best mixing times were 5 min for the E2 sample and 30 min for the others. Formulation E2 presented the best results in the foam physical properties, and E3 presented the shortest drying times. All models tested were satisfactorily adjusted, but Page’s model was the most adequate to describe the process. Sample E3 showed the highest diffusivity and sample E2 the lowest activation energy. The drying temperature increase caused reductions in enthalpy and entropy, as well as an increase in Gibbs free energy, indicating an endergonic process. The combination of additives incorporated into the blend influences the drying process: formulation E2 shows greater efficiency in removing water, and formulation E1 presents the highest energy demand.
1. Introduction
The increased demand for new food products serves, according to Mesquita et al. [1], a growing search for healthy foods, which makes natural juices attractive. Therefore, industries continue developing new products that meet the needs of consumers. So, the combination of pulps from different fruits in the form of a blend is seen, according to Adeloye and Agboola [2], as a strategy to complement the nutritional, sensorial and functional properties of juice.
Tropical fruits are highly appreciated around the world, with their diverse aromas, textures, flavors and shapes, as well as important nutritional components [3]. Within this category, red fruits, such as acerola (Malpighia emarginata), guava (Psidium guajava L.) and pitanga (Eugenia uniflora L.), are among the most appreciated [4]. They carry high concentrations of bioactive compounds, such as phenolic compounds, carotenoids and flavonoids, as well as amino acids, vitamin C, minerals and high antioxidant activity that can contribute to beneficial health effects [5,6,7].
Fruit-based products are composed of a high amount of water, making them particularly susceptible to deterioration by microorganisms and enzymatic and chemical reactions, giving them a short useful life [8]. Therefore, most of the preservation methods employed in these materials are based on water removal [9].
The drying process is widely used in industry in order to preserve the quality of agricultural products [10], with foam-mat drying as one option that stands out for being an effective, simple and much cheaper technique compared to the other methods, such as lyophilization and spray, besides the fact that it results in high-quality dry products [11]. In addition, it allows the use of lower temperatures, with a high drying rate and short mixing time [12]. Another advantage is that the obtained powders/flakes have better reconstitution properties when compared to freeze-dried and spray-dried products due to their honeycomb structure [13].
This method is widely used in heat-sensitive products and consists of transforming liquids or semi-solids into a stable foam through the incorporation of air or other gases and a foaming agent and/or a stabilizer. Therefore, the quality of the foam formation depends on the additives used and their effect on foam density and stability [13].
The foaming agent acts as a surfactant material, reducing the surface tension between the solid–liquid interfaces [9]. Egg albumin is one of the most used foaming agents, having been evaluated by many researchers in the drying of various products, such as beetroot (Beta vulgaris) [14], lemon juice (Citrus latifolia) [15], watermelon (Citrullus lanatus) [16], three types of banana juice (Kepok Lumajang, Ambon Probolinggo and Agung Lumajang) [17] and papaya pulp (Carica papaya) [11,18].
However, foams are unstable by nature and energy is released during relaxation, most often requiring the addition of a stabilizing agent [15]. Although many stabilizers have been studied in foam layer drying, the application effect of guar gum, gum arabic and gelatin on the characteristics of fruit blends depends on the peculiar composition of each material.
To assess whether the formed foam is stable, parameters such as density, overrun, stability and porosity must be evaluated. The density of the foam indicates the capacity of the formulation for dehydration, and the lower its value, the more air was incorporated into the structure of the material, and, consequently, the more stable the foam becomes, and with that, the material can be easily dried for a certain stirring time [19]. The overrun is a measure of air incorporation in the continuous phase, and the higher its value, the more stable the foam, indicating the ideal concentrations of foaming/stabilizing agents [20]. The foam porosity is directly related to the surface area, and the higher its value, the higher the heat transfer and drying rate [21]. The stability of the foam is the ability to maintain air for a certain time, which is inversely proportional to the volume of the drained liquid, and when thermally stable, it preserves the porous structure, color, texture and flavor, in addition to providing good rehydration to the final product [22].
The formation of a stable foam depends on the characteristics of the fruit pulps, the additives, the concentration and the mixture between them. From the elaboration of a stable foam, it is possible to increase the drying rate and reduce the drying time [23].
The study of drying kinetics and the adjustment of mathematical models are important tools for understanding the heat and mass transfer processes of agricultural products during drying [24]. In addition, knowledge of the effective diffusivity and thermodynamic properties allows knowing the energy required for drying and the physical phenomena that occur on the surface and inside the product, collaborating for the optimization of the process [25].
Based on what has been exposed and due to the scarcity of works on the foam layer drying of a blend of tropical red fruits (acerola, guava and pitanga), the influence of the time of beating of the formulations on the properties of the foam was investigated, followed by the evaluation of the behavior of the combination of additives in the formulations during the drying kinetics at different temperatures and their thermodynamic properties. Studying the development of formulations and understanding the drying process in a foam layer are important in the development of new products as a way of offering an option to diversify the consumption of these fruits that are produced on a large scale, allowing new markets to be reached using simple and easily accessible technology.
The hypothesis presented is that one of the additives used can present better results compared to the others, making it possible to optimize the technique used in the elaborated product. Therefore, the objective of the present work was to evaluate three foam formulations of tropical red fruits blends (acerola, guava and pitanga) formulated with albumin, gum arabic, guar gum and gelatin, as well as the effect of additives on foam properties, drying kinetics and thermodynamic properties.
2. Materials and Methods
2.1. Material
Acerola (Malpighia emarginata), guava (Psidium guajava) and pitanga (Eugenia uniflora L.) fruits were collected between January and March 2020, in the municipalities of Petrolina (latitude 9°23′39″ S, longitude 40°30′35″ W, altitude 380 m) and Bonito (latitude 8°28′13″ S, longitude 35°43′35″ W, altitude 423 m), both located in the state of Pernambuco, Brazil. The additives used were albumin (Naturaovos®, Salvador do Sul city, Brazil; yellowish powder, with 78% protein content and 4% moisture), gum arabic (Neon®, São Paulo city, Brazil; fine powder with 0.98% moisture), guar gum (Guar gum 5000, Daxia®, Guarulhos city, Brasil; fine white powder, with a protein content of 3.2% and moisture content of 10%) and gelatin (GastronomyLab®, Brasília, Brazil; Bloom 220; light yellow crystalline powder with moisture content of 8%).
2.2. Blending
The fruits were selected according to the ripe maturity (at the stage when the acerola and pitanga had completely red skins and the guava had completely yellow skins) and analyzing the presence of damage. Then, they were washed in running water to eliminate foreign materials, sanitized by immersion in chlorinated water (50 ppm) for 15 min and immersed in potable water to remove excess disinfectant. Then, they were pulped in a horizontal mechanical pulper (Laboremus®, DF—200, São Paulo, Brazil), with a screen sieve with holes of 2.5 mm in diameter. After pulping, the acerola, guava and pitanga pulps were individually packed in low-density polyethylene packages measuring 10 × 25 cm, with capacity for 200 g, and stored in a freezer at a controlled temperature, −18 °C, until the moment of blend preparation. Then, the defrosting was performed gradually, with an increase in temperature. To obtain the blend, the pulps were mixed in a proportion of 1:1:1 (g/g), with the whole pulps weighed and taken to a domestic blender (Arno®, model Power Mix, São Paulo, Brazil), where they were homogenized at maximum speed during 2 min, according to the tests carried out previously, which demonstrated that lower speeds and times did not present total homogenization of the samples.
2.3. Foam Formulations
Three formulations were elaborated to obtain the foams. Albumin, guar gum and gelatin additives were incorporated into the blend at the following concentrations: E1 formulation containing 6% albumin and 1% gum arabic; E2 formulation, 6% albumin and 1% guar gum; and E3, 6% albumin and 1% gelatin. The additives and proportions used were chosen through tests carried out previously, where smaller proportions did not show foam formation. For air incorporation and foam formation, the formulations were processed in a domestic mixer (Arno®, Deluxe, São Paulo, Brazil) at maximum speed (5×) during mixing times of 5, 10, 15, 20, 25 and 30 min.
2.4. Foam Physical Properties
2.4.1. Density
The determination of foam density was performed in triplicate by the mass/volume ratio of the foams placed in a 100 mL aluminum pycnometer (25 ± 1 °C). The results were presented in g/cm3.
2.4.2. Overrun (Volumetric Expansion)
The overrun was determined as a function of the densities of the formulations before and after the formation of foams, according to Equation (1) [26].
where Overrun is the volumetric expansion (%); ρp is the pulp density before mixing (g/cm3); ρe is the foam density (g/cm3).
2.4.3. Foam Stability
The stability evaluation was performed using the methodology described by Karim and Wai [27], in which a glass funnel with a nylon filter is attached to a beaker. The foams were placed in the filter/funnel/beaker assembly and subjected to a temperature of 70 °C for 180 min. Stability is inversely proportional to the drainage ratio, calculated according to Equation (2).
2.4.4. Porosity
Porosity was calculated according to Equation (3).
where φ is the porosity (%); ρp is the pulp density before mixing (g/cm3); ρe is the foam density (g/cm3).
2.5. Drying Kinetics
The drying kinetics of the three formulations were determined in triplicate, with the foams placed on stainless steel trays, forming a layer with a thickness of 0.5 cm. Then, the trays were dried in an oven with forced air circulation (Fanem®, model 320E, Santa Rita of Sapucaí, Minas Gerais, Brazil), with an air velocity of 1.0 m/s, at temperatures of 50, 60, 70 and 80 °C, weighing the trays at predetermined time intervals (5 min for the first 10 halves, then 10 min for the first 6 halves, then 20 min for the first 4 halves and 1 h for the rest) until constant mass is obtained, determining the dry masses and calculating the water contents of the samples. Both layer thickness and air velocity were determined according to previous tests. From these results, the water content ratio values were calculated (Equation (4)):
where MR is the product water content ratio (dimensionless); M is the actual product water content (% d.b.); Me is the product balance water content (% d.b.); M0 is the initial product water content (% d.b.).
In addition, the powder yield (Equation (5)) and water content on a dry and wet basis (Equations (6) and (7)) were calculated.
where (% w.b.) is the water content on a wet basis; (% d.b.) is the water content on a dry basis; Mw is the water mass; Ms is the sample mass and Md is the dry mass.
The mathematical models in Table 1 were fitted to the experimental data of the drying kinetics in the foam layer using nonlinear regression analysis by the Quasi-Newton estimation method in the computer program Statistica version 7.0 (StatSoft® Inc., Tulsa, OK, USA).

Table 1.
Mathematical models fitted to drying kinetics data.
The models were evaluated considering the coefficient of determination (R2), the mean square deviation (MSD) and the chi-square test (χ2), which are Equations (15), (16) and (17), respectively.
where MSD is the mean square deviation; MRpred is the ratio of water content predicted by the model; MRexp is the experimental water content ratio; n is the number of experimental observations; GLR is the model degrees of freedom (number of experimental observations minus the number of model coefficients).
2.6. Effective Diffusivity
The drying kinetics data were fitted with the mathematical model of liquid diffusion (Equation (14)), which is the analytical solution of Fick’s second law, and the effective diffusivities for each temperature were obtained. The infinite flat plate geometry was considered for the samples, unidirectional movement of water, uniform distribution of initial water content, that water migrates only by diffusion and that external resistance and shrinkage are negligible. The mathematical solution is represented by Equation (18).
where MR is the product water content ratio (dimensionless); Def is the effective diffusivity (m2/s); n is the number of terms in the equation; L is the drying layer thickness (m); t is the time(s).
To solve Equation (14), the computer program Statistica version 7.0 (StatSoft® Inc., Tulsa, OK, USA) was used with the Quasi-Newton estimation method by non-linear regression.
The dependence of effective diffusivity (Def) with temperature was evaluated by an Arrhenius equation (Equation (19)), determining the activation energy (Ea).
where Def is the effective diffusivity (m2/s); D0 is the pre-exponential factor (m2/s); Ea is the activation energy (J/mol); R is the universal gas constant (8.314 J/mol K); T is the absolute temperature (K).
2.7. Thermodynamic Properties
The thermodynamic properties—enthalpy, entropy and Gibbs free energy—of the drying process were calculated respectively using Equations (20)–(22).
where ΔH is the specific enthalpy (J/mol); ΔG is the Gibbs free energy (J/mol); ΔS is the specific entropy (J/mol K); Ea is the activation energy (J/mol); R is the universal gas constant (8.314 J/mol K); kB is the Boltzmann’s constant (1.38 × 10⁻²³ J/K); hP is the Planck’s constant (6.626 × 10⁻³⁴ J/s); T is the absolute temperature (K).
2.8. Statistical Analysis
Statistical analysis of the data was performed using the software Assistat version 7.7 beta [28]. The design used was completely randomized in a factorial scheme 3 × 6 (3 foam formulations and 6 mixing times), with three replications for the analysis of density and volumetric expansion (overrun). The other experimental data, namely, density, porosity, volumetric expansion and stability, were submitted to analysis of variance (ANOVA) and the means compared by Tukey’s test with 5% of probability.
3. Results
3.1. Foam Physical Properties
Table 2 shows the average density values of the foams of the 3 formulations, in the 6 mixing times evaluated (5, 10, 15, 20, 25 and 30 min). It is observed that the E2 foam (6% albumin and 1% guar gum) presented the lowest densities at all times evaluated, when compared to the other foams (p < 0.05). In addition, significant increases in density occurred when the duration of the mixing times was increased. In the other foams, an inverse behavior was verified, where the longer the times, the lower the values obtained (p < 0.05). This proved that the characteristics of the different materials added (such as stabilizers) cause different behaviors in the sample, mainly affecting the beating time.
Table 2.
Average density values of the foam formulations (E1, E2 and E3).
To optimize the drying process, the choice of ideal mixing times must be carried out aiming at the lowest densities because these results demonstrate greater incorporation of air and the foams become more stable throughout the process, according to Dabestani and Yeganehzad [19]. Consequently, there is better water removal due to the larger surface area [29]. All foams evaluated showed densities lower than 0.2 g/cm3 in at least 1 processing time, with the formulations composed with gum arabic (E1) and gelatin (E3) presenting the better performance with 30 min of mixing, with no significant difference between the values of both, while in E2, the time of 5 min showed better values.
Foam density results similar to the foams of formulations E1 and E3 were identified in melon pulp (Cucumis melo) with different concentrations of gum arabic (0 to 15%), presenting values from 0.42 to 0.77 g/cm3 with the mixing time of 10 min [30]. Susanti et al. [31], studying red sorghum extract (Sorghum vulgare Pers var. Suritan 3) foamed with xanthan gum, gum arabic and milk protein isolate, reported density values from 0.2 to 0.8 g/cm3, also decreasing with the mixing time (5, 10 and 15 min). Cól et al. [13], evaluating bacaba pulp (Oenocarpus bacaba Mart.) with different albumin concentrations and Emustab® and adopting a fixed mixing time of 20 min, found densities ranging from 0.57 to 0.99 g/cm3.
The volumetric expansion data (overrun), dependent on the mixing time, are shown in Table 3. The volumetric expansions of the formulations varied from 44.00 to 765.66%, and in samples E1 and E3, there was an increase as the mixing time increased (p < 0.05). The opposite occurs with the E2 formulation, which presented values about 200% higher than the others. The advantage of testing several stabilizers is that each one of them has its own properties, which, when adhering to the sample, cause different particularities. So, it is possible to optimize the drying process by using the most efficient additive, which has a shorter mixing time and greater stability.
Table 3.
Mean values of the volumetric expansion of the foam formulations (E1, E2 and E3).
It is observed for E2 that there is a direct relationship between the highest values of volumetric expansion and the lowest density in the times of 5 to 20 min, a fact also verified by Karim and Wai [27]. Statistical differences (p < 0.05) were also identified between the formulations in the different mixing periods evaluated, except for 5 and 30 min, in which the samples with gum arabic and gelatin did not differ from each other, and in the time of 25 min, in which E2 and E3 were statistically equal. Values lower than those of the present work for volumetric expansion were observed by Khodifad and Kumar [32], in pinecone pulp (Annona squamosa) foamed with albumin and carboxymethylcellulose, and by Watharkar et al. [33], in ripe banana pulp (Musa balbisiana) added with skimmed milk powder as a foaming agent, whose values ranged between 29.03 and 122.58% and between 9.09 and 51.78%, respectively.
Closer expansions were obtained in raspberry pulp foam (Rubus idaeus) with potato protein, maltodextrin and pectin (79.19 to 447.48%) in 10 min of mixing [34] and in white pulp pitayas (Hylocereus undatus) and red pulp pitayas (Hylocereus costaricensis) (436.18 and 582.43%, respectively), in which the overrun was proportional to the increase in the concentration of Emustab® (1 to 5%), with mixing times between 5 and 30 min [35]. The analysis of values presented here and in literature shows that the volumetric expansion is a function of the raw material chemical composition, of the additive combination and concentration and of the mixing time. The expansion of the foam is due to the presence of proteins, such as albumin. These proteins undergo denaturation at the interface and interact with each other to form a stable interfacial film [36] that presents affinity with water, providing a very high viscosity in aqueous systems, even at low doses and in a short time, [37] during the mixing process.
Figure 1 shows the foam drainage ratio as a function of mixing time. Foam stability is inversely proportional to the drainage ratio, indicating that the foaming/stabilizing agents used were effective granting 100% stability from the mixing time of 25 min, with emphasis on the formulation with guar gum (E2), which provided maximum stability (absence of drainage) at all times evaluated. A foam with a stable structure results in faster drying and easier removal of dry material from trays [38].
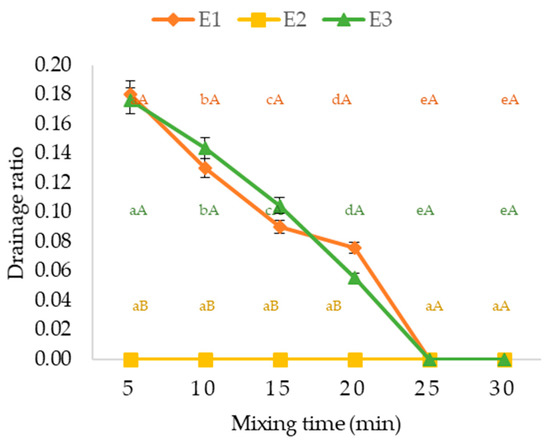
Figure 1.
Drainage ratio of foams formulations (E1, E2 and E3) as a function of mixing time. Means followed by the same lowercase letters in rows (a, b, c, d, e) and uppercase letters in columns (A, B) do not differ statistically by Tukey’s test at 5% probability; Vertical bars represent the standard deviation.
Poonnakasem [39], evaluating the effect of albumin concentration (2, 4 and 6%) in pepper sauce with 1% carboxymethylcellulose after 4 min of mixing, found stabilities varying between 98 and 100%, with the best concentrations of 4 and 6% albumin. Using the foaming and stabilizing agents albumin (2%) and methylcellulose (1.5%), after 3 min of mixing, Dehghannya et al. [15] observed foam stability of 92.589% in lemon juice. Ng and Sulaiman [14] found a stability range of 82.5 to 97.5% for beet foam (Beta vulgaris) added with albumin and fish gelatin as the foaming and stabilizing agents, respectively, presenting these values after 180 min of evaluation of the foam at 25 °C. The same was verified in cocoa foam enriched with lavender extract (Lavandula hybrida L.), foamed with albumin and gelatin, reaching 99.99% stability after 120 min [40].
Table 4 presents the results obtained for the foam formulations’ porosity. Significant differences (p < 0.05) were observed in the porosities between the six times used in the three foams. When the comparison is made among the formulations, there is a higher porosity of the foam with guar gum (E2) up to 20 min of mixing. As in the density and overrun, the porosity of the E2 sample has the opposite behavior to that of the E1 and E3 samples, decreasing with the mixing time. Cól et al. [13] stated that a high porosity is responsible for the drying velocity of the foam layer compared to traditional drying, as it facilitates the movement of water from the interior to the surface through the free spaces (air bubbles) between the liquids.
Table 4.
Mean porosity values of the foam formulations (E1, E2 and E3).
Despite this, the choices of mixing times must be made based on the data set, where low density, high stability, high volumetric expansion and high porosity are preferable [15]. Consequently, the mixing periods determined as the best were 5 min for E2 and 30 min for E1 and E3.
3.2. Foam Layer Drying
Table 5 presents the data obtained for the drying process time, yield and water content of the three foam formulations, which were prepared and submitted to drying at temperatures from 50 to 80 °C. There is a reduction of 47, 69 and 65% in the drying times with increasing temperature, between temperatures of 50 and 80 °C, in samples E1, E2 and E3, respectively. Evaluations of drying time reductions with increasing temperature were also carried out by El-Salam et al. [11], studying papaya pulps (Carica papaya) added with albumin and xanthan gum at temperatures of 60 and 80 °C. Ayetigbo et al. [41] tested white and yellow cassava pulp (Manihot esculenta) foamed with glycerol monostearate and sodium carboxymethylcellulose, subjected to drying at temperatures of 50, 65 and 80 °C. Silva et al. [42] evaluated 3 formulations of mixed prickly pear and acerola pulp with albumin, xanthan gum, guar gum and carboxymethylcellulose, with temperature ranging from 50 to 70 °C, in which maximum and minimum drying times of 460 and 160 min were observed, with water contents (w.b.) between 5.17 and 12.05, close to those found in the present study (5.02 and 8.54).
Table 5.
Yield, drying time and water content of foam layer blend formulations drying in the temperature range from 50 to 80 °C.
When evaluating the yields, it is observed that there were small changes, which stayed in the range of 15.13 to 17.88%. However, there was a significant difference (p < 0.05) among the powders obtained at the four temperatures adopted. Overall, the highest productivity was achieved by foam made with gum arabic (E1), followed by guar gum (E2) and gelatin (E3), respectively. Table 6 shows the parameters of the 7 mathematical models adjusted to the experimental data of the drying kinetics of formulations E1, E2 and E3 at temperatures of 50, 60, 70 and 80 °C, with the respective coefficients of determination (R2), mean squared deviations (MSDs) and chi-square (χ2).
Table 6.
Parameters, coefficients of determination (R2), chi-squares (χ2) and mean squared deviations (MSDs) of the models fitted to the drying kinetics data foam formulations (E1, E2, E3) at temperatures of 50, 60, 70 and 80 °C.
It is verified that all the models tested were satisfactorily adjusted to the experimental data of the drying kinetics, with R2 ≥ 0.98, MSD ≤ 0.07 and χ2 ≤ 0.005, and can be used in the prediction of drying kinetics curves. However, among all the models tested, Page resulted in the best results, with higher R2 values and lower MSD and χ2, making it the most suitable model to describe the foam layer drying process of the pulp blend formulations.
Other authors also found that Page’s model provided the best fit for foam layer drying kinetics, such as Li et al. [30] for melon pulp with different concentrations of gum arabic; Brar et al. [9] in peach pulp, using carboxymethylcellulose, isolated soy and pea protein as additives; Cavalcante et al. [43], working with cagaita pulp (Eugenia dysenterica) and using albumin as a foaming agent; and Gonzaga et al. [44], using pineapple juice with mint, Neutral League and Emustab® to obtain the foams.
The Page model was also reported in the literature as suitable for estimating the drying of fruits in general, using different techniques, such as tomato slices dried in a vacuum oven [45]; mango submitted to drying in an indirect forced-convection solar dryer [46]; and drying of bacaba pulp (Oenocarpus bacaba Mart.), in which the Page, Midilli and Logarithmic models presented equally good fits, with values of R2 > 0.99 [47].
Figure 2 shows the drying kinetic curves of the 3 formulations, E1, E2 and E3, at temperatures of 50, 60, 70 and 80 °C, adjusted by the Page model. The three formulations behaved differently during drying, with E3 (albumin + gelatin) generating regularly distinct curves as an effect of the differences between temperatures, while in E1 (albumin + gum arabic) and E2 (albumin + guar gum), there are approximate representations for drying at 60 and 70 °C and for drying at 70 and 80 °C, respectively.
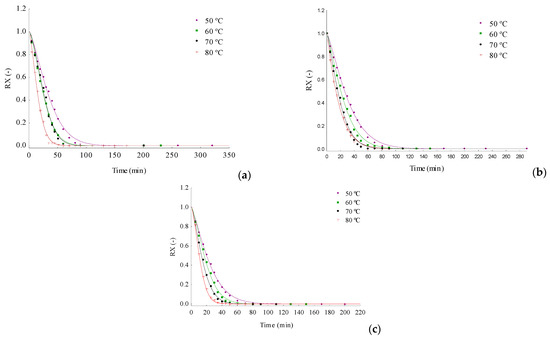
Figure 2.
Foam layer drying kinetics curves of the foam formulations in the temperature range from 50 to 80 °C using Page model adjustments: (a) E1; (b) E2; and (c) E3.
3.3. Effective Diffusivity
Table 7 shows the effective diffusivities for the three foam formulations evaluated. The increase in temperature results in an increase in the velocity of water extraction from the product, with a consequent tendency of diffusivity increase, with formulation E3 achieving the highest results, followed by E2. Thus, the influence of the combination of additives in the formulations on the effective diffusivity is evident, as verified by Dehghannya et al. [15], which showed a decreasing in Def with the albumin concentration increasing.
Table 7.
Effective diffusivities (Def) and determination coefficients (R2) obtained in the foam formulations drying kinetics at temperatures of 50, 60, 70 and 80 °C.
Def values in a similar range are reported by several authors in products obtained by drying in a foam layer, such as mixed prickly pear and acerola pulp with diffusivity between 1.28 × 10⁻⁹ and 3.19 × 10⁻⁹ m2/s [48] and green banana (Musa sapientum) with values from 2.045 × 10⁻⁹ to 4.710 × 10⁻⁹ m2/s [49], both at temperatures of 50, 60 and 70 °C.
The influence of temperature on the effective diffusivity was evaluated by an Arrhenius-type equation, with the values of the equation parameters, pre-exponential factor (D0), activation energy (Ea) and determination coefficients (R2) presented in Table 8. The three samples showed Ea in the range of values for foamed food products which is 15 to 40 kJ/mol [50]. Sample E2 presented the lowest Ea among the formulations and E1 the highest value, indicating that formulation E2 requires a lower amount of energy for the diffusion of water from the sample during the drying process. This is directly related to the lowest density and greater overrun, stability and porosity of this formulation, conditions favored by the guar gum addition.
Table 8.
Values of the Arrhenius equation parameters, pre-exponential factor (D0), activation energy (Ea) and determination coefficients (R2) of the foam formulations.
A higher Ea value of 29.99 kJ/mol was determined by Khodifad and Kumar [32], evaluating the pulp of sugar apple (Annona squamosa L.) foamed with albumin (15%) and methylcellulose (0.37%), subjected to drying at temperatures of 60, 65, 70 and 75 °C. In other dried foods, also through the foam layer, Ea values higher than those of the present work were verified, as in whey formulated with 8% Emustab®, under drying at temperatures from 40 to 80 °C and an Ea of 29.61 kJ/mol [37], and also in cashew pulp added with 5% Emustab® at temperatures from 50 to 80 °C, obtaining an Ea of 54.983 kJ/mol [45]. It can be noticed that less energy was required by the samples of the present work.
3.4. Thermodynamic Properties
Table 9 shows the average values of thermodynamic properties, with the enthalpy (ΔH), entropy (ΔS) and Gibbs free energy (ΔG) results evaluated at the four drying temperatures for the three foam formulations. With the increase in temperature, there was a decrease in enthalpy (ΔH), proving that the higher the temperature, the lower the thermal energy required to carry out the drying process [51]. It can also be seen that formulation E1 presented the highest values of ΔH and E2 the lowest, indicating that they need higher and lower energies, respectively, for drying and demonstrating the influence of additives in the process. Thus, it is generally observed for formulation E1 that the combination of albumin with gum arabic caused greater difficulty in removing water during the drying process due to the need of greater energy (ΔH and Ea) and having a lower effective diffusivity (Def), resulting in longer drying times. Formulation E2 showed an easier drying tendency, as it presented less energy (ΔH and Ea) for the drying and intermediate values of Def, ΔH and drying times. Formulation E3 showed a higher Def and intermediate ΔH, with shorter drying times. Positive enthalpy values characterize the process as endergonic, requiring energy absorption for the mass transfer [52].
Table 9.
Thermodynamic properties (Enthalpy, Entropy and Gibbs free energy) of foam layer formulations drying kinetics at temperatures of 50, 60, 70 and 80 °C.
As with enthalpy, the entropy value (ΔS), which is a state function, decreased with increasing temperature, demonstrating that the lower the entropy, the greater the degree of order between the water molecules and the product [53]. Negative values of ΔS show that the diffusion went from an initial state of disorder, with several sorption sites available, to an ordered state with reduced sorption sites. Low values of ΔS mean that the material undergoes physical and chemical changes, taking it close to its thermodynamic equilibrium [52,54].
Gibbs free energy (ΔG) is an extensive function that expresses the equilibrium condition and spontaneity of the process under a constant temperature and pressure conditions [55]. It is observed that ΔG showed an inverse behavior to the other thermodynamic properties in the three foam formulations, which characterizes the drying as endergonic, not spontaneous and requiring thermal energy from the medium so that drying happens [56]. In the same way as for enthalpy, formulation E1 presented the highest values of ΔG, indicating the greater presence of bound water in the samples. The Gibbs free energy measures the total energy of a thermodynamic system, and its positive value is explained by the energy absorbed during the liquid–vapor phase change [52].
These behaviors verified in the thermodynamic properties are common in fruits and their residues, as determined by Silva et al. [53] using prickly pear and acerola mixed pulp foam, at temperatures from 50 to 70 °C, where the formulation with albumin and xanthan gum presented enthalpy ranging from 24.42 to 24.26 kJ/mol, entropy from −0.3227 to −0.3232 kJ/mol K and Gibbs free energy from 131.69 to 138.15 kJ/mol, and by Morais et al. [47] using bacaba pulp (Oenocarpus bacaba Mart.) subjected to drying at temperatures of 40, 50 and 60 °C, with enthalpy ranging from 34.4054 to 34.2391 kJ/mol, entropy from −0.3039 to −0.3044 kJ/mol K and Gibbs free energy from 129.56 to 135.65 kJ/mol.
Other studies also demonstrated identical behavior, such as in bark and seeds of Trapiá dried at temperatures from 50 to 80 °C, which presented ΔH ranging from 15.50 to 15.25 and 21.52 to 21.57, ΔS from 0.3668 to 0.3676 and 0.3447 to 0.3454 and ΔG ranging from 134.06 to 145.07 and 132.91 to 143.26 [56].
4. Conclusions
The addition of albumin in combinations with gum arabic, guar gum and gelatin to the acerola, guava and pitanga blend formed samples with suitable properties for drying in a foam layer. The foam formed with the combination of albumin and guar gum (E2) presented the best physical properties for drying, with lower density and greater overrun, porosity and stability.
Among the seven drying models evaluated, Page’s resulted in the best fits for the three formulations at all temperatures used, with the sample containing gelatin (E3) presenting the highest effective diffusivities and the sample containing guar gum (E2) the lowest activation energy. The increase in drying temperature caused reductions in enthalpy and entropy and an increase in Gibbs free energy, characteristic of an endergonic process. The combination of additives incorporated into the acerola, guava and pitanga blend influences the drying process, with the E2 formulation (albumin + guar gum) showing a tendency of easier water removal during the process, requiring less energy (ΔH and Ea), followed by formulation E3 and formulation E1 presenting the highest energy requirement.
When evaluating the 3 different stabilizing agents at the 6 mixing times, it was found that guar gum acts more effectively, requiring less mixing and drying time at temperatures of 60 and 70 °C. This information is important, as it allows improving the drying process in a foam layer, which, at an industrial level, will consequently generate greater productivity in the manufacture of an innovative product, offering unprecedented sensory and nutritional characteristics.
Author Contributions
Conceptualization, Y.F.P., R.M.F.F. and A.J.M.Q.; data curation, Y.F.P., F.S.S., C.G.R. and L.T.S.A.; formal analysis, Y.F.P., A.G.B.L., C.C.C. and W.P.S.; investigation, Y.F.P. and P.B.M.; methodology, Y.F.P., R.M.F.F. and J.P.L.F.; software, W.P.S. and J.P.G.; supervision, R.M.F.F. and A.J.M.Q.; writing—original draft, Y.F.P.; writing—review and editing, R.M.F.F. and J.P.L.F.; Funding acquisition, A.G.B.L. All authors have read and agreed to the published version of the manuscript.
Funding
This research received external funding from FAPESQ-PB/CAPES, grant number 18/2020 and CNPq, grant number 308255/2022-4 (Brazilian Research Agencies).
Institutional Review Board Statement
Not applicable.
Informed Consent Statement
Not applicable.
Data Availability Statement
Data can be digitized from the graphs or requested to the corresponding author.
Acknowledgments
The authors are grateful to the Federal University of Campina Grande (Brazil) for the research infrastructure. The first author would like to thank Coordination for the Improvement of Higher Education Personnel-Brazil (CAPES) for supporting this study and for his research grant.
Conflicts of Interest
The authors declare no conflict of interest.
References
- Mesquita, T.C.; Evangelista Vasconcelos Schiassi, M.C.; Maria Teixeira Lago, A.; Careli-Gondim, Í.; Mesquita Silva, L.; de Azevedo Lira, N.; Elena Nunes Carvalho, E.; Carlos de Oliveira Lima, L. Grape Juice Blends Treated with Gamma Irradiation Evaluated during Storage. Radiat. Phys. Chem. 2020, 168, 108570. [Google Scholar] [CrossRef]
- Adeloye, J.B.; Agboola, O.R. Bioactive Properties, Chemical Composition, and Sensory Acceptance of Juice Blends from Orange and African Locust Bean (Parkia biglobosa). J. Culin. Sci. Technol. 2022, 20, 33–50. [Google Scholar] [CrossRef]
- Mohan, K.; Muralisankar, T.; Uthayakumar, V.; Chandirasekar, R.; Revathi, N.; Ramu Ganesan, A.; Velmurugan, K.; Sathishkumar, P.; Jayakumar, R.; Seedevi, P. Trends in the Extraction, Purification, Characterisation and Biological Activities of Polysaccharides from Tropical and Sub-Tropical Fruits—A Comprehensive Review. Carbohydr. Polym. 2020, 238, 116185. [Google Scholar] [CrossRef] [PubMed]
- Gramza-Michałowska, A.; Bueschke, M.; Kulczyński, B.; Gliszczyńska-Świgło, A.; Kmiecik, D.; Bilska, A.; Purłan, M.; Wałęsa, L.; Ostrowski, M.; Filipczuk, M.; et al. Phenolic Compounds and Multivariate Analysis of Antiradical Properties of Red Fruits. J. Food Meas. Charact. 2019, 13, 1739–1747. [Google Scholar] [CrossRef]
- Xu, M.; Shen, C.; Zheng, H.; Xu, Y.; Xue, C.; Zhu, B.; Hu, J. Metabolomic analysis of acerola cherry (Malpighia emarginata) fruit during ripening development via UPLC-Q-TOF and contribution to the antioxidant activity. Food Res. Int. 2020, 130, 108915. [Google Scholar] [CrossRef]
- Ribeiro, L.R.; Leonel, S.; Souza, J.M.A.; Garcia, E.L.; Leonel, M.; Monteiro, L.N.H.; Ferreira, R.B. Improving the nutritional value and extending shelf life of red guava by adding calcium chloride. LWT 2020, 130, 109655. [Google Scholar] [CrossRef]
- Suwanwong, Y.; Boonpangrak, S. Phytochemical contents, antioxidant activity, and anticancer activity of three common guava cultivars in Thailand. Eur. J. Integr. Med. 2021, 42, 101290. [Google Scholar] [CrossRef]
- Reis, F.R.; de Moraes, A.C.S.; Masson, M.L. Impact of Foam-Mat Drying on Plant-Based Foods Bioactive Compounds: A Review. Plant Foods Hum. Nutr. 2021, 76, 153–160. [Google Scholar] [CrossRef]
- Brar, A.S.; Kaur, P.; Kaur, G.; Subramanian, J.; Kumar, D.; Singh, A. Optimization of Process Parameters for Foam-Mat Drying of Peaches. Int. J. Fruit Sci. 2020, 20, S1495–S1518. [Google Scholar] [CrossRef]
- Thakur, C.; Verma, A.K.; Bhardwaj, M. Shivani Effect of Foaming Agents on Foaming Properties and Powder Yield of Rainy Season Guava Fruits Cv. Lalit. J. Pharmacogn. Phytochem. 2020, 9, 2574–2581. [Google Scholar]
- El-Salam, E.A.E.-S.; Ali, A.M.; Hammad, K.S. Foaming Process Optimization, Drying Kinetics and Quality of Foam Mat Dried Papaya Pulp. J. Food Sci. Technol. 2021, 58, 1449–1461. [Google Scholar] [CrossRef] [PubMed]
- Paula, R.R.; Vimercati, W.C.; Araújo, C.d.S.; Macedo, L.L.; Teixeira, L.J.Q.; Saraiva, S.H. Drying Kinetics and Physicochemical Properties of Whey Dried by Foam Mat Drying. J. Food Process Eng. 2020, 44, e14796. [Google Scholar] [CrossRef]
- Cól, C.D.; Tischer, B.; Hickmann Flôres, S.; Rech, R. Foam-Mat Drying of Bacaba (Oenocarpus bacaba): Process Characterization, Physicochemical Properties, and Antioxidant Activity. Food Bioprod. Process. 2021, 126, 23–31. [Google Scholar] [CrossRef]
- Ng, M.L.; Sulaiman, R. Development of Beetroot (Beta vulgaris) Powder Using Foam Mat Drying. LWT 2018, 88, 80–86. [Google Scholar] [CrossRef]
- Dehghannya, J.; Pourahmad, M.; Ghanbarzadeh, B.; Ghaffari, H. Heat and Mass Transfer Modeling during Foam-Mat Drying of Lime Juice as Affected by Different Ovalbumin Concentrations. J. Food Eng. 2018, 238, 164–177. [Google Scholar] [CrossRef]
- Isa, J.; Olalusi, A.P. Optimization of Foam-Mat Drying Process of Watermelon Pulp Using Response Surface Methodology. J. Energy Res. Rev. 2019, 3, 1–11. [Google Scholar] [CrossRef]
- Noordia, A.; Mustar, Y.S.; Kusnanik, N.W. Foam Mat Drying of Banana Juice: Varieties of Ripe Banana Analysis and Egg Albumen Foam. Food Sci. Technol. 2020, 40, 465–468. [Google Scholar] [CrossRef]
- Qadri, O.S.; Osama, K.; Srivastava, A.K. Foam Mat Drying of Papaya Using Microwaves: Machine Learning Modeling. J. Food Process Eng. 2020, 43, e13394. [Google Scholar] [CrossRef]
- Dabestani, M.; Yeganehzad, S. Effect of persian gum and xanthan gum on foaming properties and stability of pasteurized fresh egg white foam. Food Hydrocoll. 2019, 87, 550–560. [Google Scholar] [CrossRef]
- Dehghannya, J.; Pourahmad, M.; Ghanbarzadeh, B.; Ghaffari, H. Heat and mass transfer enhancement during foam-mat drying process of lime juice: Impact of convective hot air temperature. Int. J. Therm. Sci. 2019, 135, 30–43. [Google Scholar] [CrossRef]
- Azizpour, M.; Mohebbi, M.; Khodaparast, M.H.H. Effects of foam-mat drying temperature on physico-chemical and microstructural properties of shrimp powder. Innov. Food Sci. Emerg. Technol. 2016, 34, 122–126. [Google Scholar] [CrossRef]
- Buchmann, L.; Bertsch, P.; Böcker, L.; Krähenmann, U.; Fischer, P.; Mathys, A. Adsorption kinetics and foaming properties of soluble microalgae fractions at the air/water interface. Food Hydrocoll. 2019, 97, 105182. [Google Scholar] [CrossRef]
- Abbasi, E.; Azizpour, M. Avaliação das propriedades físico-químicas do pó de ginja desidratado em esteira de espuma. LWT 2016, 68, 105–110. [Google Scholar] [CrossRef]
- Leite, D.D.D.F.; Queiroz, A.J.D.M.; Figueirêdo, R.M.F.D.; Lima, L.S.L. Modelagem matemática da cinética de secagem das sementes germinadas de jaca (Artocarpus heterophyllus Lam.). Rev. Ciência Agronômica 2019, 50, 361–369. [Google Scholar] [CrossRef]
- Oliveira, D.E.C.; Resende, O.; Campos, R.C.; Sousa, K.A. Propriedades termodinâmicas de sementes de tucumã-de-goiás (Astrocaryum huaimi Mart.). Rev. Caatinga 2014, 27, 53–62. [Google Scholar]
- Asokapandian, S.; Venkatachalam, S.; Swamy, G.J.; Kuppusamy, K. Optimization of Foaming Properties and Foam Mat Drying of Muskmelon Using Soy Protein. J. Food Process Eng. 2016, 39, 692–701. [Google Scholar] [CrossRef]
- Karim, A.A.; Wai, C.C. Foam-Mat Drying of Starfruit (Averrhoa carambola L.) Purée. Stability and Air Drying Characteristics. Food Chem. 1999, 64, 337–343. [Google Scholar] [CrossRef]
- de Assis Santos e Silva, F.; de Azevedo, C.A.V. The Assistat Software Version 7.7 and Its Use in the Analysis of Experimental Data. Afr. J. Agric. Res. 2016, 11, 3733–3740. [Google Scholar] [CrossRef]
- Yuksel, A.N. Development of yoghurt powder using microwave-assisted foam-mat drying. J. Food Sci. Technol. 2021, 58, 2834–2841. [Google Scholar] [CrossRef]
- Li, T.S.; Sulaiman, R.; Rukayadi, Y.; Ramli, S. Effect of Gum Arabic Concentrations on Foam Properties, Drying Kinetics and Physicochemical Properties of Foam Mat Drying of Cantaloupe. Food Hydrocoll. 2021, 116, 106492. [Google Scholar] [CrossRef]
- Susanti, D.Y.; Sediawan, W.B.; Fahrurrozi, M.; Hidayat, M. Foam-Mat Drying in the Encapsulation of Red Sorghum Extract: Effects of Xanthan Gum Addition on Foam Properties and Drying Kinetics. J. Saudi Soc. Agric. Sci. 2021, 20, 270–279. [Google Scholar] [CrossRef]
- Khodifad, B.C.; Kumar, N. Foaming Properties of Custard Apple Pulp and Mathematical Modelling of Foam Mat Drying. J. Food Sci. Technol. 2020, 57, 526–536. [Google Scholar] [CrossRef]
- Watharkar, R.B.; Chakraborty, S.; Srivastav, P.P.; Srivastava, B. Foaming and Foam Mat Drying Characteristics of Ripe Banana Musa balbisiana (BB) Pulp. J. Food Process Eng. 2021, 44, e13726. [Google Scholar] [CrossRef]
- Ozcelik, M.; Heigl, A.; Kulozik, U.; Ambros, S. Effect of Hydrocolloid Addition and Microwave-Assisted Freeze Drying on the Characteristics of Foamed Raspberry Puree. Innov. Food Sci. Emerg. Technol. 2019, 56, 102183. [Google Scholar] [CrossRef]
- Macedo, L.L.; Corrêa, J.L.G.; Araújo, C.d.S.; Vimercati, W.C.; Pio, L.A.S. Process Optimization and Ethanol Use for Obtaining White and Red Dragon Fruit Powder by Foam Mat Drying. J. Food Sci. 2021, 86, 426–433. [Google Scholar] [CrossRef]
- Thuwapanichayanan, R.; Prachayawarakorn, S.; Soponronnarit, S. Effects of foaming agents and foam density on drying characteristics and textural property of banana foams. LWT 2012, 47, 348–357. [Google Scholar] [CrossRef]
- Ospina, M.M.; Sepulveda, J.U.; Restrepo, D.A.; Cabrera, K.R.; Suárez, H. Influencia de goma xantan y goma guar sobre las propiedades reológicas de leche saborizada con cocoa. Biotecnol. Sect. Agropecu. Y Agroind. 2012, 10, 51–59. [Google Scholar]
- Tan, S.L.; Sulaiman, R. Color and Rehydration Characteristics of Natural Red Colorant of Foam Mat Dried Hibiscus sabdariffa L. Powder. Int. J. Fruit Sci. 2020, 20, 89–105. [Google Scholar] [CrossRef]
- Poonnakasem, N. Effect of Foaming and Drying Conditions on Physicochemical Properties and Moisture Kinetics of Foam Mat Dried Chili Sauce Powder during Storage. J. Food Process. Preserv. 2021, 45, e15329. [Google Scholar] [CrossRef]
- Buljat, A.M.; Jurina, T.; Jurinjak Tušek, A.; Valinger, D.; Gajdoš Kljusurić, J.; Benković, M. Applicability of Foam Mat Drying Process for Production of Instant Cocoa Powder Enriched with Lavender Extract. Food Technol. Biotechnol. 2019, 57, 159–170. [Google Scholar] [CrossRef]
- Ayetigbo, O.; Latif, S.; Abass, A.; Müller, J. Drying Kinetics and Effect of Drying Conditions on Selected Physicochemical Properties of Foam from Yellow-Fleshed and White-Fleshed Cassava (Manihot esculenta) Varieties. Food Bioprod. Process. 2021, 127, 454–464. [Google Scholar] [CrossRef]
- Silva, W.A.; Figueirêdo, R.M.F.; Queiroz, A.J.M.; Santos, F.S.; Wanderley, R.O.S.; Paiva, Y.F.; Moura, H.V.; Sousa, E.P. Foam-Mat Drying of Prickly Pear and Acerola Mixed Pulp: Kinetics and Thermodynamic Properties. Sylwan 2021, 165, 538–556. [Google Scholar]
- Cavalcante, M.D.; Belisário, C.M.; Oliveira, D.E.C.; Maia, G.P.A.G.; Ferreira Júnior, W.N.; Resende, O. Adjustment of Mathematical Models in the Drying of Cagaita Pulp in Foam-Layer. Food Sci. Technol. 2021, 41, 563–567. [Google Scholar] [CrossRef]
- Gonzaga, B.B.N.; Coelho, B.E.S.; de Sousa, K.d.S.M.; de Araújo, S.G.; Duarte, V.M.; Silva, L.F.M. Production and Quality of Pineapple Juice with Mint Powder by Foam-Mat Drying. Comun. Sci. 2021, 12, e3382. [Google Scholar]
- Azeez, L.; Adebisi, S.A.; Oyedeji, A.O.; Adetoro, R.O.; Tijani, K.O. Bioactive Compounds’ Contents, Drying Kinetics and Mathematical Modelling of Tomato Slices Influenced by Drying Temperatures and Time. J. Saudi Soc. Agric. Sci. 2019, 18, 120–126. [Google Scholar] [CrossRef]
- Wang, W.; Li, M.; Hassanien, R.H.E.; Wang, Y.; Yang, L. Thermal Performance of Indirect Forced Convection Solar Dryer and Kinetics Analysis of Mango. Appl. Therm. Eng. 2018, 134, 310–321. [Google Scholar] [CrossRef]
- Morais, M.F.; dos Santos, J.R.O.; dos Santos, M.P.; Santos, D.d.C.; da Costa, T.N.; Lima, J.B. Modeling and Thermodynamic Properties of ‘Bacaba’ Pulp Drying. Rev. Bras. Eng. Agrícola E Ambient. 2019, 23, 702–708. [Google Scholar] [CrossRef]
- Kamali, R.; Dadashi, S.; Dehghannya, J.; Ghaffari, H. Production of Green Banana Powder Using Foam-mat Drying as Influenced by Drying Air Temperature: Experimental and 3D Numerical Study. J. Food Process. Preserv. 2021, 44, e13703. [Google Scholar] [CrossRef]
- Sangamithra, A.; Sivakumar, V.; Kannan, K.; John, S.G. Foam-Mat Drying of Muskmelon. Int. J. Food Eng. 2015, 11, 127–137. [Google Scholar] [CrossRef]
- Reis, D.S.; Figueiredo Neto, A.; Ferraz, A.d.V.; de Freitas, S.T. Produção e Estabilidade de Conservação de Farinha de Acerola Desidratada Em Diferentes Temperaturas. Braz. J. Food Technol. 2017, 20, 1–7. [Google Scholar] [CrossRef]
- Tavone, L.A.d.S.; Nascimento, K.M.; Fachina, Y.J.; Madrona, G.S.; Bergamasco, R.d.C.; Scapim, M.R.d.S. Mathematical Modeling and Effect of Thin-Layer Drying and Lyophilization on Antioxidant Compounds from Ultrasonic-Assisted Extracted Muntingia Calabura Peels. Acta Sci.-Agron. 2021, 43, e50301. [Google Scholar] [CrossRef]
- Oliveira, G.Q.; do Nascimento, R.A.; Costa, J.F.; Santana, E.B.; Costa, C.M.L.; Ribeiro, N.F.d.P. Drying of Banana Pseudo-Stem Fibers: Evaluation of Kinetic Models, Effective Diffusivity, Thermodynamic Properties, and Structural Characterization. J. Nat. Fibers 2022, 19, 3654–3667. [Google Scholar] [CrossRef]
- Silva, N.L.; Crispim, J.M.S.; Vieira, R.P. Kinetic and Thermodynamic Analysis of Anthocyanin Thermal Degradation in Acerola (Malpighia emarginata D.C) Pulp. J. Food Process. Preserv. 2017, 41, e13053. [Google Scholar] [CrossRef]
- Kaur, R.; Gera, P.; Jha, M.K.; Bhaskar, T. Pyrolysis Kinetics and Thermodynamic Parameters of Castor (Ricinus communis) Residue Using Thermogravimetric Analysis. Tecnol. Biorecursos 2018, 250, 422–428. [Google Scholar] [CrossRef]
- Anabel, F.; Celia, R.; Germán, M.; Rosa, R. Determination of Effective Moisture Diffusivity and Thermodynamic Properties Variation of Regional Wastes under Different Atmospheres. Case Stud. Therm. Eng. 2018, 12, 248–257. [Google Scholar] [CrossRef]
- Ferreira, J.P.L.; Silva, W.P.; Queiroz, A.J.M.; Figueirêdo, R.M.F.; Gomes, J.P.; Melo, B.A.; Santos, D.C.; Lima, T.L.B.; Branco, R.R.C.; Hamawand, I.; et al. Description of Cumbeba (Tacinga inamoena) Waste Drying at Different Temperatures Using Diffusion Models. Foods 2020, 9, 1818. [Google Scholar] [CrossRef]
Disclaimer/Publisher’s Note: The statements, opinions and data contained in all publications are solely those of the individual author(s) and contributor(s) and not of MDPI and/or the editor(s). MDPI and/or the editor(s) disclaim responsibility for any injury to people or property resulting from any ideas, methods, instructions or products referred to in the content. |
© 2023 by the authors. Licensee MDPI, Basel, Switzerland. This article is an open access article distributed under the terms and conditions of the Creative Commons Attribution (CC BY) license (https://creativecommons.org/licenses/by/4.0/).