Abstract
In the laser powder bed fusion process (PBF-LB), components are built up incrementally by locally melting metal powder with a laser beam. This process leads to inhomogeneous material properties of the manufactured components. By integrating these specific material properties into a topology optimization algorithm, product developers can be supported in the early phases of the product development process, such as design finding. For this purpose, a topology optimization method was developed, which takes the inhomogeneous material properties of components fabricated in the PBF-LB process into account. The complex pore architecture in PBF-LB components was studied with micro-computed tomography (µCT). Thereby, three characteristic regions of different porosity were identified and analyzed. The effective stiffness in each of these regions was determined by means of resonant ultrasonic spectroscopy (RUS) as well as finite element analysis. Afterward, the effective stiffness is iteratively considered in the developed topology optimization method. The resulting design proposals of two optimization cases were analyzed and compared to design proposals derived from a standard topology optimization. To evaluate the developed topology optimization method, the derived design proposals were additionally manufactured in the PBF-LB process, and the characteristic pore architecture was analyzed by means of µCT.
1. Introduction
Lightweight design is becoming increasingly important in modern industrial product development [1]. In many fields, such as aerospace or the automotive sector, the use of lightweight structures achieves ecological as well as economic advantages. To achieve such advantages, it is important that lightweight design activities are always applied to the overall system and are considered early in the development process [2]. One possibility for achieving ecological advantages is the design method of function integration [1]. Here, a variety of functions are realized in one component instead of several components, which saves connecting elements and, thus, reduces weight. The derivation of design proposals that incorporate the basic ideas of function integration is often realized with the help of design catalogs or simulation and optimization tools [3,4]. In particular, topology optimization is increasingly applied in recent years and employed to derive initial design proposals.
Topology optimization methods comprise a large number of different approaches [5]. These include, for example, the level set method [6,7,8], topological derivative [9] and evolutionary algorithms [10] as well as the phase field [11] and density-based approaches [12,13,14]. In particular, the latter describes the most used method to date, in a commercial solver but is still a subject of research.
Density-based topology optimization employs an iterative approach based on the finite element method (FEM) to identify the existing load paths and derive the optimal material distribution in a given design space. During this iterative procedure, fictive densities, which are directly related to the Young’s modulus, are systematically adjusted per element until a defined convergence criterion is met. The most common objective function of such topology optimizations is to maximize the stiffness under a given volume reduction [15]. To solve this optimization problem, two approaches can be distinguished in density-based topology optimization: the sensitivity-based and the controller-based approach.
Within the first approach, the optimization problem is solved by calculating and evaluating sensitivities. This approach also allows the integration of additional restrictions, such as a minimum wall thickness or a maximum strength constraint. In comparison, in the controller-based approach, an optimality criterion is defined, which applies exclusively to one optimization case. Based on this criterion, the optimization problem is solved in a certain number of iterations and is, thus, computationally more efficient but less versatile than the sensitivity-based approach [16]. However, both approaches share the fact that the derived design proposals often consist of geometrically complex structures that make manufacturing either non-viable or overpriced [4]. Therefore, product developers often have to accept process-related restrictions with regard to the component geometry if only conventional manufacturing processes are available.
Additive manufacturing is one possibility to reduce these process-related restrictions, since it can increase the process-specific design freedom by building up a component layer by layer. One example is the laser powder bed fusion process (PBF-LB). In this process, components are built up incrementally by local melting of metal powder with a high-energy laser beam [17]. The high cooling rates in the PBF-LB process result in a unique microstructure, which can lead to a superior strength compared to cast components [18]. The quality of PBF-LB components is significantly influenced by various defects, such as porosity or cracks.
Incompletely consolidated metal powder due to an insufficient laser energy density leads, for example, to the formation of lack-of-fusion defects [17]. At higher scanning speeds, the metal tends to solidify in periodic droplets, which is known as the balling phenomenon [19]. Increased porosity typically occurs at the end of a laser track due to the keyhole-effect [20]. During scanning, particularly at high laser intensities, a vapor capillary can form inside the melt pool. When the laser is switched off at the end of a track, the vapor capillary collapses, which can lead to the formation of keyhole pores [21]. Adjusting the laser trajectory, such as by using the sky-writing strategy, can reduce keyhole porosity but can, on the other hand, lead to an increase in lack-of-fusion defects [22].
To improve the surface quality, the contour of each layer (contour area) is scanned first (see Figure 1). Afterwards, the hatching of the inner areas (hatching area) takes place. Therefore, an increase in keyhole-porosity can be found in the interface between the contour and hatching area leading to an inhomogeneous distribution of pores in PBF-LB components [23,24]. During a cyclic load, pores can lead to crack initiation and have therefore a major impact on the fatigue performance of a component [25]. However, porosity also has an influence on the material’s strength and stiffness, which was investigated in a previous study [24].
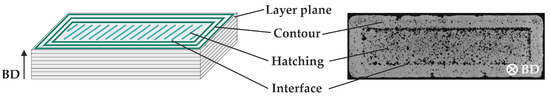
Figure 1.
Schematic drawing (left) and projection of the minimum gray value obtained by micro-computed tomography (right) of the three characteristic regions of different porosities in PBF-LB components.
In [24], samples were manufactured in the PBF-LB process with varying processing parameters leading to different porosities. Ultrasonic methods were then used to determine the elastic material behavior as a function of porosity. Finally, the shape of the pores can be correlated with the anisotropy regarding the elastic properties by means of micro-computed tomography (µCT). The elastic behavior can also be influenced by additional parameters, such as residual stresses or the crystallographic texture, which was investigated in the study of Charmy et al. for additively manufactured stainless steel 316L [26].
To characterize the elastic material properties of additively manufactured materials, ultrasonic methods are a widely employed tool. Compared to quasi-static methods, ultrasonic methods have a significantly higher accuracy and often allow the testing of small-sized samples [27]. In addition, due to the small amplitudes of the ultrasonic waves, there is no formation of non-linearities, such as local plasticity. The pulse-echo-method uses time of flight measurements of ultrasonic pulses to determine the sound velocity and, thus, to calculate the elastic constants [28].
In the ultrasonic phase spectroscopy (UPS), phase comparisons of continuous ultrasonic waves are used to determine the sound velocity that is suitable for porous materials [24]. However, both methods require the size of the sample to be larger than the wavelength of the sound waves, which is typically in the range of a few millimeters [29]. Due to the high freedom in component design, the geometry of additively manufactured components is often complex and contains many thin-walled structures, which raises difficulties in testing them with the aforementioned ultrasonic methods.
Resonant ultrasound spectroscopy (RUS) is a method that allows the testing of small samples since there are no requirements regarding the plane wave propagation [30]. The method uses the natural frequencies from samples with a simple geometry, such as cylinders or cuboids. In addition the geometry and the natural frequencies depend on the sample’s density, the damping and the elastic constants. Therefore, the elastic constants can be determined by iteratively adapting the theoretically calculated natural frequencies of a sample to experimentally determined natural frequencies.
With this method, the complete elastic tensor can be determined in a single measurement with an accuracy of up to 0.5% for the directional compression moduli (), 0.02% for the shear moduli () and 2.0% for the off-diagonal moduli () [30]. However, for an accurate measurement, the geometry of the sample needs to be precise with maximum parallelism and perpendicularity errors of 0.1% [30]. In the literature, studies can be found using the RUS method to determine elastic properties of additively manufactured material. Fisher used the RUS method to determine the effective elastic constants for additively manufactured lattice structures out of 316L stainless steel [31].
The work of MCGuigan et al. followed the approach of using RUS for quality control of geometrically complex lattices out of CoCrMo manufactured in the PBF-LB process [32]. Rossin et al. used the RUS method together with the finite element method to detect changes regarding the natural frequencies due to the recrystallization of additively manufactured IN625 samples [33]. The impact of heat treatment on the elastic anisotropy of additively manufactured AlSi10Mg was studied from Van Cauwenbergh et al. For all investigated heat-treated conditions as well as for the as-built samples, an almost isotropic behavior was found [34].
As previously described, components manufactured with the PBF-LB process typically show regions with locally different material properties, such as the contour, the interface and the hatching areas. Additionally, the material properties can be dependent on the construction angle of the component [35]. Thus, there is a direct interaction between the product (design) and production system (PBF-LB) [36]. If such interactions are not considered until late phases of product development, this may lead to necessary revisions in the design and, thus, to additional costs [37]. Clausen et al. [38] and Suresh et al. [39] investigated such interactions and integrated these in a topology optimization.
Thus, the dependence and influence of their consideration on the optimization result was demonstrated. However, both applied different material properties to the entire surface, causing the building direction as it results from the PBF-LB process to not be considered. Furthermore, only one area was considered depending on the surface and not multiple areas. Therefore, a new topology optimization method was developed using the PBF-LB process as an example [36]. With this method, the characteristic material properties of the lightweight design alloy AlSi10Mg were considered in early phases of product development [40]. The method considers, for the first time, the unique distribution of porosity and the resulting elastic behavior in order to create a component design that is adapted for the PBF-LB process. To demonstrate and evaluate the benefits of the developed optimization method, this work presents simulative analyses as well as a comparison with the real manufactured design proposals.
Hence, this work starts with an introduction of the developed topology optimization method for components manufactured in the PBF-LB process. Subsequently, characterization of the material properties is presented, where representative samples were manufactured in the PBF-LB process out of AlSi10Mg and first analyzed with µCT. This is followed by an approach to determine the locally varying material behavior, combining experimental testing with systematic FEM simulation and µCT. Then, the evaluation of the developed optimization method is performed by applying it to a beam under bending load. Finally, the µCT characterization results of the optimized beams, which were manufactured using the PBF-LB process, are shown.
2. Material and Methods
2.1. Material
AlSi10Mg powder supplied from m4p material solutions GmbH with a powder bulk density of 1.51 g cm−3 was used for manufacturing the samples and components discussed in this work. The chemical composition of the powder is shown in Table 1. The size distribution of the particles with D10 = 20.0 m, D50 = 37.4 m and D90 = 54.4 m is given in Figure 2.

Table 1.
Chemical composition of the AlSi10Mg powder particles in wt.%.
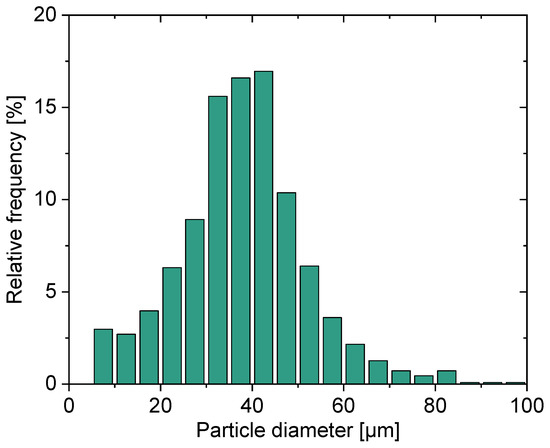
Figure 2.
Particle size distribution of the powder used in this work.
2.2. Sample Processing
All of the PBF-LB samples shown in this work were manufactured with the PBF-LB machine Creator developed by O.R. Lasertechnologie GmbH (now 2oneLab GmbH, Darmstadt, Germany). The machine was equipped with an Ytterbium fiber laser (YLM-150) at a maximum power of 250 W and a wavelength of 1070 nm. To prevent oxidation, the building process was performed in an Argon atmosphere with an oxygen content <0.1%. The samples were built without base plate preheating at a laser power of 250 W, a scan speed of 900 mm s−1, a hatch distance of 150 m, a layer thickness of 30 m and a nominal laser spot diameter of 40 m. The scanning strategy is a widely used bidirectional line scanning strategy that initially scans the contour of each layer with a triple perimeter scan followed by hatching the inside region (see Figure 1). Between subsequent layers, the hatching direction was rotated by 67.
For the whole study, different types of samples were fabricated, and these are summarized in Table 2.
Table 2.
Summary of the analyzed samples.
To study the porosity distribution and to analyze the elastic material behavior, rectangular samples with a cross section of mm2 and a height of 60 mm were manufactured at construction angles of 90 (vertical alignment), 75, 60 and 45 without the use of supports. In order to characterize the elastic-plastic material behavior, cylindrical tensile samples were fabricated with a diameter of 4 mm and a gauge length of 30 mm in a vertical alignment.
For validation of the developed process-specific topology optimization method of this work, the derived design proposals for bending beams were manufactured using the same set of processing parameters.
2.3. Experimental Characterization
2.3.1. Resonant Ultrasound Spectroscopy
As discussed earlier, the PBF-LB process is suitable for fabricating complex components with fine structures in the range of several millimeters. To characterize the elastic material properties for millimeter-sized samples, the resonant ultrasound spectroscopy (RUS) is, therefore, a suitable method. In order to measure the resonance frequencies, first, rectangular samples with the dimensions 1.2 × 1.4 × 2.0 mm3 were prepared out of the inner hatching area of bulk material built under a construction angle of 90 by electric discharge machining (EDM). After EDM, the samples were additionally ground to ensure parallelism and squareness. For comparison, samples with the same dimensions were additionally manufactured out of an ingot of cast AlSi10Mg. The setup for the RUS measurements is shown in Figure 3 and was adapted from [41].
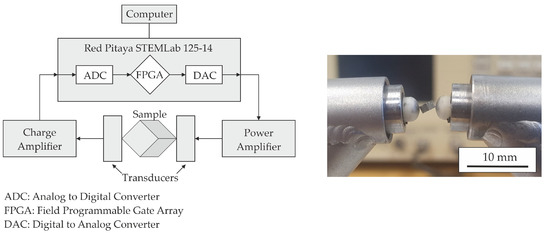
Figure 3.
Schematic diagram of the setup used for RUS (left) and an RUS sample between two transducers (right).
To amplify the input signal, a high speed amplifier (BA4825 from NF Corporation, Yokohama, Japan) was used. During the measurement, the samples were placed between two identical piezoelectric transducers, which were arranged in a spring-loaded configuration in order to reduce contact forces. For each sample, three spectra were recorded. After each measurement, the arrangement of the sample between the transducer was changed in order to capture as many modes as possible. Each spectrum was recorded from 100 kHz to about 2.5 MHz so that the first 30 resonances of each sample could be analyzed.
To derive the elastic constants, an approach was taken that iteratively calculates the resonances for a sample of the same geometry with varying elastic constants until a suitable fit with the measured resonances is achieved [42]. Therefore, an analysis code provided by the Los Alamos National Laboratory (Los Alamos, NM, USA) was used in this work [41]. In each iteration, the code uses the Lagrange minimization method to compute the resonance frequencies out of the given elastic constants. The fitting of the elastic constants then works with the Levenberg–Marquardt method for rectangular or cylindrical samples.
2.3.2. Micro-Computed Tomography
For a detailed investigation of the porosity of the PBF-LB material, µCT investigations were conducted. Therefore, the µCT-System PRECISION developed by YXLON International GmbH (Heidelberg, Germany) was used in this investigation. An acceleration voltage of 165 kV and a target current of 0.06 mA were used to generate the X-ray beam for scanning the samples. This led to a tube power of 10 W and, therefore, to an effective focal spot size of about 10 m [43].
The intensity of the X-rays was captured with a Perkin Elmer XRD1620 AN flat panel detector with a pixel pitch of 200 m and a total size of 2048 × 2048 pixels. A focus object distance (FOD) of 26.2 mm together with a focus detector distance (FDD) of 829.9 mm were used to scan the samples, resulting in a voxel-size of 6.3 m. A total of 1860 projections were captured for each sample. 3D images were reconstructed using a filtered back projection (FBP) algorithm in VGStudioMAX 3.4 by Volume Graphics International GmbH (Heidelberg, Germany).
Projections of the minimum gray values were generated along the building direction using the thick slab algorithm of VGStudioMAX 3.4 for qualitative investigation of defect hotspots in the samples. Binarization of the samples was processed by a local threshold algorithm after Sauvola with a local domain radius of 15 voxels in ImageJ [44]. For noise reduction, pores with a volume smaller than 8 voxels (2 × 2 × 2) were discarded in the analysis, which was performed with VGStudioMAX 3.4.
2.3.3. Tensile Testing
The tensile tests of the vertically built cylindrical AlSi10Mg samples were performed at room temperature with a universal testing machine from ZwickRoell GmbH (Ulm, Germany) with a maximum load of 200 kN. A preload of 100 N was applied, and the tests were conducted at a strain rate of 1 mm min−1 until fracture of the samples. A tactile extensometer was used for strain measurement.
2.4. Numerical Characterization
As already discussed, PBF-LB components typically show characteristic regions with locally varying porosities and, therefore, locally different material properties. A typical region with higher porosity in PBF-LB components is, for example, the interface between the contour and hatching area. Typically, this region has a small thickness of about 100 m, thereby, making it difficult to experimentally characterize [23]. Therefore, an approach was used in this study in which the 3D microstructure was reconstructed from binarized µCT-data to determine effective elastic constants with the use of finite element analysis (FEA).
Tetrahedral FE meshes were generated from rectangular regions of interest (ROI) in the contour area, the hatching area and the interface between contour and hatching. The meshing was accomplished with VGStudioMax 3.4. The meshing algorithm works directly with the volumetric data of the µCT scan to create tetrahedral volume meshes. To optimize the meshing settings, such as the size of the elements as well as the maximum deviation to the µCT data, a parametric study was performed (see Figure 4). The influence of several different meshes on the simulation results and the required computation time were evaluated.
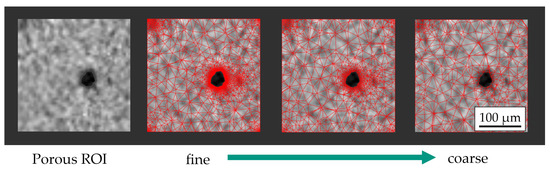
Figure 4.
Trade-off between the computational effort and accuracy exemplified by an ROI with a single pore.
The best trade-off between accuracy and computation time was found to be a local mesh refinement around the pores for their detailed modeling. After meshing, the form factors of the elements in the derived meshes (quotient of tetrahedral volume and the volume of a tetrahedron with the same enveloping sphere) was reduced iteratively by an automated mesh optimization algorithm implemented in the commercial software package VGStudioMax 3.4.
For each derived FE mesh, frequency analyses were performed using the Lanczos-Eigensolver in Abaqus 2019 in order to determine the natural frequencies of the porous ROIs [45]. As shown in a previous study, it is a good assumption to use the Young’s Modulus, the Poisson’s ratio and the density of dense cast AlSi10Mg (E = 75.7 GPa, = 0.338, = 2.670 g cm−3) as material properties of the bulk material [24]. The analysis code from the Los Alamos National Laboratory, which was described earlier, was again used to determine the effective elastic constants out of the obtained frequencies from the rectangular ROIs. In Figure 5, one FE mesh of each of the characteristic regions with the size of 2.50 × 2.50 × 0.05 mm3 is shown. Each mesh typically contains about 100,000 quadratic tetrahedral elements (C3D10).
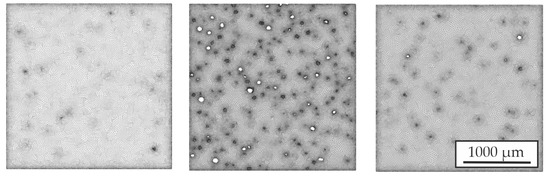
Figure 5.
FE meshes reconstructed from µCT data. Contour (left), interface (mid) and hatching area (right).
Before the study was performed, the natural frequencies of a rectangular model of the same size and without any pores were calculated with the Lanczos-Eigensolver in Abaqus 2019 and compared to the results of the Los Alamos analysis code. A root mean square error (rms) of 0.3% of the first 30 natural frequencies was obtained allowing the described method to be used further.
Finally, the obtained effective material properties for each of the three regions were assigned to a material database. This allows an automated assignment of the local material properties within the component to be optimized for the topology optimization algorithm.
2.5. Topology Optimization Method
In order to directly consider the three characteristic regions, including their material properties, to derive an initial component design, an optimization method was developed. This developed method is based on interrupting the topology optimization in each iteration. During this interruption, the locally varying material properties resulting from the PBF-LB process are integrated into the optimization to progress to the next iteration. The detailed procedure of the optimization method has been presented and discussed in [36,40,46]. Since this work focuses on the comparison between the design proposals of the optimization method and the real manufactured components, a summary of the fundamental procedure of the optimization method is presented below for a better understanding.
The developed optimization method is build on a sensitivity-based topology optimization, including the solver of the software Tosca 2019 from Dassault Systems (Vélizy-Villacoublay, France). Its starting point is the import of a component (e.g., a CAD file) to be optimized into the FE software (Abaqus 2019 in this work). Afterwards, the initial FE mesh and load case, including the boundary conditions as well as the optimization parameters, have to be set. Using these settings, a topology optimization was started in Tosca Structure 2019 [46]. The used settings to achieve the results of this work can be found in Section 3.2. In each iteration, the topology optimization was interrupted directly before the start of the solver.
During this interruption, the current intermediate result is exported as a smoothed surface mesh (see Figure 6) using Tosca Structure. Therefore, a Laplace smoothing algorithm was employed, which iteratively shifts the mesh nodes in such a way that a smoothed surface is created [47,48]. Based on this smoothed surface mesh, the boundaries (offset 1 and offset 2) between the three characteristic regions are derived in the form of surface meshes (see Figure 6). Offset 1 corresponds to the boundary between the contour and interface areas and offset 2 to the boundary between the interface and hatching areas.
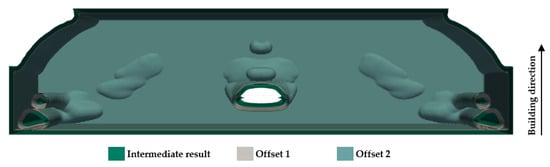
Figure 6.
Surface meshes of the intermediate result, offset 1 and offset 2.
By means of these three surface meshes (intermediate result, offset 1 and offset 2), a division into the three characteristic regions is possible (see Figure 7 top). For this purpose, the volumes between the surface meshes are meshed with tetrahedral elements. [46] However, to ensure that the three characteristic regions are not present in all spatial directions but correspond to the actual appearance from the PBF-LB process (see Figure 1), a filtering process is performed along the building direction. Thereby, elements that lie exactly in the layer plane are subjected to a separate examination and assigned to the respective area. A detailed description of the filtering process is given in [36]. The results of this filtering are shown in Figure 7 bottom.
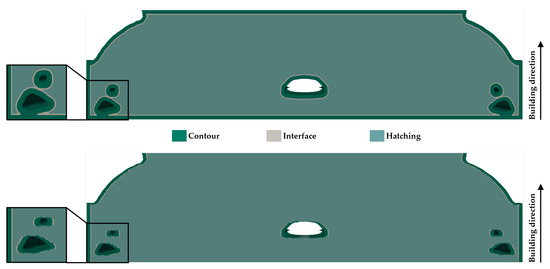
Figure 7.
Meshed intermediate results, including divided areas: Unfiltered (top) and filtered (bottom).
To ensure that the varying material properties between the characteristic regions (contour, interface and hatching) are considered in the topology optimization, a MySQL-based database containing the respective material properties serves as a tool for the automated transfer to the corresponding areas. Thus, each element receives the respective elastic material properties from the database depending on its region affiliation [36].
Thus, the intermediate result of the current iteration is provided with separated regions and associated material properties. However, since the topology optimization operates on the basis of the initial FE mesh, the local varying material properties must also be assigned to it. Therefore, the mapper software MapLib from Fraunhofer SCAI (Sankt Augustin, Germany) is employed, and the material properties are transferred by means of weighted element mapping (see Figure 8).
Figure 8.
Initial FE mesh of the topology optimization, including the transferred material properties.
Based on these provided material properties per element in the initial FE mesh of the topology optimization, the next iteration is computed. Afterwards, the next iteration is interrupted again. During this interruption, the described steps, including export of the intermediate result, calculation of offsets, material transfer as well as mapping, are performed. This procedure is continued until the topology optimization reaches a predefined convergence criterion resulting in an optimized design proposal [46].
3. Results and Discussion
3.1. Material Characterization
3.1.1. Mechanical Testing
To characterize the elastic-plastic material behavior, tensile tests of samples in vertical alignment were performed. The results of the tensile tests are shown in Table 3. The material data was derived out of the recorded stress–strain curves according to the standard DIN EN ISO 6892-1 [49]. The ultimate tensile strength as well as and the elongation are in accordance with the values reported in the literature [50].
Table 3.
The tensile properties of vertically built AlSi10Mg samples.
3.1.2. Resonant Ultrasound Spectroscopy
In Figure 9, the RUS spectra of a cast and a PBF-LB sample are shown.
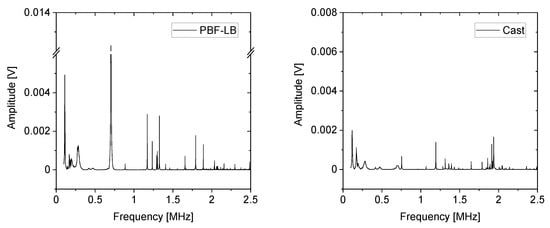
Figure 9.
RUS spectrum of a sample fabricated in the PBF-LB process (left) and of a cast AlSi10Mg sample (right).
The resonance frequencies were determined from the positions of the peaks. The fitted elastic constants obtained from the first 30 resonance frequencies are shown in Table 4 as well as the rms (root mean square) error between the measured and the computed resonances for each sample. The samples for RUS were prepared out of the homogeneous inner hatching area of a fabricated part. Therefore, the elastic material behavior was locally assumed to be isotropic, which is in good agreement with the findings of a previous study [24]. The computed Young’s modulus (E) and the Poisson’s ratio () are additionally presented in Table 4.
Table 4.
Results from the RUS measurements.
For all of the samples, the rms values are smaller than 1%, which is acceptable according to literature [41]. During RUS measurements, it is common that many resonances may be missed. These missed resonances can result from nodes near the corner of a sample or from two resonances that are degenerate or too close to each other to be separated. Measuring each sample multiple times in different arrangements between the transducers resulted in a reduction of the number of missed modes by sample to less than the required 10% of the amount of resonances measured [30]. In general, the obtained values for the Young’s modulus are slightly larger compared to the results from the tensile tests, which was previously discussed in Section 1.
Table 5 compares the results of the RUS measurements with the results calculated from the average sound velocities obtained by ultrasonic phase spectroscopy (UPS) in a previous study [24]. The results show a slight overestimation for and underestimation for , which can be related to challenges in preparation of the RUS samples, which need to be precise regarding parallelism and perpendicularity as described in Section 1. The cast samples for the RUS and UPS measurements were prepared out of the same batch. The PBF-LB samples were fabricated with the same processing parameters and have similar values of porosity. Therefore, differences regarding the microstructure can be excluded.
Table 5.
Comparison between RUS and UPS measurements.
3.1.3. Micro-Computed Tomography
For detailed investigation of porosity, µCT images were taken from representative areas of rectangular samples built under varying construction angles. For each sample, projections of the minimum gray values at 3 mm normal to the building direction (BD) are shown in Figure 10.
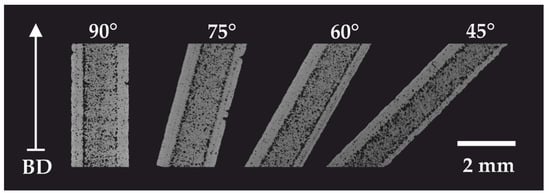
Figure 10.
Projections of the minimum gray value give a qualitative overview regarding the distribution of pores in each sample.
The three regions of different porosities (contour, hatching and interface), which were described earlier, can be seen clearly. For a detailed analysis of porosity, the µCT images were binarized. Table 6 shows the global porosity of each sample. To obtain information about the pore morphology, the average sphericity of each pore is additionally given.
Table 6.
Results from the µCT analysis.
In general, a smaller construction angle leads to an increase in global porosity due to the thinner contour area at the downskin surface of the sample. Due to the insulating effect of the surrounding powder, heat buildup occurs in the PBF-LB process of samples with a smaller construction angle, which can additionally promote the formation of hydrogen pores [51,52]. However, the average sphericity of the pores is quite high, suggesting that the majority of pores have a spherical shape, which supports the assumption of isotropic elastic material behavior.
In Figure 11, the local porosity as a function of the horizontal distance to the downskin surface is presented for a sample built under a construction angle of 75. A significant peak of high local porosity up to 3.5% in the interface between the contour and hatching area can be clearly identified.
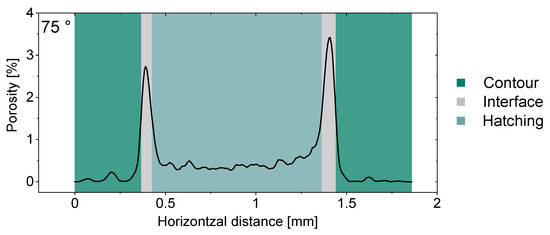
Figure 11.
Porosity distribution as a function of the horizontal distance to the downskin surface for a sample built under a construction angle of 75.
For further analysis, the size of each characteristic region was determined. Therefore, the peaks were fitted using a Gaussian function. The full width at half maximum (FWHM) was defined as the width of the interface area (see Figure 11). The size of the contour area was determined as the distance between the start of the interface area and the surface of the sample. The results are given in Figure 12 for samples built under varying construction angles.
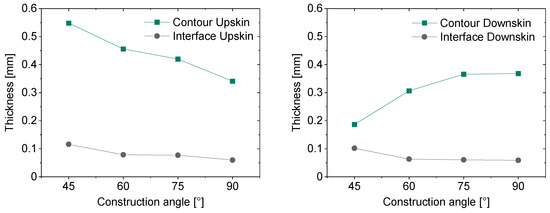
Figure 12.
The sizes of the characteristic regions for different construction angles of the upskin surface (left) and downskin surfce (right).
Due to the triple perimeter scan, the contour areas of each sample are much larger than the interface area. For smaller construction angles, a clear reduction in the size of the contour area at the downskin surface can be seen. The size of the interface areas appears to be independent from the construction angle. This behavior can be attributed to a geometric effect. During the exposure of the hatching area at the downskin surface, the contour area of the previously exposed layers is partially melted as well. This leads to a shift of the interface between the contour and hatching area outwards, thus, resulting in a smaller width of the contour area.
3.1.4. Numerical Characterization
To determine effective elastic constants for each of the three characteristic regions, rectangular ROIs were generated in the first step from binarized µCT images as described earlier. In the second step, the rectangular ROIs were converted into tetrahedral FE meshes. For each region, a frequency analysis was performed, using the Lanczos-Eigensolver in Abaqus 2019. In each analysis, 30 modes were calculated. Then, elastic constants were fitted with the same code used in the experimental characterization. Figure 13 shows the comparison of a single mode shape (sixth overall mode) for one FE model in each of the three regions.
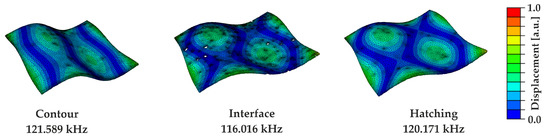
Figure 13.
Modal shape comparison of the sixth overall mode of models representing the three characteristic regions of a vertically built sample.
For better visualization, the shown displacements are scaled. The differences in the mode frequency relative to the hatching area are 1.2% for the contour area and 3.5% for the interface area. In Figure 14, the results of the fitted elastic constants and in each of the different regions for samples built under various construction angles are summarized.
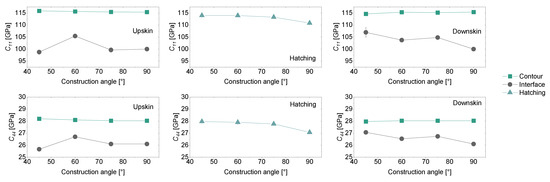
Figure 14.
The effective elastic properties in each of the three characteristic regions for samples manufactured under different construction angles.
The elastic constants show a clear difference between the characteristic regions of the samples where the highest stiffness is obtained for the contour area followed by the hatching and the interface area. For example, of the vertically built sample (construction angle 90) in the contour area is 4.1% higher compared to the hatching zone and is 14.5% smaller in the interface area. These results are in accordance with the findings of the porosity analysis shown in Figure 11.
However, no clear influence of the construction angle of the samples on the elastic properties in each region was found. Minor deviations might result from process-related differences in local porosity due to thermal lensing or irregularities regarding the shielding gas. The FE models analyzed in this study consider the influence of porosity on the effective elastic properties. The measured elastic properties and the density of cast AlSi10Mg served as input values for the bulk material [24]. To ensure that the cast AlSi10Mg has no porosity, it was analyzed with µCT [24]. However, a study of Li et al. showed a change in the grain orientations for samples built under varying construction angles [35].
Due to a slight anisotropy of the elasticity in aluminum crystals, this effect might lead to a minor change on the elastic behavior of the bulk material [53]. Additionally, PBF-LB samples typically show an inhomogeneous distribution of residual stresses, as, for example, analyzed in [54], which can also have a minor influence on the elastic properties [55].
The determined material properties were finally stored in the material database for an automated transfer to the corresponding areas during the topology optimization.
3.2. Model Setup and Simulative Comparison of the Topology Optimization Method
In order to perform a comparison between the design proposals derived through the topology optimization method and the actually manufactured components, design proposals were created. For this purpose, a three-point bending beam was chosen as an exemplary load case (see Figure 15), since its distribution of stress is easily interpretable. The bending beam was modeled as a fixed-loose bearing at the lower side edges with a predefined displacement d of 0.24 mm (corresponding to 0.5 % of the maximum width) in the center of the upper surface. In accordance with Section 2.2, no supports were considered. In [36], this bending beam was used to evaluate the developed optimization method for optimization case 1. In this work, a second optimization case is investigated. Therefore, the following two optimization cases are analyzed:
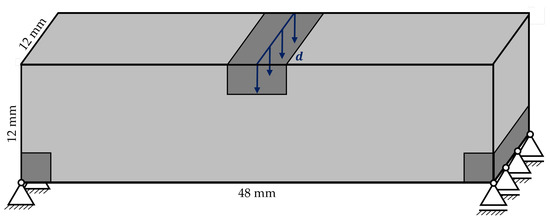
Figure 15.
Three-point bending beam with dimensions, clamping, load and restricted regions.
- Optimization case 1: Maximization of stiffness given a specified volume reduction.
- Optimization case 2: Maximization of stiffness given a specified volume reduction while maintaining a minimum wall thickness as well as a strength constraint.
As a measure of stiffness, the strain energy is employed for the two optimization cases. In order to generate a higher stiffness, the strain energy has to be maximized at a defined displacement. Thereby, a structure is created that can absorb as much internal energy as possible and, thus, has an increased resistance to deformation. The residual volume of 60 % represents the volume reduction. For optimization case 2, the additional constraints of a minimum wall thickness of 1 mm along with a maximum permissible stress of 230 MPa are specified.
The latter results from the characterization shown in Section 3.1 and is around . Furthermore, it describes the limit of linear elasticity, which is assumed in the topology optimization. The aim is to show whether these two restrictions can improve the representation of the characteristic regions and achieve an advantageous design proposal in terms of stiffness and/or strength. The minimum wall thickness results from the fact that, in each layer plane, all three characteristic regions must be present in the following order: Contour–Interface–Hatching–Interface–Contour. Thin-walled component areas can often be scanned without the use of a hatching scan, which can lead to deviations regarding the assumed porosity distributions [23].
The averaged material properties resulting from the characterization in Section 3.1 are assigned to the three characteristic regions with the use of the material database as shown before. Since the interface area in particular is very thin (see Figure 12) but must be completely represented, a global element edge length of maximum 0.1 mm was specified. Hexahedral elements with linear shape function were employed as the element type (C3D8).
To enable a comparison on a simulative level, the derived design proposals of the developed optimization method are compared to the design proposals of a standard topology optimization without iterative interruption. In order to perform this comparison, not only qualitatively but also quantitatively, a static FE analysis based on the same FE model (in this work, the initial FE model of the optimization) was built for each of the design proposals. Here, the design proposals (originating from both the developed optimization method and the standard topology optimization) have the three characteristic regions, including the material properties, assigned analogous to the procedure during the optimization method. With these transferred material properties, the static FE analysis is subsequently performed [46].
3.3. Evaluation of the Developed Optimization Method
In the following, the derived design proposals from the two optimization cases are presented qualitatively as well as quantitatively. The design proposals based on optimization case 1 were discussed in [36] and were used to evaluate the optimization method. Since these design proposals will also be compared with the actually manufactured components, a summary of the most essential findings is presented in this work.
3.3.1. Optimization Case 1
Figure 16 shows the derived design proposal for optimization case 1 based on the developed optimization method, and Figure 17 is the one from the standard topology optimization.
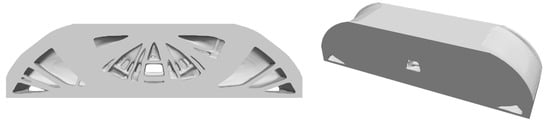
Figure 16.
Derived design proposal of the optimization method for optimization case 1: Sectional view (left) and overall view (right).

Figure 17.
Derived design proposal of the standard topology optimization for optimization case 1: Sectional view (left) and overall view (right).
By qualitatively examining the sectional views, it appears that both design proposals correspond to a kind of truss structure. The decisive factor here is the selected three-point bending beam, in which the struts transfer the main load from the center to the bearing points in the corners. Considering the overall views, fundamental differences in the design proposals become clear. The standard topology optimization (see Figure 17) creates wide indentations in the corners and a large hole in the center of the beam.
In contrast, using the developed optimization method, the indentations and the hole are significantly smaller, and a hollow structure is formed (see Figure 16). Furthermore, the developed optimization method tends to create more thin struts as can be seen in the sectional views. This becomes evident from the quantitative evaluation of the surface area, which is approximately 7% larger in the design proposal of the developed optimization method than the one from the standard topology optimization. The reason is that the three characteristic regions are considered iteratively: Since the contour area has the best material properties, the optimizer seeks to maximize it, resulting in the larger surface at the same time.
Considering the static FE analysis (see Figure 18 and Figure 19) together with the varying densities in the three characteristic regions, it turns out that, by increasing the contour area, the weight-specific stiffness [mJ g−1] of the design proposal of the developed optimization method is about 1% higher, thus, creating a stiffer design proposal [36].
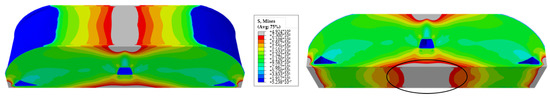
Figure 18.
Results of the static FE analysis for the derived design proposal of the developed optimization method under the boundary conditions of optimization case 1.
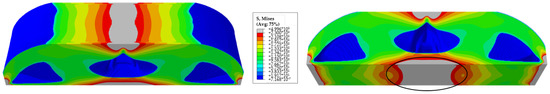
Figure 19.
Results of the static FE analysis for the derived design proposal of the standard topology optimization under the boundary conditions of optimization case 1.
In addition to the weight-specific stiffness, the static FE analysis also shows the distribution of stresses for the derived design proposals. It is evident that the maximum stresses occur at the regions of force and bearing application as well as in the center of the beam’s bottom side (see the gray areas in Figure 18 and Figure 19). The latter (marked in black) result is from the bending load case and the tensile stress caused by it.
Due to the selected model setup and the associated nodal displacement, the regions of force and bearing application as well as areas on the bottom side of the beams exceed the measured of around 230 MPa (see Section 3.1). The exceeding of the allowable stress on the bottom side of the beams may be avoided or reduced by targeted material redistribution. However, this does not apply to the regions of force and bearing application due to the imposed nodal displacement and associated numerical restrictions [36].
In order to validate the developed optimization method, the derived design proposals were manufactured in the PBF-LB process. For manufacturing, the same processing parameters as presented in Section 2.2 were used. No internal supports that might have an influence on the local porosity were used for manufacturing. Figure 20 shows a photograph of the manufactured design proposal of the developed optimization method for optimization case 1.
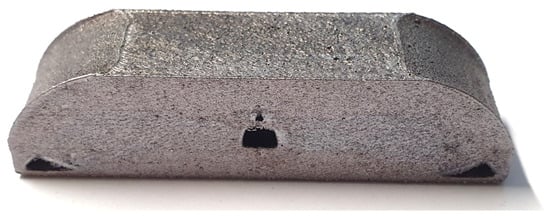
Figure 20.
Design proposals of the developed topology optimization method for optimization case 1 manufactured in the PBF-LB process.
For analysis of the porosity, the optimized bending beams were scanned with µCT. Due to the dimensions of the optimized bending beams, three scans were necessary for each bending beam, which were merged after reconstruction. Compared to the rectangular samples (see Figure 10), it was necessary to increase the voxel size to 10.6 m. However, the voxel size is still similar to the size of the focal spot of around 10 m, which leads to comparable scans between the bending beams and the rectangular samples. In Figure 21, a single slice image in the building direction (BD) of the manufactured bending beam is shown. The position of the slice image in the bending beam is shown as the sectional plane at the left side.
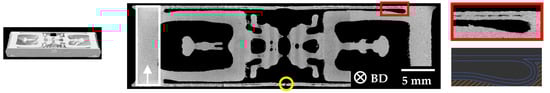
Figure 21.
Single slice image of the manufactured design proposal for optimization case 1 of the developed optimization method.
In general, the slice image shows very low porosity. For the whole sample, a global porosity of 0.11% was determined after binarization of the µCT image, the average sphericity was determined to be 0.859. However, the porosity is lower than in the samples used for material characterization in Section 3.1.3, which might be the result of the different geometries. Each layer of the samples analyzed for material characterization has a constant cross section of 6 × 2 mm2, which results in a high content of the porous interface area. In the manufactured design proposals, the cross-section of the layers is not constant.
For example, at the top and bottom, the layers have a cross section of more than 12 × 30 mm2 resulting in a smaller content of the interface area. Another possible aspect is the process-specific change of porosity with varying scanning times as they occur for different cross sections. With longer scanning times, the temperature in the optical lenses of the laser system in a PBF-LB machine can change. Thermal expansion or a temperature-dependent change in the refraction index of the optical lenses can, therefore, cause a shift of the focal plane of the laser beam. This effect, also known as thermal lensing, leads to an increase of the spot size of the laser beam with increasing exposure time [56]. Such a change in spot size has an impact on the formation of pores in the PBF-LB process [57].
However, the slice image of the design proposal also reveals some local thin-walled areas, for example, in the outside regions of the design space, which is shown with the red box in Figure 21. For this area, a total thickness of around 300 m was measured. In the lower right part of Figure 21, the scanning tracks for this area are shown (blue: contour and orange: hatching). It can be seen that the thin-walled area was scanned with only two lines resulting in a local hatch distance of around 230 m, which led to the formation of lack-of-fusion pores and, thus, to a local porosity of up to 17% in this area.
Additionally, these thin-walled areas are fragile as indicated by the yellow circle. Thus, these thin-walled areas are not feasible to implement in PBF-LB and, therefore, should not be generated in the developed optimization method. Consequently, the free optimization must be constrained, which is why a minimum wall thickness of 1 mm was introduced in optimization case 2. In addition, a strength constraint was implemented since both the derived design proposal of the standard topology optimization as well as that of the developed optimization method exceeded the maximum allowable stress.
3.3.2. Optimization Case 2
For optimization case 2, the developed optimization method resulted in the design proposal in Figure 22 and the standard topology optimization in Figure 23.

Figure 22.
Derived design proposal of the developed optimization method for optimization case 2: Sectional view (left) and overall view (right).

Figure 23.
Derived design proposal of the standard topology optimization for optimization case 2: Sectional view (left) and overall view (right).
In comparing the design proposals qualitatively, it can be stated that, even when applying the restrictions of a minimum wall thickness and maximum permissible stress, a kind of truss structure is generated. Again, this is due to the selected load case. However, it is noticeable that the differences in the qualitative analysis of the two design proposals are more striking than in optimization case 1.
These differences become apparent when looking at the distribution of the struts as they differ significantly in their position, arrangement and thickness. For example, the design proposal of the standard topology optimization has predominantly thicker struts in the center plane. Furthermore, a continuous strut positioned perpendicular to the load application occurs midway along the beam.
In comparison, the design proposal of the developed optimization method again tends to form thinner struts (within the permissible range of 1 mm) as well as a recess in the center of the beam. These qualitative differences indicate that the developed optimization method generates more varying design proposals compared to the standard topology optimization due to the iterative consideration of the characteristic regions in combination with the chosen constraints.
While the surface area of the derived design proposals for optimization case 1 deviated by about 7% between the standard topology optimization and the developed optimization method, this difference for optimization case 2 was significantly smaller at 0.2%. This suggests that the selected minimum wall thickness prevents the generation of struts consisting exclusively of contour area and, thus, does not result in a significant increase in surface area.
This assumption can be confirmed by the sectional view of the derived design proposal of the developed optimization method (see Figure 24), since it shows that the three characteristic regions are constantly present in a single layer plane. Therefore, the PBF-LB is represented in a realistic manner (see Figure 10 for comparison). This allows the conclusion to be drawn that the minimum wall thickness provides a target-oriented restriction for the developed optimization method.
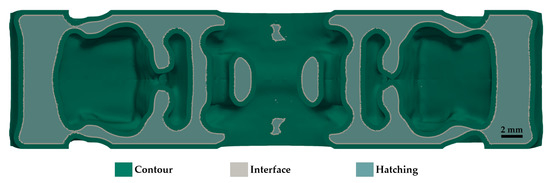
Figure 24.
Section in layer plane through the design resulting from the developed optimization method for optimization case 2 (top view).
The evaluation of the static FE analysis shows that the weight-specific stiffness for the two design proposals of optimization case 2 (see Figure 25 and Figure 26) is about 2% higher in favor of the standard topology optimization. This initially appears contradictory to the findings from optimization case 1. However, if the prevailing stresses in the design proposals are considered, it appears that the decrease in weight-specific stiffness arises due to a better stress distribution. This can be seen in the locations exceeding the maximum allowable stress of 230 MPa (see the gray areas in Figure 25 and Figure 26).
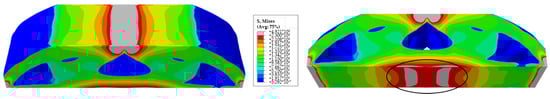
Figure 25.
Results of the static FE analysis for the derived design proposal of the developed optimization method under the boundary conditions of optimization case 2.
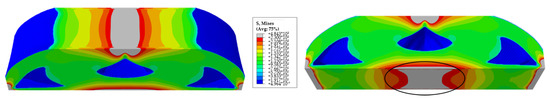
Figure 26.
Results of the static FE analysis for the derived design proposal of the standard topology optimization under the boundary conditions of optimization case 2.
As in optimization case 1, the regions of the force and bearing application exceed the maximum permissible stress due to the model setup. In analyzing the regions on the bottom side of the two derived design proposals, significant differences occur. Due to the arbitrary selected displacement, both design proposals still exceed the maximum permissible stress in this region. Nevertheless, the area of excess stress is much smaller in the derived design proposal of the developed optimization method. In Figure 25, there are only two small areas (marked in black) where the maximum permissible stress is exceeded.
In comparison, the area in Figure 26 (marked in black) is significantly larger and forms a continuous zone. Looking at the stresses in an absolute manner, the average stress in the design proposal of the developed optimization method is about 3% lower. This leads to the conclusion that the iterative consideration of the characteristic regions redistributes the available material in such a way that the maximum permissible stresses can be better maintained and, at the same time, an overall lower stress level is achieved.
This conclusion can be supported based on studies performed in 2D [58]. In these studies, compared to a standard topology optimization for different geometric dimensions, the developed optimization method consistently generated design proposals that complied with the maximum permissible stress.
To further evaluate optimization case 2, the resulting design proposal of the developed optimization method was manufactured in the PBF-LB process and analyzed with µCT. Figure 27 shows a photograph of the manufactured design proposal.
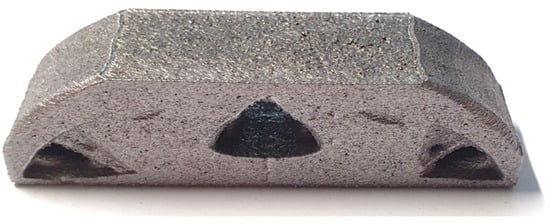
Figure 27.
Design proposals of developed topology optimization method for optimization case 2 manufactured in the PBF-LB process.
A single slice image in the building direction (BD) is shown in Figure 28. The position of the slice image in the bending beam is shown as the sectional plane at the left side. As previously described, no more thin-walled areas could be found in the design proposal for case 2. The global porosity of the sample is, with a value of 0.05%, even lower compared to case 1, which supports the explanation that the overall porosity is increased in thin-walled structures due to a higher content of the porous interface area. For the global sphericity, a value of 0.877 was determined, which is similar to the results of the analysis in Section 3.1.3.
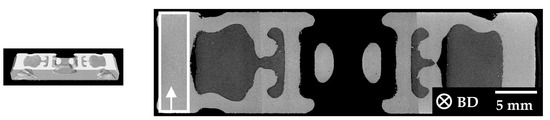
Figure 28.
Single slice image of the manufactured design proposal for optimization case 2 of the developed optimization method.
To evaluate the porosity distribution in the manufactured design proposals, the porosity was additionally analyzed as a function of the horizontal distance to the surface. For each optimization case, exemplary regions are chosen and marked with the white rectangles in Figure 21 and Figure 28. The porosity was analyzed along a path across the whole bending beam.
In Figure 29, the results of the porosity distributions of the marked regions are given. In both manufactured design proposals, the three regions (contour, hatching and interface) can be identified as was assumed in the optimization algorithm. Despite similar wall thicknesses of the analyzed regions in both manufactured design proposals, differences regarding the porosity can be seen. The highest observed porosity is around 1% for optimization case 1 and 0.4% for case 2. The different porosities might result from inhomogeneities in the PBF-LB process, such as thermal lensing or irregularities regarding the shielding gas flow [59].
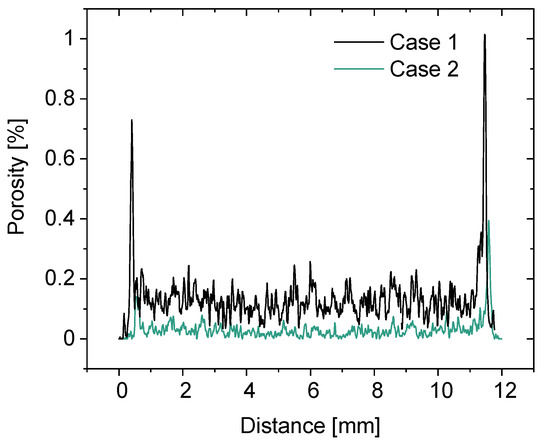
Figure 29.
Porosity as a function of the distance to the vertical surface for the manufactured design proposals of optimization case 1 and case 2.
With the same method as already used for the analysis of the rectangular samples in Section 3.1.3, the size of each characteristic region was analyzed. For case 1, average thicknesses of 356 m for the contour and 85 m for the interface area were determined. In case 2, the contour had an average size of 484 m and the interface 126 m. In both optimization cases, the three characteristic regions of the manufactured optimized bending beams were of a similar size to that assumed as a boundary condition in the optimization algorithm.
4. Conclusions and Outlook
Topology optimization is a widely used tool to create load-compliant design proposals for components, e.g., in the field of lightweight design. Additive manufacturing methods, such as the PBF-LB process, can be used to fabricate the derived design proposals in an efficient way. Therefore, a topology optimization method was developed, which takes the characteristic material properties of components manufactured in the PBF-LB process into account to derive process-specific design proposals.
To characterize the material behavior of PBF-LB components for the developed topology optimization, representative rectangular samples of AlSi10Mg under varying construction angles were manufactured. µCT analysis revealed three characteristic regions of different porosity levels in each sample: contour (low porosity), interface (high porosity) and hatching (average porosity). To determine the effective elastic material properties in each of the characteristic regions, finite element analyses of the reconstructed microstructures were performed. For comparison, the elastic properties of the hatching area as well as of the cast AlSi10Mg were determined using the RUS method. For the PBF-LB material, the results showed a slightly reduced stiffness compared to cast AlSi10Mg, which could be attributed mainly to differences regarding the porosity.
With the developed topology optimization method, it is possible to iteratively consider the three characteristic regions, including the resulting elastic material properties and, thus, derive initial design proposals. Based on the selected optimization cases, it is clear that the design proposals generated in this way deviate strongly from those of a standard topology optimization, which is due to the targeted material redistribution by the optimizer in order to more effectively exploit the material properties.
Using optimization case 1, it was shown that constraint-free optimization generated stiffer design proposals with the developed optimization method compared to standard topology optimization. This can be traced back to the maximization of the surface area. Optimization case 2, on the other hand, shows that, by incorporating a minimum wall thickness, a feasible wall thickness in the manufacturing process can be maintained. Furthermore, optimization case 2 shows that, by selecting a strength constraint, the maximum permissible stress can be better maintained using the developed optimization method, and a globally lower stress level was achieved.
To evaluate the developed topology optimization method, the derived design proposals of a three-point bending beam from optimization case 1 and case 2 were manufactured in the PBF-LB process. µCT analysis revealed that the three characteristic regions occurred in similar sizes as assumed in the topology optimization algorithm. In both optimization cases, the overall porosity was lower as assumed, which could be attributed to inhomogeneities in the PBF-LB process regarding the laser spot. Despite the reduced porosity, the elastic properties of the characteristic regions are in qualitative agreement with the assumed properties for the optimization algorithm.
In future investigations, mechanical three-point bending tests of the manufactured design proposals from the developed topology optimization method as well as from a standard topology optimization method are planned to be conducted for further validation of the method. Additionally, the developed optimization method will be extended to include locally prevailing yield strengths as they occur in PBF-LB components, for example, at downskin surfaces of overhanging structures.
Author Contributions
Conceptualization, S.C., S.D. and J.H.; methodology, S.C., S.D. and J.H.; software, S.C. and J.H.; validation, S.C. and J.H.; formal analysis, S.C. and J.H.; data curation, S.C. and J.H.; writing—original draft preparation, S.C. and J.H.; writing—review and editing, S.C., J.H., S.D., R.R. and V.S.; visualization, S.C. and J.H.; supervision, A.A. and V.S.; project administration, A.A. and V.S.; funding acquisition, S.D. and A.A. All authors have read and agreed to the published version of the manuscript.
Funding
This research was funded by the German Research Foundation (DFG) within the Project “SLM-Topo: Entwicklung einer prozessspezifischen Topologieoptimierungsmethode für die additive Fertigung von Leichtbaustrukturen am Beispiel des SLM-Verfahrens“ (Project number 399233791). The support from the DFG is gratefully acknowledged. We acknowledge support by the KIT-Publication Fund of the Karlsruhe Institute of Technology.
Data Availability Statement
The data that support the findings of this manuscript are available from the corresponding author upon reasonable request.
Conflicts of Interest
The authors declare no conflict of interest.
References
- Albers, A.; Burkardt, N. Systemleichtbau–ganzheitliche Gewichtsreduzierung. In Handbuch Leichtbau; Henning, F., Moeller, E., Eds.; Carl Hanser Verlag GmbH & Co. KG: München, Germany, 2020; pp. 113–131. [Google Scholar] [CrossRef]
- Albers, A.; Holoch, J.; Revfi, S.; Spadinger, M. Lightweight design in product development: A conceptual framework for continuous support in the development process. In Proceedings of the 31st CIRP Design Conference 2021 (CIRP Design 2021), Online, 19–21 May 2021; Elsevier B.V.: Amsterdam, The Netherlands, 2021; Volume 100, pp. 494–499. [Google Scholar] [CrossRef]
- Roth, K. Konstruieren mit Konstruktionskatalogen: Band 1: Konstruktionslehre; 3. auflage, erweitert und neu gestaltet ed.; Springer: Berlin/Heidelberg, Germany, 2000. [Google Scholar] [CrossRef]
- Harzheim, L. Strukturoptimierung: Grundlagen und Anwendungen; Deutsch, H., Ed.; 3. überarbeitete und erweiterte auflage ed.; Verlag Europa-Lehrmittel Nourney, Vollmer GmbH & Co. KG: Haan-Gruiten, Germany, 2019. [Google Scholar]
- Sigmund, O.; Maute, K. Topology optimization approaches. Struct. Multidiscip. Optim. 2013, 48, 1031–1055. [Google Scholar] [CrossRef]
- Allaire, G.; Jouve, F.; Toader, A.M. A level-set method for shape optimization. Comptes Rendus Math. 2002, 334, 1125–1130. [Google Scholar] [CrossRef]
- Allaire, G.; Jouve, F.; Toader, A.M. Structural optimization using sensitivity analysis and a level-set method. J. Comput. Phys. 2004, 194, 363–393. [Google Scholar] [CrossRef]
- Wang, M.Y.; Wang, X.; Guo, D. A level set method for structural topology optimization. Comput. Methods Appl. Mech. Eng. 2003, 192, 227–246. [Google Scholar] [CrossRef]
- Sokołowski, J.; Zochowski, A. On the Topological Derivative in Shape Optimization. Siam J. Control. Optim. 1999, 37, 1251–1272. [Google Scholar] [CrossRef]
- Xie, Y.M.; Steven, G.P. A simple evolutionary procedure for structural optimization. Comput. Struct. 1993, 49, 885–896. [Google Scholar] [CrossRef]
- Bourdin, B.; Chambolle, A. Design-dependent loads in topology optimization. ESAIM Control. Optim. Calc. Var. 2003, 9, 19–48. [Google Scholar] [CrossRef]
- Bendsøe, M.P. Optimal shape design as a material distribution problem. Struct. Multidiscip. Optim. 1989, 1, 193–202. [Google Scholar] [CrossRef]
- Mlejnek, H.P. Some aspects of the genesis of structures. Struct. Multidiscip. Optim. 1992, 5, 64–69. [Google Scholar] [CrossRef]
- Zhou, M.; Rozvany, G. The COC algorithm, Part II: Topological, geometrical and generalized shape optimization. Comput. Methods Appl. Mech. Eng. 1991, 89, 309–336. [Google Scholar] [CrossRef]
- Bendsøe, M.P.; Sigmund, O. Topology Optimization: Theory, Methods and Applications; Springer: Berlin/Heidelberg, Germany, 2003. [Google Scholar]
- Dassault Systèmes. SIMULIA User Assistance 2017: Controller-Versus Sensitivity-Based Topology Optimization; Dassault Systèmes: Vélizy-Villacoublay, France, 2017. [Google Scholar]
- Gu, D.D.; Meiners, W.; Wissenbach, K.; Poprawe, R. Laser additive manufacturing of metallic components: Materials, processes and mechanisms. Int. Mater. Rev. 2012, 57, 133–164. [Google Scholar] [CrossRef]
- Li, W.; Li, S.; Liu, J.; Zhang, A.; Zhou, Y.; Wei, Q.; Yan, C.; Shi, Y. Effect of heat treatment on AlSi10Mg alloy fabricated by selective laser melting: Microstructure evolution, mechanical properties and fracture mechanism. Mater. Sci. Eng. A 2016, 663, 116–125. [Google Scholar] [CrossRef]
- Aboulkhair, N.T.; Everitt, N.M.; Ashcroft, I.; Tuck, C. Reducing porosity in AlSi10Mg parts processed by selective laser melting. Addit. Manuf. 2014, 1–4, 77–86. [Google Scholar] [CrossRef]
- Kempen, K.; Thijs, L.; van Humbeeck, J.; Kruth, J.P. Processing AlSi10Mg by selective laser melting: Parameter optimisation and material characterisation. Mater. Sci. Technol. 2015, 31, 917–923. [Google Scholar] [CrossRef]
- Martin, A.A.; Calta, N.P.; Khairallah, S.A.; Wang, J.; Depond, P.J.; Fong, A.Y.; Thampy, V.; Guss, G.M.; Kiss, A.M.; Stone, K.H.; et al. Dynamics of pore formation during laser powder bed fusion additive manufacturing. Nat. Commun. 2019, 10, 1987. [Google Scholar] [CrossRef]
- Groeber, M.A.; Schwalbach, E.; Donegan, S.; Chaput, K.; Butler, T.; Miller, J. Application of characterization, modelling, and analytics towards understanding process-structure linkages in metallic 3D printing. IOP Conf. Ser. Mater. Sci. Eng. 2017, 219, 012002. [Google Scholar] [CrossRef]
- Englert, L.; Schulze, V.; Dietrich, S. Concentric Scanning Strategies for Laser Powder Bed Fusion: Porosity Distribution in Practical Geometries. Materials 2022, 15, 1105. [Google Scholar] [CrossRef] [PubMed]
- Czink, S.; Dietrich, S.; Schulze, V. Ultrasonic evaluation of elastic properties in laser powder bed fusion manufactured AlSi10Mg components. NDT E Int. 2022, 46, 102729. [Google Scholar] [CrossRef]
- Yang, K.V.; Rometsch, P.; Jarvis, T.; Rao, J.; Cao, S.; Davies, C.; Wu, X. Porosity formation mechanisms and fatigue response in Al-Si-Mg alloys made by selective laser melting. Mater. Sci. Eng. A 2018, 712, 166–174. [Google Scholar] [CrossRef]
- Charmi, A.; Falkenberg, R.; Ávila, L.; Mohr, G.; Sommer, K.; Ulbricht, A.; Sprengel, M.; Saliwan Neumann, R.; Skrotzki, B.; Evans, A. Mechanical anisotropy of additively manufactured stainless steel 316L: An experimental and numerical study. Mater. Sci. Eng. A 2021, 799, 140154. [Google Scholar] [CrossRef]
- Krautkrämer, J.; Krautkrämer, H. Werkstoffprüfung Mit Ultraschall; Springer: Berlin/Heidelberg, Germany, 1986. [Google Scholar] [CrossRef]
- Sol, T.; Hayun, S.; Noiman, D.; Tiferet, E.; Yeheskel, O.; Tevet, O. Nondestructive ultrasonic evaluation of additively manufactured AlSi10Mg samples. Addit. Manuf. 2018, 22, 700–707. [Google Scholar] [CrossRef]
- Kohlhauser, C.; Hellmich, C. Ultrasonic contact pulse transmission for elastic wave velocity and stiffness determination: Influence of specimen geometry and porosity. Eng. Struct. 2013, 47, 115–133. [Google Scholar] [CrossRef]
- Migliori, A.; Sarrao, J.L. Resonant Ultrasound Spectroscopy; Wiley: New York, NY, USA; Chichester, UK, 1997. [Google Scholar]
- Fisher, K.A. Estimation of elastic properties of an additively manufactured lattice using resonant ultrasound spectroscopy. J. Acoust. Soc. Am. 2020, 148, 4025. [Google Scholar] [CrossRef] [PubMed]
- McGuigan, S.; Arguelles, A.P.; Obaton, A.F.; Donmez, A.M.; Riviere, J.; Shokouhi, P. Resonant ultrasound spectroscopy for quality control of geometrically complex additively manufactured components. Addit. Manuf. 2021, 39, 101808. [Google Scholar] [CrossRef]
- Rossin, J.; Goodlet, B.; Torbet, C.; Musinski, W.; Cox, M.; Miller, J.; Groeber, M.; Mayes, A.; Biedermann, E.; Smith, S.; et al. Assessment of grain structure evolution with resonant ultrasound spectroscopy in additively manufactured nickel alloys. Mater. Charact. 2020, 167, 110501. [Google Scholar] [CrossRef]
- Van Cauwenbergh, P.; Samaee, V.; Thijs, L.; Nejezchlebová, J.; Sedlák, P.; Iveković, A.; Schryvers, D.; Van Hooreweder, B.; Vanmeensel, K. Unravelling the multi-scale structure-property relationship of laser powder bed fusion processed and heat-treated AlSi10Mg. Sci. Rep. 2021, 11, 6423. [Google Scholar] [CrossRef]
- Li, X.; Yi, D.; Wu, X.; Zhang, J.; Yang, X.; Zhao, Z.; Feng, Y.; Wang, J.; Bai, P.; Liu, B.; et al. Effect of construction angles on microstructure and mechanical properties of AlSi10Mg alloy fabricated by selective laser melting. J. Alloys Compd. 2021, 881, 160459. [Google Scholar] [CrossRef]
- Holoch, J.; Lenhardt, S.; Revfi, S.; Albers, A. Design of Selective Laser Melting (SLM) Structures: Consideration of Different Material Properties in Multiple Surface Layers Resulting from the Manufacturing in a Topology Optimization. Algorithms 2022, 15, 99. [Google Scholar] [CrossRef]
- Feldhusen, J.; Grote, K.H. Der Produktentstehungsprozess (PEP). In Pahl/Beitz Konstruktionslehre; Feldhusen, J., Grote, K.H., Eds.; Springer: Berlin/Heidelberg, Germany, 2013; Volume 75, pp. 11–24. [Google Scholar] [CrossRef]
- Clausen, A.; Aage, N.; Sigmund, O. Topology optimization of coated structures and material interface problems. Comput. Methods Appl. Mech. Eng. 2015, 290, 524–541. [Google Scholar] [CrossRef]
- Suresh, S.; Thore, C.J.; Torstenfelt, B.; Klarbring, A. Topology optimization accounting for surface layer effects. Struct. Multidiscip. Optim. 2020, 62, 3009–3019. [Google Scholar] [CrossRef]
- Holoch, J.; Träger, L.; Albers, A. SLM-Topo-Einfluss unterschiedlicher Modellierung von Randschicht und innerem Volumen auf eine 2D-Topologieoptimierung. In Proceedings of the NAFEMS Virtuelle DACH Konferenz, Online, 13–14 October 2020; pp. 106–109. [Google Scholar]
- Balakirev, F.F.; Ennaceur, S.M.; Migliori, R.J.; Maiorov, B.; Migliori, A. Resonant ultrasound spectroscopy: The essential toolbox. Rev. Sci. Instruments 2019, 90, 121401. [Google Scholar] [CrossRef] [PubMed]
- Migliori, A.; Sarrao, J.L.; Visscher, W.M.; Bell, T.M.; Lei, M.; Fisk, Z.; Leisure, R.G. Resonant ultrasound spectroscopic techniques for measurement of the elastic moduli of solids. Phys. B Condens. Matter 1993, 183, 1–24. [Google Scholar] [CrossRef]
- Müller, P. Coordinate Metrology by Traceable Computed Tomography; Department of Mechanical Engineering, Technical University of Denmark: Kgs. Lyngby, Denmark, 2012. [Google Scholar]
- Sauvola, J.; Pietikäinen, M. Adaptive document image binarization. Pattern Recognit. 2000, 33, 225–236. [Google Scholar] [CrossRef]
- Dassault Systèmes. SIMULIA User Assistance 2017: Natural Frequency Extraction; Dassault Systèmes: Vélizy-Villacoublay, France, 2017. [Google Scholar]
- Holoch, J.; Lenhardt, S.; Renz, R.; Albers, A. Investigation on the influence of different modelling of multiple surface layers on a 3D topology optimization. In Proceedings of the NAFEMS World Congress 2021, Online, 25–29 October 2021. [Google Scholar]
- Dassault Systèmes. SIMULIA User Assistance 2019: Smoothing External Nodes; Dassault Systèmes: Vélizy-Villacoublay, France, 2019. [Google Scholar]
- Bacciaglia, A.; Ceruti, A.; Liverani, A. Surface smoothing for topological optimized 3D models. Struct. Multidiscip. Optim. 2021, 64, 3453–3472. [Google Scholar] [CrossRef]
- DIN EN ISO 6892-1:2020-06; Metallische Werkstoffe_- Zugversuch_- Teil_1: Prüfverfahren bei Raumtemperatur (ISO_6892-1:2019); Deutsche Fassung EN_ISO_6892-1:2019. Beuth Publishing Din: Berlin, Germany, 2020. [CrossRef]
- Read, N.; Wang, W.; Essa, K.; Attallah, M.M. Selective laser melting of AlSi10Mg alloy: Process optimisation and mechanical properties development. Mater. Des. 2015, 65, 417–424. [Google Scholar] [CrossRef]
- Dong, Z.; Liu, Y.; Li, W.; Liang, J. Orientation dependency for microstructure, geometric accuracy and mechanical properties of selective laser melting AlSi10Mg lattices. J. Alloys Compd. 2019, 791, 490–500. [Google Scholar] [CrossRef]
- Englert, L.; Czink, S.; Dietrich, S.; Schulze, V. How defects depend on geometry and scanning strategy in additively manufactured AlSi10Mg. J. Mater. Process. Technol. 2022, 299, 117331. [Google Scholar] [CrossRef]
- Simmons, G.; Wang, H. Single Crystal Elastic Constants and Calculated Aggregate Properties. A Handbook, 2nd ed.; M.I.T. Press: Cambridge, MA, USA, 1971. [Google Scholar]
- Salmi, A.; Atzeni, E.; Iuliano, L.; Galati, M. Experimental Analysis of Residual Stresses on AlSi10Mg Parts Produced by Means of Selective Laser Melting (SLM). Procedia CIRP 2017, 62, 458–463. [Google Scholar] [CrossRef]
- Crecraft, D.I. The measurement of applied and residual stresses in metals using ultrasonic waves. J. Sound Vib. 1967, 5, 173–192. [Google Scholar] [CrossRef]
- Zohuri, B. Thermal Effects of High Power Laser Energy on Materials; Springer International Publishing: Cham, Switzerland, 2021. [Google Scholar] [CrossRef]
- Goossens, L.R.; Kinds, Y.; Kruth, J.P.; van Hooreweder, B. On the Influence of Thermal Lensing During Selective Laser Melting. In Proceedings of the 2018 International Solid Freeform Fabrication Symposium, Austin, TX, USA, 13–15 August 2018. [Google Scholar] [CrossRef]
- Holoch, J.; Lenhardt, S.; Albers, A. Einfluss verschiedener Bauteilabmessungen auf eine Topologieoptimierungsmethode zur iterativen Berücksichtigung elastischer Materialeigenschaften aus dem SLM. In Conference Proceedings NAFEMS DACH 2022; NAFEMS Deutschland, Österreich, Schweiz GmbH: München, Germany, 2022; pp. 495–500. [Google Scholar]
- Reijonen, J.; Revuelta, A.; Riipinen, T.; Ruusuvuori, K.; Puukko, P. On the effect of shielding gas flow on porosity and melt pool geometry in laser powder bed fusion additive manufacturing. Addit. Manuf. 2020, 32, 101030. [Google Scholar] [CrossRef]
Disclaimer/Publisher’s Note: The statements, opinions and data contained in all publications are solely those of the individual author(s) and contributor(s) and not of MDPI and/or the editor(s). MDPI and/or the editor(s) disclaim responsibility for any injury to people or property resulting from any ideas, methods, instructions or products referred to in the content. |
© 2023 by the authors. Licensee MDPI, Basel, Switzerland. This article is an open access article distributed under the terms and conditions of the Creative Commons Attribution (CC BY) license (https://creativecommons.org/licenses/by/4.0/).