Article

Monitoring of Paddy and Maize Fields Using Sentinel-1 SAR Data and NGB Images: A Case Study in Papua, Indonesia

by
Sri Murniani Angelina Letsoin
1,*,
Ratna Chrismiari Purwestri
2,
Mayang Christy Perdana
3,
Petr Hnizdil
4 and
David Herak
1
1
Department of Mechanical Engineering, Faculty of Engineering, Czech University of Life Sciences Prague, Kamýcká 129, 16500 Praha-Suchdol, Czech Republic
2
Department of Excellent Research EVA 4.0, Faculty of Forestry and Wood Sciences, Czech University of Life Sciences Prague, Kamýcká 129, 16500 Praha-Suchdol, Czech Republic
3
Department of Applied Ecology, Faculty of Environmental Sciences, Czech University of Life Sciences Prague, Kamycka 129, 16500 Praha-Suchdol, Czech Republic
4
Department of Material Science and Manufacturing Technology, Faculty of Engineering, Czech University of Life Sciences Prague, Kamýcká 129, 16500 Praha-Suchdol, Czech Republic
*
Author to whom correspondence should be addressed.
Processes 2023, 11(3), 647; https://doi.org/10.3390/pr11030647
Submission received: 28 November 2022 / Revised: 11 January 2023 / Accepted: 17 February 2023 / Published: 21 February 2023

Abstract

:
This study addresses the question of how to evaluate the growth stage of food crops, for instance, paddy (Oryza sativa) and maize (Zea mays), from two different sensors in selected developed areas of Papua Province of Indonesia. Level-1 Ground Range Detected (L1 GRD) images from Sentinel-1 Synthetic Aperture Radar (SAR) data were used to investigate the growth of paddy and maize crops. An NGB camera was then used to obtain the Green Normalized Difference Vegetation Index (GNDVI), and the Enhanced Normalized Difference Vegetation Index (ENDVI) as in situ measurement. Afterwards, the results were analyzed based on the Radar Vegetation Index (RVI) and the Vertical-Vertical (VV) and Vertical Horizontal (VH) band backscatters at incidence angles of 30.55°–45.88°, and 30.59°–46.16° in 2021 and 2022, respectively. The findings showed that Sigma0_VV_db and sigma0_VH_db had a strong correlation (R2 above 0.900); however, polarization modification is required, specifically in the maize field. The RVI calculated and backscatter changes in this study were comparable to the in situ measurements, specifically those of paddy fields, in 2022. Even though the results of this study were not able to prove the RVI values from the two relative orbits (orbit31 and orbit155) due to the different angle incidences and the availability of the Sentinel-1 SAR data set over the study area, the division of SAR image data based on each relative orbit adequately represents the development of crops in our study areas. The significance of this study is expected to support food crop security and the implementation of development plans that contribute to the local government’s goals and settings.

1. Introduction

Indonesia is an archipelago with approximately 271.86 million people, spreading over 16.056 islands in an area of 1,916,906.77 km2 [1]. Today, it is well known as the world’s fourth most populous nation, after the United States, India, and, in the first place, China [2]. Therefore, food crop monitoring and evaluation research establish a vital record for supporting the sustainable development plans of the country. In Indonesia, the three largest paddy producers are primarily located in the Center of Java Island, namely East Java, Central Java, and West Java, with yield areas of 1.75 million ha, 1.70 million ha, and 1.60 million ha, respectively. Nevertheless, in 2021, other provinces, such as South Sulawesi, and Papua Province, significantly contributed to paddy production with around 382.17 and 120.28 thousand tons (dry milled grain), respectively [3]. Furthermore, Merauke Regency, one of the twenty-eight regencies in Papua Province, plays a dominant role as a paddy producer in Papua Province. With about 50,823.78 ha of harvest area, the volume of production reached 231,152.47 tons from the total of 248,358.99 tons in Papua Province. That means the Regency accounts for approximately 93% of the area in Papua Province. On the one hand, there has been no annual report on other carbohydrate sources, such as maize, since 2016 in this eastern province of Indonesia because such measurements require visual or eye inspection [4]. On the other hand, various data collection platforms and technologies based on geospatial information have emerged to support the investigation and evaluation of agricultural products and need to be considered. One of these is utilizing remote sensing data.
Remote sensing instruments have long been broadly used to monitor, detect, and obtain information about object properties or land cover areas through distant platforms, such as airborne, spaceborne, or ground-based platforms. Ground-based platforms consist of handheld or vehicle-mounted equipment, while airborne and spaceborne platforms include piloted airplanes, satellites, and unmanned aerial vehicles (UAV). Today, various satellite and UAV imagery have been elaborated on for different purposes, such as crop monitoring or detecting object changes, as utilized in our previous study about land cover changes. These platforms carry out detection using a multispectral imaging system, i.e., Landsat satellite data (MSS/TM/ETM) [5]. UAV data can be used, for instance, to support rice seed fertilization or to predict maize plant height based on a digital surface model (DSM) [6,7]. Vegetation indices (VI) have been adopted in different crop monitoring, or yield estimation systems due to their ability to intensify signal waves from vegetation and extinguish unexpected discordances, such as clouds, atmospheric conditions, or a different angle of view. Likewise, calculated spectral indices can be utilized to specify object locations, such as water bodies, and vegetation cover [8], or to investigate the characteristics of crops, such as potato, based on the Normalized Difference Vegetation Index (NDVI) images [9,10]. Similar to spectral indices, for example, NDVI, the use of GNDVI has been thoroughly investigated in optical remote sensing. Nonetheless, several earlier studies found a vegetation index derived from synthetic-aperture radar (SAR) data that is also capable of crop growth monitoring due to its data being under cloud cover and enabling data collectors to determine the specific time of day and conduct multi-seasonal investigations [11]. To address this, calculating the Radar Vegetation Index (RVI) could determine crop growth based on two polarizations, i.e., VV and VH. V and H relate to vertical and horizontal polarization, respectively; thus, the first and second characters represent the transmitted and received polarization, respectively [12]. The phenological stages is depicted in Figure 1.
In this study, the potential uses of multitemporal C-band dual-polarized Sentinel-1 VV and VH backscatter data for paddy and maize growth monitoring were evaluated through their RVI. The relationship between the C-band backscatter parameters of VV and VH, which is known as the cross-ratio, has been well investigated [14,15], however, it is rare to obtain the RVI values derived from C-band polarimetric parameters and VV and VH changes when investigating the growth of crops, specifically in a developing region such as the Papua Province of Indonesia. Therefore, paddy and maize fields were evaluated using C-band Sentinel-1 SAR data to track crop growth based on RVI, and temporal C-band backscatter (VV, VH) changes. To support the analysis of the results in this study, in situ measurements taken by NGB imagery from UAV-NGB were also investigated through the values of GNDI and ENDVI. The results of this study will be essential as one of the means to deal with crop monitoring, and crop growth tracking, which the Papuan Government has been facing.

2. Materials and Methods

2.1. Experimental Site

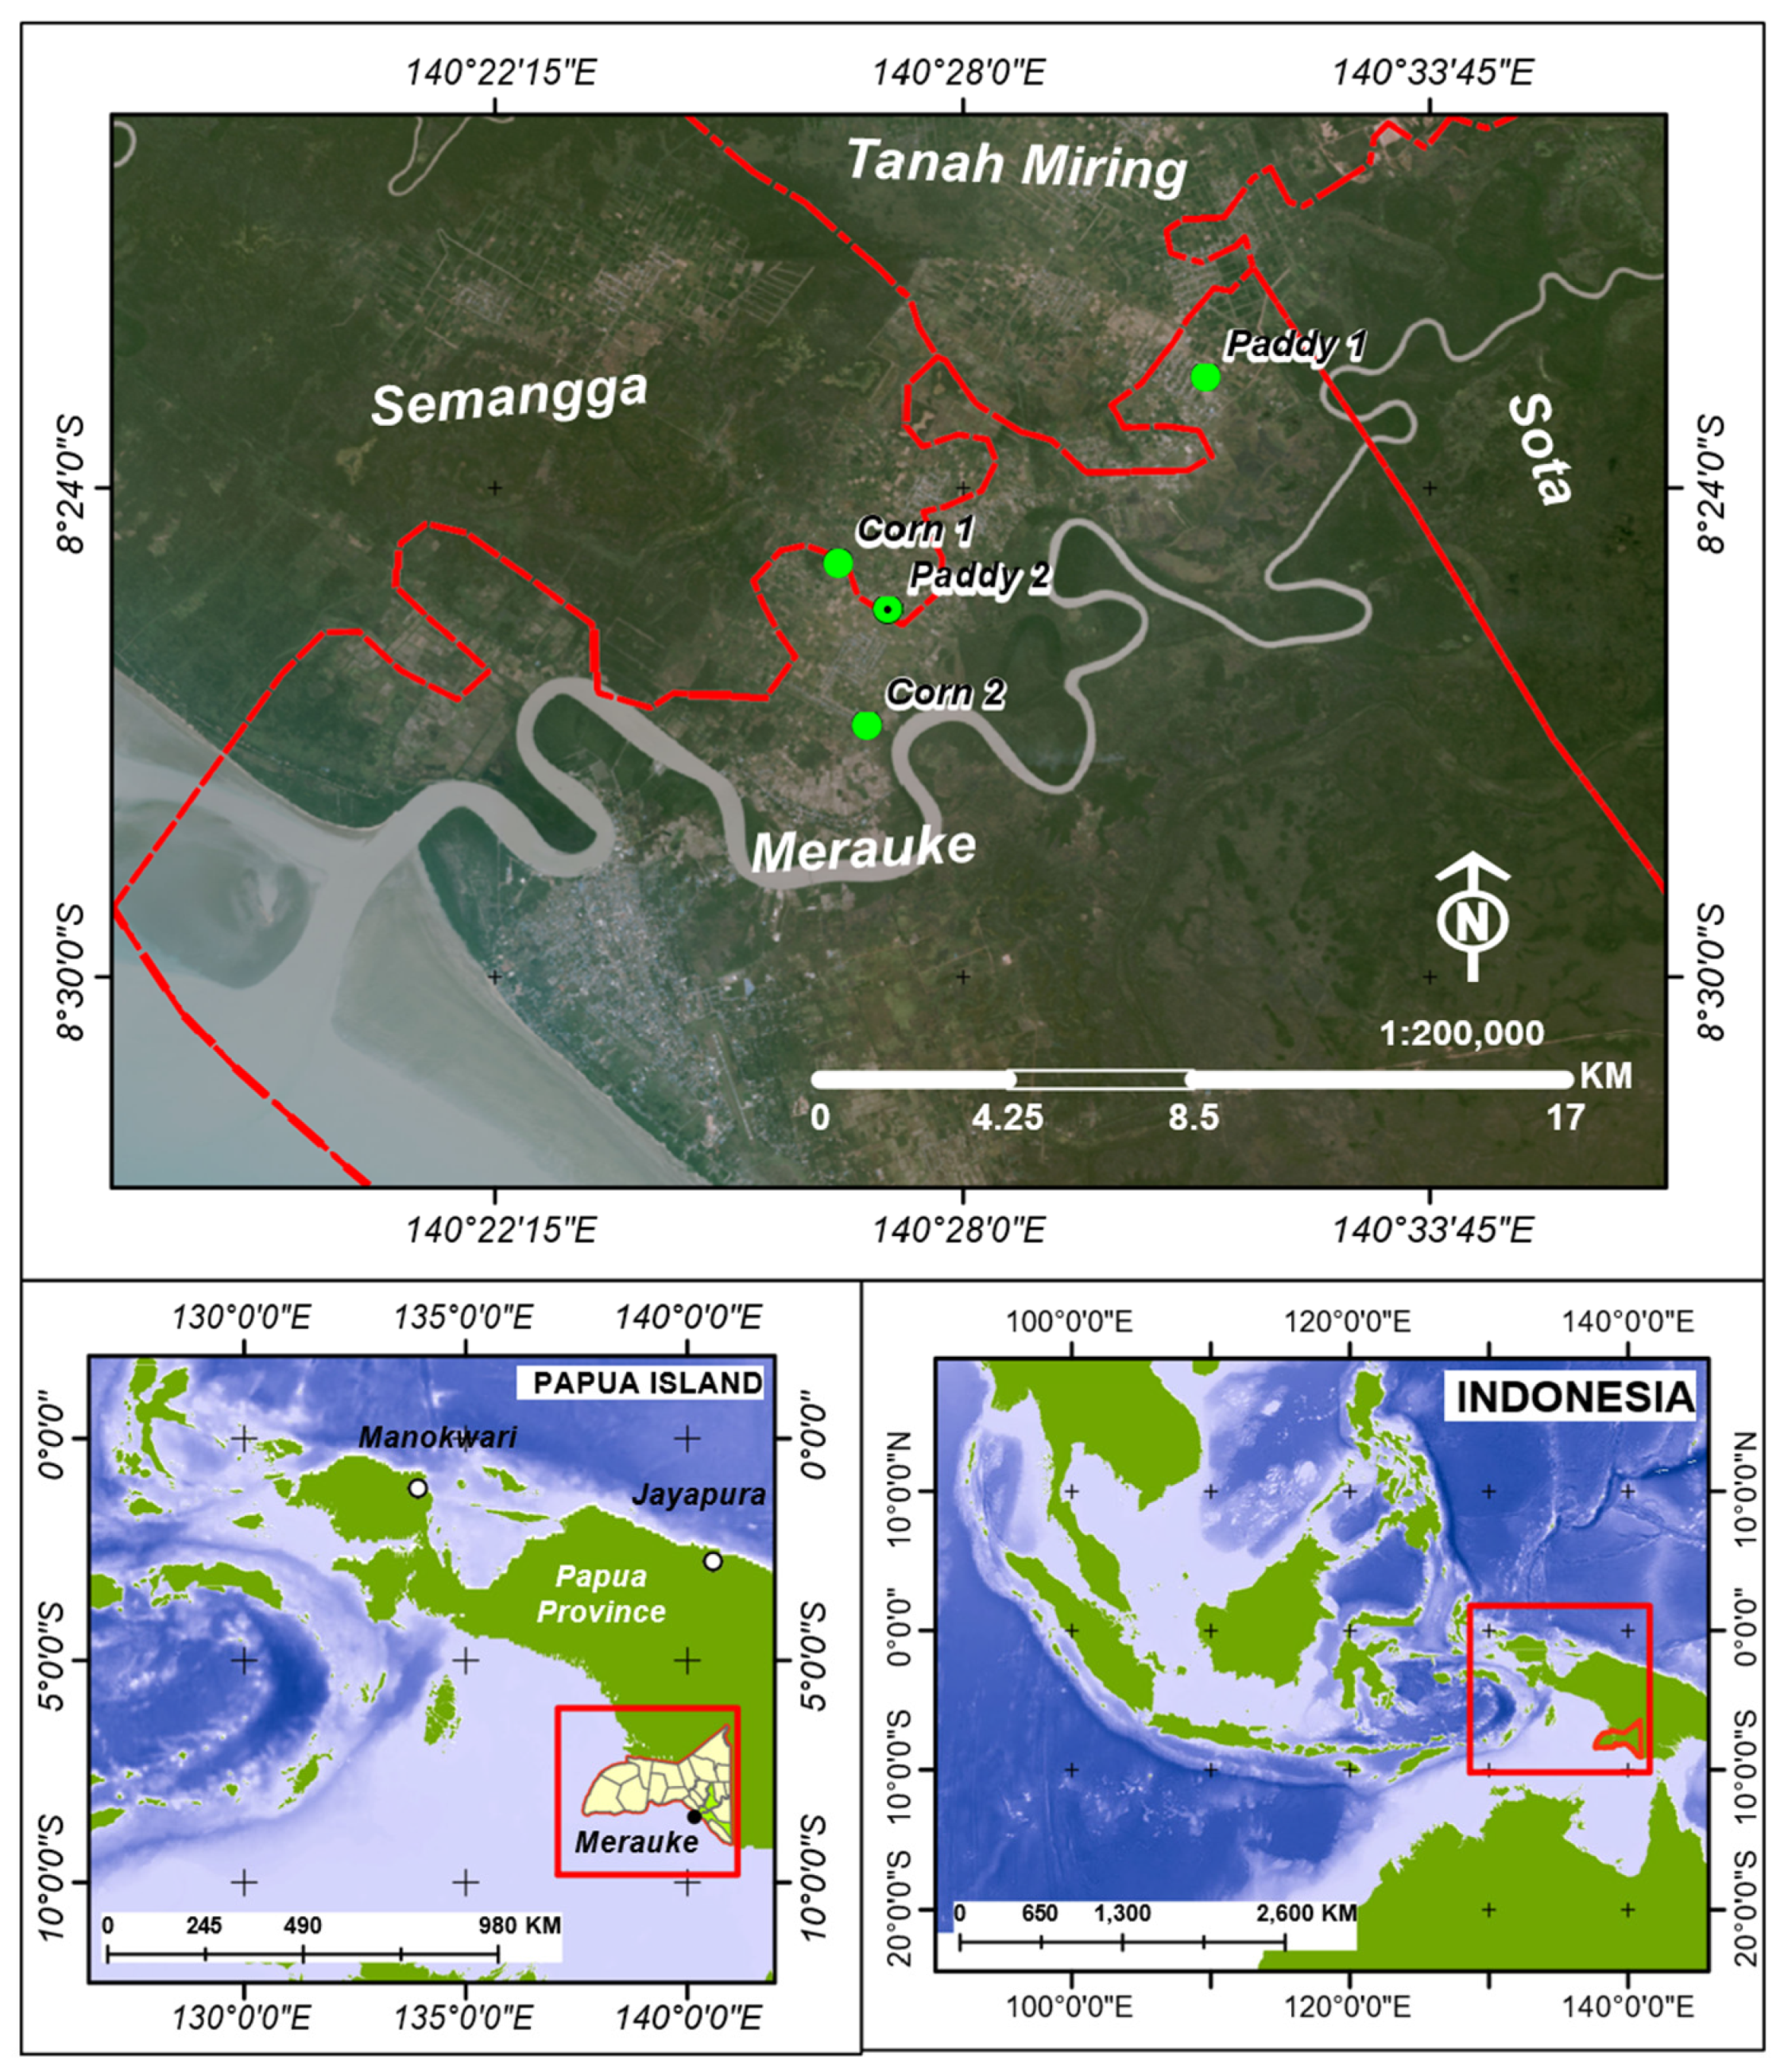
Two regions located in Merauke Regency were selected as the study sites, namely Tanah Miring and Semangga District. The study location is shown in Figure 2.
The annual temperature in 2021 was 32.3 °C, with a humidity of 84.3%. Annual precipitation is about 172.97%, with the average number of rainy days being approximately 17 days and the duration of sunshine being about 152 h per year. This environment is favorable for growing food crops, mainly maize and paddy. Paddy plantations consist of wetlands and dry paddies. In this Regency, the paddy fields were primarily occupied by wetland paddy, with a plant area of 17.840 ha, and production of about 112,927.20 tons in 2021. According to [16], a significant paddy production was reported in 2021, about 72.46% higher than in 2020.

2.2. UAV Data

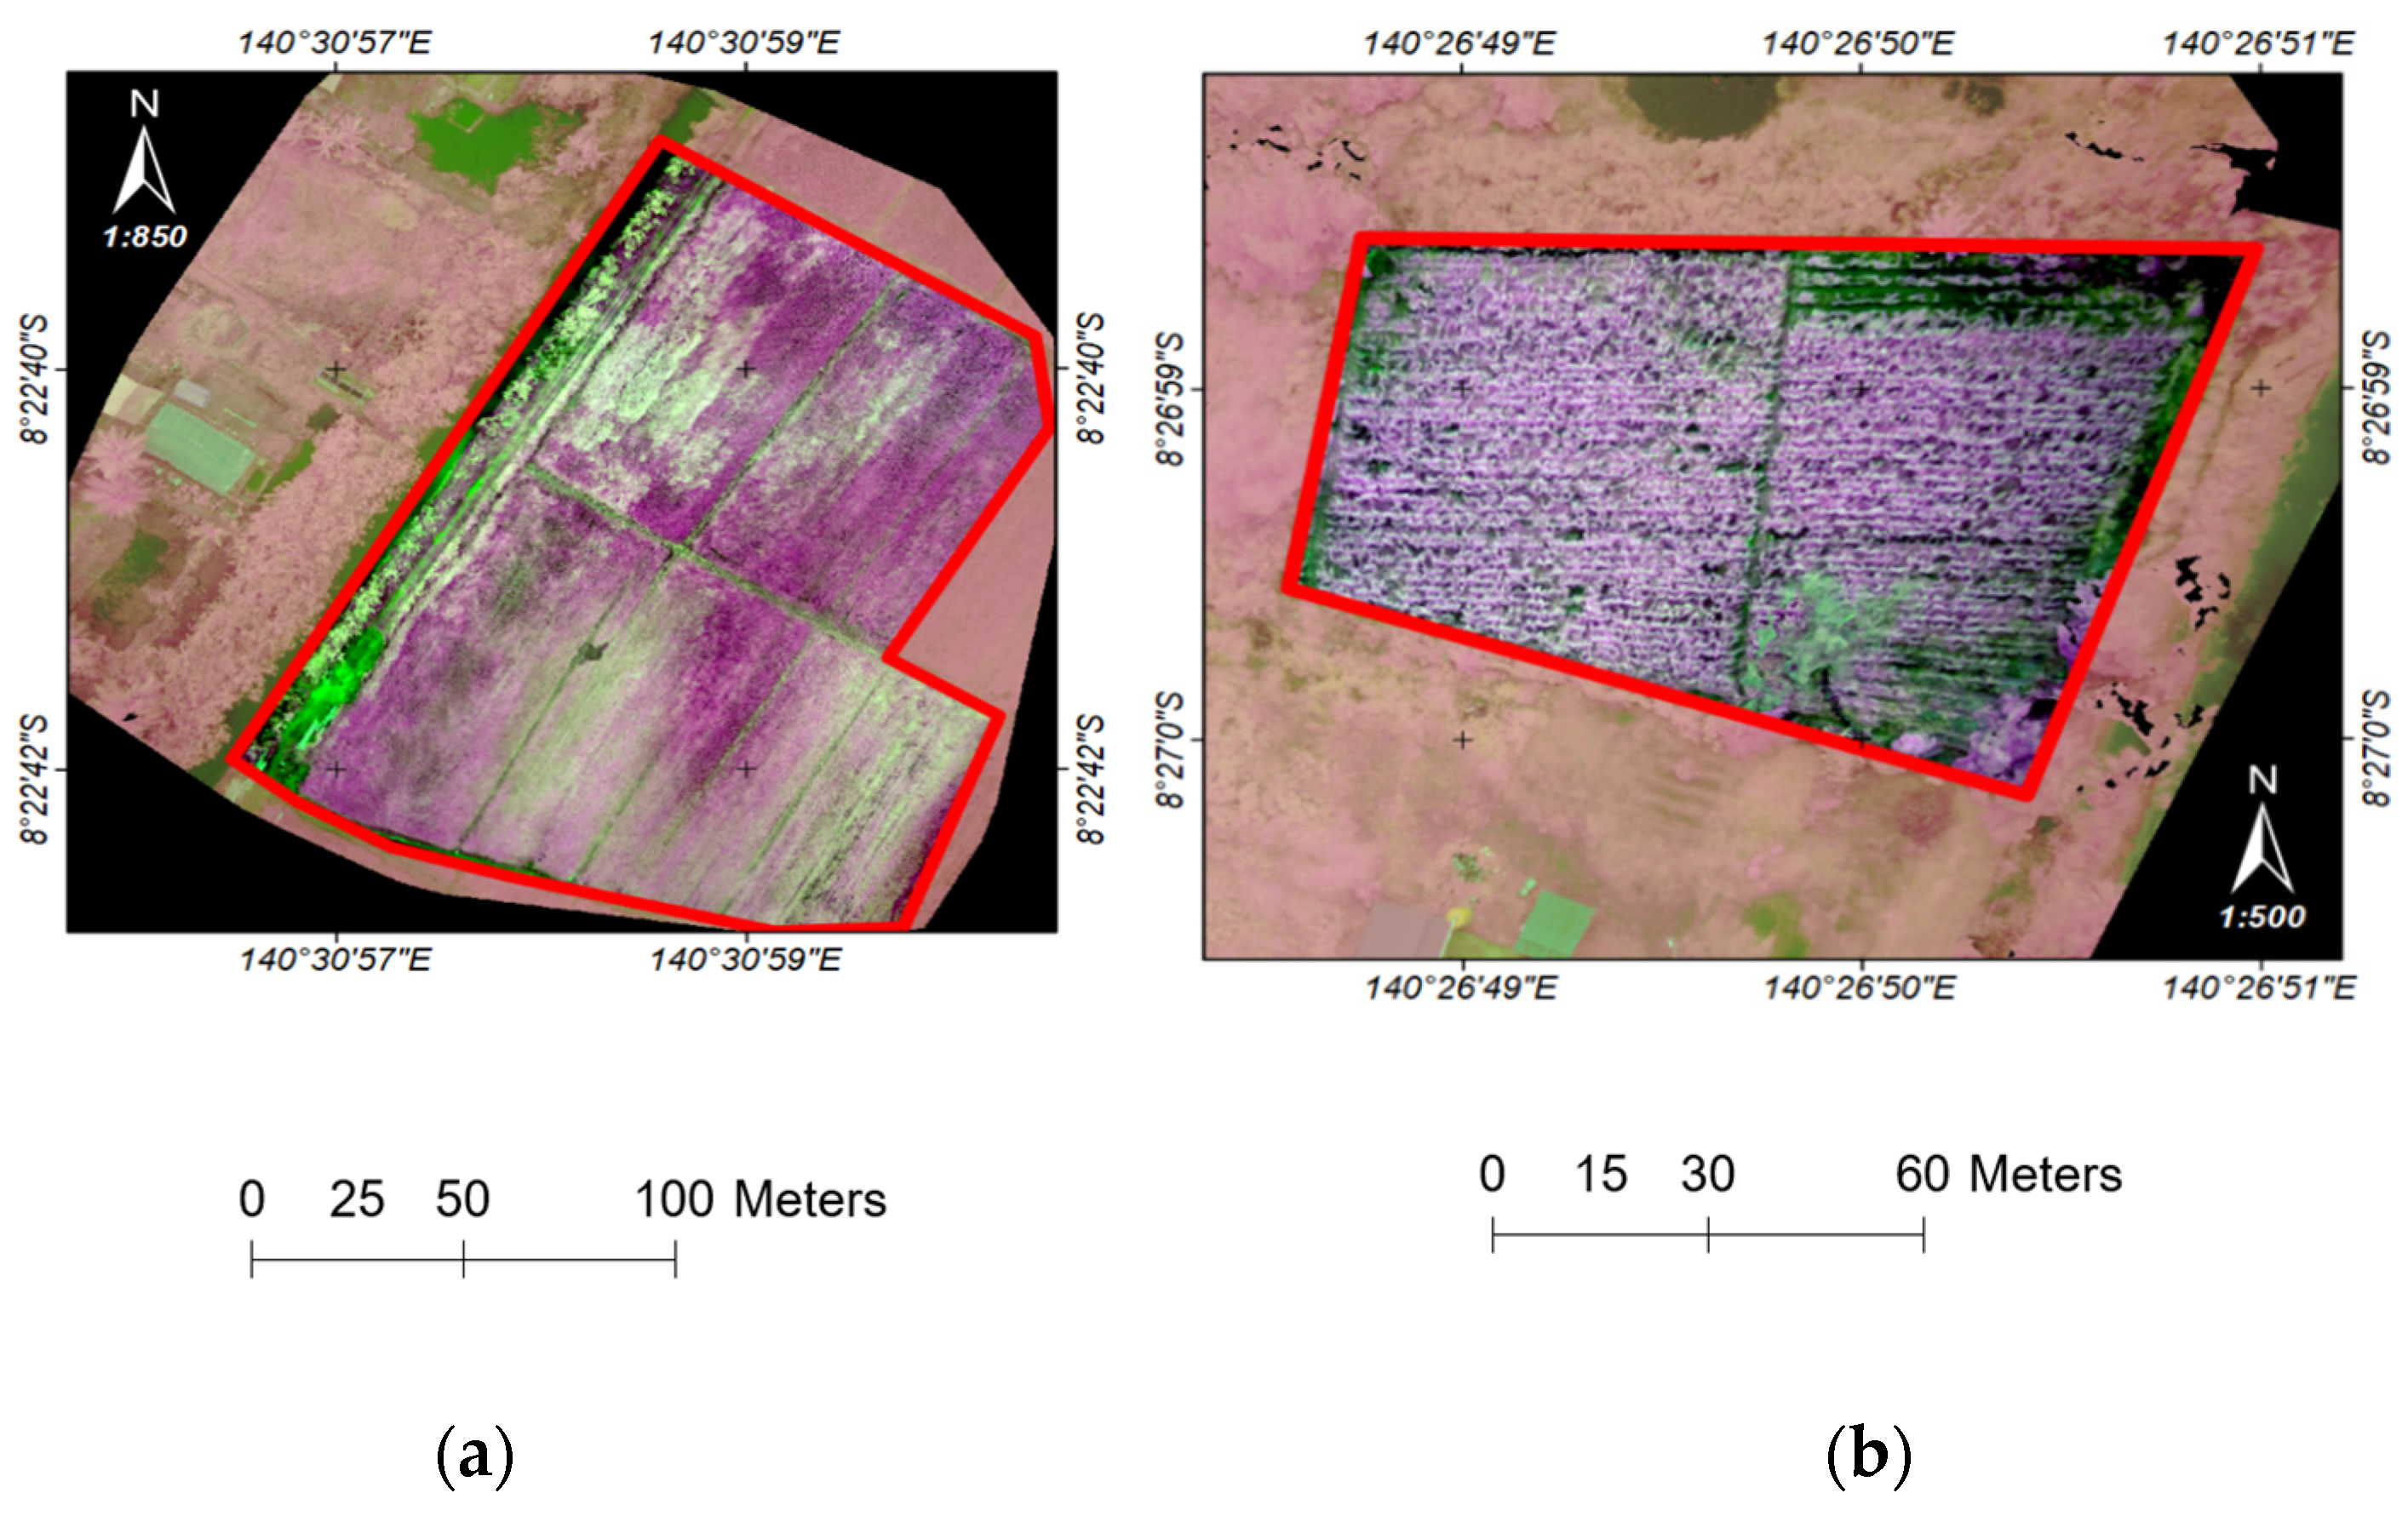
A DJI Mavic 2 Pro Drone mounted with a Survey3N NGB (NIR + Green + Blue) 8.2 4000 × 3000 (RGB) MAPIR Camera, and an advanced GPS was used to acquire data on food crops in the selected sites. The drone supported an aperture range of f/2.8–f/11, sensor dimensions of 25,400 mm × 19,050 mm, and JPEG/RAW format of data images. The UAV was flown from 9:00 in the morning up to 12:00 noon. The drone was flown over paddy rice and maize fields with the image overlap set up to 80% (front-lap and side-lap) at altitudes of 60 m (corn sites) and 100 m (paddy sites). The NGB images were captured in near infrared (NIR), green (G), and blue (B) bands with wavelengths of 0.85 micrometers, 0.55 micrometers, and 0.475 micrometers, respectively [17]. After all UAV images were acquired from the sites (Table 1), they were transferred to computer storage and underwent a preprocessing stage using pix4dmapper 4.5.6 software. The preprocessing stage was implemented to define the area covered, a region of interest (ROI) according to ground control points, and to produce orthophoto and digital surface models for each site.
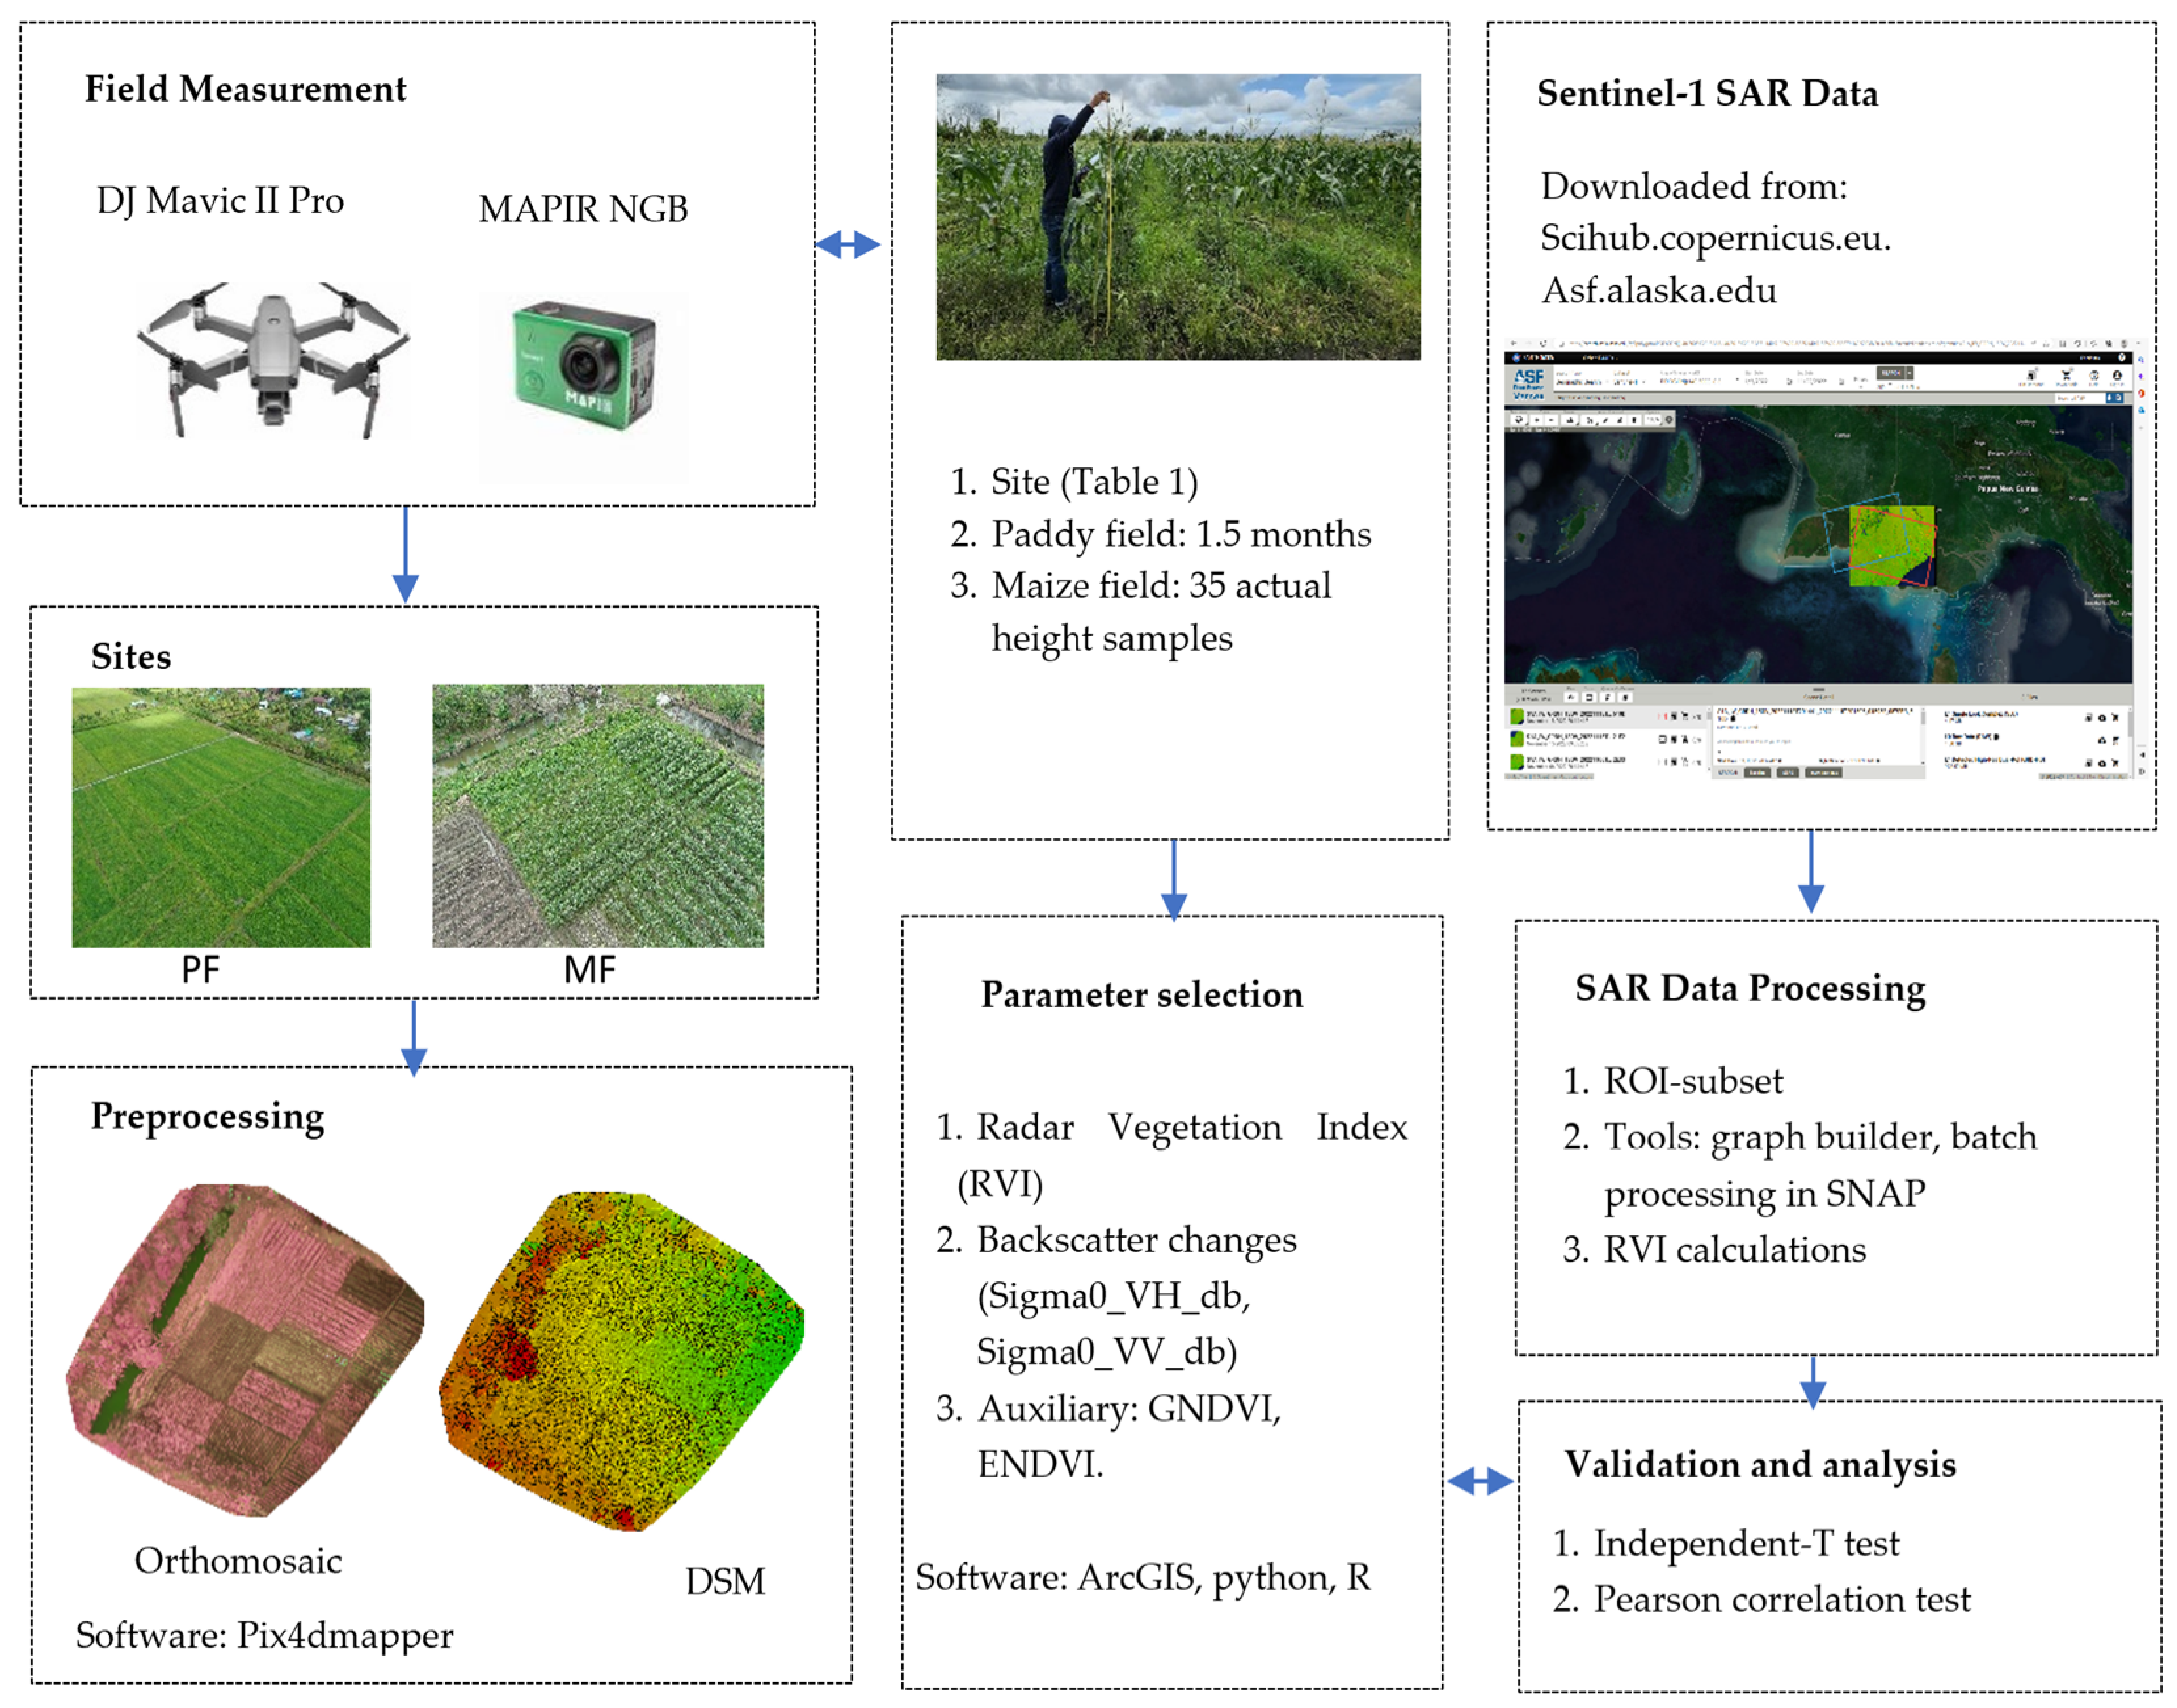
Pix4dmapper using GPS information from the UAV was processed in accordance with EPSG:23894, UTM World Geodetic System (WGS) 84, and zone 54S (EGM96 Geoid). In this study, UAV imagery was performed based on 3D Maps categories (Figure 3). The processing of 3D maps consisted of three steps: (1) Initial processing was conducted, where full images within one scale were used for abstraction, and terrestrial data were used to match image pairs. For this, geometrically verified matching was enabled. Afterward, (2) a point cloud was created. We used multiscale imagery with half the image size, and the minimum number of matches was set to 3. As a result, 636004 3D and densified points were acquired, with an average number of 42.88 per m3. In the last stage, i.e., (3) the digital surface model (DSM) orthomosaic, and Index were established. In this stage, the DSM and orthomosaic were accustomed to 1xGSD (Table 1); for instance, in the maize field site, it is 2.45 cm/pixel. We also applied noise filtering and surface smoothing using sharp type and inverse distance weighting methods. while generating the raster DSM.
Lastly, the DSM and orthomosaic were generated in a GeoTif file. This was followed by further processing using geoinformatics software, i.e., ArcGIS 10.4 with spatial data analysis that enabled us to work in a Python environment, such as ArcPy. The purpose of the processing was to obtain spatial indices from the NGB imagery and height estimation. Sentinel-1 SAR data were also used for this purpose, as explained in the following section (Section 2.3). In situ measurement using UAV NGB was performed on 3 July 2022 over the paddy field, and 4 July 2022 over the maize field (Figure 4). During the field measurement, the paddy field was about 1.5 months old. In addition, 35 actual-height samples, which varied from 90 cm to 164 cm, were also measured. Two sites were observed, namely the paddy field (PF) and maize field (MF).

2.3. Sentinel-1 SAR Data

Sentinel -1 SAR data in ascending and descending orbits were used from May to August 2022 and 2021 for the sites of study. All data were Sentinel-1 IW Level-1 GRD images taken in Interferometric Wide (IW) mode with dual polarization, i.e., vertical transmission, vertical reception (VV), and vertical transmission, horizontal reception (VH). The spatial resolution of the IW images is a 10 m (range direction) and 10 m (azimuth direction) wide swath from two different relative orbits, as displayed in Table 2. These Sentinel-1 images were downloaded from Copernicus Open Access Hub (Sci-hub), supported by ESA, and from Asf.Alaska.edu in the form of a ground range detected (GRD) product.
After downloading the Sentinel-1 SAR data from May to August 2021 and 2022 over the study area, the Sentinel Application Platform (SNAP) toolbox was used to preprocessed the SAR images (Figure 4). All of the images were divided into subsets according to each polygon shape in the data site. As a result, sixty-seven images were preprocessed in the SNAP environment established by the ESA. Data processing was conducted after the spatial subsets were established using the following procedures: radiometric calibration of two polarizations, VH and VV, with output sigma0 band, followed by multitemporal speckle filtering using lee sigma (0.9) and a 5 × 5 target window size. Thus, geometric terrain correction was applied through range-doppler terrain correction. Accordingly, VV and VH radar backscatters were converted to sigma naught (σ°) in decibel units (db) [12]. Henceforth, σ°VV and σ°VH are denoted by Sigma0_VV and Sigma0_VH. In DEM processing, bilinear interpolation was implemented from source bands sigma0_VH and sigma0_VV to be projected according to the study area, i.e., the WGS84(DD) within pixel spacing is 10 m. Finally, the RVI was calculated according to the following formula [11,18].
R V I = 4 σ ° V H σ ° V V + σ ° V H  
For data analysis, changes in C-band backscatter (Sigma0_VV_db, Sigma0_VH_db) and RVI calculated were investigated according to the development stages of crops; for example, the behavior during the heading stage and harvesting season. The changes in scattering with crop phenology conditions were used as a technique to trace crop growth conditions, specifically as the solution for the Province’s problem.

2.4. Crop Growth

As is generally known, the paddy (Oryza sativa) principally involves the vegetative, reproductive, and ripening growth stages. With a total growth period of at least 90 to over 150 days, the vegetative stage typically takes the longest (±50–75% of the entire lifespan) [19]. The process from germination to maximum tillering, including successive collar formation [20,21] determines the vegetative stages. Subsequently, the reproductive stage accounts for around 35 days, from the initiation of panicles to flowering [19]. The structure of panicles is initiated by the development of the shoot apex. The reproductive stage remains slightly varied among varieties, as well as the flowering time. The last growth stage of the paddy is ripening, indicated by the starch forming in the panicles of the young grain and the color turning into gold [20]. This stage represents physiological maturity, producing a final yield ready for harvesting. For other grain crops, for instance, maize (Zea mays), the growth stages constitute the processes of germination and emergence, early vegetative development, late vegetative development, flowering, cob and kernel development, and maturity. The vegetative stage is indicated by observable leaf collars. The reproductive stage is thereafter differentiated into six phases, i.e., silking (observable silks out of the husks), blister (white kernels are similar to blisters), milk (yellow kernels with milky fluid inside), dough (the milky fluid is becoming more condensed), dent (the denting of almost all of the kernels), and physiological maturity (the formation of a black abscission layer). After the seventh day of the silking phase, the cobs and husks are completely shaped. Harvesting can start when the grain moisture is below 20%. In our study area, agriculture crop growth, such as paddy, starts after the harvesting period (Figure 5a), when the land is prepared for the next crop cycle (before seeding), using a lawn mower, raking, and then mechanical plowing. In this preparatory step, the farmer usually enriches the soil with water and leaves it to flood for 2–3 days (Figure 5a). Afterwards, the vegetative stage begins with seeding, and then it is fertilized at least 3 or 4 times during the whole cycle. First, it is fertilized 14–15 days after seeding, thus 40 days after the first fertilization and 80 days after the second fertilization. The typical fertilizer is urea, used in paddy 32, 33, cigelis (rice varieties), sweet corn, and Bonanza F1 (maize varieties). One month (about 1 to 35 days), or the early vegetative stage, is characterized by leaves that are not lush yet or sparse with clearly visible distances between each plot (Figure 5b). The vegetative state (35–55 days) is indicated by the leafy crop, with no visible distance between plants (starting from maximum tiller until before panicle appears) (Figure 5c). The next period is the reproductive stage, during which the flowers and pollinators appear. Then, at the final stage, ripening is indicated by full grain and the brown or gold color (Figure 5d). One cycle of paddy growth takes 3 to 4 months (105 to 120 days), depending on the variety [16].

2.5. Parameter Selection

The selected features were examined through RVI calculation based on Sentinel-1 SAR data and seasonal changes in the C-band backscatter with two polarizations, VV and VH. The vector polygon data of the paddy field and maize field were obtained from the MoEF [5]. Pixel values of VV and VH within the paddy and maize fields were extracted using SNAP software based on the procedures explained in Section 2.3. The transition in the backscatter over two relative orbits, i.e., relative orbit 31 (orbit31) and relative orbit 155 (orbit155), was monitored over the period of study. In situ measurement was conducted using UAV NGB, as presented in Section 2.2. Hence, vegetation indices (VI) were used as auxiliary data for near infrared (NIR), green (G) and blue (B)—NGB imagery, namely green NDVI (GNDVI), and enhanced NDVI (ENDVI). In several earlier studies, GNDVI was used to correlate chlorophyl absorption, and ENDVI was used to discover healthiness [22]. Other indices are presented online through a database for remote sensing indices (www.indexdatabase.de), online accessed 28 August 2022. In this study, NGB images were used as in situ observation, while RVI and changes in backscatter were used to monitor paddy and maize field growth at different phenological stages, as presented in Section 2.4. VI used in this study is displayed in Table 3.

2.6. Analysis Result

The values of VV and VH in the PF and MF in each year were correlated using the Pearson correlation test. The associations of VV and VH are also depicted in scatter plots with a correlation to the efficient (r2) and formulas. To identify the predictors associated with the RVI of PF and MF, a linear regression analysis was performed. The independent variables included in the model were relative orbit (1 = Orbit 31), year (1 = 2021), and a series of observations. To compare the paddy and maize areas estimated using GNDVI, and ENDVI, as well as RVI values from real orbit 31 and orbit 155 in PF and MF in each observed year, were used. Statistically, independent T-analyses on categorical and normally distributed data were used. The test aims to investigate whether the two methods were significantly different. Two methods, for instance, GNDVI vs ENDVI, were contrasted repeatedly in each class. The statistical significance of a p-value less than 0.05 was designated, and all analyses were conducted using IBM SPSS version 26 (IBM Corp. Armonk, NY, USA). Scatter plots were developed using Microsoft Excel for Microsoft 365 MSO Version 2210 (Microsoft Corp., Redmond, DC, USA).

3. Results

3.1. RVI from Sentinel S-1 Data

Figure 6 presents the RVIs calculated for the paddy field in 2021 (Figure 6a) and 2022 (Figure 6b). The RVI values of the paddy field (PF) in 2021 and 2022 showed similar tendencies in the two orbits. The initial values were about 0.231–0.273 in May and generally reached peak values between the end of July and early August (0.400–0.425); afterward, they tended to decrease slightly at the end of August. The final RVI values range from orbit31 was about 1.226–1.337 from 3 July 2021 to 22 July 2021, while in orbit155, the range was about 1.406–1.397 from 11 July 2021 to 30 July 2021. Accordingly, in 2022, the peak value was 0.858–1.268 on 14 August 2022 (orbit31), and on 11 August 2022 (orbit155), it was about 0.88–1.335. Thus, the initial values in PF from 2021–2022 were about 0.359–0.369 (orbit31) and 0.330–0.357 (orbit155).
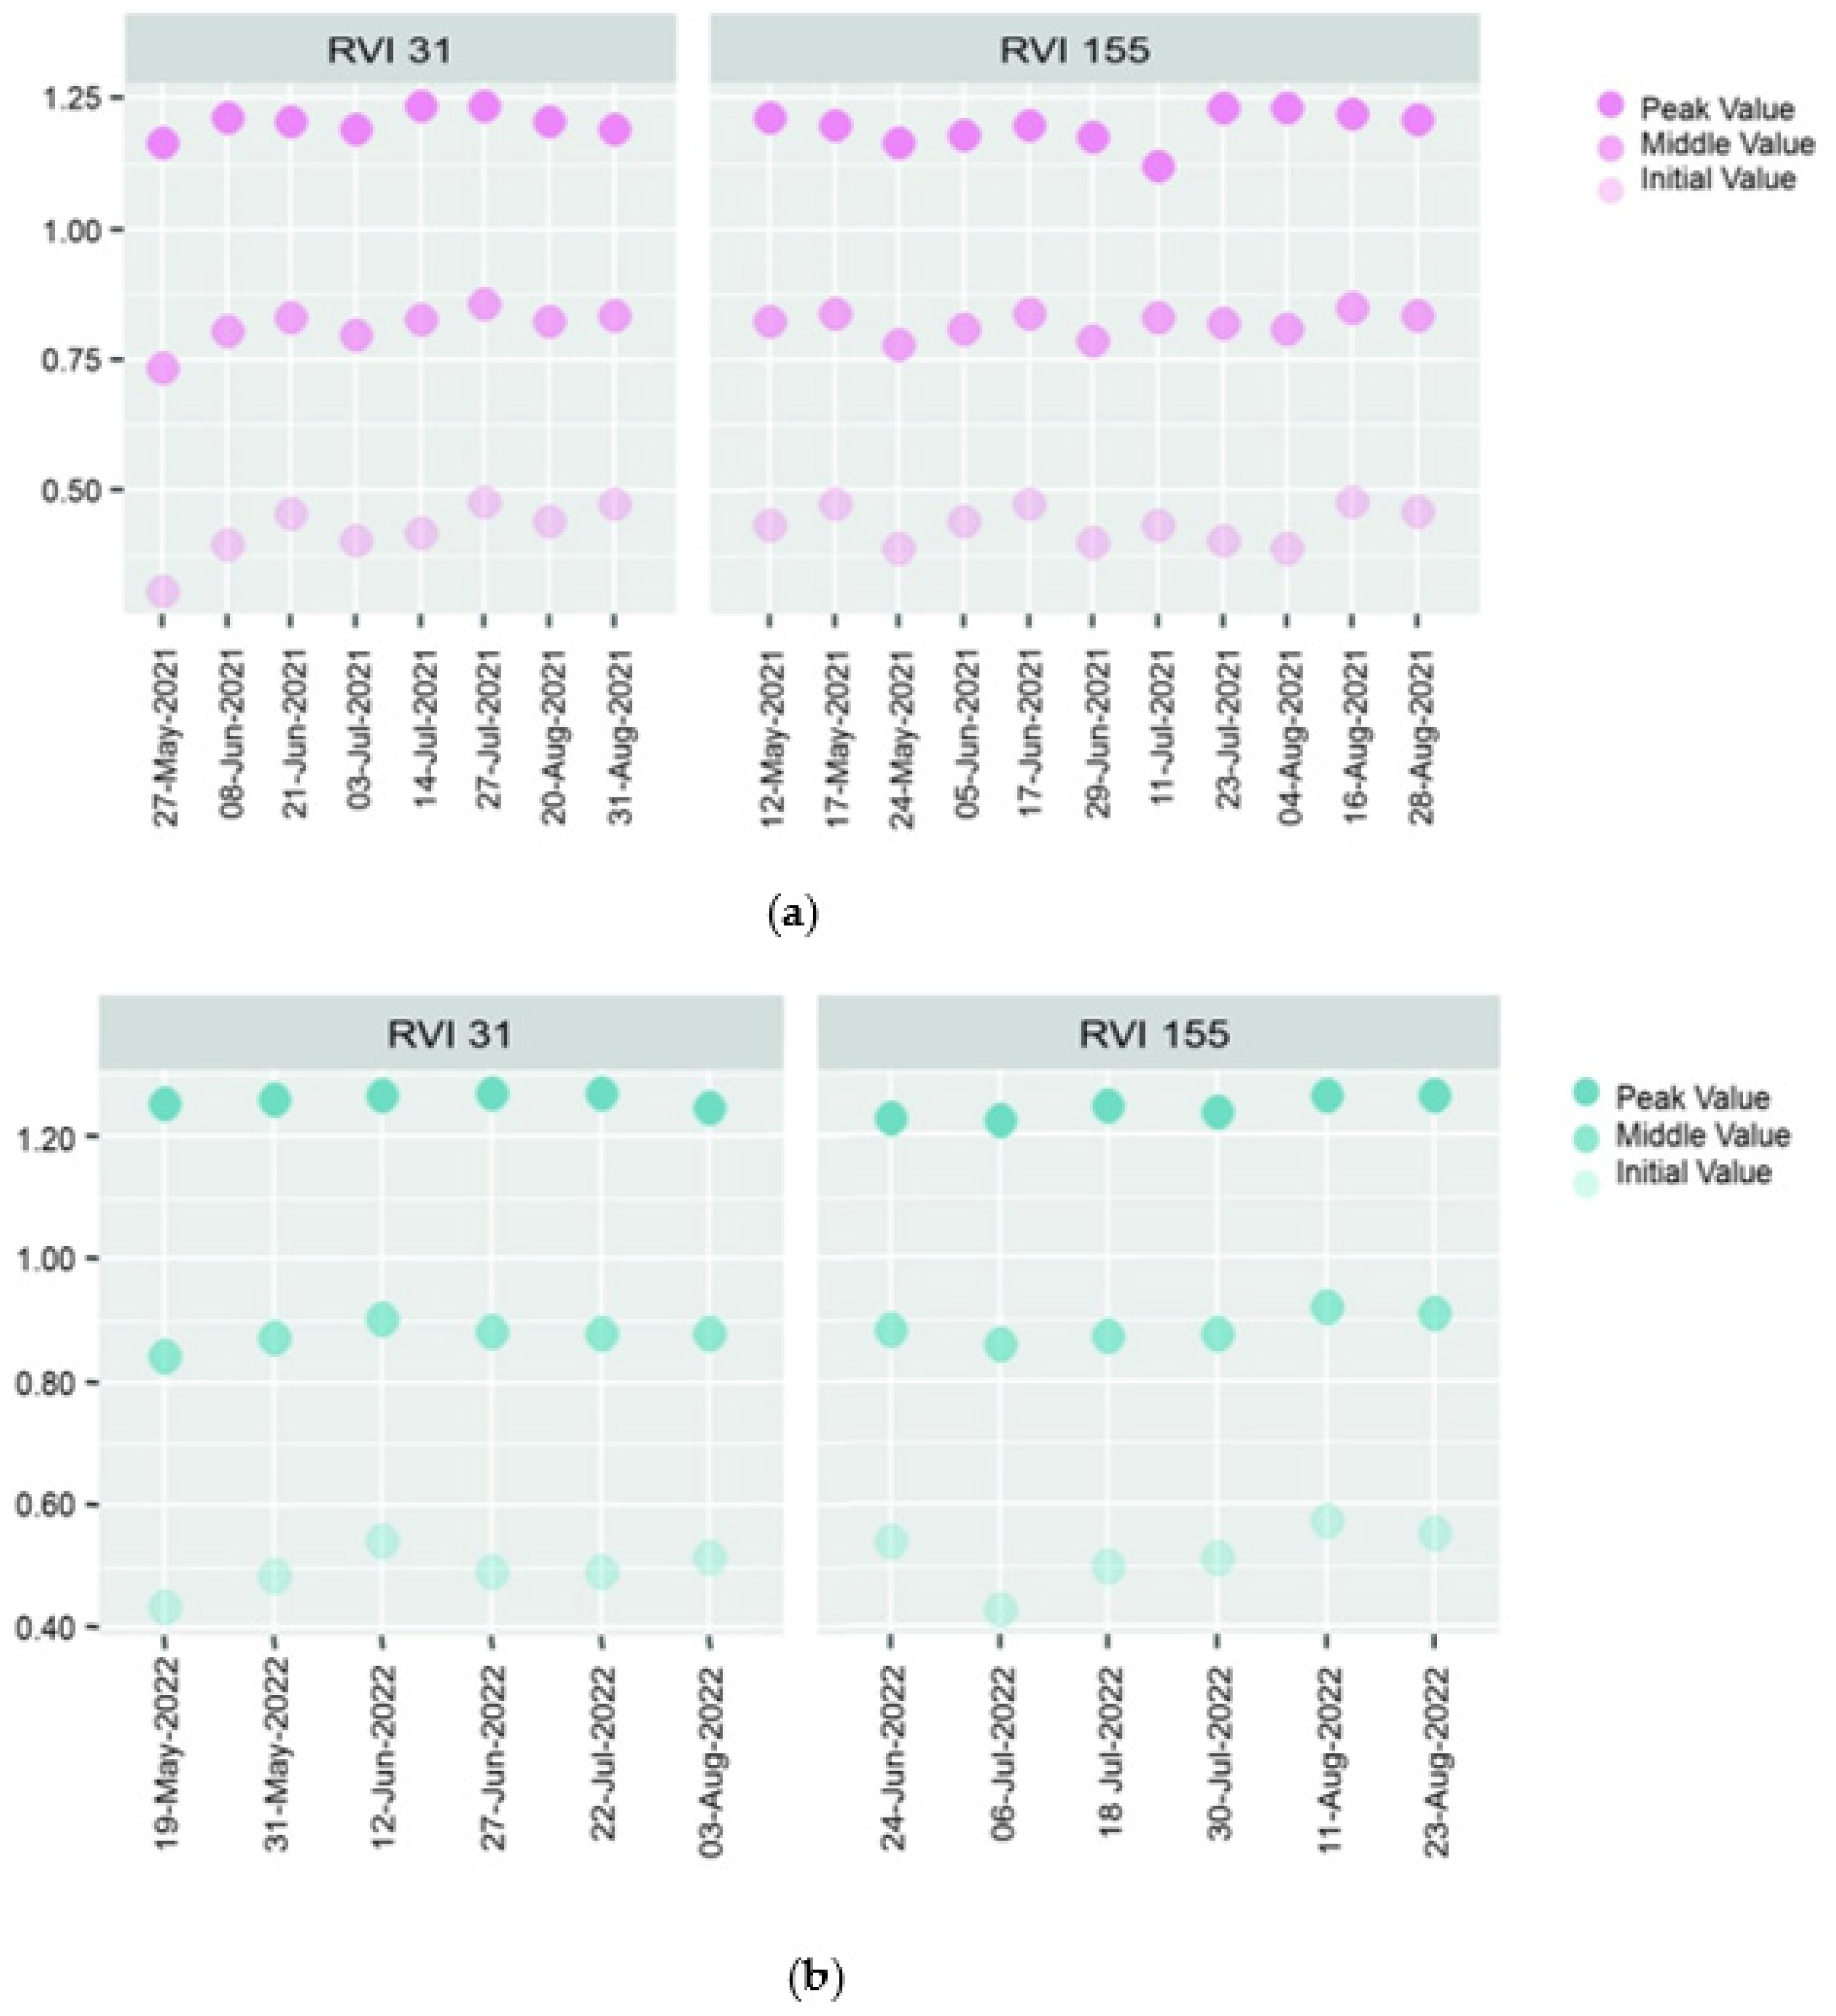
The RVI values of the maize field (Figure 7a,b) in 2021 fluctuated slightly, specifically in orbit155 compared to 2022. The initial value was around 0.308 on 27 May 2021, and reached a peak value of 1.236 on 27 July 2021 (orbit31). Generally, orbit155 showed typical behavior, with a peak value of 1.234 on 23 July 2021 and then a slight decrease throughout the remainder of the season. However, the RVI of the maize field in 2022 was 0.493 and reached a peak at 0.541 on 12 June 2022 (orbit31), then declined until the end of July at 0.513 (orbit155). Nevertheless, the RVI value considerably increased in early August and then tended to fall at the end of August in 2022. Overall, the initial RVI values in MF were between 0.494 and 0.515, and the peak value was between 1.251 and 1.262 in 2021. Earlier studies presented the values of initial, middle, and peak values according to crop development stages; for instance, peak values indicated that the maturity phase had begun [12], while initial values of RVI, around 0, for example, indicated bodies of water. The values climb along with the crops’ growth to the peak value, afterwards decreasing when the reproductive stage begins [24].

3.2. Changes in Sentinel S-1 Backscattering

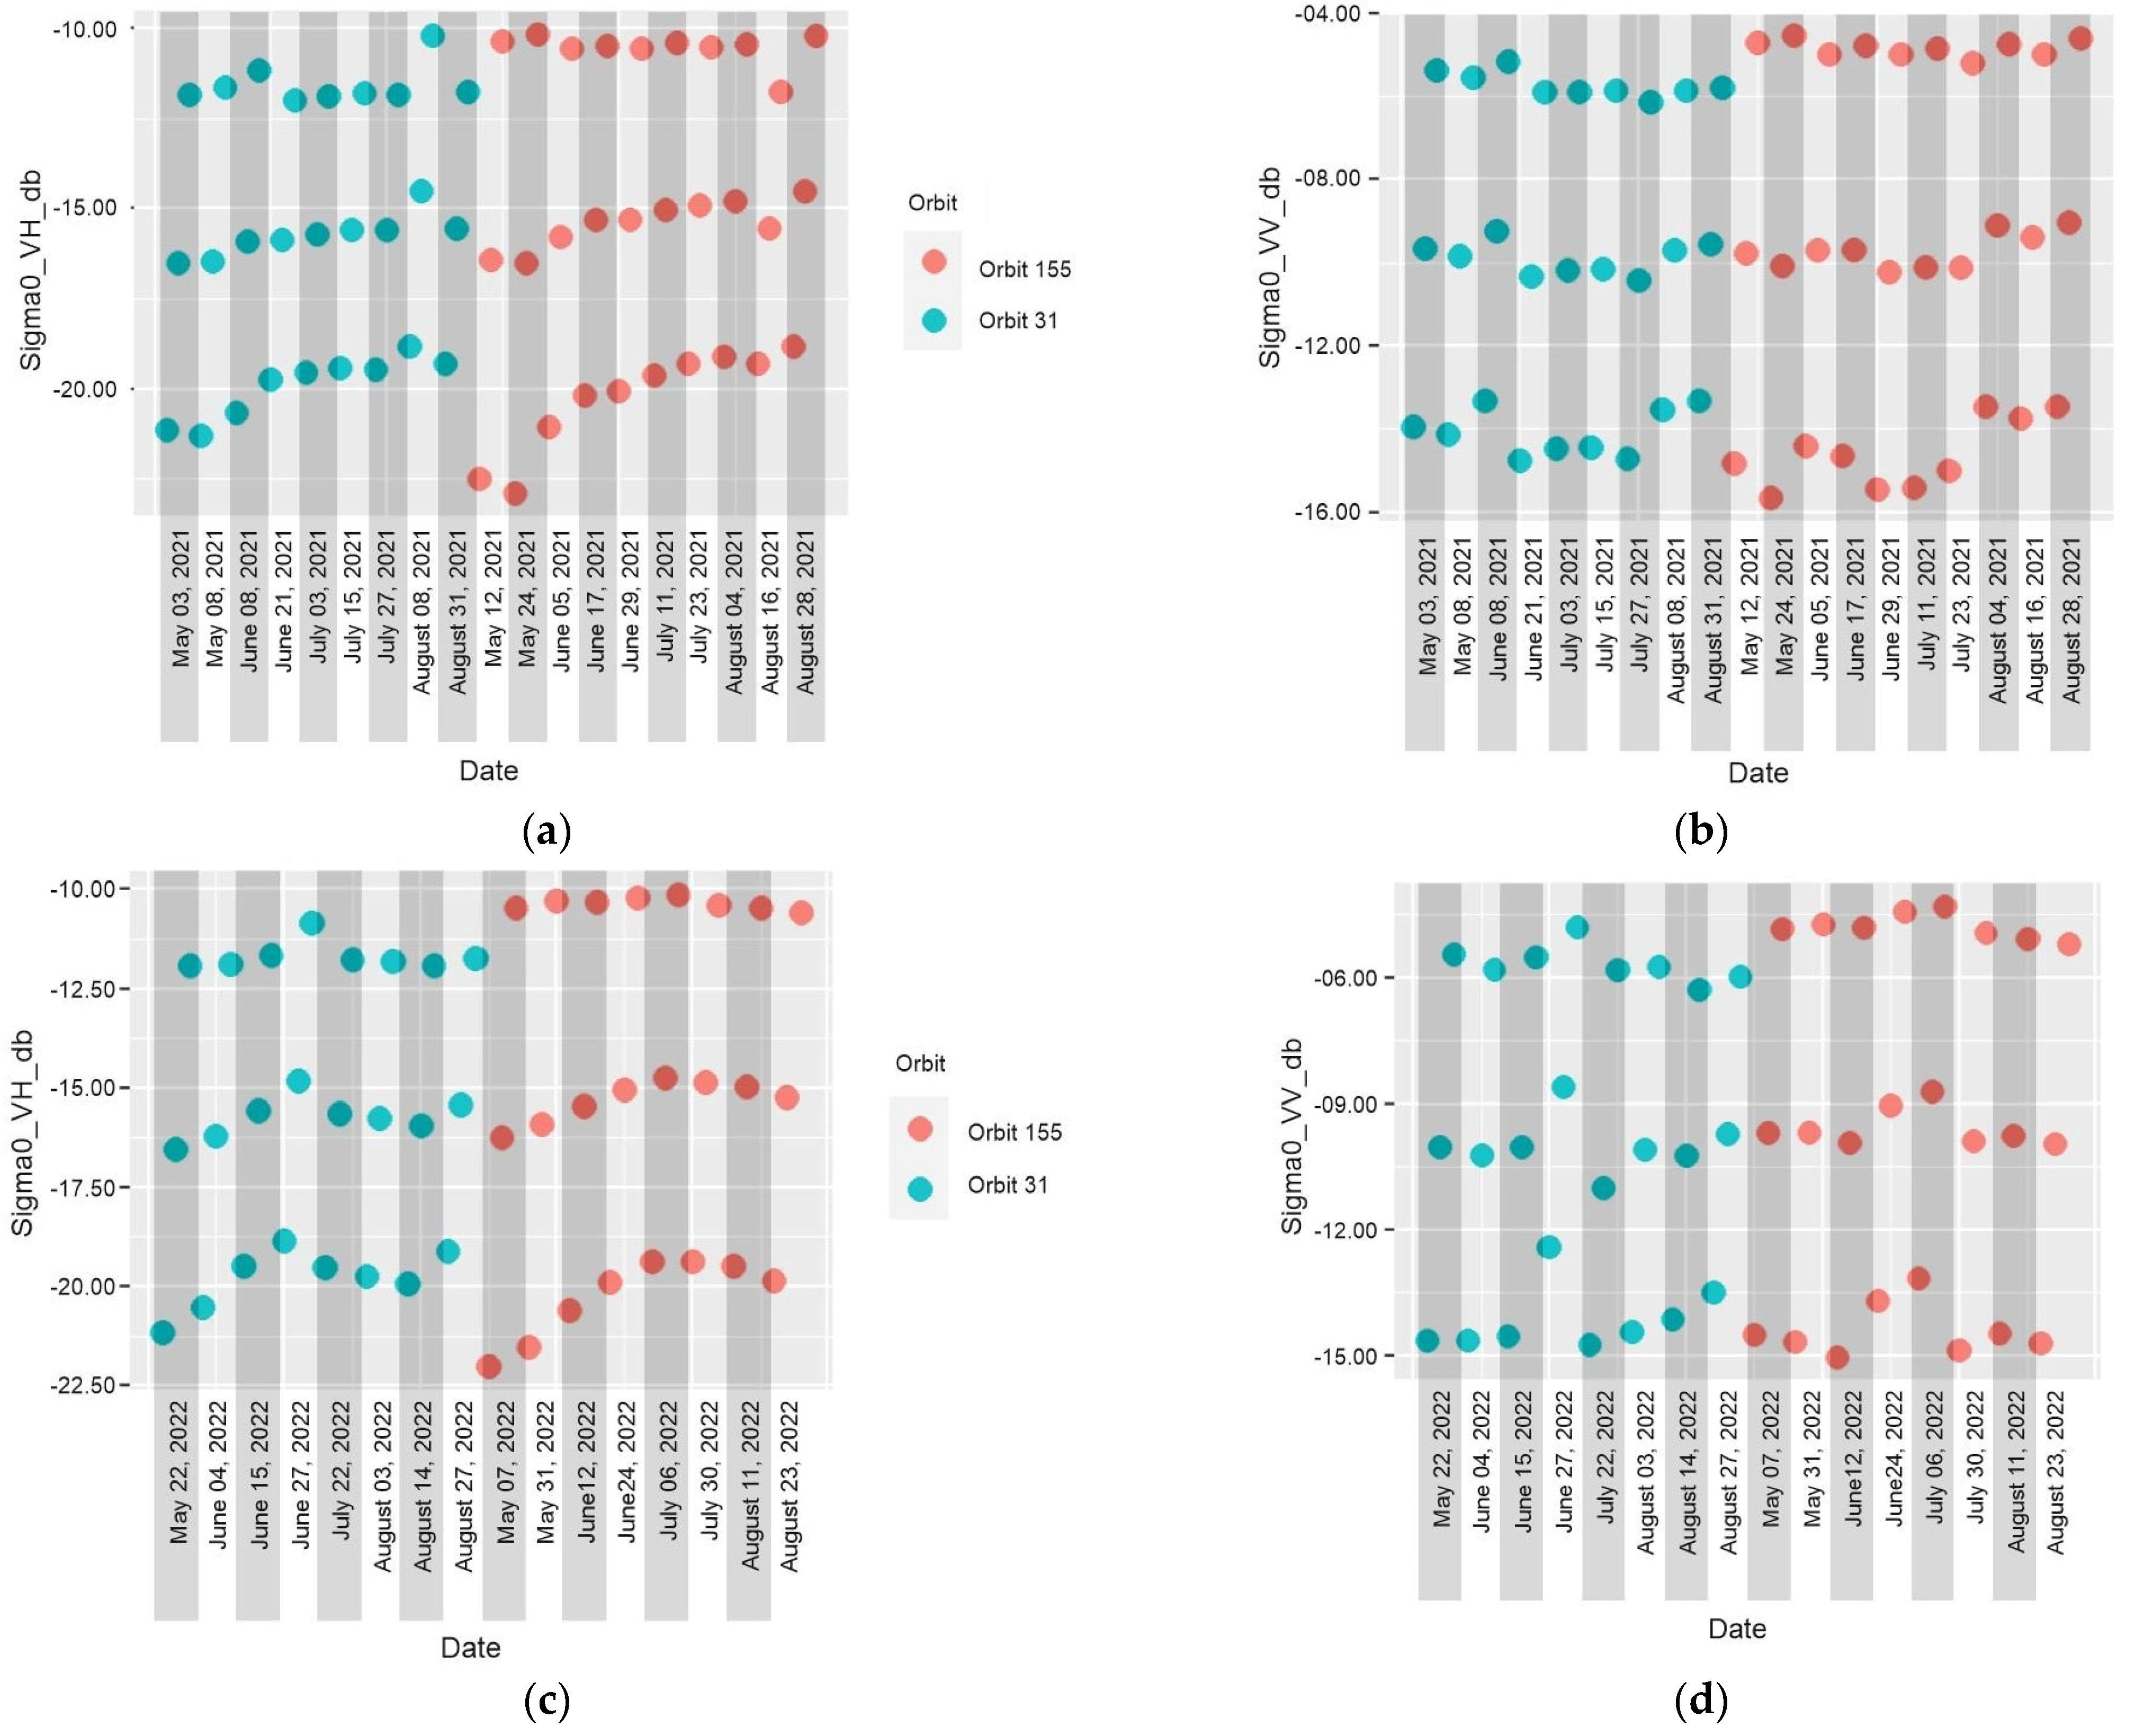
Figure 8 displays the time-series changes in VV (Sigma0_VV_db), and VH (Sigma0_VH_db) for the paddy field in 2021 (Figure 8a,b) and 2022 (Figure 8c,d). In 2021, Sigma values in both orbits demonstrated relevant tendencies; for instance, peak values were detected between the end of May and earlier June, i.e., 8 June 2021, as well as around August 2021, i.e., 4 August 2021. Thus, by 16 August 2021, the values of Sigma0_VV_db and Sigma0_VH_db in both orbits went down. Sigma0_VV_db, and Sigma0_VH_db in 2022 were significantly increased between the end of June (27 June 2022) and earlier July (3 July 2022) in both orbits, followed by a delicate decrease around 14 August 2022. If we compare these data to the ground photograph on 3 June 2022 (Figure 5b), the area shows that the paddy crop is in an early season, with some bare soil visible. On 3 July 2022, the tillering phase started to take place. Meanwhile, the C-band scatter changes were expected to increase. To add to this, the ripening period was displayed on 13 August and 14 August 2022 (Figure 5d,e). By this time, polarization should start to decrease. The crops in the ripening period explain why the Sigma0_VV_db and Sigma_VH_db in both orbits were falling (Figure 8c,d).
The Sigma0_VH_db and Sigma0_V_db of the maize field in 2021 (Figure 9a,b) presented a peak between the end of May and early June, and tended to decrease over July and August in orbit31; these values in orbit155 fluctuated slightly. In contrast, the Sigma0_VH_db and Sigma0_VV_db values of the maize field in 2022, specifically in orbit31, seemed to reach similar peak values in late June, i.e., 27 June 2022, then continued to decrease. Orbit155 demonstrated a peak value earlier in July 2022 and then appeared stable for the rest of the season.
The scatterplots of the Sigma0_VH(dB) and Sigma0_VV(dB) values of the PF in 2022 and 2021 are shown in Figure 10a,b, respectively. Figure 10c,d demonstrates the scatterplot of the MF in 2022 and 2021, respectively. Linear associations between Sigma0_VH_db and Sigma0_VV_db were found in both the PF and MF in both years of observation, with a strong correlation coefficient (R2 above 0.900). Statistically significant differences between the RVI values from the two real orbits could not be proven. Results of linear regression analyses revealed that the later period of observation was associated with the higher values of RVI in both PF and MF (both had p < 0.001). However, observation in the year 2022 in MF correlated with the higher RVI values (p < 0.001).

3.3. Vegetation Index Analysis

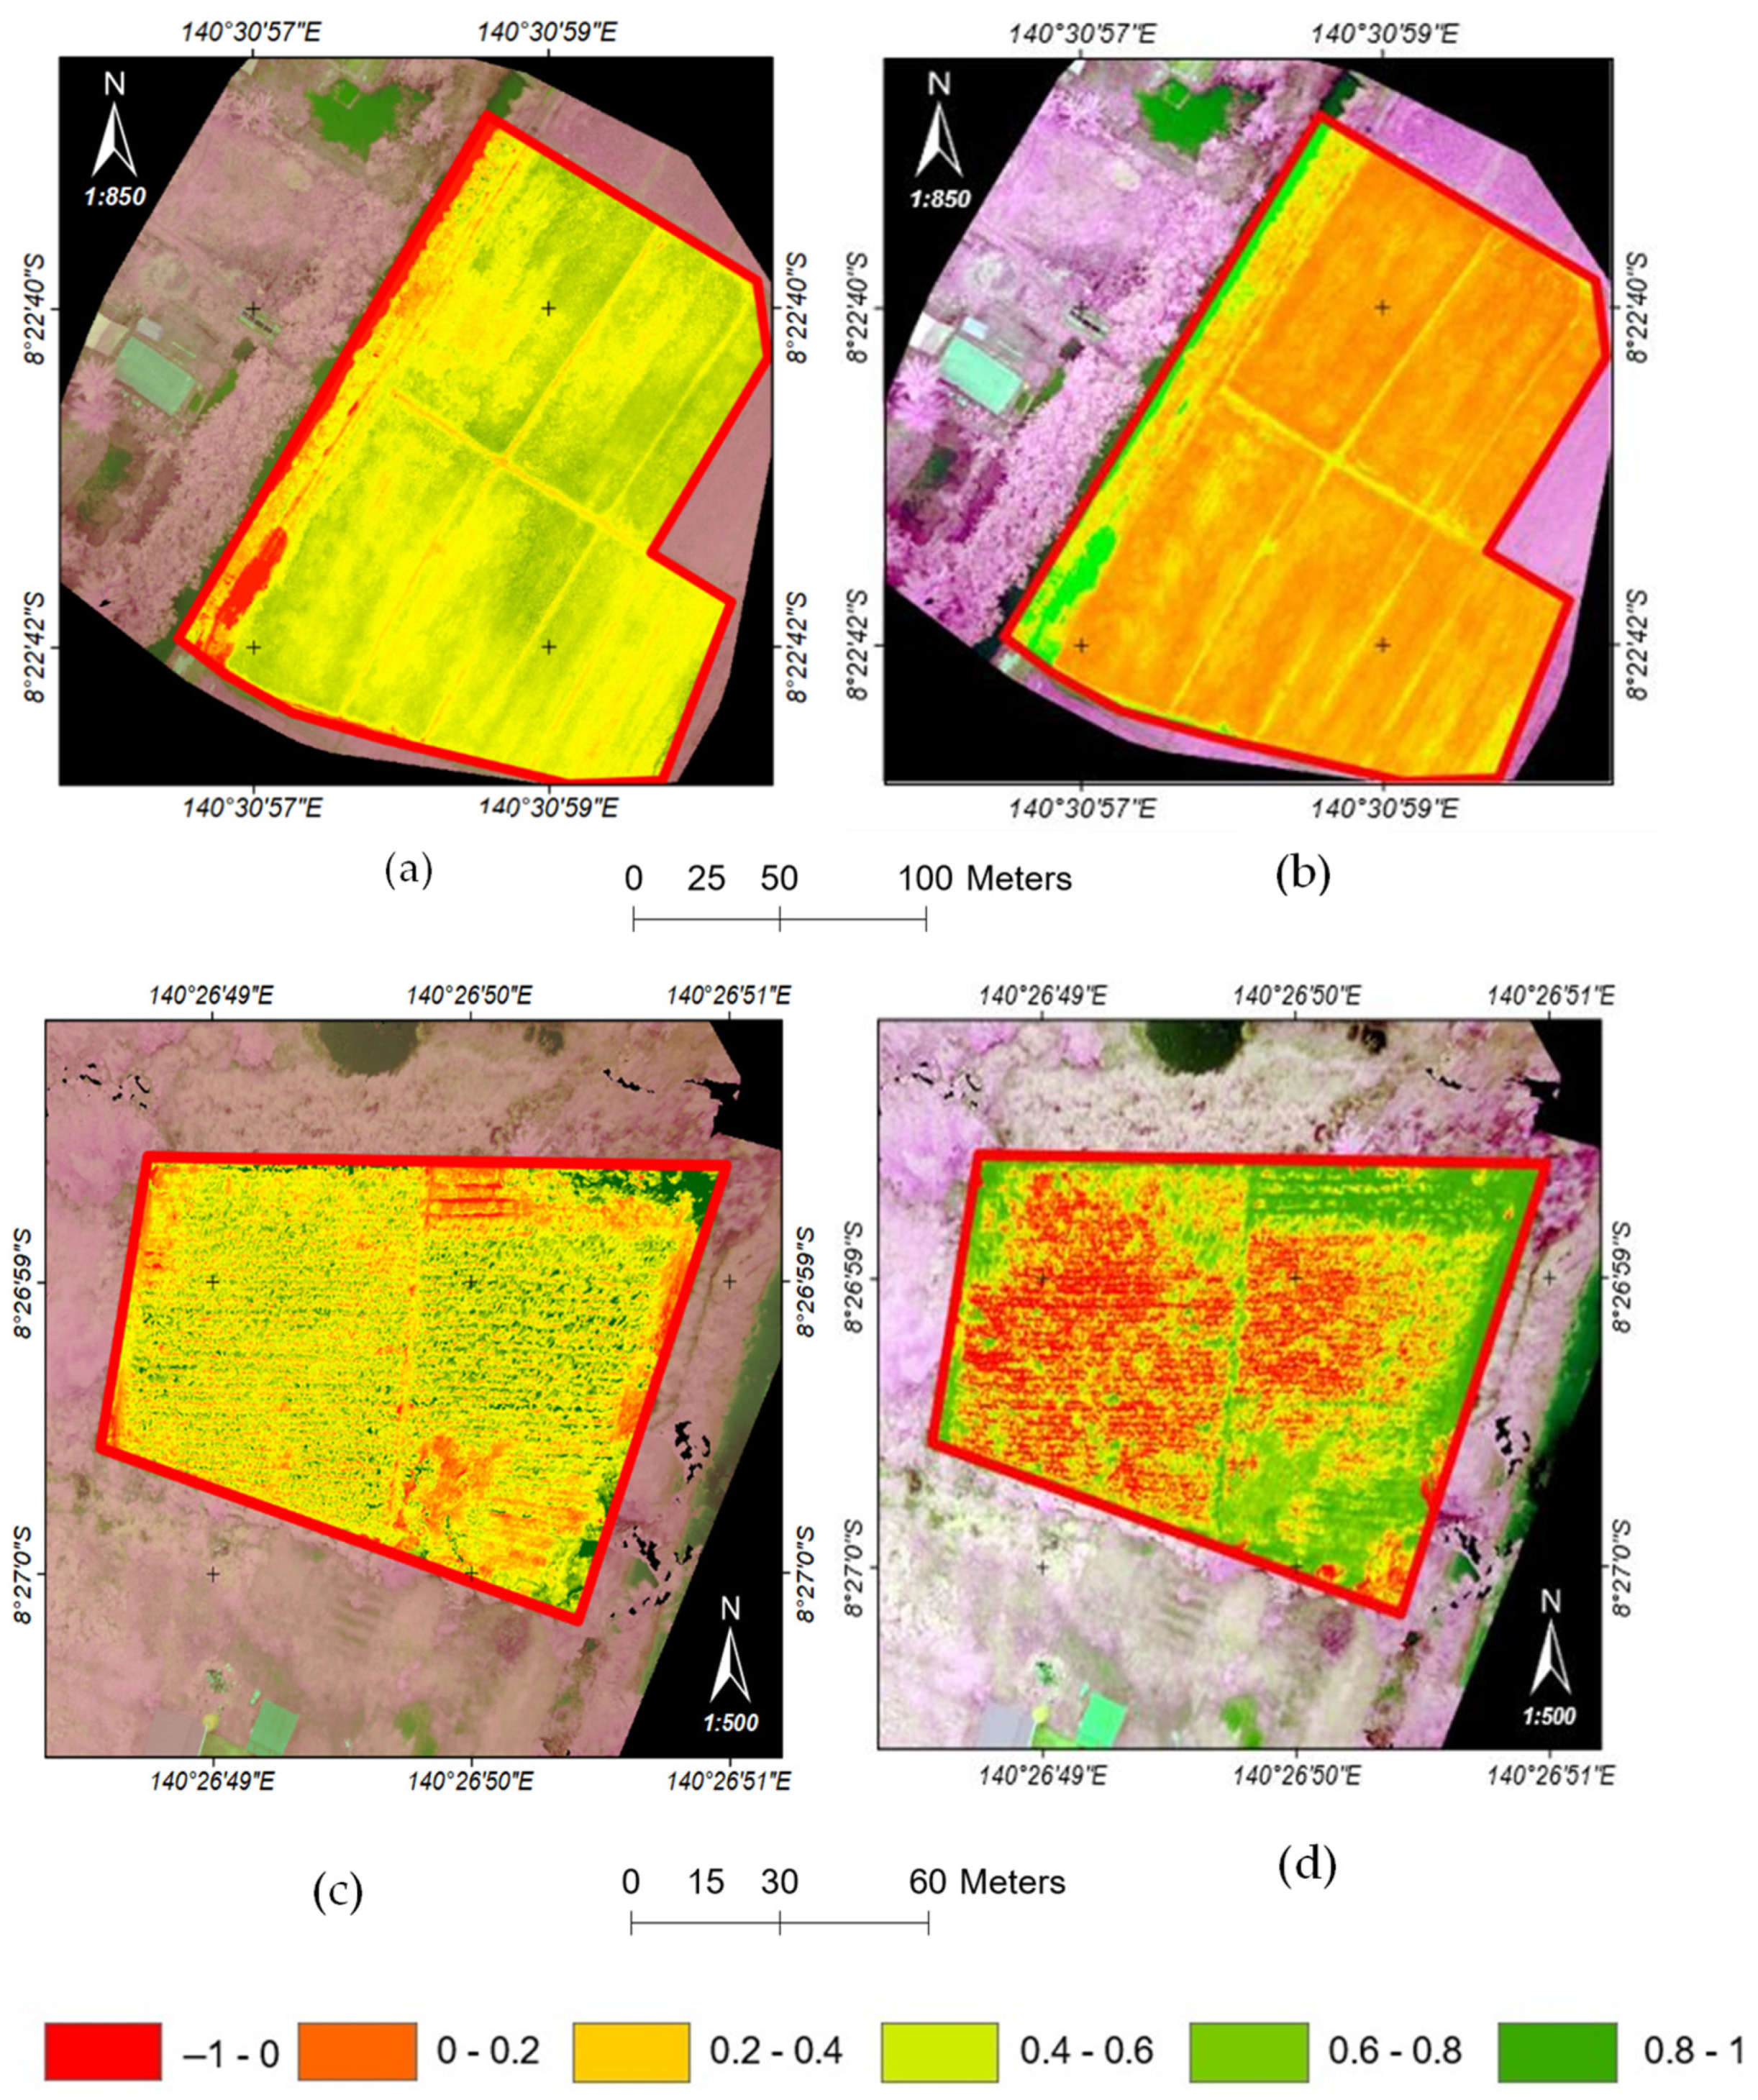
Figure 11 shows the results of the spatial index analysis, namely the GNDVI and ENDVI, from in situ measurements using UAV-NGB images on 3 July 2022 in the paddy field (PF) and on 4 July 2022 in the maize field (MF). From the processing results, we found that the mean values of the vegetation indices were an ENDVI of 0.156351 and a GNDVI of 0.209341 for the PF and an ENDVI of 0.165149 and a GNDVI of 0.215278 for the MF. The GNDVI is related to the Normalized Difference Vegetation Index (NDVI), except the green range is measured in the GNDVI, whereas the NDVI measures the red. The GNDVI is more sensitive to chlorophyll absorption than the NDVI; thus, it is used as a signal of the photosynthetic activeness of vegetation cover. According to the pixel values of each site, the GNDVI values in PF and MF were about 0.4 to 0.6, while the ENDVI values were 0.2 to 0.4. As with the NDVI, the values of ENDVI and GNDVI were also given in the range of −1 to 1. Negative values are usually associated with areas of water, bare soil, or clouds, while values near 0 represent very little greenness. However, values close to 1 show intense levels of greenness. The GNDVI values on 3 July 2022 and 4 July 2022 in the PF and MF showed moderate greenness from crops and indicated the early stages of crop growth, such as tillering. Conversely, the ENDVI results displayed lower values than the GNDVI.
Based on the results of the Independent t test for the contrasting spatial indices used, the GNDVI was able to significantly detect and estimate paddy area areas of 0.4 to 0.6. Furthermore, the GNDVI was also able to detect the paddy field better than the ENDVI.

4. Discussion

This study collected Sentinel -1 SAR data to obtain the RVI and temporal behavior of backscatter sigma0_VV_db and sigma0_VH_db changes in selected areas of a paddy field (PF) and maize field (MF). In addition, vegetation indices, such as the GNDVI and ENDVI, were produced from UAV NGB images as the in situ measurement captured on 3–4 July 2022, as well as ground photographs, as presented in Figure 5. These parameters were used to monitor and track the crops’ growth in 2021 and 2022. The RVI values of the paddy field in 2022, as presented in Figure 6a,b demonstrated a peak value of 1.337 on 22 July 2022, according to orbit31, while in orbit155, the peak value was 1.397 on 30 July 2022. Both of these peak values indicated when crop maturity began [12], before the harvest period. The harvest period was from around 11 August 2022 to 14 August 2022, as explained by the RVI values that were observed to decrease after these dates. These results are comparable to the ground photographs. Before that, on 22 May 2022 (orbit31) and 31 May 2022 (orbit155), the RVI indicated deluge stages, including watering and land preparation. At this stage, the RVI value was about 0.231–0.293, which, based on previous studies, indicates the inundation stages of the paddy. For example, the RVI of bare plowed soils ranges from 0.1 to 0.2, and water bodies are below 0.2 [25]. The results were also comparable with our in situ measurement using the ground photograph captured on 3 June 2022. It can be seen that the paddy field at the earlier stages was covered with bare soil, and water (Figure 5b), while on 3 July 2022, the vegetative stage took place. The RVI of PF reached a peak at 1.337 on 22 July 2022 (Figure 6b), which showed the late vegetative stage before maturity began [12]. The results of GNDVI obtained from in situ measurement in PF (3 July 2022) and MF (4 July 2022) indicated related results, with a value of 0.4–0.6 (Figure 11). Since the GNDVI is sensitive to chlorophyll, which is used as an indicator of the vegetative stages of paddy, the results of GNDVI are expected to be higher [26] which is in line with the results of this study. On one hand, the ENDVI results were about two times lower compared to the GNDVI’s, even though some previous studies found that the ENDVI was able to improve the vegetation signal better than the traditional NDVI. The results of these previous studies pointed out that some factors, such as wavelength sensors, as discussed by [17] utilized various wavelengths. This included the NGB camera, which was also used in this study to facilitate in situ measurement. The findings demonstrated how significant the wavelength’s effects are in capturing images of the crops, for instance, the blue wavelength, which can absorb the energy of chlorophyll up to 453 nm, or carotenoids in the 400–500 nm range [27]. Hence, this study found that the GNDVI was able to support the SAR data results from the two areas rather than ENDVI, specifically in 2022, when the ground photographs were also collected (Figure 5c). These results presented an equivalent finding to a previous study that found the GNDVI from a color infrared camera could detect the early development of maize and paddy [22,28].
Considering the RVI of the PF in 2021 (Figure 6), although it lacked a supporting in situ measurement, the result presented similar tendencies to the PF in 2022, with a maximum value from 3 July–11 July 2021 in both orbits (Figure 6a), followed by a decrease to around August 2021. As investigated in a previous study [13] this decrease specified the start of the harvesting period. Thus, all relative orbits displayed similar tendencies between the analyzed years in terms of capturing the growth stages. Hence, it can be estimated that in the PF, the vegetative stage occurred from May to August (harvesting time), or about three months, with an average initial RVI of 0.3 in both May 2021 and May 2022. The local farmer was informed of the stages in months, as reported in this study, i.e., the paddy field area was about 1.5 months during in situ measurement by UAV NGB. Nevertheless, conducting a ground investigation based on the date of year (DOY)/year numbering system [29], and taking an in situ series of time measurements with a UAV is advantageous to help the decision makers in estimating the total production time or to arrange for further development plans. Accordingly, the average initial RVI value for the maize field was 0.4 in May 2021 and 0.5 in May 2022 (Figure 7); meanwhile, there was a slight difference in corn development between 2021 and 2022 during the SAR data period in the study area. In Section 2.4, corn establishment, which is generally related to paddy fields, consisting of the vegetative, reproductive, and ripening stages, with a deluge stage taking place prior to the vegetation stage, was discussed. However, an earlier study assessed the relationship between corn height and SAR backscattering [30]. The results highlighted the sensitivity of the backscatter to the corn’s height up to at least 150 cm. The sensitivity of SAR backscattering will be worse if the corn’s height is above 150 cm. Our in situ measurement recorded the height of 35 samples of corn (Figure 4), which varied from 90 cm to 164 cm, with an average of 137 cm. This variance in corn height could have contributed to the fluctuating RVI in the MF during the study period. Other studies have also mentioned the significance of the lodging phenomenon in corn, specifically throughout the grain filling and flowering stages, as a result of extreme rainfall, inclemency, or drought. The findings indicated that VH polarization is preferable in maize plants before lodging, and that the use of VH+VV polarization is preferred after lodging [31]. Unfortunately, our in situ measurement did not include corn lodging, which is a limitation of this study. However, the RVI established by the polarization of VH and VV+VH was able to identify the crop’s growth. Nevertheless, the separation of detection before lodging, and after lodging combined with ground in situ measurement needs to be considered. Generally, the RVI values at both sites during the study period were able to trach the crop’s growth; however, some factors still need to be evaluated further, as mentioned above. Research on paddy and maize monitoring could help stakeholders in forecasting the planting date and allow the government to track the availability of fertilizer required during crop development. Furthermore, the estimation of production time based on harvest time could improve crop security, specifically when maize lodging occurs. Predicting harvest time using SAR data could help relevant stakeholders or government bodies keep up with annual statistical reporting, for instance, the planting date, the harvesting date, and other relevant data. Even though other indices can be derived from optical data such as GNDVI and ENDVI, radar data processed without the influence of clouds or weather [32] that is generally experienced in eastern Indonesia, the location of our study area.
The temporal behavior of backscatter in paddy crops is in line with several previous studies [33,34]. During the study period, for instance, in 2022, the paddy field’s development was started by watering in May, and followed by seeding in earlier June. The vegetation phase began on 12 June 2022, as can be seen from the changes in sigma0_VH_db and sigma0_VV_db, which started to increase and reached a peak on 6 July 2022 (orbit31). Nevertheless, there was a slight increase on 11 August 2022 in orbit31, followed by a decrease during the rest of the month; however, it continually increased in orbit155. If we compare these data to the in situ measurement (Figure 5d,e), it can be seen that the harvest period was from about 13 August to 14 August 2022. By this time, Sigma0_VV_db and Sigma0_VH_db were expected to decrease, as shown in the results of this study (Figure 8). Thus, orbit31 appeared to be more associated than orbit155, even though there were no differences between the calculated RVI of the VV and VH of the two relative orbits. The backscatter in the maize field in 2022 showed changes on 27 June 2022 (orbit31) and 6 July 2022 (orbit155), pointing out the maturity stage [35]. Nevertheless, Sigma0_V_db, and Sigma0_VH_db in the MF tended to be unchanged in each analyzed year compared to PF. This described the importance of observing various polarizations, for instance, VH/VV (dB) [36]; VV ∗ VH, VV + VH, and VV − VH specifically in maize crop monitoring [35]. Although both Sigma0_VH_db and Sigma0_VV_db demonstrated similar tendencies, this study found the Sigma0_VH_db in both orbits to be more comparable with our ground photograph, particularly in the paddy field area.
A study of crop monitoring in a typically developed region, such as Papua Province, is required to support food security plans and sustainability. As previously mentioned, since 2016, the annual statistics report of other carbohydrate resources, such as maize, has not been included due to manual inspection being the only available method. Therefore, the results of this study can be a proxy for tracking and monitoring crop growth stages. According to the results, the study collected Sentinel-1 SAR data relevant to investigating the development of paddy and maize in our study area. However, some points have yet to be reckoned with, such as polarization combination and providing more datasets as well as in situ measurements.

5. Conclusions

This study used multitemporal backscatter changes in the Sentinel-1 SAR data from May to August 2021 and 2022 to monitor paddy and maize fields in our study area. The RVI values and backscatter changes in VV (db), and VH (db) were investigated, in addition to the in situ measurement taken by acquiring spectral indices from UAV NGB images and ground photographs. The statistical results indicated a linear association between the sigma0_VV_db and sigma0_VH_db changes in these two fields between the analyzed years, with an R2 above 0.900. The results indicated the potential of VH polarization in determining the growth stage, particularly in the paddy field area, in 2022. The calculated RVI demonstrated a comparable development of the crop phenological in these fields; however, in situ measurement might still be required to support the results. The statistical results could not be proven for the RVI values from the two relative orbits (orbit31 and orbit155) due to the difference in incidence angles. Nevertheless, the differentiation of images based on the relative orbit used (orbit31 or orbit155) appeared to obtain more results related to the growth stages of paddy and maize fields in our study area.
The results of this study, which are based on the analysis of C-band dual polarization Sentinel-1 data series VV and VH and field survey data, do not only have the potential to evaluate the growth stage but could assist stakeholders in arranging agricultural plans, specifically in the region with different transplanting or harvesting dates, as experienced in our field work. On one side, tracking the annual planting or sowing dates could significantly contribute to the agricultural stakeholder’s plans; for instance, fertilizer availability, irrigation control, and crop disease prevention related to the growth stages could improve productivity. To summarize, the significance of the study could promote SAR sentinel-1 data as one of the alternative surveys for monitoring and tracking that can be used by this region.

Author Contributions

Conceptualization, methodology, and validation, S.M.A.L., R.C.P. and D.H.; software, S.M.A.L. and P.H., formal analysis, S.M.A.L. and R.C.P.; investigation, S.M.A.L. and D.H.; resources, D.H.; writing—original draft preparation, S.M.A.L., M.C.P. and R.C.P.; writing—review and editing, S.M.A.L., P.H., M.C.P., R.C.P. and D.H.; visualization, S.M.A.L., M.C.P. and R.C.P.; supervision, D.H.; project administration, D.H.; funding acquisition, D.H. All authors have read and agreed to the published version of the manuscript.

Funding

The study was dedicated to project No. 3/2022, Unmanned Aerial Systems Technology for Recognition and Estimation of the Land Area in Papua Province, Indonesia, financed from the OP RDE Project Improving the quality of the Internal Grant Scheme at the Czech University of Life Sciences Prague, reg. no CZ.02.2.69/0.0/0.0/19_073/0016944.

Institutional Review Board Statement

Not applicable.

Informed Consent Statement

Not applicable.

Data Availability Statement

The data presented in the form of figures and tables are a part of UGS Project No 3/2022. All data obtained and processed includes territorial boundaries of each Regency were collected before the New Structure of Papua Province was announced.

Acknowledgments

S.M.A.L. is deeply grateful to the Indonesia Endowment Fund for Education (LPDP-Indonesia) for funding and supporting her Ph.D. study. All of the authors would like to express a deep appreciation to Agustinus Yoga Priyanto, SP; as the Head of the Food Crops and Horticulture Department of the Agricultural Office of Merauke Regency for his insight and companionship during the fieldwork. We are also highly grateful to the local farmers, and the local community at Semangga District and Tanah Miring District of Merauke Regency. Our deepest gratitude goes to the technical assistance of David Guth and Ebenezer Butarbutar during field data collection.

Conflicts of Interest

The authors declare no conflict of interest.

References

  1. BPS. Statistical Yearbook of Indonesia 2021; BPS-Statistics Indonesia, BPS: Jakarta, Indonesia, 2021.
  2. The World Bank. Available online: https://databank.worldbank.org/reports.aspx?source=2&series=SP.POP.TOTL&country= (accessed on 18 August 2022).
  3. BPS. Paddy Yield Area and Production in Indonesia 2021 (Results of Food Crop Agricultural Statistics Data Collection Activities Integrated with Area Sample Framework Method); BPS-Statistics Indonesia, BPS: Jakarta, Indonesia, 2022.
  4. BPS. Papua Province in Figures 2022; BPS-Statistics Papua Province, BPS: Papua, Indonesia, 2022.
  5. Letsoin, S.M.A.; Herak, D.; Rahmawan, F.; Purwestri, R.C. Land Cover Changes from 1990 to 2019 in Papua, Indonesia: Results of the Remote Sensing Imagery. Sustainability 2020, 12, 6623. [Google Scholar] [CrossRef]
  6. He, L.; Luo, H.; Duan, M.; Kong, L.; Tang, X. Mechanized Hybrid Rice Seed Production: Planting Density, the Flight Height of an Unmanned Aerial Vehicle, Fertilizer Application, and the Row-Ratio of Parents. Agronomy 2022, 12, 1572. [Google Scholar] [CrossRef]
  7. Oehme, L.H.; Reineke, A.-J.; Weiß, T.M.; Würschum, T.; He, X.; Müller, J. Remote Sensing of Maize Plant Height at Different Growth Stages Using UAV-Based Digital Surface Models (DSM). Agronomy 2022, 12, 958. [Google Scholar] [CrossRef]
  8. Wang, K.; Chen, H.; Cheng, L.; Xiao, J. Variational-Scale Segmentation for Multispectral Remote-Sensing Images Using Spectral Indices. Remote Sens. 2022, 14, 326. [Google Scholar] [CrossRef]
  9. Meivel, S.; Maheswari, S. Monitoring of Potato Crops Based on Multispectral Image Feature Extraction with Vegetation Indices. Multidimens. Syst. Signal Process. 2022, 33, 683–709. [Google Scholar] [CrossRef]
  10. Shanahan, J.F.; Schepers, J.S.; Francis, D.D.; Varvel, G.E.; Wilhelm, W.W.; Tringe, J.M.; Schlemmer, M.R.; Major, D.J. Use of Remote-Sensing Imagery to Estimate Corn Grain Yield. Agron. J. 2001, 93, 583–589. [Google Scholar] [CrossRef] [Green Version]
  11. Panov, D.Y.; Sakharova, E.Y. Using Radar Data for Grain Crops Yield Forecasting in the Novosibirsk Region. Russ. Meteorol. Hydrol. 2022, 47, 473–478. [Google Scholar] [CrossRef]
  12. Tůma, L.; Kumhálová, J.; Kumhála, F.; Krepl, V. The Noise-Reduction Potential of Radar Vegetation Index for Crop Management in the Czech Republic. Precis. Agric. 2022, 23, 450–469. [Google Scholar] [CrossRef]
  13. Oyoshi, K.; Tomiyama, N.; Okumura, T.; Sobue, S.; Sato, J. Mapping Rice-Planted Areas Using Time-Series Synthetic Aperture Radar Data for the Asia-RiCE Activity. Paddy Water Environ. 2016, 14, 463–472. [Google Scholar] [CrossRef]
  14. Khabbazan, S.; Vermunt, P.; Steele-Dunne, S.; Ratering Arntz, L.; Marinetti, C.; van der Valk, D.; Iannini, L.; Molijn, R.; Westerdijk, K.; van der Sande, C. Crop Monitoring Using Sentinel-1 Data: A Case Study from The Netherlands. Remote Sens. 2019, 11, 1887. [Google Scholar] [CrossRef] [Green Version]
  15. Vreugdenhil, M.; Wagner, W.; Bauer-Marschallinger, B.; Pfeil, I.; Teubner, I.; Rüdiger, C.; Strauss, P. Sensitivity of Sentinel-1 Backscatter to Vegetation Dynamics: An Austrian Case Study. Remote Sens. 2018, 10, 1396. [Google Scholar] [CrossRef] [Green Version]
  16. BPS. Paddy Yield Area and Production in Papua Province 2021 (Results of Food Crop Agricultural Statistics Data Collection Activities Integrated with Area Sample Framework Method); Publication number: 94530.2201; BPS-Statistics Indonesia, BPS: Papua, Indonesia, 2022.
  17. Fernandez-Figueroa, E.G.; Wilson, A.E.; Rogers, S.R. Commercially available unoccupied aerial systems for monitoring harmful algal blooms: A comparative study. Limnol. Oceanogr. Methods 2022, 20, 146–158. [Google Scholar] [CrossRef]
  18. Kumar, S.D.; Rao, S.S.; Sharma, J.R. Radar Vegetation Index as an Alternative to NDVI for Monitoring of Soyabean and Cotton. In Proceedings of the XXXIII INCA International Congress (Indian Cartographer), Jodhpur, India, 19–21 September 2013; Volume 7. [Google Scholar]
  19. Nelson, A.; Setiyono, T.; Rala, A.; Quicho, E.; Raviz, J.; Abonete, P.; Maunahan, A.; Garcia, C.; Bhatti, H.; Villano, L.; et al. Towards an Operational SAR-Based Rice Monitoring System in Asia: Examples from 13 Demonstration Sites across Asia in the RIICE Project. Remote Sens. 2014, 6, 10773–10812. [Google Scholar] [CrossRef] [Green Version]
  20. Ramadhani, F.; Pullanagari, R.; Kereszturi, G.; Procter, J. Mapping a Cloud-Free Rice Growth Stages Using the Integration of PROBA-V and Sentinel-1 and Its Temporal Correlation with Sub-District Statistics. Remote Sens. 2021, 13, 1498. [Google Scholar] [CrossRef]
  21. Counce, P.A.; Keisling, T.C.; Mitchell, A.J. A Uniform, Objective, and Adaptive System for Expressing Rice Development. Crop Sci. 2000, 40, 436–443. [Google Scholar] [CrossRef] [Green Version]
  22. Zheng, H.; Cheng, T.; Li, D.; Zhou, X.; Yao, X.; Tian, Y.; Cao, W.; Zhu, Y. Evaluation of RGB, Color-Infrared and Multispectral Images Acquired from Unmanned Aerial Systems for the Estimation of Nitrogen Accumulation in Rice. Remote Sens. 2018, 10, 824. [Google Scholar] [CrossRef] [Green Version]
  23. Szabó, A.; Mousavi, S.M.N.; Bojtor, C.; Ragán, P.; Nagy, J.; Vad, A.; Illés, Á. Analysis of Nutrient-Specific Response of Maize Hybrids in Relation to Leaf Area Index (LAI) and Remote Sensing. Plants 2022, 11, 1197. [Google Scholar] [CrossRef]
  24. Selvaraj, S.; Haldar, D.; Srivastava, H.S. Condition Assessment of Pearl Millet/ Bajra Crop in Different Vigour Zones Using Radar Vegetation Index. Spat. Inf. Res. 2021, 29, 631–643. [Google Scholar] [CrossRef]
  25. Haldar, D.; Dave, V.; Misra, A.; Bhattacharya, B. Radar Vegetation Index for Assessing Cotton Crop Condition Using RISAT-1 Data. Geocarto Int. 2020, 35, 364–375. [Google Scholar] [CrossRef]
  26. Garcia-Ruiz, F.; Sankaran, S.; Maja, J.M.; Lee, W.S.; Rasmussen, J.; Ehsani, R. Comparison of Two Aerial Imaging Platforms for Identification of Huanglongbing-Infected Citrus Trees. Comput. Electron. Agric. 2013, 91, 106–115. [Google Scholar] [CrossRef]
  27. Erena, M.; Montesinos, S.; Portillo, D.; Alvarez, J.; Marin, C.; Fernandez, L.; Henarejos, J.M.; Ruiz, L.A. Configuration and specifications of an unmanned aerial vehicle for precision agriculture. Int. Arch. Photogramm. Remote Sens. Spat. Inf. Sci. 2016, XLI–B1, 809–816. [Google Scholar] [CrossRef] [Green Version]
  28. Danilevicz, M.F.; Bayer, P.E.; Boussaid, F.; Bennamoun, M.; Edwards, D. Maize Yield Prediction at an Early Developmental Stage Using Multispectral Images and Genotype Data for Preliminary Hybrid Selection. Remote Sens. 2021, 13, 3976. [Google Scholar] [CrossRef]
  29. Nandan, R.; Bandaru, V.; He, J.; Daughtry, C.; Gowda, P.; Suyker, A.E. Evaluating Optical Remote Sensing Methods for Estimating Leaf Area Index for Corn and Soybean. Remote Sens. 2022, 14, 5301. [Google Scholar] [CrossRef]
  30. Abdikan, S.; Sekertekin, A.; Ustunern, M.; Balik Sanli, F.; Nasirzadehdizaji, R. Backscatter analysis using multi-temporal sentinel-1 sar data for crop growth of maize in konya basin, turkey. Int. Arch. Photogramm. Remote Sens. Spat. Inf. Sci. 2018, XLII–3, 9–13. [Google Scholar] [CrossRef] [Green Version]
  31. Han, D.; Yang, H.; Yang, G.; Qiu, C. Monitoring Model of Corn Lodging Based on Sentinel-1 Radar Image. In Proceedings of the 2017 SAR in Big Data Era: Models, Methods and Applications (BIGSARDATA), Beijing, China, 13–14 November 2017; pp. 1–5. [Google Scholar]
  32. Ali, A.M.; Abouelghar, M.; Belal, A.A.; Saleh, N.; Yones, M.; Selim, A.I.; Amin, M.E.S.; Elwesemy, A.; Kucher, D.E.; Maginan, S.; et al. Crop Yield Prediction Using Multi Sensors Remote Sensing (Review Article). Egypt. J. Remote Sens. Space Sci. 2022, 25, 711–716. [Google Scholar] [CrossRef]
  33. Mandal, D.; Kumar, V.; Bhattacharya, A.; Rao, Y.S.; Siqueira, P.; Bera, S. Sen4Rice: A Processing Chain for Differentiating Early and Late Transplanted Rice Using Time-Series Sentinel-1 SAR Data with Google Earth Engine. IEEE Geosci. Remote Sens. Lett. 2018, 15, 1947–1951. [Google Scholar] [CrossRef]
  34. Phung, H.-P.; Nguyen, L.-D.; Thong, N.-H.; Thuy, L.-T.; Apan, A.A. Monitoring Rice Growth Status in the Mekong Delta, Vietnam Using Multitemporal Sentinel-1 Data. J. Appl. Rem. Sens. 2020, 14, 014518. [Google Scholar] [CrossRef] [Green Version]
  35. Shu, M.; Zhou, L.; Gu, X.; Ma, Y.; Sun, Q.; Yang, G.; Zhou, C. Monitoring of Maize Lodging Using Multi-Temporal Sentinel-1 SAR Data. Adv. Space Res. 2020, 65, 470–480. [Google Scholar] [CrossRef]
  36. Veloso, A.; Mermoz, S.; Bouvet, A.; Le Toan, T.; Planells, M.; Dejoux, J.-F.; Ceschia, E. Understanding the Temporal Behavior of Crops Using Sentinel-1 and Sentinel-2-like Data for Agricultural Applications. Remote Sens. Environ. 2017, 199, 415–426. [Google Scholar] [CrossRef]
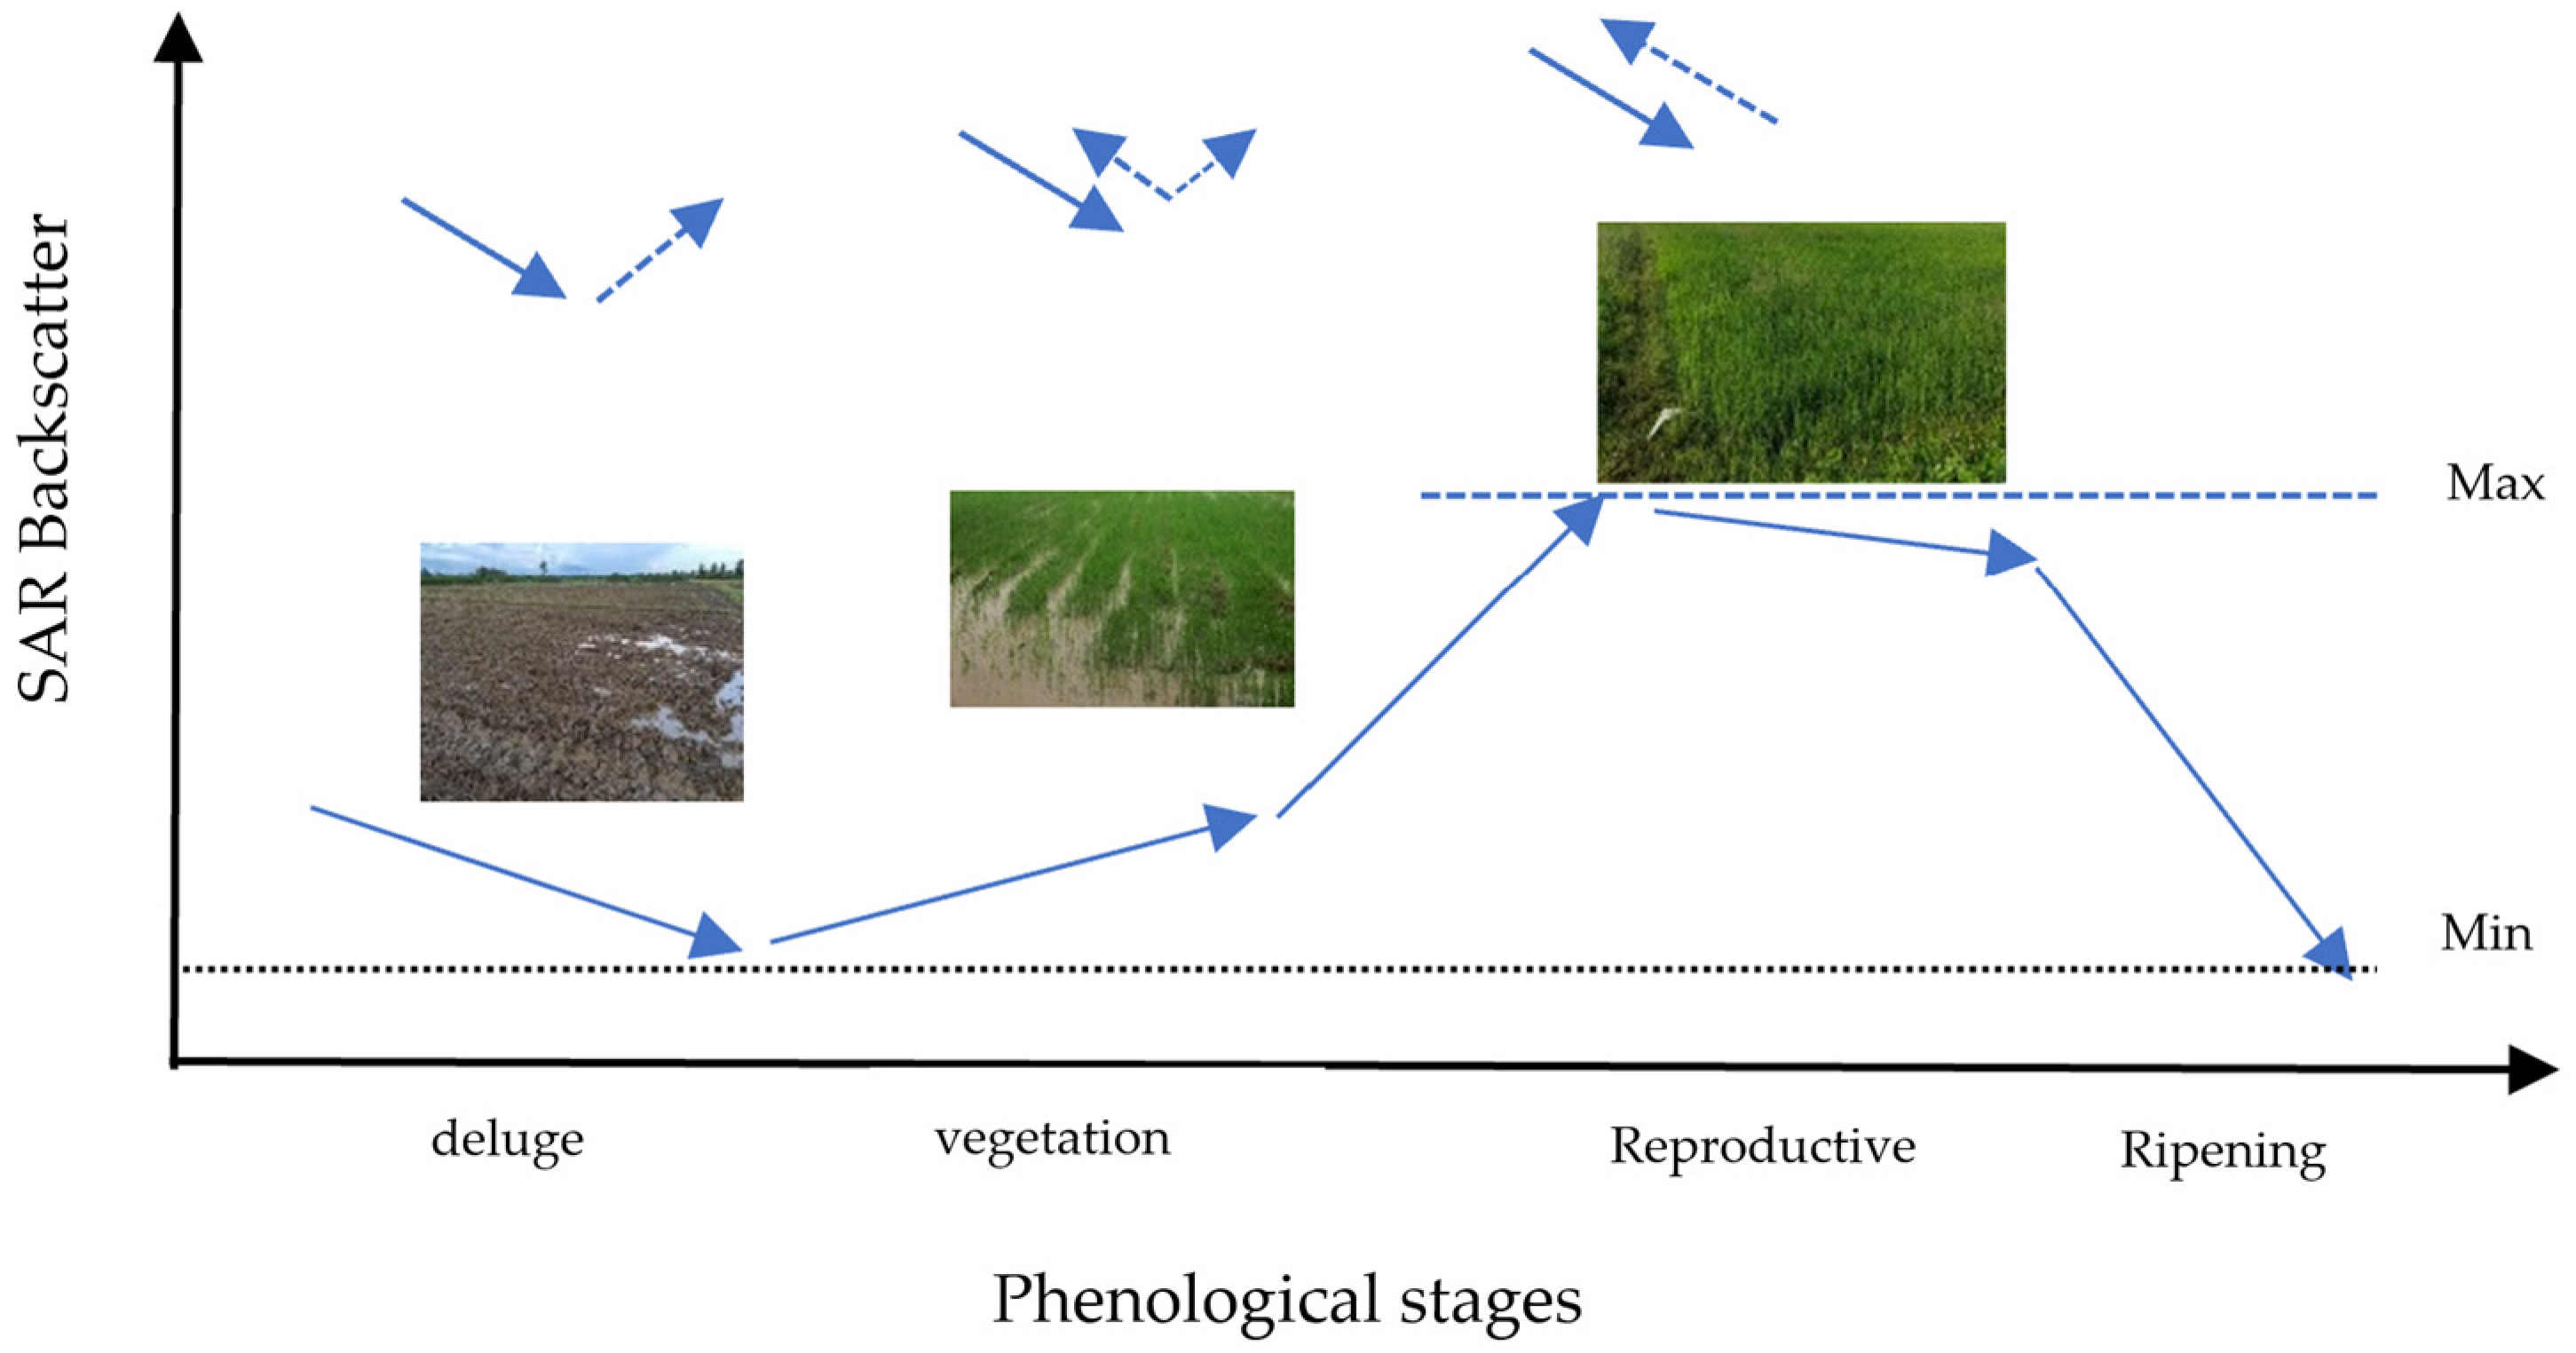
Figure 1. SAR backscatter in paddy crop monitoring [13] with modification.
Processes 11 00647 g001
Figure 2. Location of study area (137°38′52.9692″ E–141°0′13.3233″ E and 6°27′50.1456″ S–9°10′1.2253″ S) between Mappi Regency and Boven Digoel Regency in the north, the Arafura Ocean to the south and west, and Papua New Guinea (PNG) to the east.
Processes 11 00647 g002
Figure 3. UAV imagery acquired from NGB cameras from sites after preprocessing using pix4dmapper software. All Regions of Interest (ROI) are marked as red-bordered areas and consists of area paddy fields (a) and maize fields (b).
Processes 11 00647 g003
Figure 4. Schematic workflow of the study.
Processes 11 00647 g004
Figure 5. Paddy growth stages in the study area.
Processes 11 00647 g005
Figure 6. RVI values of paddy fields (a) in 2021 and 2022 (b).
Processes 11 00647 g006
Figure 7. RVI values of maize fields in 2021 (a) and 2022 (b).
Processes 11 00647 g007
Figure 8. Sigma0_VH_db and Sigma0_VV_db of PF in 2021 (a,b) and 2022 (c,d).
Processes 11 00647 g008
Figure 9. Sigma0_VH_db and Sigma0_VV_db of MF in 2021 (a,b) and 2022 (c,d).
Processes 11 00647 g009
Figure 10. Scatterplot C-band backscatter of PF in 2021 (a) and 2022 (b) and MF in 2021 (c) and 2022 (d).
Processes 11 00647 g010
Figure 11. Spectral indices result from UAV NGB: (a) GNDVI and (b) ENDVI of the paddy field, (c) GNDVI, and (d) ENDVI of the maize field.
Processes 11 00647 g011
Table 1. Area covered and ground sampling distance (GSD).
SiteCoordinateArea Covered *
(ha)
Average GSD *
(cm)
Paddy field site (PF)8°22′39.216″ S, 140°30′59.472″ E1.40472.26
Maize field site (MF)8°25′11.6652″ S, 140°26′42.2406″ E2.48982.45
* Processed by using Pix4dmapper software.
Table 2. Sentinel-1 data available on the research site.
Acquisition TimeAscending
Rel_orbit155, Swath IW, GRD
Incidence Angle 30.55°–45.88°
Descending
Rel_orbit31, Swath IW, GRD
Incidence Angle 30.59°–46.16°
May, 20227 May 202222 May 2022
19 May 2022
31 May 2022
June, 202216 June 20224 June 2022
24 June 2022
27 June 2022
July, 20226 July 2022
18 July 2022
30 July 2022
22 July 2022
August, 202211 August 2022
23 August 2022
3 August 2022
14 August 2022
26 August 2022
May, 202112 May 2021
24 May 2021
3 May 2021
27 May 2021
July, 202111 July 2021
23 July 2021
2 July 2021
14 July 2021
26 July 2021
August 20214 August 2021
16 August 2021
28 August 2021
7 August 2021
19 August 2021
31 August 2021
Table 3. Vegetation indices used in this study *.
NameEquationRef
Green Normalized Difference Vegetation Index (GNDVI)(NIR − G)/(NIR + G)[23] *
Enhanced Normalized Difference Vegetation Index (ENDVI)(NIR + G − 2∗B)/NIR + G + 2∗B) [22] *
* www.indexdatabase.de. Online accessed on 28 August 2022.
Disclaimer/Publisher’s Note: The statements, opinions and data contained in all publications are solely those of the individual author(s) and contributor(s) and not of MDPI and/or the editor(s). MDPI and/or the editor(s) disclaim responsibility for any injury to people or property resulting from any ideas, methods, instructions or products referred to in the content.