Abstract
This paper aims to quantitatively analyze the influence of natural groundwater flowing into the flow field of in situ leaching mining. The computational method was built to evaluate the effect of natural groundwater on the production efficiency of pumping wells for the in situ leaching of uranium, and the “flow ratio of groundwater” and related formulas were defined. C1 and C2 mining areas of an in situ leaching uranium mine in Inner Mongolia were taken as an example, and the effect on the “flow ratio of groundwater” when changing the flow quantity of injection wells and the position and length of the filter in the pumping and injection wells were compared. The results show that the variation in the “flow ratio of groundwater” of a whole mining area or a single pumping well in different production stages can be obtained by the neutral solution concentration value from the mining area’s numerical simulation. Regulating the position, length of the filter, and mode of fluid injection in an in situ leaching mine can control the quantity of natural groundwater flowing into the mining area and reduce the fluid exchange between the flow field of in situ leaching uranium mining and natural groundwater.
1. Introduction
In situ leaching uranium mining is a technology that depends on drilling holes to inject some chemical solution into the ore-bearing strata. The solution moves along the ore bed by controlling the hydraulic gradient of the flow field. In this process, the solution reacts with the ore to generate a uranium-bearing solution. Then, the uranium-bearing solution is extracted to the surface through the pumping well for separation and purification [1,2]. The flow field of in situ leaching mining is a comprehensive field with the solution alongside convective motions, solute dispersions, and chemical reactions. The three fields interact to form the solution’s flow, diffusion, and reaction. Hydrodynamic convection is the basis of the flow field, which determines the solution diffusion and reaction range. Solute dispersions rely on the range of action from the hydrodynamic convection.
With the development of computer technology, numerical simulation has become an essential quantitative method to study groundwater flow conditions [3,4,5,6,7,8,9] and has been widely utilized in the in situ leaching of uranium. The numerical simulation can be used to quantitatively calculate water flow conditions in the flow field of in situ leaching mining and analyze related characteristics and regularities [10,11,12,13,14,15,16]. Tan et al. [17] researched the multi-process coupling and the movement of the reaction front during in situ leaching mining and formed relevant theories. Chen et al. [18] studied the leaching kinetics at a uranium deposit in Xinjiang, China, and simulated the flow characteristics of the flow field of in situ leaching mining. Simon et al. [19] established the coupled simulation of hydrodynamic transport rate and geochemical reactions in the in situ leaching of uranium and determined the factors of mineral precipitation that might affect the solution propagation of in situ leaching. Zuo et al. [20] discussed the migration of groundwater contamination in the aquifer at a decommissioned uranium mine and described the characteristics and laws of solution migration after in situ leaching mining. Wang et al. [21], Zhou et al. [22], Liu et al. [23], and Xie et al. [24] used the tracer technique to study the migration characteristics, solution migration range, and control mode of the fluid and related ions during the in situ leaching of uranium. Zhang et al. [16] first proposed the flow microbalance of pumping and injection units in the in situ leaching of uranium and analyzed all pumping and injection units at an in situ leaching mining area in Inner Mongolia.
The flow field of in situ leaching mining is an open flow field [25,26,27]. It exchanges with natural groundwater sustainably, which leads to natural groundwater flowing into the flow field of in situ leaching mining and fluid exchange with the solution in the flow field. The fluid exchange results in the decline of uranium concentration and the production efficiency of in situ leaching, which adversely affects natural groundwater. If the fluid exchange between the flow field of in situ leaching mining and natural groundwater could be quantitatively studied, the processes of in situ leaching uranium mining would be optimized to improve the production efficiency [28] and control the solution diffusion range effectively to avoid pollution accidents [29]. Therefore, it is significant to establish a method of calculating the quantity of natural groundwater flowing into the flow field of in situ leaching mining and measurably make a related analysis. It is not only of great significance in studying the control of the flow field of in situ leaching and improving the production capacity of uranium mines. It also provides enlightenment on the research of natural groundwater pollution treatment.
Nowadays, many researchers have conducted various studies on natural groundwater flowing into the flow field of in situ leaching mining. Wang et al. [25] studied the relationship between different well patterns and the amount of natural groundwater flowing into the flow field. They analyzed the difference in the influence of natural groundwater on the solution of the flow field between the narrow strip orebody and the square orebody. Zhou et al. [24] set different flow quantities for the pumping and injection wells of a single unit in an in situ leaching mining area, which gained the influence of the balanced relationship between the flow quantities of pumping and injection wells on the quantity of groundwater flowing into the mining area. Xie et al. [27,30] conducted numerical simulations on the hydrodynamic and dispersion characteristics of an in situ leaching mine in Inner Mongolia. They divided the periods of the in situ leaching flow field by the groundwater influence ratio of each pumping well. Xu et al. [31], Ji et al. [32], Cao et al. [33], Li et al. [34], and Zhang et al. [35] put forward a method for regulating the flow rate ratio of pumping and injection wells to control the solution outflow in the flow field of in situ leaching mining and carried out related calculations in different mining areas, respectively.
This paper aims to analyze the influence of natural groundwater on the flow field of in situ leaching uranium mining under complex mining conditions. A quantitative calculation and analysis method of natural groundwater flowing into in situ leaching mining areas based on previous studies was set up, and the “flow ratio of groundwater” and relevant equations were defined. Then, the method was utilized to calculate the corresponding values of C1 and C2 mining areas of an in situ leaching uranium mine in Inner Mongolia and the influence of the flow quantity of injection wells and the position and length of the filter in the pumping and injection wells on the “flow ratio of groundwater” were analyzed. The analysis can help us realize the purpose of reducing the fluid exchange between the flow field of in situ leaching uranium mining and natural groundwater.
2. Materials and Methods
Currently, the analysis of the fluid exchange between the flow field of in situ leaching mining and natural groundwater cannot evaluate the impact of natural groundwater on the production efficiency of the in situ leaching of uranium. Zhou et al. [26] obtained the direction of groundwater velocity by the numerical simulation of the flow field of in situ leaching mining, which was utilized to divide the flow balance blocks and boundaries. Then, they made a flow balance analysis to calculate the quantities of influent natural groundwater and outflow flow field of in situ leaching mining in every boundary. However, this method could only calculate the flow balance between the mean flow field with a single pumping and injection unit and natural groundwater, which could not reflect the effect of groundwater on the production efficiency of the pumping wells for the in situ leaching of uranium. Xu et al. [31], Ji et al. [32], Cao et al. [33], and Li et al. [34] obtained the area results of solute transport from the numerical simulation of the flow field of in situ leaching mining, which could be used to judge the flow quantity of the solution in the flow field of in situ leaching mining that merged into natural groundwater. This method could only qualitatively reflect the fluid exchange between the flow field of in situ leaching mining and natural groundwater. In comparison, the method proposed in this paper could be utilized to carry out quantitative multi-factor analysis on the heterogeneous deposit with multiple mining areas and evaluate the effect of groundwater on the production efficiency of the pumping wells for the in situ leaching of uranium quantitatively.
If injecting a neutral solution (whose concentration is C0) into all injection wells in a mining area at the same time, this may result in the concentration of the solution extracted from the pumping well not being equal to the injected, which is related to the fluid exchange between natural groundwater and the flow field of in situ leaching uranium mining. Thus, the fluid extracted from the pumping well can be regarded as two “solutions”: the neutral solution and natural groundwater. The quantity of natural groundwater flowing into the flow field of in situ leaching uranium mining can be obtained by the variation in the concentration of the solute in the fluid extracted from the pumping well.
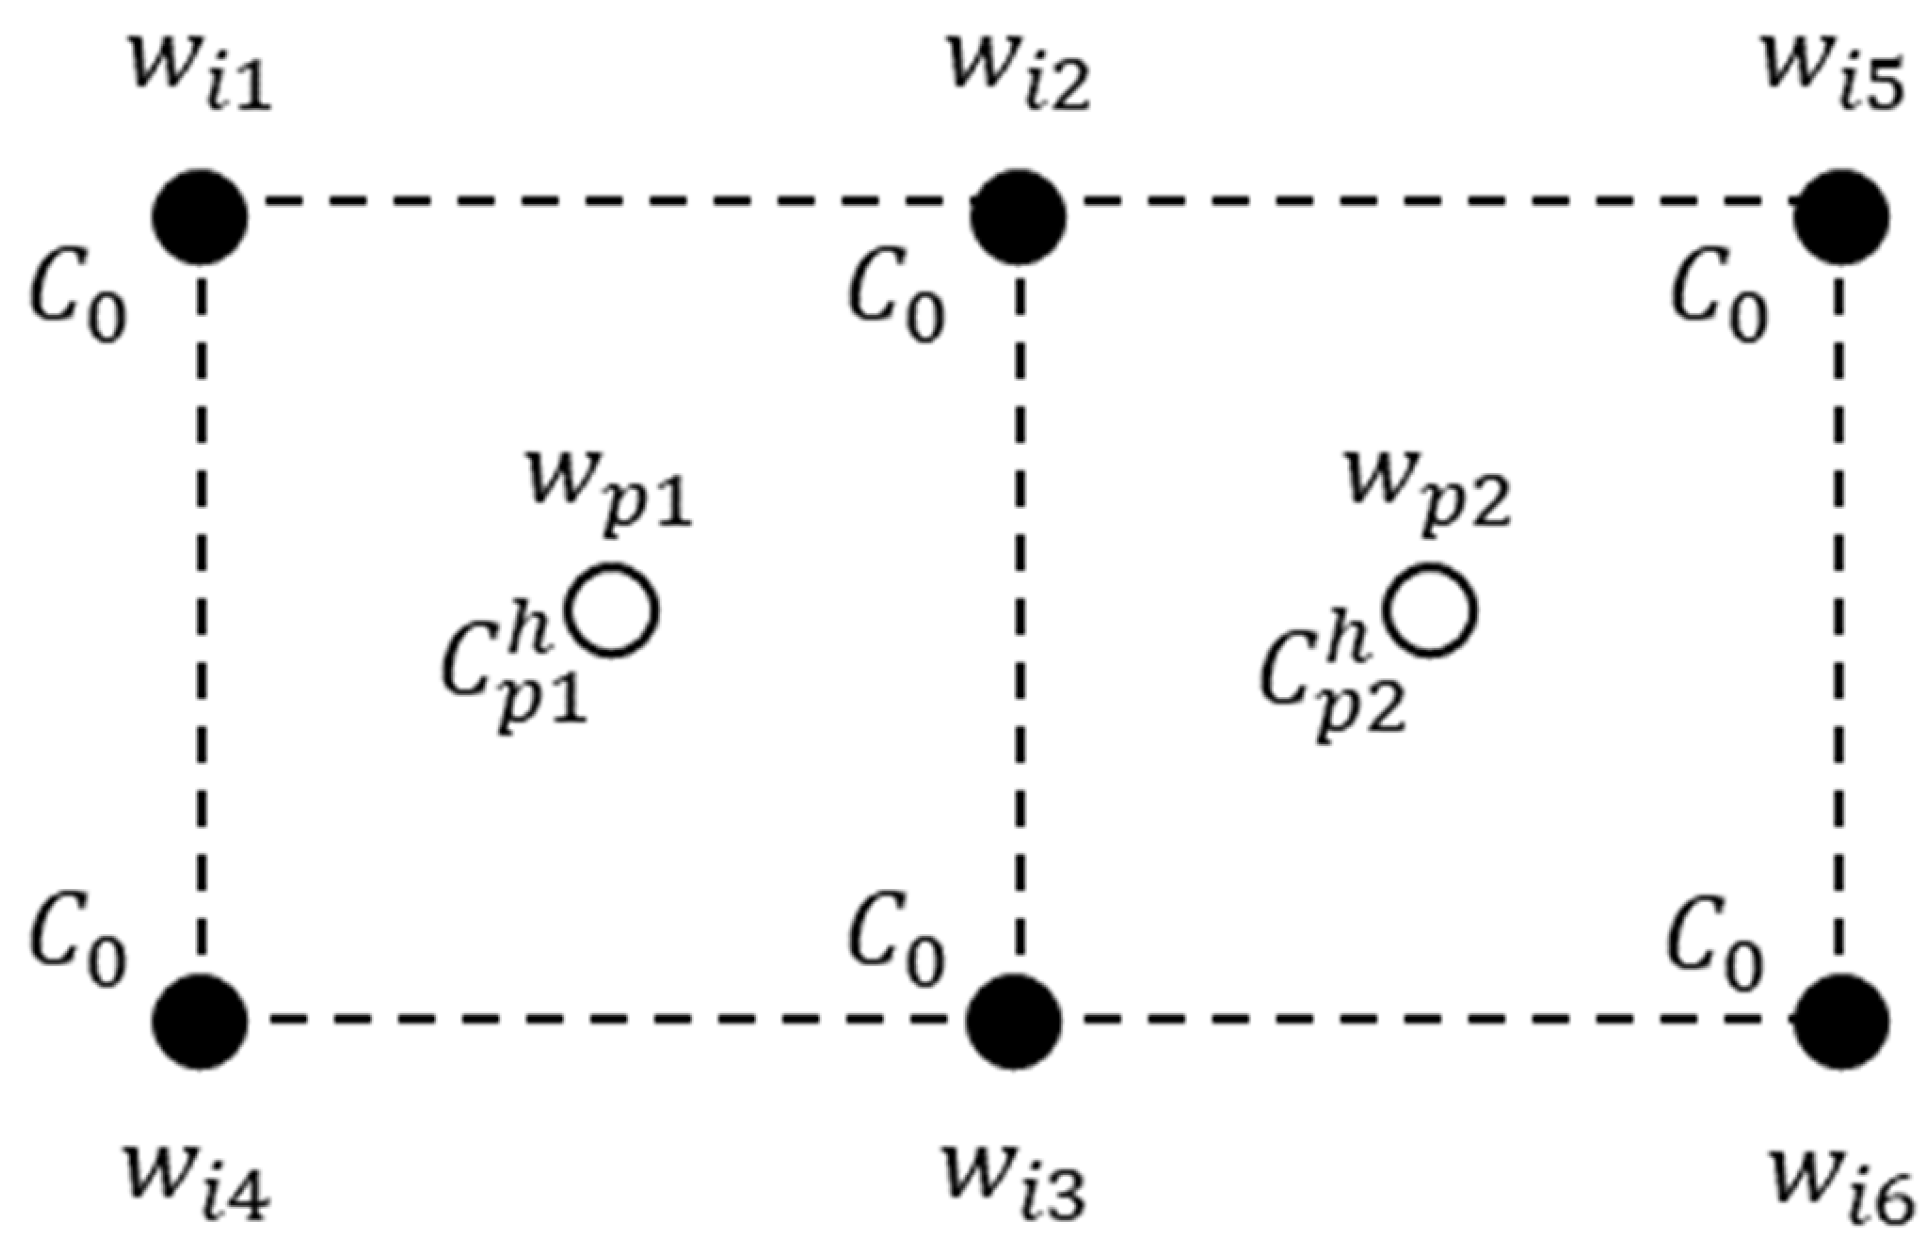
As shown in Figure 1, solution A (its concentration is C0) is injected into the injection well , , , and , which belong to the pumping-injection unit of the pumping well and . The concentration of solute A in the fluid extracted from the pumping well and is and at the moment, respectively. According to the change in the concentration between and , and between and C0, the quantity of groundwater entering the solution extracted from the pumping well and can be calculated.

Figure 1.
The schematic diagram of the calculation principle for the “flow ratio of groundwater” in two pumping-injection units.
For a mining area including j pumping wells and k injection wells, the indexes of the pumping and injection wells are and , respectively. If the solute A (its concentration is C0) is injected into different injection wells at the same time, and the total injection time is T, the total injection quality of the solute A in the mining area will be:
where is the flow quantity of the injection well in a time unit, , T is the total injection time of solute A, and C0 is the injected concentration of solute A.
The total injection time T is dispersed to h points of time, the flow quantity of the pumping well is at the moment, and the concentration of the solute A extracted by the pumping well at the moment is , so the quality of the solute A extracted by the pumping well in the total injection time T is:
where is the flow quantity of the pumping well in a time unit at the moment, the concentration of the solute A extracted by the pumping well at the moment is , .
Therefore, the total accumulative quality of the solute A extracted by all pumping wells of the whole mining area in the total injection time T is:
If is defined as “the flow quantity of non-groundwater” when the solute A extracted from all pumping wells in the whole mining area, the difference between “the flow quantity of non-groundwater” and the total flow quantity from all the pumping wells in the mining area is the quantity of natural groundwater flowing into the flow field of this mining area, which can be defined as:
where is the “flow ratio of groundwater” of this mining area, is the total flow quantity of the pumping well in the total injection time T, and is the total flow quantity from all pumping wells in the mining area in the total injection time T.
If set , and , Equation (4) can be simplified as:
If the “flow ratio of groundwater” for a single pumping well in the mining area is calculated, “the flow quantity of non-groundwater” of the pumping well in a time unit will be , and the “flow ratio of groundwater” of this pumping well in the total injection time T will be:
To sum up, it can be seen that when a neutral solution is injected into different injection wells in the mining area, the “flow ratio of groundwater” for a whole mining area or of a single pumping well at each time point can be calculated by the dispersion of the solute in the flow field. It can realize the accurate quantification of the influence of natural groundwater on the flow field of in situ leaching mining.
3. Case Study
3.1. The Background of the Study Area
The study area is in the Erlian Basin in middle and northern Inner Mongolia. According to the geological data of this area [36], the layers from the top to bottom are the Yierdingmanha group of Paleogene (E2y), the upper member of Saihan group (K1s2), and the lower member of Saihan group (K1s1) in Lower Cretaceous.
The targeted aquifer is one layer at the C1 and C2 mining areas of an in situ leaching uranium mine in the study area (Figure 2). The buried depth of the water table of this aquifer is 16.23–19.67 m, and its pressure head is 60.83–92.07 m. This aquifer is stratiform, with an average thickness of ~35.71 m. The distribution of the aquifer is continuous and stable. The water-isolated top of the aquifer is mainly composed of mudstone in the upper member of the Saihan group, and its thickness is ~10–50 m [36]. Moreover, the water-isolated bottom of the aquifer is compounded from the mudstone in the lower member of the Saihan group, and its depth of the top surface is ~80–150 m, with an average value of ~115.43 m [36]. The top and bottom of the targeted aquifer are continuous and have good water-isolated performance.
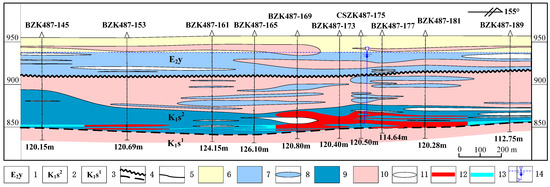
Figure 2.
The transversal hydrogeologic profile at an in situ leaching uranium mine in Inner Mongolia. Note: 1—Yierdingmanha group; 2—The upper member of Saihan group; 3—The lower member of Saihan group; 4—Angular/parallel unconformity boundary of the layers; 5—Lithological boundary; 6—The aquifer in Quaternary; 7—The aquifer in Yierdingmanha group; 8—Permeable lens; 9—The targeted aquifer; 10—The water-isolated layer; 11—Water-isolated lens; 12—The uranium ore body; 13—The uranium mineralization body; 14—The location of the pumping test and the water level of the pressure head of the targeted aquifer.
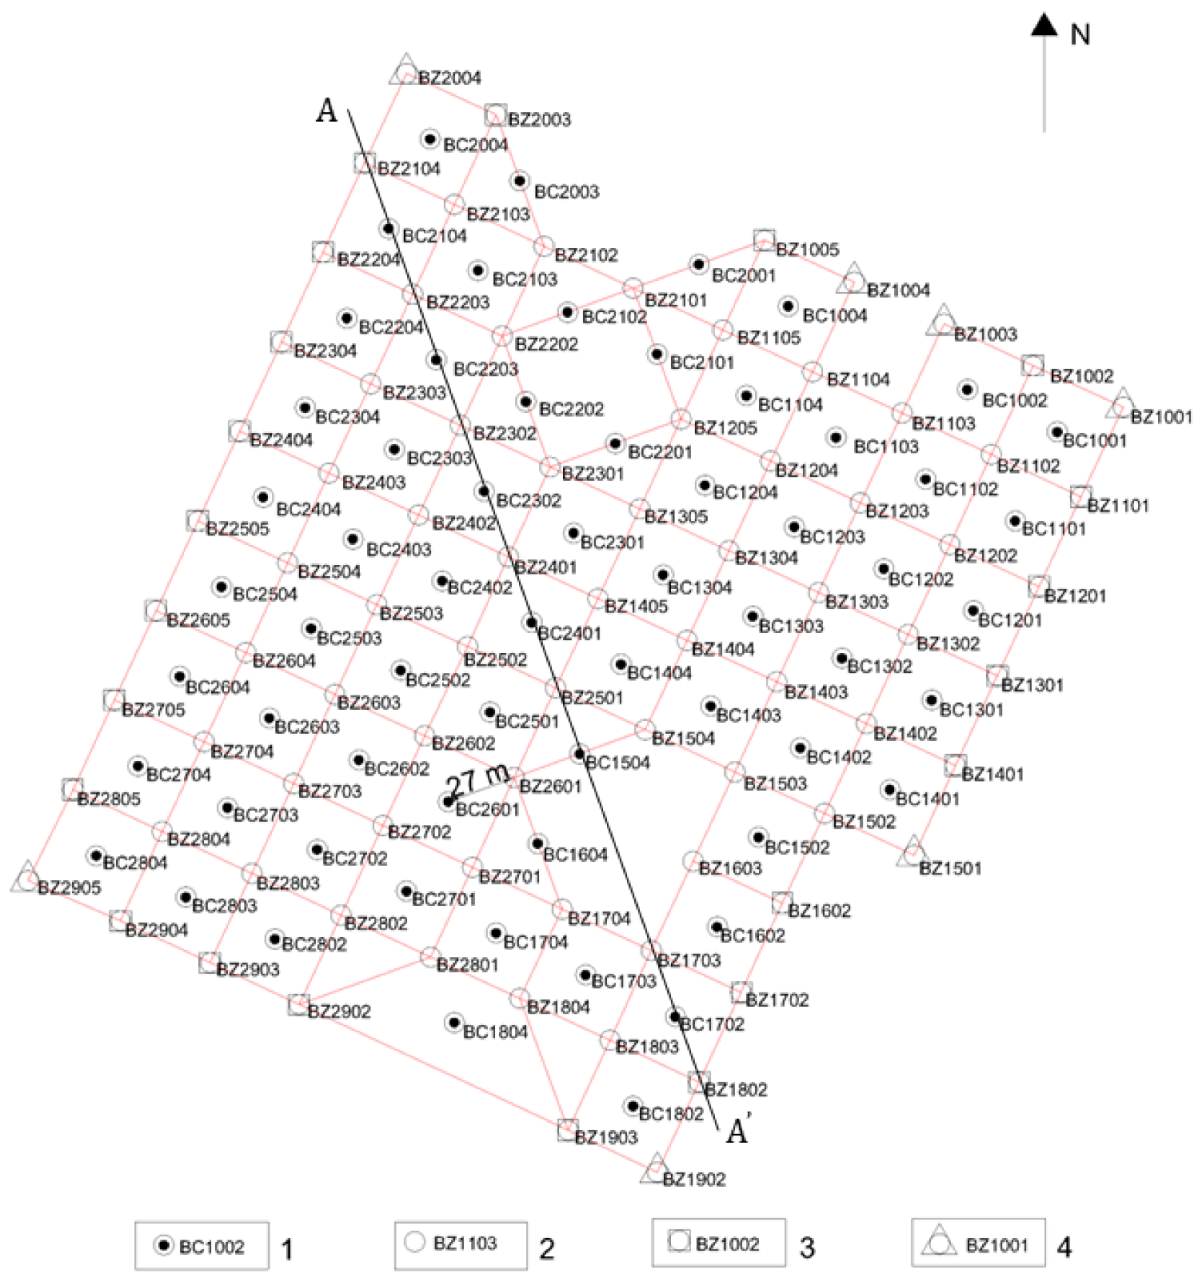
There are 62 pumping-injection units at the C1 and C2 mining areas with production in progress, and the pumping and injection wells are arranged in a five-point pattern. In total, there are 62 pumping wells and 80 injection wells. The spacing between the pumping and injection wells in a single unit is 27 m, and the area of the mining areas is about 98,000 m2 (Figure 3). The flow quantity of a single pumping well in the mining areas is stable at ~120 m3/day(m3/d), and the flow quantities of the pumping and injection wells in the mining areas are balanced, which is called “the pumping and injection balanced principle”.
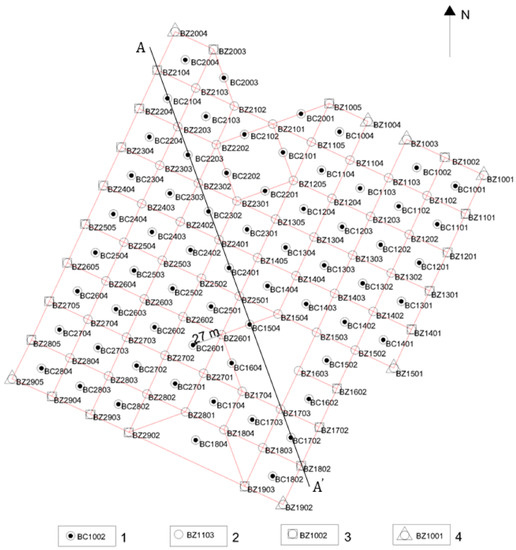
Figure 3.
Distribution of the pumping and injection wells at the C1 and C2 mining areas of an in situ leaching uranium mine in Inner Mongolia. Note: 1—Pumping wells; 2—Internal injection wells; 3—Edge injection wells; 4—Top corner injection wells.
3.2. Numerical Simulation of the Mining Areas
3.2.1. Model Generalizability
Aquifer System Generalizability
The targeted aquifer in the simulation was the aquifer in the upper member of the Saihan group (K1s2). Its water-isolated top and bottom were continuous and stable (Figure 2), which led to no hydraulic relationship between the targeted and other aquifers. In order to simplify the model, the flow field simulation could only aim at the targeted aquifer in the mining areas, ignoring other aquifers.
Boundary Condition Generalizability of Groundwater System
The top and bottom boundary of the model was water-isolated. The perimeter boundary of the model was the first boundary condition with known water levels.
Source and Sink Generalizability
The source and sink of the model were the production operation of the pumping and injection wells. The distribution of the pumping and injection wells was set in the model according to the actual situation. As stated earlier, the flow quantity of a single pumping well in the mining areas is stable at ~120 m3/d, and the flow quantity of an injection well should follow “the pumping and injection balanced principle”. Setting different flow quantities in the same injection well under “the pumping and injection balanced principle” might result in different fluid exchanges between the flow field of in situ leaching mining and natural groundwater. Thus, the influence of the flow quantity of an injection well on the fluid exchange between the flow field of in situ leaching mining and natural groundwater under the same total injected quantity could be studied by setting different flow quantities in the same injection well. According to the distribution of the injection wells, they could be divided into internal injection wells, edge injection wells, and top-corner injection wells. As shown in Figure 3, the internal injection well BZ2203 was related to the pumping wells BC2104, BC2103, BC2204, and BC2203 directly, the edge injection well BZ2104 was related to the pumping wells BC2004 and BC2104 directly, and the top corner injection well BZ2004 was related to the pumping well BC2004 directly. According to the corresponding relationship between the injection well, and the number of its adjacent pumping wells, different flow quantities for different injection wells with different locations could be set.
Solute Generalizability
For each injection well in the mining area, the neutral solute injected point was taken. The injected concentration was 10,000 mg/L, whose background concentration value in natural groundwater was 0 mg/L. The total injection and simulation time was 1370 days. The neutral solute was set to have similar physical and chemical properties to carbinol. Its density was close to the water, and it could easily dissolve in water. This solute was not involved in any chemical reactions, and its adsorption constant was zero. In the simulation of solute dispersion, only mechanical dispersion and the concentration diffusion of the fluid could be considered because the neutral solute did not join in the liquid-solid reaction and adsorption dissolution.
3.2.2. Solution and Identification of the Numerical Simulation
Hydrodynamic Flow and Solute Transport Equation
The hydrogeological conceptual model generalized by the above conditions was calculated by the three-dimensional mathematical model of saturated flow to show its conditions for groundwater flow and solute transport. The governing equations and definite conditions were utilized to express the three-dimensional mathematical model.
The definite conditions usually include initial and boundary conditions [37,38].
The governing hydrodynamic equation is:
The initial condition is:
The boundary condition is:
The top and bottom are:
The perimeter is:
where H is waterhead and the unit is m; n is the normal direction pointing the outside of the boundary; t is time, the unit is the day (d); K is the tensor of permeability coefficient; q is the source and sink; µs is storage coefficient; v is the fluid velocity, and the unit is m/day(m/d).
The solute transport equation is:
The initial condition is:
The boundary condition is:
The perimeter is:
where C is the concentration of the solute, and the unit is mg/L; Cs is the concentration of the solute in sources and sinks, and the unit is mg/L; qs is the flow quantity of sources and sinks, and the unit is m3/d; θ is porosity; t is time, the unit is d; qx, qy and qz are the flow quantities in x, y, and z directions, respectively, and the unit is m3/d.
Identification of the Model
The common stochastic geological modeling method can be divided into stochastic modeling based on conditional simulation and unconditional simulation through how to utilize the conditional dataset [39,40]. Furthermore, the method used in this paper to construct a heterogeneous lithologic model was a geostatistical program called T-PROG, which is based on the Markov chain. This method could reflect geological asymmetry and anisotropy and build the spatial structure of the aquifer more in accordance with reality [41,42].
The groundwater modeling system (GMS) software is utilized to make the simulation. The whole flow field was composed of the lithologic model, groundwater flow model, and solute movement model after the assignment of hydrogeological parameters for the C1 and C2 mining areas. The T-PROG, MODFLOW, MODPATH, and MT3D modules were used for the construction [43].
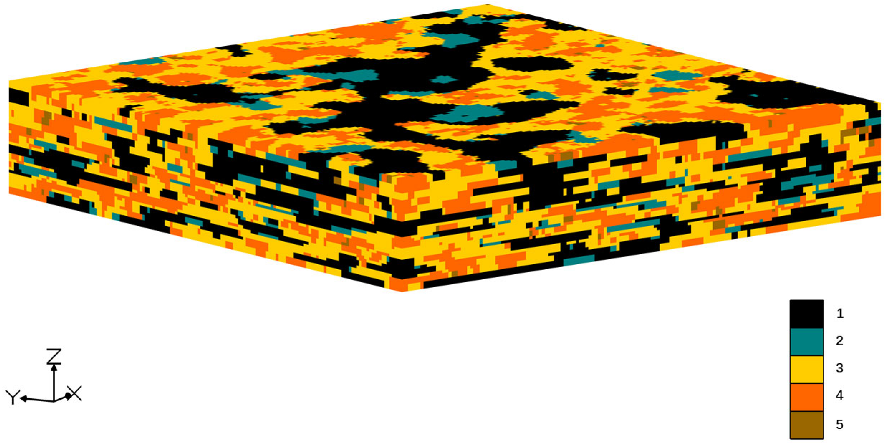
First, the dataset of 144 boreholes in the mining areas was sorted out and imported into the software. Then, the heterogeneous lithologic model of the targeted aquifer (including the water-isolated top and bottom) in the mining areas was established, with a thickness of ~50–110 m (Figure 4). Then, the top and bottom were taken as the upper and lower boundaries of the model, and the elevation of the top and bottom was ~910–830 m. The T-PROG module was used to assign and interpolate the hydrogeological parameters of the five kinds of lithology (mudstone, silty mudstone, fine sandstone, medium sandstone, and coarse sandstone) in the targeted aquifer. The distribution of heterogeneous hydrogeological parameters in the aquifer was obtained, which could be used to simulate the targeted aquifer in the mining areas.
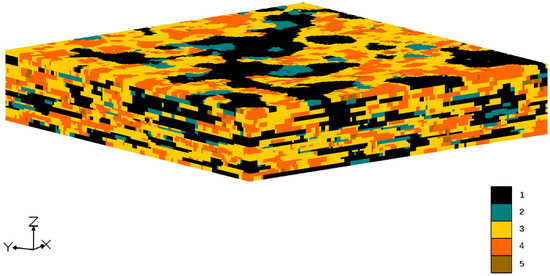
Figure 4.
Simulated results of heterogeneous lithological distribution in the study area. Note: 1—Mudstone; 2—Silty mudstone; 3—Fine sandstone; 4—Medium sandstone; 5—Coarse sandstone.
3.3. Analysis of the “Flow Ratio of Groundwater” in the Mining Areas
According to the previous generalizations regarding geology, hydrogeology, and manufacturing processes, the water levels and solute transport in the mining areas under different production plans were calculated (Figure 5). The concentration of the solute A extracted by each pumping well at different time points () could be obtained from the numerical simulation of the mining areas. Then, the varieties of the “flow ratio of groundwater” in the mining areas or a single pumping well at different production stages could be obtained to make a quantitative multi-factor analysis on the fluid exchange between the flow field of in situ leaching uranium mining and natural groundwater.
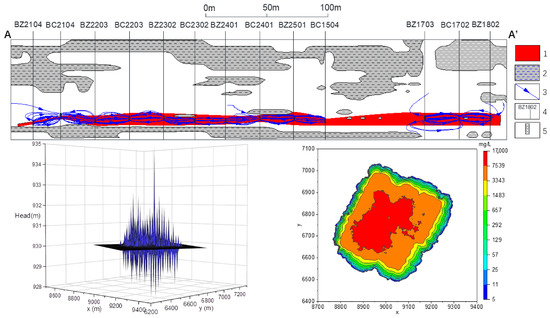
Figure 5.
Simulated results of the flow field of in situ leaching uranium mining (Plan A). Note: The above–the profile (A–A′) of the flow field, and the location of the profile is shown in Figure 3 (1—The uranium ore body; 2—Mudstone; 3—Streamline and its direction; 4—Pumping and injection wells; 5—Filter); lower left—water level contour map of the mining areas; lower right—solute transport diagram of the mining areas.
3.3.1. The Flow Quantity of Injection Wells
As previously mentioned, if different flow quantities are set in the same injection well, the fluid exchange between the flow field of in situ leaching mining and natural groundwater will be different. The flow quantity of all pumping wells in plans A and B was 120 m3/d. Their locations set the flow quantity of the injection wells: in plan A, the flow quantity of top corner injection wells was 30 m3/d, the flow quantity of edge injection wells was 60 m3/d, and the flow quantity of internal injection wells was 120 m3/d (the positions for those injection wells as displayed in Figure 3). The flow quantity for all the injection wells in plan B was 90 m3/d.
The filters’ position in two plans in the middle of the uranium ore bed was set, and the length of the filters was 6 m. The flow quantity of all pumping wells was set to be the same in this case, so the difference between “the flow quantity of non-groundwater” corresponding to the average concentration of all pumping wells at each time point and the flow quantity of a single pumping well could be calculated. The proportion of the difference in the flow quantity of a single pumping well can be used to obtain the “flow ratio of groundwater” of the flow field in the whole C1 and C2 mining areas at each time point.
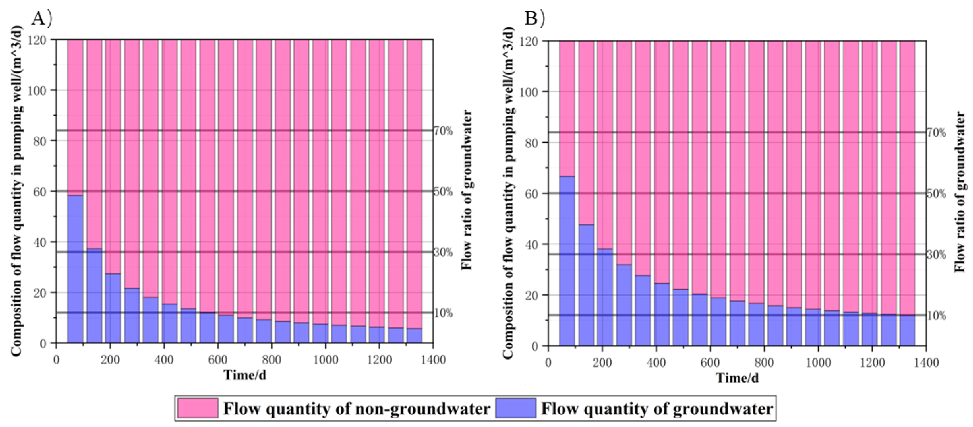
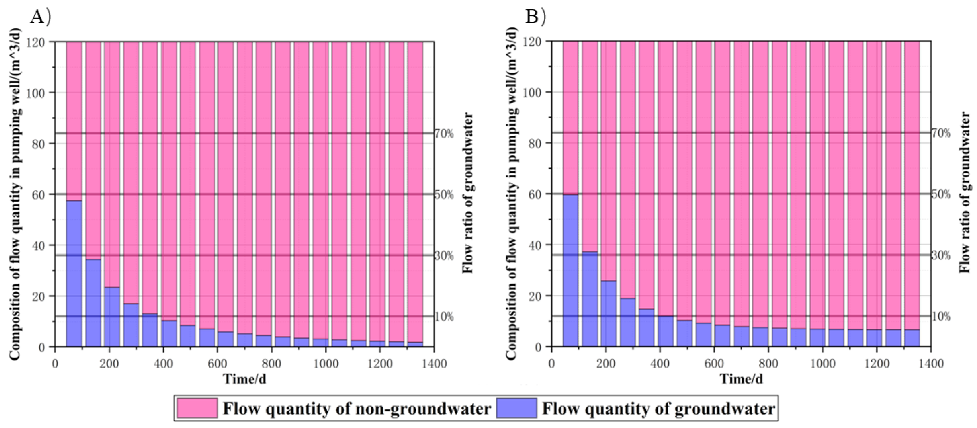
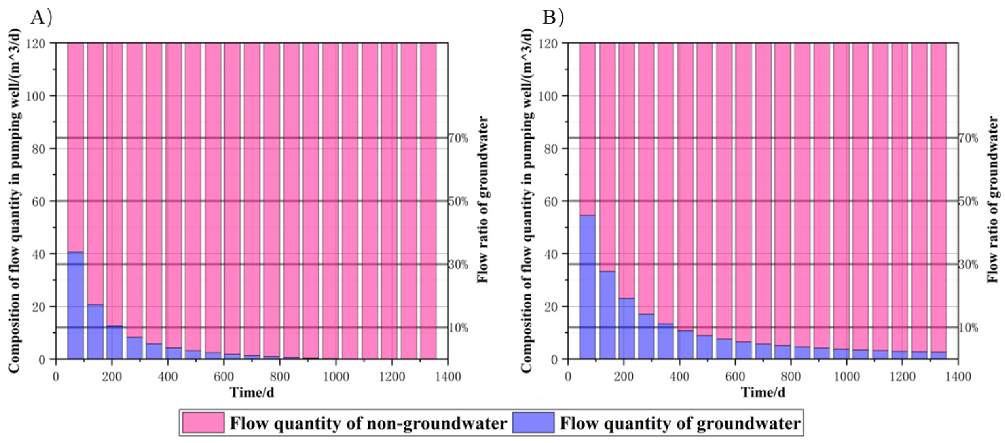
Figure 6 and Table 1 reveal that the “flow rate of groundwater” for plan A with “small flow injection at the periphery of the well-site” is always lower than that of plan B with the same flow quantity for all injection wells. When the “flow ratio of groundwater” in plan A reaches 70%, 50%, 30%, and 10%, respectively, the arrival time is about the 29th, 66th, 147th, and 561st day of the simulation. In contrast, the “flow ratio of groundwater” for plan B reaches the same values. The arrival time is about the 37th, 89th, 230th, and 1318th day of the simulation, which shows that plan A can control the inflow of natural groundwater faster, so plan A can reduce the impact of the solution in the flow field at the mining area on natural groundwater faster. This is consistent with the viewpoint of Zhang et al. [35], who proposed that “small flow injection at the periphery of the well-site” can effectively control the leaching range of the flow field in in situ leaching mining. This results from the fact that the pumping or injection capacity of each borehole is different when the strata in the study area are heterogeneous; the drilling technology is different. On the premise of “the pumping and injection balanced principle” in the mining areas, different flow quantities are adopted for the injection wells. Even if the total injected quantity in the mining areas remains unchanged, the fluid exchange between the flow field of in situ leaching mining and natural groundwater is different [16]. Figure 7, Figure 8 and Figure 9 further confirm that the peripheral pumping well (Figure 7), the internal pumping well (Figure 8), and the pumping well with only three injection wells (Figure 9) in plan A with “small flow injection at the periphery of the well-site” also have smaller “flow ratio of groundwater”.
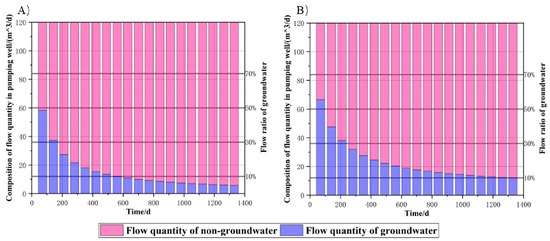
Figure 6.
The bar graph of the composition of flow quantity in pumping wells at the whole C1 and C2 mining areas with the change in time (based on the average concentration from all pumping wells). Note: (A)—Plan A; (B)—Plan B.

Table 1.
Comparison of the day for plan A and plan B to reach the corresponding “flow ratio of groundwater”.
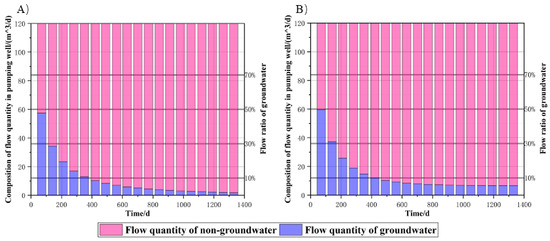
Figure 7.
The bar graph of the composition of flow quantity in pumping well BC2204 with the change in time. Note: (A)—Plan A; (B)—Plan B.
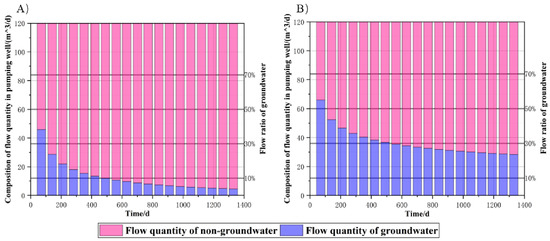
Figure 8.
The bar graph of composition of flow quantity in pumping well BC2401 with the change in time. Note: (A)—Plan A; (B)—Plan B.
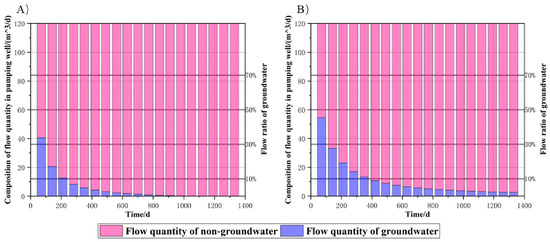
Figure 9.
The bar graph of composition of flow quantity in pumping well BC1604 with the change in time. Note: (A)—Plan A; (B)—Plan B.
3.3.2. The Position of the Filter
To discuss the impact of the filter’s position, the filter in plan A was set in the middle of the uranium ore bed. The filter in plan C was staggered with the uranium ore bed (the bottom of the filter in the pumping wells was 2 m lower than the bottom of the ore bed, and the top of the filter in injection wells was 2 m higher than the top of the ore bed). The flow quantity of all pumping wells in the two plans was 120 m3/d, the length of all filters was 6m, and the flow quantity of injection wells was set similarly to plan A in Section 3.3.1.
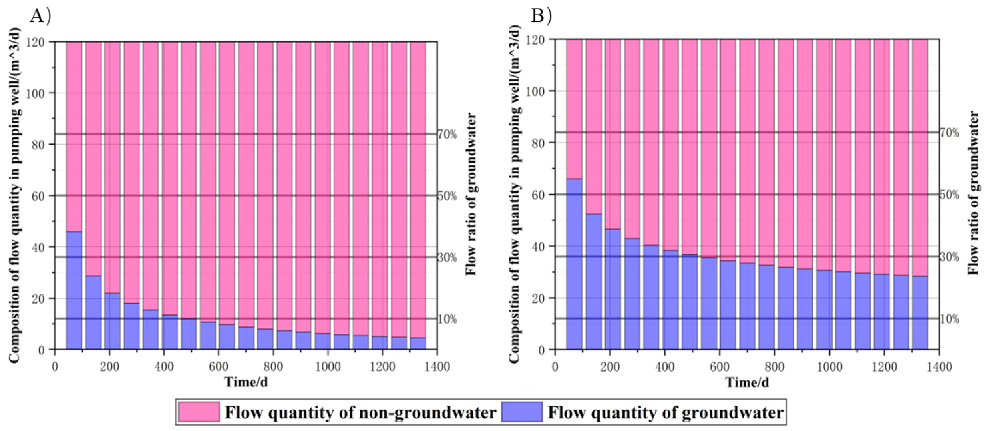
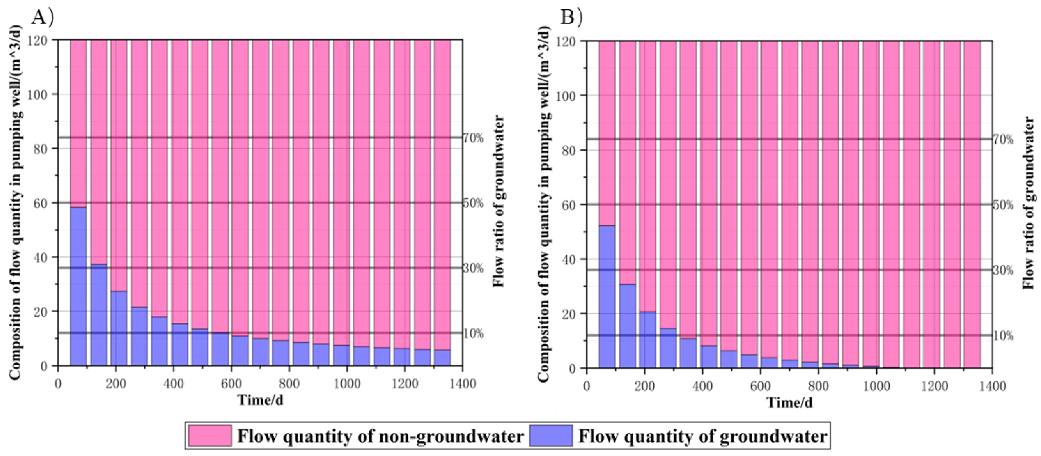
Figure 10 and Table 2 present that the “flow ratio of groundwater” of plan C is always lower than that of plan A. Moreover, the time to reach 70%, 30%, 50%, and 10% in plan C is always earlier than in plan A. It shows that when the filter is staggered with the ore bed, the inflow of natural groundwater can be reduced more effectively, and the fluid exchange between the solution in the flow field and natural groundwater can be reduced.
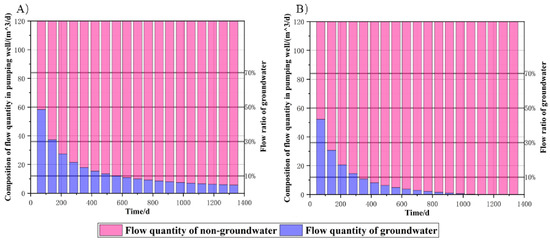
Figure 10.
The bar graph of the composition of flow quantity in the pumping well at the whole C1 and C2 mining areas with the change in time (based on the average concentration from all pumping wells). Note: (A)—Plan A; (B)—Plan C.
Table 2.
Comparison of the day for plan A and plan C to reach the corresponding “flow ratio of groundwater”.
This is mainly because when the solution flows from the injection well to the pumping well, its flow velocity decreases and then increases. Therefore, the flow velocity of the solution in the middle area between the pumping and injection well is very slow, and some of the solutions descend by gravity. Therefore, the position of the filter in the pumping well is deeper than that in the injection well and is staggered with the ore bed, which causes more falling solutions to gather around the pumping well and reduces the impact on the natural groundwater.
3.3.3. The Length of the Filter
To understand the influence of the length of the filter on the “flow ratio of groundwater”, the length of filters in plans D and E were set as 6 m and 4 m, respectively. Furthermore, all filters were set at the same elevation of 844 m. All wells had the same flow quantity as plan A in Section 3.3.1.
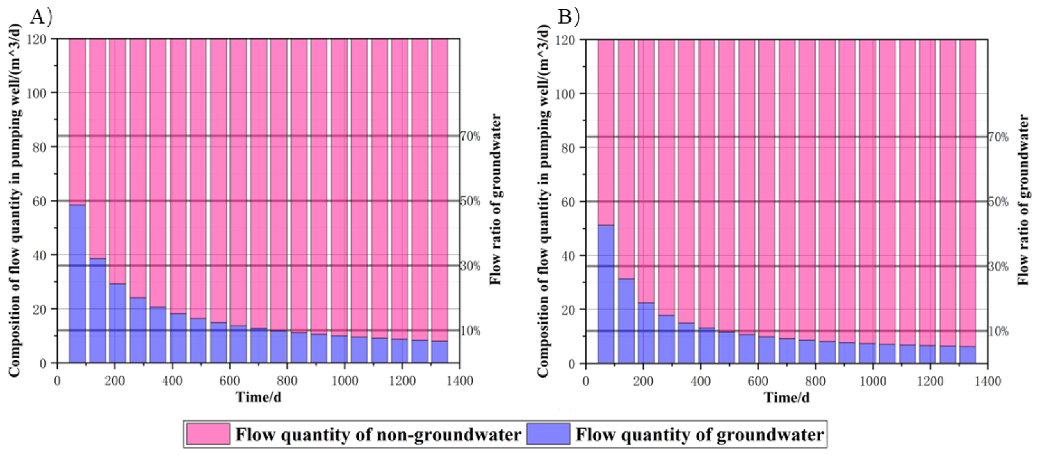
Figure 11 and Table 3 indicate that the time difference between plan D and plan E when the “flow ratio of groundwater” reaches 70%, 50%, 30%, and 10% is about 5, 13, 38, and 289 days, which indicates that the time difference between the two plans when the “flow ratio of groundwater” reaches the same values (such as 70%, 50%, 30%, and 10%) will increase with the decrease in the values of the flow ratio.
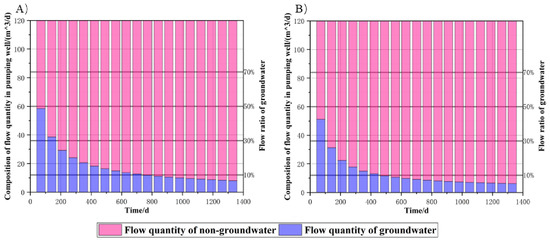
Figure 11.
The bar graph of the composition of flow quantity in the pumping well at the whole C1 and C2 mining areas with the change in time (based on the average concentration from all pumping wells). Note: (A)—Plan D; (B)—Plan E.
Table 3.
Comparison of the day for plan D and plan E to reach the corresponding “flow ratio of groundwater”.
The length difference between 6 m and 4 m is a little slight. When the flow quantity of the groundwater flowing into the flow field is large, there is no apparent difference in the arrival time of the two plans. However, as the flow quantity of the groundwater flowing into the flow field decreases, the difference in arrival time between the two plans gradually increases.
4. Conclusions
In this paper, computational and analytical methods were built to calculate the flow quantity of groundwater flowing into the flow field of in situ leaching uranium mines quantitatively and defined the “flow ratio of groundwater” and related formulas. Then, the calculation of an in situ leaching uranium mine in Inner Mongolia was taken as an example, and the position, length of the filter, and the mode of fluid injection at the C1 and C2 mining areas of this in situ leaching mine were regulated, and the following conclusions have been drawn:
(1) In this paper, a method was proposed to evaluate the effect of natural groundwater on the production efficiency of the pumping wells for the in situ leaching of uranium quantitively. The concentration of the neutral solute extracted by each pumping well at different time points could be obtained from the mining areas’ numerical simulation. Then, the results of the simulation were able to obtain the varieties of the “flow ratio of groundwater” in the mining areas or a single pumping well at different production stages.
(2) The plan with a “small flow injection at the periphery of the well-site” can control the fluid exchange between the solution in the flow field and natural groundwater faster and realize less groundwater inflow faster.
(3) The plan of having the filters staggered with the ore bed is beneficial to gather more solutions in the flow field around the pumping well and reduce groundwater inflow effectively.
(4) When the flow quantity of the groundwater flowing into the flow field is large, there is no noticeable difference in the arrival time between the plans, with the length of filters between 6 m and 4 m. With the decrease in the inflow of natural groundwater, the difference in the arrival time between those plans gradually increases.
Author Contributions
Conceptualization, Q.L., T.X. and C.Z.; methodology, Q.L., T.X. and Y.T.; software, T.X., Y.D. and N.G.; validation, Z.L.; formal analysis, Y.T.; investigation, Z.L.; writing—review and editing, Q.L., T.X. and C.Z. All authors have read and agreed to the published version of the manuscript.
Funding
This research was funded by the National Natural Science Foundation of CNNC Joint Fund number U2067204, Young-Talent Project of CNNC (The Research on Intelligent Monitoring Technology of Optical Fiber for Critical Hydraulic Parameters of In situ Uranium Leaching), and Young-Talent Project of CNNC (The Research about Intelligent Extraction of Multisource Information in Mining Area based on In situ Leaching Borehole Data).
Data Availability Statement
Data are contained within the article.
Conflicts of Interest
The authors declare no conflict of interest.
References
- Zhu, Z.Q.; Luo, X.F.; Wang, X.W. In-Situ Leaching of Uranium Handbook; The Sixth Research Institute of Nuclear Industry: Hunan, China, 2000. [Google Scholar]
- Que, W.M.; Tan, Y.H.; Zeng, Y.J.; Wang, S.D. Geochemical Kinetics and Mass Transport of In-Situ Uranium Leaching; Atomic Energy Press: Beijing, China, 2002. [Google Scholar]
- Ding, J.H.; Zhou, D.L.; Ma, S.Z. The State-of-Art Trends of Development of Groundwater Modeling Software Abroad. Site Investig. Sci. Technol. 2002, 1, 37–42. [Google Scholar]
- Guo, X.D.; Tian, H.; Zhang, M.G.; Zhu, W.; Cui, J. Visual MODFLOW; GMS; FEFLOW Application Development of Groundwater Value Simulation Software in Our Country. Ground Water 2010, 32, 5–7. [Google Scholar]
- Mategaonkar, M.; Eldho, T.I. Simulation of groundwater flow in unconfined aquifer using meshfree point collocation method. Eng. Anal. Bound. Elem. 2011, 35, 700–707. [Google Scholar]
- Li, F.; Li, J.K.; Ma, Y.; Li, H.E.; Ji, G.Q.; Yuan, M. The research and application progress of numerical simulation on groundwater. J. Water Resour. Water Eng. 2018, 29, 99–104. [Google Scholar]
- Wang, S.; He, S.L.; Yuan, H.Y.; Ji, D.L.; Qi, Z.B. Research progress of groundwater simulation in mining area based on GMS application. Ground Water 2022, 44, 14–17. [Google Scholar]
- Lu, H.; Peng, H.; Xu, Z.D.; Matthews, J.C.; Wang, N.; Iseley, T. A feature selection–based intelligent framework for predicting maximum depth of corroded pipeline defects. J. Perform. Constr. Facil. 2022, 36, 04022044. [Google Scholar] [CrossRef]
- Qin, G.; Xia, A.; Lu, H.; Wang, Y.; Li, R.; Wang, C. A hybrid machine learning model for predicting crater width formed by explosions of natural gas pipelines. J. Loss Prev. Process Ind. 2023, 82, 104994. [Google Scholar] [CrossRef]
- Yabusaki, S.B.; Fang, Y.L.; Waichler, S.R. Building conceptual models of field-scale uranium reactive transport in a dynamic vadose zone-aquifer-river system. Water Resour. Res. 2008, 44, 853–863. [Google Scholar] [CrossRef]
- Li, G.J.; Wang, H.F.; Zhang, Y.; Zhang, B.; Xiao, Z.X. Application of Visual MODFLOW numerical simulation of groundwater to in-situ leaching of uranium. Uranium Min. Metall. 2011, 30, 1–5. [Google Scholar]
- Cao, F.B.; Lian, G.X. Simulation for radical transportation of sulfate during in-situ leaching uranium in a sandstone-type uranium deposit. In Progress Report on China Nuclear Science & Technology (Vol.4); Atomic Energy Press: Beijing, China, 2015; pp. 275–279. [Google Scholar]
- Regnault, O.; Lagneau, V.; Fiet, N. 3D Reactive Transport Simulations of Uranium in situ Leaching: Forecast and Process Optimization; Merkel, B.J., Arab, A., Eds.; Uranium Past and Future Challenges; Springer International Publishing: Cham, Switzerland, 2015; pp. 725–730. [Google Scholar]
- Chen, X.X. Numerical Simulation of In-Situ Leaching of Uranium by Acid Method Based on Reactive Solute Transport Theory. Ph.D. Thesis, East China University of Technology, Jiangxi, China, 2020. [Google Scholar]
- Zhang, T.; Yuan, L.; Yang, K.; Liu, Y.; Yu, X. Modeling of Multiphysical–Chemical Coupling for Coordinated Mining of Coal and Uranium in a Complex Hydrogeological Environment. Nat. Resour. Res. 2021, 30, 571–589. [Google Scholar] [CrossRef]
- Zhang, C.; Tan, K.X.; Xie, T.T.; Tan, Y.; Fu, L.; Gan, N.; Kong, L. Flow Microbalance Simulation of Pumping and Injection Unit in In Situ Leaching Uranium Mining Area. Processes 2021, 9, 1288. [Google Scholar] [CrossRef]
- Tan, K.X.; Wang, Q.L.; Hu, E.M.; Hu, K.G.; Zhou, Q. Multiple Processes Coupling and Reaction Front Propagation During In-Situ Leach Mining: 1. Theoretical Analyses. Uranium Min. Metall. 2005, 24, 14–18. [Google Scholar]
- Chen, L.; Tan, K.X.; Liu, J.; Xie, Y.S.; Huang, W.; Ma, Q. Characteristics of Leaching Kinetics of a Sandstone Uranium Deposit in Yili Basin. Met. Mine 2013, 3, 18–20. [Google Scholar]
- Simon, R.B.; Thiry, M.; Schmitt, J.M.; Lagneau, V.; Langlais, V.; Bélières, M. Kinetic reactive transport modelling of column tests for uranium In Situ Recovery (ISR) mining. Appl. Geochem. 2014, 51, 116–129. [Google Scholar] [CrossRef]
- Zuo, W.; Tan, K.X. The Characteristics of Groundwater Contamination of a Decommissioned Wellfield in Some in Situ Leaching Uranium Mine, Xinjiang, China. J. Univ. S. China 2014, 28, 28–34. [Google Scholar]
- Wang, X.D.; Wu, L.W.; Duan, B.S.; Xie, T.T.; Yang, L.Z.; Du, Z.M. Interwell tracer test in in-situ leaching uranium in one place of Xinjiang. Uranium Min. Metall. 2014, 33, 130–133. [Google Scholar]
- Zhou, Y.P.; Shen, Z.L.; Sun, Z.X.; Liu, J.H.; He, J.T. Application study on particle tracer technique to calculate the in-situ leaching area of uranium mining. China Min. Mag. 2015, 24, 117–120. [Google Scholar]
- Liu, Z.B.; Wang, H.F.; Wen, Z.Q.; Ding, Y.; Jiang, Y.; Xie, T.T.; Xu, G.L.; Wang, G. Study on the Characteristics of Solution Migration and Drawing and Injection Control at Well Field In-Situ Leaching Uranium. Uranium Min. Metall. 2017, 36, 23–26. [Google Scholar]
- Xie, T.T.; Ding, Y.; Zhou, G.M.; Xu, G.L.; Li, H.X.; Deng, J.X.; Zhang, C.; Xu, Z.H. Numerical Simulation Analysis of Homologous Tracing Data Before and After Acidification in the Conditional Experiment of an In-situ Leaching Uranium Mine. Uranium Min. Metall. 2018, 37, 1–8. [Google Scholar]
- Wang, H.F.; Guo, N.; Xie, T.T.; Li, G.J. The influence of groundwater dilution on pregnant solution of in-situ leaching of uranium. Uranium Min. Metall. 2012, 31, 9–13. [Google Scholar]
- Zhou, Y.P.; Shen, Z.L.; Sun, Z.X.; He, J.T.; Xing, Y.G. Study on the influence of pumping-injection equilibrium on outflow of leaching solution and inflow of groundwater during in-situ leaching of uranium. Nonferrous Met. 2013, 65, 1–4. [Google Scholar]
- Xie, T.T.; Yao, Y.X.; Gan, N.; Zhang, C.; Xu, G.L.; Wen, Z.Q. Analysis and application of seepage-dispersion field characteristics in-situ leaching uranium (to be continued). Uranium Min. Metall. 2016, 35, 149–158. [Google Scholar]
- Panfilov, M.; Uralbekov, B.; Burkitbayev, M. Reactive transport in the underground leaching of uranium: Asymptotic analytical solution for multi-reaction model. Hydrometallurgy 2016, 160, 60–72. [Google Scholar] [CrossRef]
- Greskowiak, J.; Prommer, H.; Liu, C.; Post, V.E.A.; Ma, R.; Zheng, C.; Zachara, J.M. Comparison of parameter sensitivities between a laboratory and field scale model of uranium transport in a dual domain, distributed rate reactive system. Water Resour. Res. 2010, 46, 4921–4933. [Google Scholar] [CrossRef]
- Xie, T.T.; Yao, Y.X.; Gan, N.; Zhang, C.; Xu, G.L.; Wen, Z.Q.; Peng, Y. Analysis and application of seepage-dispersion field characteristics in-situ leaching uranium (Complete). Uranium Min. Metall. 2016, 35, 229–239. [Google Scholar]
- Xu, Q. Study on Influence of the Ratio of Drawing-injection to In-situ Leaching Solution Diffusion Range. Uranium Min. Metall. 2017, 36, 93–97. [Google Scholar]
- Ji, H.B.; Huang, Q.Y.; Zhou, Y.P.; Zhang, Q.L. Influence of In-situ Leaching Solution Diffusion with Drawing Injection flux Distribution and Drawing Injection proportion. Uranium Min. Metall. 2017, 36, 172–181. [Google Scholar]
- Cao, Y.X.; Zuo, W.; Bao, Z.X.; Gu, P.; Ye, T. Practice and Exploring of Different Proportional Control of Drawing and Injection of Leaching Solution for the In-Situ Leaching Uranium and Its Impact on the Groundwater Environment. Uranium Min. Metall. 2017, 36, 134–143. [Google Scholar]
- Li, D.; Duan, B.S. Microscopic Equilibrium Optimization of Leaching Range in In-Situ Leaching Mining Field. Uranium Min. Metall. 2017, 36, 41–45. [Google Scholar]
- Zhang, C.; Xie, T.T.; Tan, K.X.; Yao, Y.X.; Wang, Y.A.; Li, C.G.; Li, Y.M.; Zhang, Y.; Wang, H. Hydrodynamic Simulation of the Influence of Injection Flowrate Regulation on In-Situ Leaching Range. Minerals 2022, 12, 787. [Google Scholar] [CrossRef]
- Huang, Q.F. Uranium Metallogenic Characteristics and Prospecting Direction in the BARUN Area, The Left County Sunite, Inner Mongolia; Jilin University: Jilin, China, 2018. [Google Scholar]
- Chen, C.X.; Tang, Z.H. The Numerical Methods of Ground Water Flow; China University of Geosciences Press: Hubei, China, 2009. [Google Scholar]
- Zheng, C.M.; Bennett, D.G. Applied Contaminant Transport Modeling, Second Edition; Wiley Interscience: Hoboken, NJ, USA, 2002. [Google Scholar]
- Wang, Y.H.; Xia, A.L.; Qin, G.J. Probabilistic modeling for reliability analysis of buried pipelines subjected to spatiotemporal earthquakes. Probabilistic Eng. Mech. 2022, 69, 103315. [Google Scholar] [CrossRef]
- Wang, Y.H.; Xia, A.L.; Zhang, P.; Qin, G.J. Probabilistic physical modeling of randomly corroded surface and its use in reliability analysis of corroded pipelines under spatiotemporal vibration. Ocean Eng. 2022, 262, 112219. [Google Scholar] [CrossRef]
- Dell, A.D.; Bersezio, R.; Felletti, F.; Giudici, M.; Comunian, A.; Renard, P. Comparison of three geostatistical methods for hydrofacies simulation: A test on alluvial sediments. Hydrogeol. J. 2012, 20, 299–311. [Google Scholar]
- Sun, Q. Improvement and Application of Groundwater Flow Stochastic Simulation Method based on T-PROGS; China University of Geosciences (Beijing): Beijing, China, 2019. [Google Scholar]
- He, Z. Numerical Simulation of Uranium Mine Based on GMS; University of South China: Hunan, China, 2016. [Google Scholar]


Disclaimer/Publisher’s Note: The statements, opinions and data contained in all publications are solely those of the individual author(s) and contributor(s) and not of MDPI and/or the editor(s). MDPI and/or the editor(s) disclaim responsibility for any injury to people or property resulting from any ideas, methods, instructions or products referred to in the content. |
© 2023 by the authors. Licensee MDPI, Basel, Switzerland. This article is an open access article distributed under the terms and conditions of the Creative Commons Attribution (CC BY) license (https://creativecommons.org/licenses/by/4.0/).