Abstract
In this study, a specimen geometry for testing finger joints was developed using finite element simulation and proofed by experimental testing. Six different wood species and three adhesives were used for finger-jointing specimens. With the test specimen geometry, the bonding strength of the finger joints was determined without the usual self-locking of the joint. Under load, the test specimen geometry introduces maximum stress at the beginning of the bond line (adhesive zone). However, the test specimen geometry does not generate a symmetric stress state. The main difficulty here is the flank angle of the finger joint geometry. The wood species and adhesives significantly influenced the performance of the finger joints.
1. Introduction
Finger joints are longitudinal bonded timber joints used in non-load-bearing and load-bearing applications. They play a key role in the load-bearing capacity of bonded engineered wood products (EWP) [1,2]. The formation of the bond line during the finger-jointing process differs from that of surface bonding [3,4,5,6,7]. Factors such as the structure of the bonding surface, pressing pressure, pressing and assembly time, and application quantity of the adhesives are different for finger-jointing and surface bonding. When testing adhesives for load-bearing applications according to EN 302-1 [8] by means of lap joints, the characteristics of finger joints according to EN 15497 [9], such as very short pressing times or bonding of end-grain wood, are not taken into account. Thus, the adhesives are only tested for surface bonding. Recently, it has become possible to produce more EWP based on hardwoods [10,11,12,13,14,15,16], which have a high strength potential. Compared with softwoods, the manufacture and testing of hardwood EWP’s are rarely standardised. The strength of finger joints results from the joint’s geometry-related self-locking (clamping effect) and the bonding strength [17,18]. Currently, there is no test standard to determine the bonding strength of a finger joint independent of the self-locking. This study aimed to develop a test specimen geometry for mechanical performance tests of finger joint bond lines without the usual self-locking of the joint. In previous tests, different geometries were assessed using the finite element method (FEM) [19,20,21] and the behaviour of the finger joint bond line was predicted. Experimental tests were carried out to validate the simulations. Different wood species were bonded with commercial adhesives, and the bonding strength was determined with the developed test specimen geometry.
Figure 1 shows a standard finger joint from EN 15497 [9] and a small test specimen with a finger joint geometry for EWP. Typical finger joints have a finger length between 7 mm and 50 mm and a flank angle between 3° and 8°. A general principle is that the strength of the finger joint increases when the flank angle is decreased as the bonding surface becomes larger [18,22,23,24]. The bonding strength, including the self-locking effect, is tested using the shown test specimen geometry (Figure 1). This study aimed to test the bonding strength of a single finger joint bond line without the usual self-locking of the joint. Therefore, a new test specimen geometry was developed which differs from a finger joint test specimen with self-locking and several bond lines. Furthermore, the clamping of small test specimens is difficult, as they often slip out of the clamping jaws when a tensile load is applied or break at the clamping in the case of wedge grips. This was considered in the development of the test specimen geometry of this study.
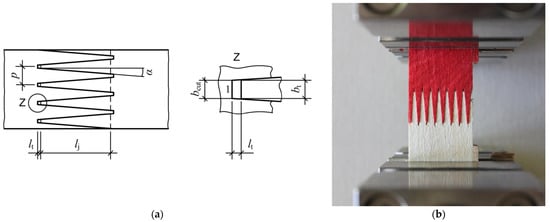
Figure 1.
Standard finger joint from EN 15497 [9]: 1 finger base, lj finger length, p finger pitch, α flank angle, lt fingertip gap, bcut width of cutter, bt width of fingertip (a); small test specimen with standard finger joint, which is not suitable for the determination of bonding strength of a finger joint (b).
2. Materials and Methods
2.1. Wood and Adhesives
The wood species used in this study are shown in Table 1. The specimens were made from plain sawn boards with predominantly tangential grain. Before manufacture of the specimens, the boards were conditioned at 20 °C and 65% relative humidity until the equilibrium moisture content (EMC) was reached.

Table 1.
Affiliation, origin, density, and EMC of tested wood species.
Commercially available melamine–urea–formaldehyde (MUF), phenol–resorcinol–formaldehyde (PRF), and 1-component polyurethane (PUR) adhesive systems were used (Table 2). They were processed according to the technical data sheets of the manufacturers.
Table 2.
Properties and processing parameters of the adhesive systems.
2.2. Finite Element Simulations and Shear–Tensile Tests
In an iterative process of finite element simulations and experimental testing, a shear–tensile test specimen for finger joints was developed. EN 302-1 [8] and a standard testing machine with 5 × 5 mm2 clamping jaws were used as a basis for the design of the test specimen geometry. Essential test criteria were the location of the stresses and the location of the specimen failure. Stress concentrations and specimen failure were to be localized in the bond line. The following requirements were defined as important for the test specimen design:
- Complete transmission of the test load into the bond line during the test;
- Testing of a single bond line without self-locking;
- Centric force transmission and shear-tensile stress as only stress state;
- Consideration of the usual manufacturing process of finger joint bonding.
Ansys 2022 (Academic/Students) analysis software was used for a static-mechanical FE simulation of two test specimen geometries. The material properties were defined as follows:
- Linear–elastic behaviour;
- Orthotropic stiffness matrix for beech wood according to Schaffrath (2015) [25] (Table 3).
Table 3. Material parameters according to Schaffrath (2015) [25] for input to the finite element simulations.
- In the contact area of the joints, the cohesive zone model (CZM) is based on the fracture energy of the PUR adhesive according to Serrano and Enquist (2005) [26] (Table 4).
Table 4. Contact properties based on strength and fracture energy of PUR adhesive according to Serrano and Enquist (2005) [26].
- Meshing: hexahedral elements in the shear region (Figure 2) and SOLID186 as main elements were used; hexahedral elements were preferred over tetrahedral elements because the hexahedral elements exhibited less stiff behaviour and showed more satisfactory convergence behaviour;
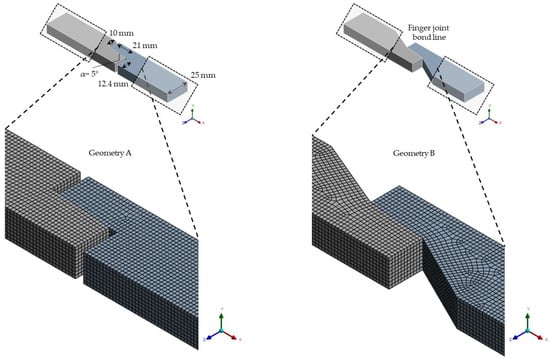 Figure 2. Mesh design of the test specimen geometries for the FE simulation. Geometry A with 104,083 nodes and 22,779 elements (left) and geometry B with 99,180 nodes and 21,681 elements (right). In the simulations the tangential surfaces were bonded with PUR and the flank angle of the finger joints was 5°. The notches of both test specimen geometries were cut asymmetrically because of the flank angle (shown for geometry A).
 - Further conditions: fixed clamping at end face, area load in tensile direction (both test specimen geometries with 5 kN load at opposite end face). In the following, the relative stresses to the stress maximum are shown, so that they are independent of the applied load.
The resulting relative von Mises equivalent stresses of the simulated geometries were compared under the previously described load case.
The test specimen geometry B (Figure 2) was selected for the experiments. The specimens were produced according to EN 14080 [27] with a finger jointing line type of Ultra TT (Weinig Grecon GmbH & Co. KG, Alfeld/Leine, Germany). The following process parameters were used in this study. The pressing pressure was set for beech and adjusted proportionally to the lower density of the other wood species, so that the bonding surface was similar for all wood species (Table 1):
- Finger joint geometry: 21.0 mm finger length and 6.2 mm finger pitch;
- Cutting feed rate: 25 m min−1;
- Cutting direction: vertical profile, perpendicular to annual rings;
- Adhesive application: manual application, processing of PUR, MUF, PRF (Table 2), and bonding of radial surfaces;
- Pressing pressure: beech 12.5 N mm−2, birch 11.8 N mm−2, pine 11.6 N mm−2, larch 10.5 N mm−2, poplar 9.0 N mm−2, spruce 8.5 N mm−2;
- Pressing time: 5 s.
The shear–tensile test specimens were made of lamellae with the dimensions 360 × 100 × 30 mm−3 (L × T × R) (Figure 3). The lamellae were cut in the middle and, with a few exceptions, reconnected by finger jointing as in their original state.
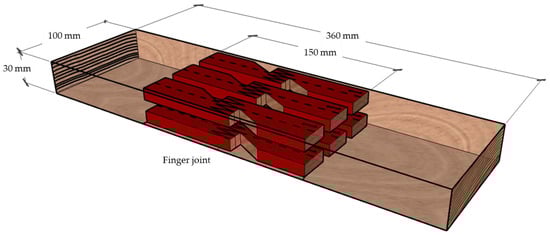
Figure 3.
Manufacture of shear–tensile test specimens made from a lamella with a vertical finger joint profile.
After curing of the adhesives, the shear–tensile tests were carried out with an universal testing machine (Zwick Roell GmbH & Co. KG, Ulm, Germany) using a 5 kN load cell, a total clamping length of 100 mm, and a test speed of 0.5 mm min−1. The bond line length (Figure 4, hypotenuse c) was measured representatively for each wood–adhesive combination microscopically using a digital microscope VHX-5000 (Keyence, Osaka, Japan). The bond line height corresponds to the specimen thickness and was measured on each test specimen using a digital calliper. Due to the flank angle of the finger joint, the load direction is neither parallel (requirement for shear stress) nor perpendicular (requirement for tensile stress) to the observed section area. A mixed mode loading of shear stress fvb and tensile stress fva was measured (Figure 4). Both stresses were calculated depending on the flank angle of the finger joint (in this study α = 5°). The shear–tensile strength fvc of the finger joint bond line was calculated according Equation (1) from EN 302-1 [8] as it was carried out in [3] for scarf joints:
- fvc = shear-tensile strength [N mm−2]
- fvb = shear strength [N mm−2]
- fva = tensile strength [N mm−2]
- Fmax = applied breaking load [N]
- A = finger-jointed area [mm2]
- l = length of bond line [mm]
- h = height of bond line [mm]
On each tested specimen, the percentage of wood failure was estimated in 10% steps by visual inspection according to EN 302-1 [8].
Figure 4 shows a simplified drawing of the test specimen geometry of the experiments, its dimensions, asymmetric notches, and the setup of the shear–tensile test. The width of the fingertip and fingertip gap are not shown.

Figure 4.
Test specimen geometry for the determination of the strength of a finger joint bond line (marked in red) (a); and shear–tensile test with asymmetric notches: cathetus a shows section area of tensile stress, cathetus b shows section area of shear stress, and hypotenuse c shows section area of shear–tensile stress (tested bond line) (b).

2.3. Data Processing
To evaluate the effects and interactions of the parameter settings, the following data were processed:
- Wood species and adhesive on the resulting parameters;
- Shear–tensile strength and wood failure percentage: two full factorial designs were set up (Table 5).
Table 5. Full factorial designs to evaluate effects and interactions of the parameter settings: n is number of specimens, fvc is the shear–tensile strength, and WFP is wood failure percentage, each with 18 parameter settings.
In the following, statements on the wood species are to be interpreted in combination with the wood species-specific pressing pressure.
The interaction plots represent the mean values of all settings of one factor as a function of the setting of another factor [28]. The significance of the main effects and interactions was tested using an ANOVA [29]. The significance level was set to the value of 0.05.
3. Results and Discussion
3.1. Results of Finite Element Simulations and Shear–Tensile Tests
The von Mises equivalent stress for a section path through the adhesive joint of the specimen geometries A and B resulting from the finite element (FE) simulations is shown (Figure 5). These relative stresses shown in the graph refer to the stress maximum found in both calculations of the geometries, as mentioned above. The stress maximum of geometry A is in the “notch bottom area” next to the adhesive zone, and the initial failure of the specimen is expected to be in the wood and not in the bond line. The stress maximum of geometry B is located at the beginning of the adhesive zone and it is higher than that of geometry A. Higher stresses are expected at the entry point of the bond line, which proved to be more appropriate for testing the bonding strength. Otherwise, a pure wood fracture failure is very likely to occur in the notch base next to the adhesive zone. The initial failure in the bond line of the geometry B predicted by the FE simulations was confirmed in the experimental shear–tensile tests of this study. The stress distribution for both geometries is not symmetrical due to the asymmetric notch depths, and differences along the path are evident. Comparing the notches on both sides of the specimens, the deeper notched side shows higher stresses at the beginning of the adhesive joint than the other side.
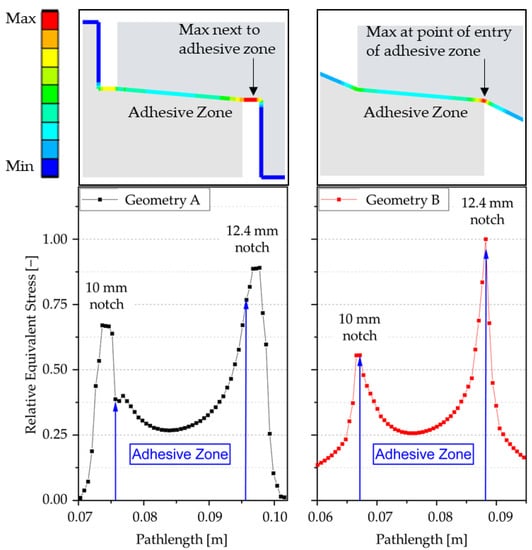
Figure 5.
Relative von Mises equivalent stresses of the geometries in the adhesive zone and notches; geometry B was selected for the main experiments of this study.
Due to the flank angle of the finger joint and the exact specimen geometry, a mixed mode loading with more complex stress state than pure shear stress is present in the adhesive zone (for example, tensile stress needs to be considered). The shear stresses determined in the experiments of this study are expected to be lower compared with the pure shear stress. Nevertheless, geometry B is a suitable test specimen geometry for an evaluation and relative comparison of finger joint bondings. It fulfils all requirements mentioned at the beginning of this study except for the shear–tensile stress as the only stress state.
The determined shear–tensile strength and the wood failure percentage of the finger joint bondings are shown (Figure 6). The highest shear–tensile strengths were achieved by beech and birch bonded with MUF adhesive. Some of these test specimens were able to fulfil the required strength values of EN 301 (for thin beech adhesive joints, 10 N mm−2) [30]. However, the results of this study are not comparable to the test according to EN 301 [30]. With the test specimen geometry of this study, an overstressing at the tip of the finger joint is expected. This makes failure at lower loads more probable compared with the standard test by means of lap joints. Accordingly, a standard is necessary to be able to test and compare finger joint bondings with a defined test setup. Finger joints bonded with PUR achieved the lowest shear–tensile strengths for all wood species. The wood failure percentages show a large scattering overall. Compared with hardwoods, softwoods showed a higher wood failure percentage; spruce bonded with MUF showed almost complete wood failure. The high wood failure percentage is not equivalent to better bonding [31]. The inherent strength of the wood, which is density related, is an important factor for the evaluation of the bonding strength [32] and must be considered when comparing bondings. Hardwoods showed adhesion and adhesive failure as the main failure mode. This is reflected in the low wood failure percentages. To better utilize their high strength potential, the hardwood bondings need to be further improved. Using hardwoods, more significant differences were found between the adhesive systems than with the softwoods. In the case of the softwoods, it was mainly the strength of the wood that was tested.
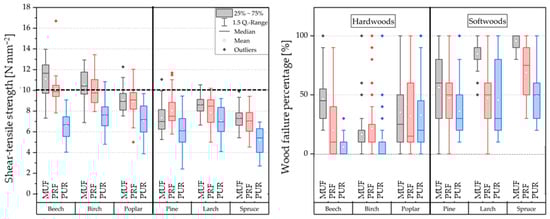
Figure 6.
Boxplots of shear–tensile strength and wood failure percentage of the finger joint bondings: separated by hardwoods and softwoods and sorted by decreasing density of wood species; horizontal dotted black line marks standards requirement following EN 301 (10 N mm−2) [30] for thin surface bonded joints of beech test specimens.
The specimen geometry for finger joint bondings used in this study was similar to the scarf joints used in [3,33]. As for scarf joints in [33], the tests in this study revealed relative differences between the bonding strengths of the adhesive systems and additionally between the wood species. These could not be shown with lap joint specimens in [33]. The differences in bonding strengths of the scarf joints were much more influenced by the adhesive systems than by the wood species [33]. As concluded for the scarf joints in [33], the test specimen geometry of this study is not suitable for the determination of absolute adhesive shear strength due to the mixed mode loading and possibly enhanced penetration of the adhesive into the end-grain wood. The effect of adhesive penetration on bonding strength needs to be verified in further studies.
The use of MUF tends to lead to the highest bonding strength and wood failure percentage, which may be explained by its high stiffness (less ductility). However, in this study much lower shear–tensile strengths were achieved with MUF-bonded finger joints compared with scarf joints in [3] (12 ± 1 N mm−2) and similar to scarf joints in [33] (7.5 N mm−2). The wood failure percentages were lower in [3] for several reasons, for example, wood properties, adhesive system, double-sided adhesive application, longer pressing time, and angle of the scarf joint could explain the higher shear–tensile strengths in [3]. This needs to be further investigated. Specimens bonded with PUR tended to show lower bonding strength and wood failure percentages, possibly due to the fact that it is more elastic (more ductile) [34]. As mentioned above, the penetration of the adhesive systems could be one more reason for the different bonding strengths of the finger joints. The MUF, in comparison with the PUR, is expected to penetrate deeper into the wood structure and can penetrate the cell wall [35]. Despite its low density (Table 1), poplar shows a high shear–tensile strength compared with the softwoods.
In [36], lap joints (surface bondings) were proofed using shear–tensile tests with the same or similar wood species, treatment, and adhesive systems. For most of the wood bondings, similar shear–tensile strengths were achieved as in this study. This initially indicates that finger joint bondings have the potential to achieve strengths like those of surface bondings. In this study, the finger-jointed poplar was able to achieve higher shear–tensile strengths. In [36], wood bonded with PUR was treated with a primer beforehand. All wood species could achieve significantly higher shear–tensile strengths compared with this study. There is currently no system on the market to apply primers on finger joints. An improvement in bonding performance is expected with the use of a primer [37]. The wood failure percentages in [36] were significantly higher. This can be explained by the subjective method to assess the wood failure percentage [38] or by the different bonding methods (surface and finger joint bonding). Furthermore, it is pointed out that the finger joints were tested in a standard climate state (20 °C and 65% rel. humidity). Pre-treatment according to EN 302-1 [8], e.g., water storage, can significantly influence the performance of the adhesives and wood [39].
The shear–tensile strength (fvc), shear strength (fvb), and tensile strength (fva) of the tested finger joint bond lines are shown in Table 6. The splitting of fvc into fvb and fva shows that under tensile load and with the used test specimen geometry, much greater shear stresses than tensile stresses were applied to the finger joint bond lines. A change in the flank angle of the finger joint geometry would lead to a change in the stress components.
Table 6.
Average values of shear–tensile strength fvc, shear strength fvb, and tensile strength fva of the tested finger joint bond lines. ± shows the standard deviation of the values.
3.2. Two-Way Interactions and Analysis of Variance
The two-way interactions of the finger joint bondings for shear–tensile strength and wood failure percentage are shown (Figure 7). With a few exceptions, PUR bondings achieved the lowest mean shear–tensile strength and lowest mean wood failure percentage for all wood species. The key message of Figure 7 is that only a few interactions between the wood species and adhesives were found. This is indicated by the parallel course of the lines. A comparatively large drop in shear–tensile strength was observed for beech finger joints bonded with PUR, whereas birch finger joints achieved similar bonding strengths with the PUR as with the other adhesives. The density of beech and birch were similar which indicates that other reasons caused the differences. Further studies on the structure and chemistry of the bonding surfaces of the wood species should be carried out.
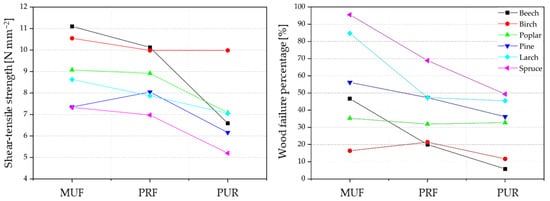
Figure 7.
Two-way interactions of the finger joint bondings for mean of shear–tensile strength and mean of wood failure percentage.
All main effects and interactions are significant at the predefined level of 0.05 (Table 7). As mentioned above, the factor wood species had a significant effect on the shear–tensile strength and the wood failure percentage. This is probably due to the different densities and inherent strength of the wood species. The adhesive had a lower effect on the shear–tensile strength and wood failure percentage than the wood species. The interaction of wood and adhesive were significant but not very pronounced as already shown in Figure 7.
Table 7.
ANOVA results table (sig. level 0.05) based on statistical designs from Table 5.
4. Conclusions
The present study proposes a specimen geometry for a finger-jointed wood bonding strength test. Furthermore, it presents the experiment results of tests employing the preferred test specimen geometry for a combination of six wood species specimens and three adhesives. The following conclusions can be drawn:
- A test specimen geometry for finger joints was identified using finite element simulations and proved by experimental testing. The test specimen geometry has a stress maximum at the beginning of the bond line (adhesive zone) and on the deeper notched side. Different finger joint bondings could be evaluated with the geometry and relative differences of the bondings were found. However, the geometry does not generate a symmetric stress state.
- A standard for testing finger joint bondings should be developed. The angle and length of the finger joint geometry affect the force transmission at the bond line and the resulting stress distribution. Different geometries should be tested, and geometry-dependent adjustment factors should be developed.
- Statements about the bonding strength are difficult since it is a combination of wood and adhesive failure. In this study, it was observed that the performance of the adhesives can be assessed more precisely when the wood species have higher strengths and can withstand loads closer to the limit of the adhesives.
- Further investigations, for example, roughness or wetting analyses, should be considered to be able to explain differences between the tested bondings.
- To improve finger-jointing and the high strength potential of hardwoods, adhesives and finger joint geometry should be further investigated.
Author Contributions
Conceptualization, H.S. and M.G.; methodology, H.S., M.G. and S.K.; formal analysis, M.G. and H.S.; investigation, S.K., H.S. and M.G.; resources, H.M.; writing—original draft preparation, H.S., S.K. and M.G.; writing—review and editing, all; visualization, H.S. and M.G.; supervision, H.M. and S.B.; funding acquisition, H.M. and S.B. All authors have read and agreed to the published version of the manuscript.
Funding
This research was funded by the German Federal Ministry for Economic Affairs and Energy (BMWi) through the Central Innovation Programme for small and medium-sized enterprises (SMEs) grant number FKZ 16KN042025.
Data Availability Statement
Not applicable.
Acknowledgments
The authors would like to express their sincere thanks to Weinig Grecon GmbH & Co. KG (Alfeld, Germany) for providing the finger-jointing line and expertise; Leitz GmbH & Co. KG (Oberkochen, Germany) for providing the cutting tools; the adhesive manufacturers for providing the adhesive systems; and ANSYS, Inc. (Canonsburg, U.S.) for providing the free student version of their software. We would also like to thank Philipp Schlotzhauer for initiating and supporting the project. We acknowledge support by the Open Access Publication Funds of Göttingen University.
Conflicts of Interest
The authors declare no conflict of interest.
References
- Serrano, E. Adhesive Joints in Timber Engineering: Modelling and Testing of Fracture Properties; Lund University: Lund, Sweden, 2000. [Google Scholar]
- Frangi, A.; Bertocchi, M.; Clauß, S.; Niemz, P. Mechanical behaviour of finger joints at elevated temperatures. Wood Sci. Technol. 2012, 46, 793–812. [Google Scholar] [CrossRef]
- Tran, A.; Mayr, M.; Konnerth, J.; Gindl-Altmutter, W. Adhesive strength and micromechanics of wood bonded at low temperature. Int. J. Adhes. Adhes. 2020, 103, 102697. [Google Scholar] [CrossRef]
- Stolze, H.; Gurnik, M.; Koddenberg, T.; Kröger, J.; Köhler, R.; Viöl, W.; Militz, H. Non-Destructive Evaluation of the Cutting Surface of Hardwood Finger Joints. Sensors 2022, 22, 3855. [Google Scholar] [CrossRef] [PubMed]
- Gong, M.; Rao, S.; Li, L. Effect of Machining Parameters on Surface Roughness of Joints in Manufacturing Structural Finger-Jointed Lumber. J. For. Eng. 2017, 2, 10–18. [Google Scholar]
- Follrich, J.; Vay, O.; Veigel, S.; Müller, U. Bond strength of end-grain joints and its dependence on surface roughness and adhesive spread. J. Wood Sci. 2010, 56, 429–434. [Google Scholar] [CrossRef]
- Jokerst, R.W. Finger-Jointed Wood Products; Forest Products Laboratory: Madison, WI, USA, 1981; p. 26. [Google Scholar]
- EN 302-1:2013-06; Adhesives for Load-Bearing Timber Structures—Test Methods—Part 1: Determination of Longitudinal Tensile Shear Strength. Beuth Verlag GmbH: Berlin, Germany, 2013; p. 15.
- EN 15497:2014-07; Structural Finger Jointed Solid Timber—Performance Requirements and Minimum Production Requirements. Beuth Verlag GmbH: Berlin, Germany, 2014; p. 58.
- Weimar, H.; Jochem, D. Holzverwendung im Bauwesen—Eine Marktstudie im Rahmen der “Charta für Holz”; Johann Heinrich von Thünen-Institut: Braunschweig, Germany, 2013. [Google Scholar]
- Wehrmann, W.; Torno, S. Laubholz für Tragende Konstruktionen-Zusammenstellung zum Stand von Forschung und Entwicklung; Cluster—Initiative Forst und Holz in Bayern gGmbH: Freising, Germany, 2015; p. 18. [Google Scholar]
- Linsenmann, P. European Hardwoods for the Building Sector (EU Hardwoods); WoodWisdom-Net Research Programme; Holzforschung Austria: Wien, Austria, 2016; p. 57. [Google Scholar]
- Informationsverein Holz e.V. Konstruktive Bauprodukte Aus Europäischen Laubhölzern; Spezial; Informationsverein Holz e.V.: Düsseldorf, Germany, 2017; ISBN 0446-2114. [Google Scholar]
- Ehrhart, T. European Beech—Glued Laminated Timber; ETH Zurich: Zürich, Switzerland, 2019. [Google Scholar]
- Knauf, M.; Frühwald, A. Laubholz-Produktmärkte Aus Technisch-Wirtschaftlicher Und Marktstruktureller Sicht; Fachagentur Nachwachsende Rohstoffe e.V.: Gülzow, Germany, 2020. [Google Scholar]
- Obernostererer, D.; Jeitler, G.; Schickhofer, G. Birke: Holzart Der Zukunft Im Modernen Holzbau; University of Stuttgart: Stuttgart, Germany, 2022; p. 8. [Google Scholar]
- Aicher, S.; Radovic, B. Untersuchungen zum Einfluß der Keilzinkengeometrie auf die Zugfestigkeit keilgezinkter Brettschichtholz-Lamellen. Holz Roh Werkst. 1999, 57, 1–11. [Google Scholar] [CrossRef]
- Rao, S.; Gong, M.; Chui, Y.H.; Mohammad, M. Effect of Geomertic Paramters of Finger Joint Profile on Ultimate Tensile Strenght of Single Finger-Joined Board. Wood Fiber Sci. 2012, 44, 8. [Google Scholar]
- Timbolmas, C.; Rescalvo, F.J.; Portela, M.; Bravo, R. Analysis of poplar timber finger joints by means of Digital Image Correlation (DIC) and finite element simulation subjected to tension loading. Eur. J. Wood Wood Prod. 2022, 80, 555–567. [Google Scholar] [CrossRef]
- Campilho, R.D.S.G. (Ed.) Strength Prediction of Adhesively-Bonded Joints; A Science Publishers Book; CRC Press: Boca Raton, FL, USA, 2017; ISBN 978-1-4987-2246-9. [Google Scholar]
- Tran, V.-D.; Oudjene, M.; Méausoone, P.-J. FE analysis and geometrical optimization of timber beech finger-joint under bending test. Int. J. Adhes. Adhes. 2014, 52, 40–47. [Google Scholar] [CrossRef]
- Selbo, M.L. Effect of Joint Geometry on Tensile Strength of Finger Joints. For. Prod. J. 1963, 13, 390–400. [Google Scholar]
- Gehri, E. Verbindungstechniken mit hoher leistungsfähigkeit—Stand und entwicklung. Holz Roh Werkst. 1985, 43, 83–88. [Google Scholar] [CrossRef]
- Radovic, B. Über Die Festigkeit von Keilzinkenverbindungen Mit Unterschiedlichen Verschwächungsgrad. Bau. Mit Holz 1993, 3, 196–201. [Google Scholar]
- Schaffrath, J. Untersuchungen Zu Feuchtetransportvorgängen Und Feuchteinduzierten Verformungen Sowie Spannungen Bei Betrachtung Verschiedener Holzarten Und Unterschiedlicher Klimatischer Randbedingungen. Dissertation, Technische Universität München, München, Germany, 2015. [Google Scholar]
- Serrano, E.; Enquist, B. Contact-free measurement and non-linear finite element analyses of strain distribution along wood adhesive bonds. Holzforschung 2005, 59, 641–646. [Google Scholar] [CrossRef]
- EN 14080:2013-09; Timber Structures—Glued Laminated Timber and Glued Solid Timber—Requirements. Beuth Verlag GmbH: Berlin, Germany, 2013; p. 110.
- Technical Statistics—Experimental Methodology (DoE). In Quality Management in the Bosch-Group; Robert Bosch GmbH: Gerlingen, Germany, 2020.
- Montgomery, D.C. Design and Analysis of Experiments, 10th ed.; Wiley: Hoboken, NJ, USA, 2020; ISBN 978-1-119-49247-4. [Google Scholar]
- EN 301:2018-01; Adhesives, Phenolic and Aminoplastic, for Load-Bearing Timber Structures—Classification and Performance Requirements. Beuth Verlag GmbH: Berlin, Germany, 2018.
- Aicher, S.; Ahmad, Z.; Hirsch, M. Bondline shear strength and wood failure of European and tropical hardwood glulams. Eur. J. Wood Wood Prod. 2018, 76, 1205–1222. [Google Scholar] [CrossRef]
- Iždinský, J.; Reinprecht, L.; Sedliačik, J.; Kúdela, J.; Kučerová, V. Bonding of Selected Hardwoods with PVAc Adhesive. Appl. Sci. 2020, 11, 67. [Google Scholar] [CrossRef]
- Konnerth, J.; Gindl, W.; Harm, M.; Müller, U. Comparing dry bond strength of spruce and beech wood glued with different adhesives by means of scarf- and lap joint testing method. Holz Roh Werkst. 2006, 64, 269–271. [Google Scholar] [CrossRef]
- Sebera, V.; Pečnik, J.G.; Azinović, B.; Milch, J.; Huč, S. Wood-adhesive bond loaded in mode II: Experimental and numerical analysis using elasto-plastic and fracture mechanics models. Holzforschung 2020, 75, 655–667. [Google Scholar] [CrossRef]
- Herzele, S.; van Herwijnen, H.W.; Griesser, T.; Gindl-Altmutter, W.; Rößler, C.; Konnerth, J. Differences in adhesion between 1C-PUR and MUF wood adhesives to (ligno)cellulosic surfaces revealed by nanoindentation. Int. J. Adhes. Adhes. 2019, 98, 102507. [Google Scholar] [CrossRef]
- Konnerth, J.; Kluge, M.; Schweizer, G.; Miljković, M.; Gindl-Altmutter, W. Survey of selected adhesive bonding properties of nine European softwood and hardwood species. Eur. J. Wood Wood Prod. 2016, 74, 809–819. [Google Scholar] [CrossRef]
- Clerc, G.; Lehmann, M.; Gabriel, J.; Salzgeber, D.; Pichelin, F.; Strahm, T.; Niemz, P. Improvement of ash (Fraxinus excelsior L.) bonding quality with one-component polyurethane adhesive and hydrophilic primer for load-bearing application. Int. J. Adhes. Adhes. 2018, 85, 303–307. [Google Scholar] [CrossRef]
- Künniger, T. A semi-automatic method to determine the wood failure percentage on shear test specimens. Holz Roh Werkst. 2008, 66, 229–232. [Google Scholar] [CrossRef]
- Bockel, S.; Harling, S.; Grönquist, P.; Niemz, P.; Pichelin, F.; Weiland, G.; Konnerth, J. Characterization of wood-adhesive bonds in wet conditions by means of nanoindentation and tensile shear strength. Eur. J. Wood Wood Prod. 2020, 78, 449–459. [Google Scholar] [CrossRef]


Disclaimer/Publisher’s Note: The statements, opinions and data contained in all publications are solely those of the individual author(s) and contributor(s) and not of MDPI and/or the editor(s). MDPI and/or the editor(s) disclaim responsibility for any injury to people or property resulting from any ideas, methods, instructions or products referred to in the content. |
© 2023 by the authors. Licensee MDPI, Basel, Switzerland. This article is an open access article distributed under the terms and conditions of the Creative Commons Attribution (CC BY) license (https://creativecommons.org/licenses/by/4.0/).