Abstract
Material treatment in pulsation reactors (PR) brings the possibility of synthesizing powdery products with advantageous properties, such as nanoparticle sizes and high specific surface areas, at an industrial scale. The extraordinary material properties can be ascribed to special process parameters in a PR, primarily the periodically varying conditions and the consequently enhanced heat and mass transfer between the medium and the particles of the material. Understanding the connections between the PR operation parameters, such as fuel and air intake or PR geometry, and the resulting process parameters (temperature distribution, flow velocity and pressure field, and frequency of the pulsations) is essential to enabling a controllable treatment process. Despite the long history of pulsation reactor technology, many connections and dependencies remain unclear. Thus, the influence of the fuel (and air) supply on the pulsation reactor behavior is experimentally examined in this study. The investigated PR characteristics and process parameters are primarily those that have an impact on the heat and mass transfer, i.e., the temperature distribution, flow velocity, and pressure field, and frequency of the pulsations. In addition to these, the harmonic distortion of the oscillations and the heat losses are evaluated.
1. Introduction
1.1. Pulsation Reactors for Material Treatment
A pulsation reactor can be generally defined as an apparatus for continuous thermal material treatment and production utilizing a pulsating hot gas stream. The most common mechanism of driving and sustaining such a pulsating high-temperature gas flow is a periodically repeating transient combustion, which is referred to as pulsating combustion [1,2,3]. The frequency at which the process repeats is termed the operation frequency of a pulsation reactor and it typically ranges from 1 to 500 ; the average treatment temperature usually falls between 250 and 1300 °C [4]. The precursors are introduced in a powdery form or solved in either a flammable (e.g., ethanol, methanol) or a non-flammable carrier liquid (e.g., water), and sprayed into the PR to form an aerosol. When they enter the reaction zone, the reactants experience a thermal shock-like treatment with very short residence times, resulting in fast heating and cooling rates [5]. After the material particles have passed through the reaction zone, the product is extracted with a filter at the end of the tailpipe, as can be seen in Figure 1.
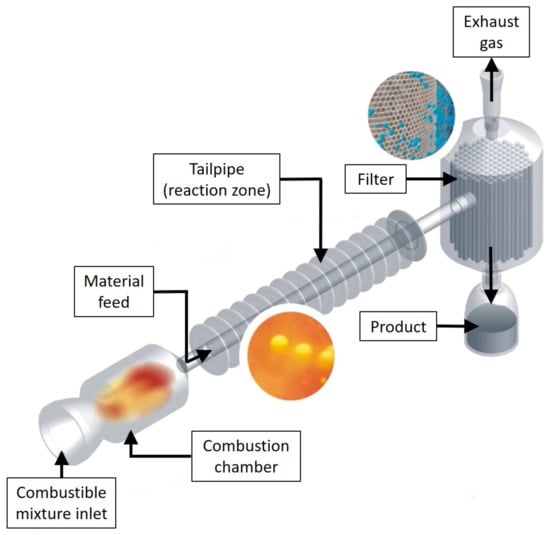
Figure 1.
Schematic of a pulsation reactor [6].
Pulsation reactors allow for various material treatment applications, e.g., drying, calcination, and annealing. However, they are primarily recognized as opening great opportunities for synthesizing (ultra-)fine powder products with advantageous properties, such as nanoparticle sizes and high specific surface areas, at an industrial scale [5,6,7]. For example, Heidinger et al. [8] describe the upscaling of the synthesizing process of zirconia and silica from the laboratory-scale flame spray pyrolysis [9,10] to the PR. The outstanding product properties might be attributed to the special process parameters in a PR, i.e., the periodically varying flow conditions and the resulting enhanced and persistent heat and mass transfer [11,12,13,14]. Therefore, understanding how the PR operation parameters relate to the process parameters is crucial in the pursuit of configurable and tailored product proprieties [4]. However, despite the pulsation reactor technology being experimented with for decades [15], it is still far from fully developed or understood.
1.2. Pulsating Combustion & the Theory of Pulsation Reactors
The principal phenomenon behind pulsating combustion and combustion-driven oscillations (CDO) is similar [1]. The Rayleigh criterion, which was originally formulated by Lord Rayleigh for the interaction of acoustic waves and the released heat [16,17], represents the fundamental condition for self-excited pressure oscillations during combustion [18] and applies to both CDO and pulsating combustion. However, how the phenomenon is handled does differ. CDOs are undesirable as the oscillations might lead to fatigue failure due to resonance, ultimately causing severe damage to the system, e.g., in a (gas) turbine [19]. However, intensified and controlled, the oscillations accompanying the combustion process create certain advantages (such as enhanced heat transfer). In a pulsation reactor, these effects are then effectively utilized for thermal material treatment as described above.
Various pulsation reactor types have been developed over time and reviewed elsewhere [1,20]. According to design configuration, they are classified into three groups: Schmidt-, Rijke-, and Helmholtz-type pulsation reactors, the latter of which has experienced the most use cases of the three. From now on, the term pulsation reactor in this work refers to the Helmholtz-type pulsation reactor specifically since PRs of primarily that type are used for thermal material treatment. As the name suggests, the Helmholtz-type PR acts like the acoustic Helmholtz resonator [21,22,23]. Introducing the notation used for a pulsation reactor, its resonant frequency is determined as [24,25,26].
where is the cavity (combustion chamber) volume and and are the cross-sectional area and length of the neck (tailpipe), respectively. The speed of sound is given by
where represents the heat capacity ratio, r the specific gas constant, and T is the thermodynamic temperature. The Helmholtz resonator model (relation (1)) is well applicable for pulsation reactors with a combustion chamber to the tailpipe volume ratio larger than 1
For much smaller than 1, the resonant frequency reduces to that of a quarter wave tube [23].
A typical pulsation reactor of the Helmholtz type is fairly simple by design (see Figure 1), as it basically consists of inlet valves (which might be either mechanical or aerodynamic), a combustion chamber, and a tailpipe (also referred to as the resonance tube). In contrast, the operation of a PR is, from a physical perspective, a rather complex process since it is a consequence of the interaction of several thermodynamic, fluid-dynamic, and acoustic effects [19,20,27]. Figure 2 shows a scheme of a pulsation reactor operation cycle.
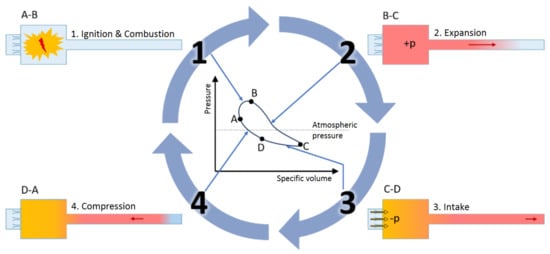
Figure 2.
The pulsation reactor operation cycle.
Which can be described as follows:
- 1.
- Ignition & combustion (A→B): The combustible mixture (air and gaseous fuel) is driven into the combustion chamber where it is ignited. To initialize the operation, a spark plug is typically used. Once self-excited periodic combustion is present, no additional energy source is needed and the spark plug might be switched off.
- 2.
- Expansion (B→C): The combustion is accompanied by a rapid increase of temperature and pressure, pushing the combustion products further towards the end of the exhaust pipe. The excess pressure causes mechanical valves to close completely, preventing both a flow into the combustion chamber and a potential backflow. May aerodynamic valves are used, a fraction of the flue gas might also travel back through the inlet valves.
- 3.
- Intake (C→D): Inertia of the outward traveling gases eventually causes the pressure in the combustion chamber to fall below the ambient pressure, resulting in a fresh mixture being sucked into the combustion chamber.
- 4.
- Compression (D→A): As a consequence of the negative gauge pressure in the combustion chamber, a portion of the flue gas originally moving downstream through the tailpipe reverses its direction and is pulled back into the combustion chamber. The inertia of the fluid entering from both sides of the combustion chamber results in the pressure rising above the ambient level. As the fresh mixture gets in contact with the hot combustion products, it is re-ignited and the cycle repeats.
Even though this is a generally accepted PR operation principle [1,3,20,27], the re-ignition process might in fact not be that straightforward. Apart from the backward-flowing flue gas, (a combination of) three other sources may be responsible for the re-ignition [27], namely: (a) hot gas remnants near the inlet; (b) high temperature of the combustion chamber wall; (c) unburned mixture sustaining the flame until the beginning of the next cycle. For a complete understanding of the pulsating combustion working principle, the ignition mechanisms require additional investigation. That is, however, not the scope of this work.
In the introduction, the pulsation reactor for thermal material treatment is introduced and its working principle is explained. The experimental setup is described next, followed by the calculation of derivable parameters. Finally, the results of the measurements and related calculations are presented and discussed, supplemented with a few recommendations for PR operation.
2. Method
2.1. Investigated PR Characteristics
For an effective and cost-efficient material treatment, it is essential to know the connections between the operation parameters and the resulting process conditions. Thus, the research presented here focuses on the PR characteristics that play a role in the context of the material treatment, i.e., those that affect the behavior of material particles in the reaction zone. The investigated PR characteristics are as follows:
- (a)
- Operation frequency:
- (b)
- Amplitude of pressure oscillations:
- (c)
- Amplitude of velocity oscillations:
- (d)
- Temperature in the tailpipe: T
Together, these will influence the motion of the material particles and the heat transfer between them and the gas stream [28,29,30,31]. This study aims to investigate the influence of fuel (and air) supply on the aforementioned process parameters and pulsation reactor characteristics. Their effects are quantified by the air–fuel equivalence ratio, , and the PR power density input, , which is addressed in Section 2.3.
2.2. Experimental Setup
For the purpose of the experimental investigations, a pulsation reactor test rig was built, as displayed in Figure 3. The combustion chamber and the tailpipe are both made of temperature-resistant quartz glass to allow for the future application of optical measurement methods. The tailpipe is adapted for pressure and temperature measurements, with four measurement points, labeled as –, evenly distributed along its axis. The air and gas, whose supply is controlled by rotameters, are introduced separately into the PR. Air is driven into a pre-chamber, from where it flows through aerodynamic valves to enter the combustion chamber at its bottom. The gas is supplied directly into the combustion chamber via a rod with the gas inlet positioned 140 mm above the combustion chamber bottom. The PR operation is initiated using a heated ceramic plate located in the vicinity of the gas inlet. The flue gas is led to the exhaust gas system through a decoupler mounted to the end of the tailpipe. By providing a large volume and a sudden jump in cross-sectional area, the decoupler is supposed to simulate the ambient environment and terminate the pulsations. Temperatures are measured with the type K thermocouples. Due to their time response being at the order of seconds, the time-averaged temperature was measured. On the contrary, the time-resolved pressure was measured with a microphone probe ICP 377B26 by PCB Piezotronics with a sampling frequency, , of 20 kHz [32].
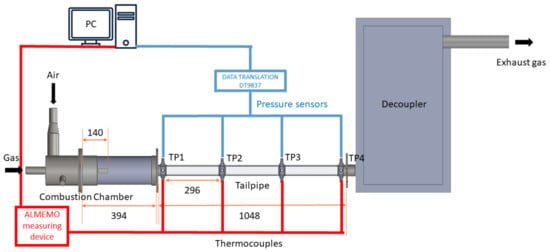
Figure 3.
The experimental pulsation reactor setup. The actual orientation is vertical. All dimensions are in millimeters.
2.3. Operation Points
This publication aims to provide a compact insight into PR operation control via fuel supply regulation. The effects of fuel (and air) supply are quantified by the air–fuel equivalence ratio, , and the PR power input, . While the air–fuel equivalence ratio is independent of the particular pulsation reactor, the effect of power input (determined by the amount of fuel) depends on the combustor size. For the sake of the transferability of the results to other reactors, the power density input, relating the power input to the combustion chamber volume via
was adopted as the second parameter. In this way, both parameters depend solely on the gas and air supply. The gas flow rate, , was varied by an increment of N / between and N /, which were the limits of the setup. The individual operation points (OPs) for each gas flow rate were established by first finding the lowest and the highest airflow rate allowing for stable pulsating combustion to develop. The airflow rate, , was then varied by an increment of 5 N / between those limits and, in the end, ranged between 10 and 55 N /. The normal flow rates in principle indirectly represent the mass flow rates, which are equal to the product of the normal flow rate and the density corresponding to the reference pressure and the reference temperature of the particular rotameter.
An overview of the operation points is presented in Table 1. Additionally, the OPs are graphically displayed in Figure 4. The green circles mark the OPs at which stable pulsating combustion was achieved. While too little air caused a steady flame to occur (the blue triangles), increasing the airflow rate too much resulted in the flame dying out (the red triangles). This trend is in agreement with the observations by Mondal et al. [33], for example. The black squares represent theoretical operation points that could not be reached for the system limits. Since the airflow rate was always varied by the same value, the increment of was not constant, but altered depending on , as it can be seen in Figure 4.

Table 1.
Overview of the measured operation points in terms of the air–fuel equivalence ratio, (the central part of the table), and of the power density input, (the bottom part of the table). The OPs are determined by a combination of the gas and the airflow rate - and , respectively. The use of a hyphen means that stable pulsating combustion could not be reached for the particular flow rate combination.
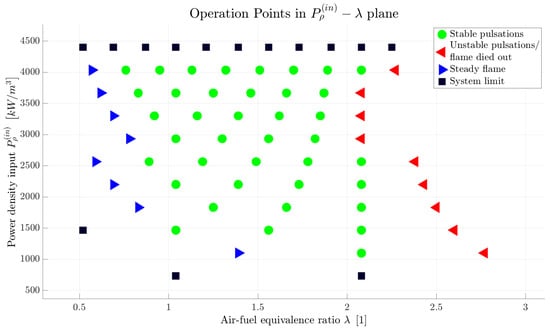
Figure 4.
Operation points displayed graphically in the plane. Since the airflow rate was always varied by the same value, the increment of the air–fuel equivalence ratio is not constant and alters depending on the power density input. Thus, the maximum for which stable pulsations were reached does not necessarily have to represent the operation limit. That applies primarily for lower values of .
2.4. Data Processing & Related Calculations
This section describes the data evaluation process and how individual PR characteristics were determined. The pressure data is addressed first, followed by the measured temperatures and the PR energy balance.
In order to determine the operation frequency, the discrete Fourier transform (DFT) was performed on the pressure data, providing the power of individual frequencies within a frequency range determined by and the sampling time. The frequency with the largest power was then accepted as the PR operation frequency, . The pressure amplitude was determined using its relation to the root mean square value for a sinusoidal signal
The root mean square was evaluated directly from the measured pressure signal as
where are the individual pressure values and is the number of values in one data set.
With the obtained frequency and pressure amplitude, the ideal (undistorted) original pressure oscillations can be reconstructed by a sine function. However, the pressure oscillations might not in fact correspond to a pure sine wave fully given by one (the fundamental) frequency. They are rather composed of other harmonics as well, as other effects also come into play. In order to quantify such effects, the total harmonic distortion
was evaluated for each pressure signal. The subscripts 1 and n in relation (7) represent the fundamental frequency and the n-th harmonic, respectively, and is the pressure root mean square corresponding to the particular frequency.
The PR operation frequency, , evaluated via the DFT is subsequently compared with the theoretical frequency of a Helmholtz resonator, , which is obtained using relation (1). The specific gas constant needed for the calculation of the speed of sound (according to (2)) is determined by the molar mass of the gaseous medium. That is related to its composition via
where represents the mole fractions of individual chemical substances (species) and is the corresponding molar mass. The inlet composition is defined by the air and gas flow rates and the composition of the two phases. Natural gas was used as the fuel and, for evaluation purposes, its standard composition was accepted [34]. Since the air, which is introduced into the PR from a compressed air supply, is dried upfront and its relative humidity is essentially zero, the standard dry air composition [35] was accepted. The composition further within the PR is determined by the combustion. For calculation purposes, ideal combustion was assumed, with the combustion process being finished already at the beginning of the tailpipe. It was assumed that all the combustible components that might potentially burn (depending on ), are already burned before they reach location . The gas composition along the tailpipe was then considered invariable.
Under the consideration of linear acoustics (for the sake of simplicity), the velocity amplitude was determined as [36]
where the density, , was obtained from the ideal gas law. The velocity amplitudes were additionally compared with the mean velocities, , which were obtained from the total mass flow rate
via the mixture density and cross-sectional area of the tailpipe.
The pulsation reactor heat loss was evaluated as the energy difference between the PR inlet and the tailpipe location by taking into consideration both the enthalpy and the chemical energy of the mixture (see the scheme in Figure 5)

Figure 5.
Scheme of the pulsation reactor energy balance.
The enthalpy flow change was determined as
where the superscripts and represent the pulsation reactor inlet and the tailpipe location , respectively. The subscript k stands for the individual chemical substances (species), and are the corresponding mass fractions and specific heat capacities at constant pressure, respectively. While the inlet mass fractions are given by the flow rates and the inlet mixture composition [34,35], the mass fractions at the tailpipe end are defined by the assumption of a completed ideal combustion process, as mentioned earlier. The heat capacities were determined using the functions of temperature according to [37]. The chemical energy flow change is calculated as
where the formation enthalpies of the individual species, , were adopted from [37] as well.
3. Results & Discussion
3.1. Pressure Data Results
Starting with the pressure data, Figure 6 shows an example of the pressure signal at locations TP1-TP4 for one specific operation point (defined by a combination of the power density input, , and air–fuel equivalence ratio, ). The originally sampled pressure is displayed with the solid blue curve, while the dashed red curve represents the theoretical oscillations following an ideal sine wave. These are reconstructed using the frequency obtained by DFT and the pressure amplitude determined by combining relations (5) and (6). While the two curves are almost identical at locations TP1 and TP2, a more noticeable difference can be observed at locations TP3 and TP4. Despite being designed thoroughly (as explained earlier), the decoupler apparently affects the PR behavior slightly by introducing additional oscillations, as the data for all other operation points exhibit a similar trend. Moreover, every protrusion at the tailpipe for inserting the measurement devices also acts as a tiny Helmholtz resonator, producing a noise signal. Consequently, the real pressure oscillations do not follow the ideal sine function precisely.
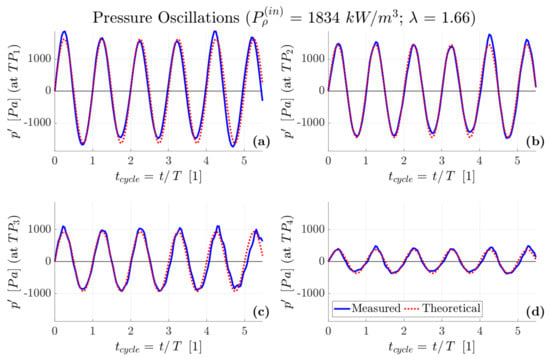
Figure 6.
Oscillating pressure part for one specific operation point displayed depending on the cycle time (time normalized by the period). The solid blue curve shows the actually measured data, while the dashed red curve represents the theoretical oscillations following an ideal sine function. Each subplot displays the pressure at one location along the tailpipe: (a) , (b) , (c) , (d) .
Since it represents a principal factor influencing the characteristics of the material treatment process, the heat transfer between the gas stream and the particles is typically investigated. As it depends significantly on the relative velocity between the two phases [28,29,30,31], an appropriate (mathematical) description of the fluid velocity evolution is one of the essential preconditions for accurate heat transfer modeling. However, it is usually assumed to follow a simple sinusoidal function. Thus, quantification of how well a simple sine function interprets the actual PR oscillations is especially interesting from the perspective of modeling the behavior of material particles in such a pulsating flow. For that purpose, the total harmonic distortion is evaluated according to relation (7). Figure 7 shows the evolution of the along the tailpipe for the of 1834 /, i.e., the data displayed in Figure 6 are represented by the red line in Figure 7. It confirms that the distortion is introduced primarily by the decoupler, as the increases along the tailpipe. Since these effects would be minimized by using a larger decoupler, interpreting the PR oscillations with a simple sine function is well justified.
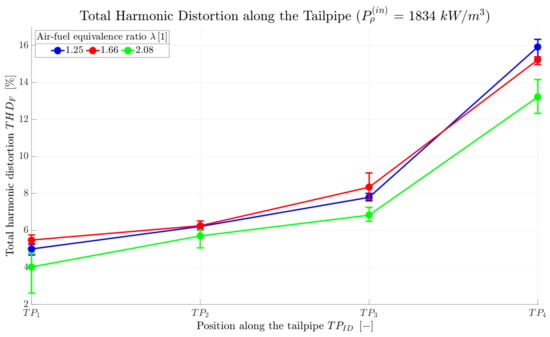
Figure 7.
Total harmonic distortion along the TP for one specific power input density.
For a comparison between individual operation points, Figure 8 shows the total harmonic distortion averaged from the four values along the tailpipe for each operation point, with each curve representing one power density input. It can be seen from the data that the real oscillations follow the ideal sine function better at lower power density input values since the total harmonic distortion increases with increasing . This phenomenon reaches saturation for the power density input over approximately 3000 / (the trend changes above the curve corresponding to 2934 /). The effect of the air–fuel equivalence ratio is negligible at lower values of the power density input. At higher , i.e., at the values for which the asymptotic behavior was detected, the decreases significantly with an increasing .
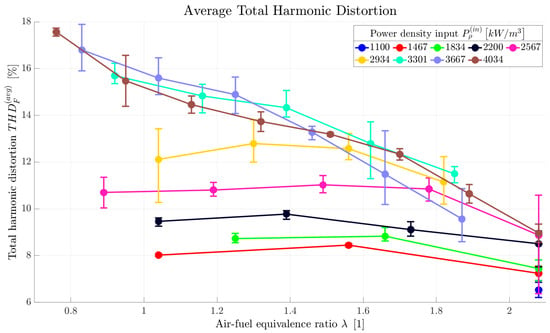
Figure 8.
Average total harmonic distortion displayed relative to air–fuel equivalence ratio for several power density input values.
Until now, the general PR operation and properties of the signal have been discussed. Proceeding to the individual characteristics of a pulsation reactor, Figure 9 shows the PR operation frequency displayed relative to air–fuel equivalence ratio for several power density input values. For lower , the frequency is only very slightly affected by both the air–fuel equivalence ratio and the power density input. Similar to Figure 8 for , the power density input of 3000 / again represents something of a limit value, as the frequency starts to react to changes in the two parameters above the yellow curve. For above the mentioned limit, the operation frequency increases with increasing power density input. For individual values of , it reaches its maximum for between and .
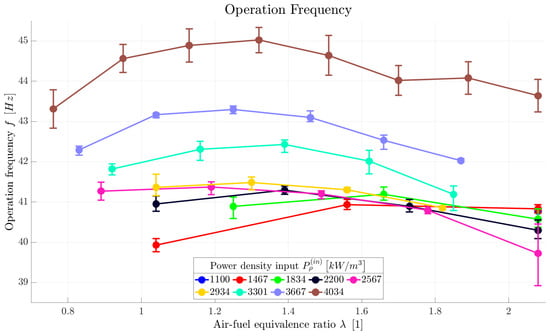
Figure 9.
Operation frequency of a pulsation reactor displayed relative to air–fuel equivalence ratio for several power density input values.
As mentioned earlier, the pulsation reactor might be perceived as a Helmholtz resonator. The resonant frequency of a Helmholtz resonator with a fixed geometry depends primarily on the temperature, which is apparent from relations (1) and (2) combined. Thus, Figure 10 shows the measured PR operation frequency just relative to the (average tailpipe) temperature. The actual PR frequency (the blue curve) is also compared with the theoretical frequency of a Helmholtz resonator (the red curve) calculated for the corresponding temperature. Additionally, the right y-axis shows the relative error between the two frequencies. Since the combustion chamber to the tailpipe volume ratio of the experimental pulsation rector equals approximately 3 and condition (3) is fulfilled, both frequencies should match rather well. That is confirmed by the data, as the relative error, shown in Figure 10 and corresponding to its right y-axis, is below 4% within the entire temperature range reached during the experiments. This finding suggests that, assuming the temperature can be accurately predicted by a precise heat loss modeling, the PR operation frequency can be predicted using relation (1) rather accurately as well. Even though the PR operation frequency has been investigated in several publications [33,38,39,40,41,42], such a direct comparison with a Helmholtz resonator has not been presented before.
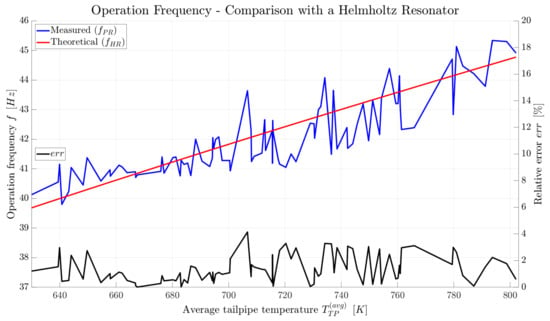
Figure 10.
Measured PR operation frequency () compared with the theoretical frequency of a Helmholtz resonator () calculated using relation (1).
Aside from the operation frequency, pressure amplitude represents another PR characteristic that is evaluated directly from the sampled pressure signal. Figure 11 shows an example of the pressure amplitude evolution along the tailpipe for one specific value of . The pressure amplitude is the largest in the combustion chamber, then it decreases along the tailpipe to eventually reach the ambient pressure at the tailpipe end. Since the pressure was not measured at the very end of the tailpipe, the measured data points were also approximated by a polynomial of the second order and the obtained functions were used to extrapolate the pressure to the tailpipe end (). In the graph, the measured data points are connected with the solid lines, while the approximated (and extrapolated) profiles are displayed with the dashed curves. In an ideal case, the pressure amplitude would be zero at the tailpipe end - with a pressure equal to the ambient value. The deviation might be caused by (a combination of) two things—(1) the fitting itself, or (2) the fact that the flue gas is not released to the surroundings, but rather there is the decoupler at the end of the tailpipe which simulates the ambient conditions. Despite its large volume, it is still part of the exhaust system and the pressure might still oscillate slightly within.
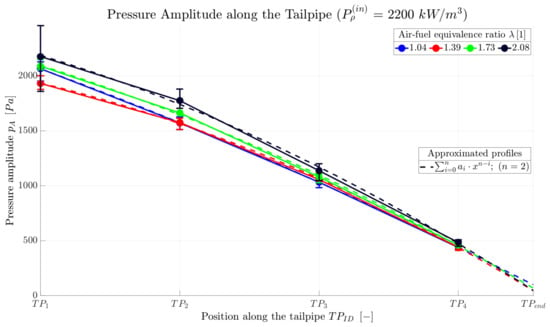
Figure 11.
Pressure amplitude along the TP for one specific power density input. The solid lines connect the original data and the dashed curves display the pressure profile extrapolated to the tailpipe end, which was obtained through an approximation of the original data by a polynomial of the second order.
In order to compare the individual operation points, Figure 12 shows the pressure amplitude averaged from all values measured along the tailpipe displayed relative to for different values of . For lower power density input, the pressure amplitude tends to slightly increase with an increasing air–fuel equivalence ratio. However, the power density input itself has a much more significant effect and the pressure amplitude increases with as well. The power density input of approximately 3000 / defines something of a boundary again as, from this value and higher, the effects are the opposite. The pressure amplitude is the largest for the lowest air–fuel equivalence ratio and it decreases significantly with an increasing . However, the effect of the power density input has been almost completely nullified, leading to a similar asymptotic behavior which was observed for the total harmonic distortion as well (see Figure 8).
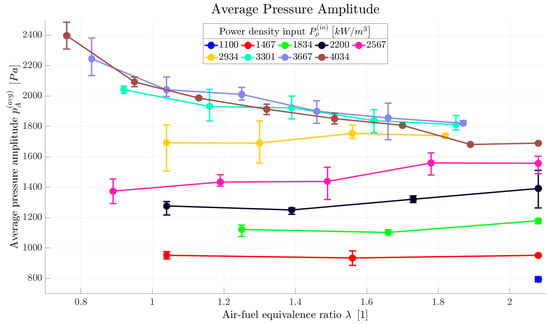
Figure 12.
Average tailpipe pressure amplitude displayed relative to air–fuel equivalence ratio for several power density input values.
The velocity amplitude is the third pulsation reactor characteristic evaluated from the pressure data. Since the velocity amplitude is directly related to the pressure amplitude through relation (9), a graph for the average velocity amplitude looks almost identical to the one for the average pressure amplitude (Figure 12). The curves exhibit the same asymptotic behavior and the effects of density and speed of sound turned out to be negligible in this sense. Such a graph will therefore not be presented here. However, the velocity amplitude in correlation with the mean velocity is worth addressing. The mean velocity is simply calculated from the total mass flow rate. As the density changes depending primarily on the temperature, the mean velocity varies along the tailpipe as well. The mean velocity averaged from the values along the tailpipe, which will here be termed as the average mean velocity, is therefore used in the following evaluation. The dotted lines in Figure 13 show the average mean velocity depending on the air–fuel equivalence ratio for several power density input values. The mean velocity rises with both and , as an increase in any of these values (while keeping the other constant) is reached by an increase of either the air or the gas flow rate (and consequently the total mass flow rate as well). The solid curves in Figure 13 then display the average amplitude and the average mean velocity ratio introduced as
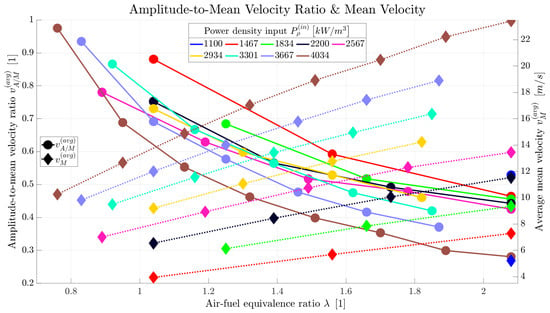
Figure 13.
The average velocity amplitude and the average mean velocity ratio displayed together with the average mean velocity.
Due to the mean velocity appearing in the divisor, the trend for the curves of is opposite to that of - the amplitude-to-mean velocity ratio decreases with . Additionally, since the velocity amplitude either does not change significantly or even decreases with an increasing air–fuel equivalence ratio (same trend as for the pressure amplitude displayed in Figure 12), decreases with even more rapidly. The inverse trend in the mean velocity and the velocity amplitude in connection to the air–fuel equivalence ratio is significant from the perspective of heat (and mass) transfer between the gas stream and the material treated within the PR. The mean velocity determines the residence time, i.e., for how long the reaction (treatment process) takes place. However, primarily, higher velocity amplitude results in a higher Nusselt number and eventually in an intensified (convective) heat transfer [28,29,30,31].
3.2. Temperature Data Results & the Energy Balance
Apart from providing information about the temperature distribution itself, the temperature data allows for the evaluation of heat losses via the energy balance. Both aspects are discussed in this section.
Figure 14 shows an example of the temperature distribution along the tailpipe for one specific value of . As a consequence of heat losses, the temperature gradually decreases along the tailpipe. Secondly, the temperature also decreases with an increasing , as more air needs to be heated up by the same amount of gas. Temperature profiles for the other power density input values look similar.
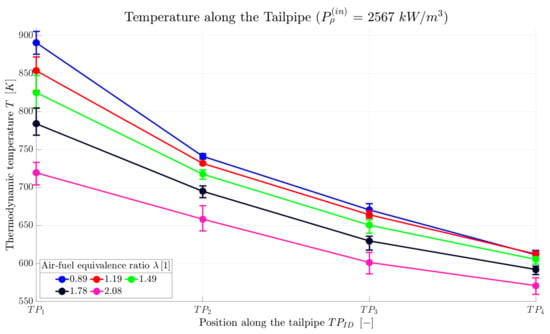
Figure 14.
Temperature along the TP for one specific power density input.
For a comparison across all operation points, Figure 15 shows the average tailpipe temperature, , again displayed relative to for different values of . For a particular power density input; naturally, the temperature is the highest when a stoichiometric mixture is present (). Additionally, the data show that a higher temperature can also be reached by increasing the power density input. Even though the temperature would also reach its maximum at some point, the asymptotic behavior observed for (Figure 8), (Figure 12), and did not manifest itself here.
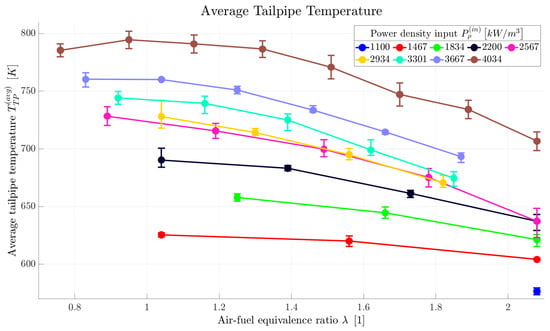
Figure 15.
Average tailpipe temperature displayed relative to air–fuel equivalence ratio for several power density input values.
From the perspective of the temperature in the reaction zone, i.e., in the tailpipe, heat losses play a significant role, as heat loss reduction (e.g., by improving the insulation) leads to higher temperatures and vice versa. However, the heat loss varies depending on other physical conditions as well. The absolute heat loss will naturally increase together with increasing power input. Thus, for the sake of being comparable throughout all operation points, the heat loss is normalized by the effective power input. For the purpose of this publication, this is introduced as the power which would be released by the combustion of the maximum amount of fuel that might potentially burn, which is
Figure 16 shows the total PR heat loss, (calculated according to relation (11)), normalized by displayed relative to for different values of . The relative heat loss decreases with a higher air–fuel equivalence ratio for all values of the power density input. Additionally, higher leads to lower relative heat loss as well. The total relative heat loss was for this specific pulsation reactor generally very high, as the combustion chamber and the tailpipe were both made of glass and no insulation was used.
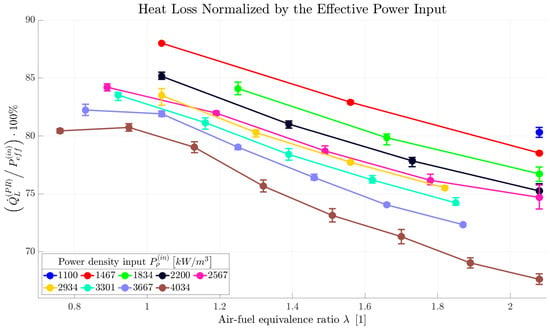
Figure 16.
Total pulsation reactor heat loss normalized by the effective power input displayed relative to air–fuel equivalence ratio for several power density input values.
In addition to the total PR heat loss, its portions corresponding to the combustion chamber and to the tailpipe were both evaluated. In the case of the PR investigated here, the combustion chamber heat loss represented around 80% of the total heat loss for all operation points. However, since this ratio will vary depending on the specific PR (primarily on the combustion chamber and the tailpipe surface areas, amount of insulation, etc.), no conclusion can be drawn from such a finding. Nevertheless, the much higher heat loss through the combustion chamber compared to the tailpipe appears to be plausible, as the radiative heat transfer (corresponding to the fourth power of temperature) is certainly more intense. Additionally, both factors, the total PR relative heat loss and its portion corresponding to the combustion chamber, match with the fact that the gas temperature in the tailpipe is generally very low (much lower than the methane adiabatic flame temperature), even already at location just above the combustion chamber.
It was previously shown that the operation frequency of a pulsation reactor matches very well with the theoretical frequency of a Helmholtz resonator (see Figure 10), which depends almost exclusively on the temperature. Apart from the fuel supply and the used type of fuel, the temperature is determined primarily by the heat losses. Thus, the potential capability of controlling the heat loss would open up additional options for PR operation control. If the PR system is designed in such a way that it allows for adjustable heat loss (e.g., through variable insulation), the operation frequency might be varied in a wider range.
4. Conclusions
A systematic experimental investigation of the effects of fuel supply on a Helmholtz-type pulsation reactor behavior was presented. The work focused on various pulsation reactor characteristics, primarily on its operation frequency, the amplitude of pressure and velocity oscillations, and the tailpipe temperature. Additionally, the total harmonic distortion of the oscillations and the net PR heat loss were investigated as well. The influence of fuel (and air) supply on these characteristics was quantified by the air–fuel equivalence ratio, , and the power density input, . The publication was aiming to provide a compact awareness of the effects of fuel input on the pulsation reactor behavior, focusing primarily on their description. Even though they are believed to be related to the reaction kinetics, a proper physical explanation of the individual characteristics remains open for future (theoretical and numerical) investigations. The main observations are briefly summarized below.
The measurements showed that, rather than on and , the operation frequency of a given PR depends primarily on the temperature. That is in compliance with the Helmholtz resonator model, which assumes a constant temperature in the neck. Thus, the average tailpipe temperature is used here as the determinative one. Moreover, the measured operation frequency was proven to match very well with the theoretical frequency of a Helmholtz resonator, as the relative error was below 4%. This implies that the PR operation frequency can be predicted with reasonable accuracy by this model, especially when the heat losses are correctly estimated. Another novelty of this publication lies in the quantification of the harmonic distortion of the PR oscillations. The results confirm that interpreting such pulsations with a simple sine function, which is standard practice, is well justified and the effects of other harmonics might be neglected. A major distortion was found to be introduced by the decoupler, which might be further minimized by increasing its volume.
It has been shown that for below 3000 /, the pressure amplitude rises together with the power density input. An asymptotic behavior was observed at values higher than this, as an increasing no longer affects . However, the air–fuel equivalence ratio has a significant impact in that area and minimizing leads to an additional increase in pressure amplitude. Since they are closely related, the velocity amplitude, , responds to the fuel supply exactly in the same way as the pressure amplitude does. The temperature increases together with and for each power density input it reaches its maximum around (stoichiometric mixture).
The findings presented in this publication can be utilized for tailoring the process conditions to a particular thermal material treatment process, such as synthesis of materials, drying, etc. The process might be optimized via the tuning of the heat and mass transfer characteristics, for example. In order to intensify the heat (and mass) transfer between the pulsating stream and the material particles, it might be favorable to maximize the power input and run the PR at as low air–fuel equivalence ratio as possible. While keeping the PR design parameters unmodified, such operation parameters will result in the largest oscillation amplitudes, maximum reaction zone temperature and operation frequency, and (for the particular ) largest residence time. The temperature, as well as the operation frequency, might be further increased by improving the insulation. The specific requirements for the PR operation will, however, always depend on the particular treatment process the PR will be applied.
Author Contributions
Conceptualization: S.H. and J.D.; Methodology, investigation, visualization and writing—original draft preparation: J.D.; Writing—review and editing, S.H., J.D. and C.K.; Supervision, project administration and funding acquisition: S.U. and M.B. All authors have read and agreed to the published version of the manuscript.
Funding
The authors would like to thank the Boysen-TU Dresden-Research Training Group and IBU-tec Advanced Materials AG for the financial support that has made this publication possible. The Research Training Group is co-financed by TU Dresden and the Friedrich and Elisabeth Boysen Foundation. Grant number: BOY-135.
Data Availability Statement
Data are available from the corresponding author upon reasonable request.
Acknowledgments
This research is conducted at Technische Universität Dresden as a joint project of Technische Universität Dresden, the Chair of Energy Process Engineering (M. Beckmann) and IBU-tec Advanced Materials AG.
Conflicts of Interest
The authors declare no conflict of interest.
Nomenclature
The following nomenclature is used in this manuscript:
| Arabic | |
| A | Area |
| c | Speed of sound |
| Heat capacity at constant pressure | |
| f | Frequency |
| Operation frequency of the pulsation reactor | |
| Sampling frequency of the pressure sensor | |
| Enthalpy of formation (mass-specific) | |
| Enthalpy flow change | |
| Chemical energy flow change | |
| L | Length |
| Mass flow rate | |
| M | Molar mass |
| p | Pressure |
| Power input | |
| Effective power input | |
| Power density input | |
| Heat loss | |
| r | Specific gas constant |
| t | Time |
| T | Period/thermodynamic temperature |
| Total harmonic distortion | |
| v | Velocity |
| V | Volume |
| Combustion chamber to the tailpipe volume ratio | |
| Normal flow rate | |
| Y | Mass fraction |
| Greek | |
| Heat capacity ratio | |
| Air-fuel equivalence ratio | |
| Density | |
| Mole fraction | |
| Indices | |
| Average | |
| A | Air/amplitude |
| Amplitude-to-mean value ratio | |
| G | Gas |
| Input | |
| M | Mean value |
Abbreviations
The following abbreviations are used in this manuscript:
| Combustion chamber | |
| Combustion-driven oscillations | |
| Discrete Fourier transform | |
| Helmholtz resonator | |
| Operation point | |
| Particle Image Velocimetry | |
| Pulsation reactor | |
| Root mean square | |
| Tailpipe |
References
- Putnam, A.A.; Belles, F.E.; Kentfield, J.A.C. Pulse Combustion. Prog. Energy Combust. Sci. 1986, 12, 43–79. [Google Scholar] [CrossRef]
- Zinn, B.T. Pulse combustion: Recent applications and research issues. Symp. (Int.) Combust. 1992, 24, 1297–1305. [Google Scholar] [CrossRef]
- Plavnik, G. (Ed.) Pulse Combustion Technology. In Proceedings of the 14th Annual North American Waste-to-Energy Conference, North American Waste-to-Energy Conference, Tampa, FL, USA, 1–3 May 2006. [Google Scholar] [CrossRef]
- Klaus, C.; Wegner, K.; Ommer, M. (Eds.) Partikelsynthese im Pulsationsreaktor: Von der Idee zur Produktion. In Proceedings of the 30. Deutscher Flammentag, Hannover-Garbsen, Germany, 28–29 September 2021; pp. 28–29. [Google Scholar] [CrossRef]
- Hoffmann, C.; Ommer, M. Reaktoren für Fluid-Feststoff-Reaktionen: Pulsationsreaktoren. In Handbuch Chemische Reaktoren; Reschetilowski, W., Ed.; Springer Reference Naturwissenschaften; Springer: Berlin/Heidelberg, Germany, 2019; pp. 1–19. [Google Scholar] [CrossRef]
- Klaus, C.; Wegner, K.; Rammelt, T.; Ommer, M. New Challenges in Thermal Processing. Interceram-Int. Ceram. Rev. 2021, 70, 22–25. [Google Scholar] [CrossRef]
- Begand, S. Herstellung nanoskaliger Oxidpulver durch thermisch gesteuerte Synthese in einem Pulsationsreaktor. Ph.D. Thesis, Universität des Saarlandes, Saarbrücken, Germany, 2001. [Google Scholar]
- Heidinger, S.; Spranger, F.; Dostál, J.; Zhang, C.; Klaus, C. Material Treatment in the Pulsation Reactor—From Flame Spray Pyrolysis to Industrial Scale. Sustainability 2022, 14, 3232. [Google Scholar] [CrossRef]
- Mädler, L.; Kammler, H.K.; Mueller, R.; Pratsinis, S.E. Controlled synthesis of nanostructured particles by flame spray pyrolysis. J. Aerosol Sci. 2002, 33, 369–389. [Google Scholar] [CrossRef]
- Meierhofer, F.; Mädler, L.; Fritsching, U. Nanoparticle evolution in flame spray pyrolysis—Process design via experimental and computational analysis. AIChE J. 2020, 66, e16885. [Google Scholar] [CrossRef]
- Heidinger, S.; Unz, S.; Beckmann, M. Simple Particle Relaxation Modeling in One-Dimensional Oscillating Flows. Processes 2022, 10, 1322. [Google Scholar] [CrossRef]
- Heidinger, S.; Unz, S.; Beckmann, M. Heat and Mass Transfer to Particles in One-Dimensional Oscillating Flows. Processes 2023, 11, 173. [Google Scholar] [CrossRef]
- Dec, J.E.; Keller, J.O. Pulse Combustor Tail-Pipe Heat-Transfer Dependence on Frequency, Amplitude, and Mean Flow Rate. Combust. Flame 1989, 77, 359–374. [Google Scholar] [CrossRef]
- Xu, Y.; Dong, P.; Zhai, M.; Zhu, Q. (Eds.) Heat Transfer in Helmholtz-type Valveless Self-excited Pulse Combustor Tailpipe. In Proceedings of the 2012 Asia-Pacific Power and Energy Engineering Conference, Shanghai, China, 26–28 March 2012. [Google Scholar] [CrossRef]
- Dahm, B. A Contribution to Non-Steady Heat Transfer at Particles for Process Optimization of the Schmidt Tube. Ph.D. Thesis, Hochschule für Architektur und Bauwesen Weimar, Weimar, Germany, 1975. [Google Scholar]
- Rayleigh, L.; Strutt, J.W. The Explanation of Certain Acoustical Phenomena. Nature 1878, 18, 319–321. [Google Scholar] [CrossRef]
- Rayleigh, L.; Strutt, J.W. The Theory of Sound; Cambridge University Press: Cambridge, MA, USA, 2011. [Google Scholar] [CrossRef]
- Lieuwen, T.C.; Yang, V. Combustion Instabilities in Gas Turbine Engines: Operational Experience, Fundamental Mechanisms, and Modeling; American Institute of Aeronautics and Astronautics, Inc.: Reston, VA, USA, 2005. [Google Scholar] [CrossRef]
- Uemichi, A.; Kanetsuki, I.; Kaneko, S. Combustion Oscillation in Gas Turbine Combustor for Fuel Mixture of Hydrogen and Natural Gas. In Proceedings of the ASME 2017 Pressure Vessels and Piping Conference, Waikoloa, HI, USA, 16–20 July 2017. [Google Scholar] [CrossRef]
- Meng, X.; de Jong, W.; Kudra, T. A State-of-the-Art Review of Pulse Combustion: Principles, Modeling, Applications and R&D Issues. Renew. Sustain. Energy Rev. 2016, 55, 73–114. [Google Scholar]
- Zinn, B.T. A Theoretical Study of Non-Linear damping by helmholtz resonators. J. Sound Vib. 1970, 13, 347–356. [Google Scholar] [CrossRef]
- Tang, P.K.; Sirignano, W.A. Theory of a Generalized Helmholtz Resonator. J. Sound Vib. 1973, 26, 247–262. [Google Scholar] [CrossRef]
- Ahrens, F.W.; Kartsounes, G.T. Pulse Combustion Technology for Heating Applications: Quarterly Progress Report April-June 1978; Argonne National Lab.: Lemont, IL, USA, 1978. [Google Scholar]
- Panton, R.L.; Miller, J.M. Resonant Frequencies of Cylindrical Helmholtz Resonators. J. Acoust. Soc. Am. 1975, 57, 1533–1535. [Google Scholar] [CrossRef]
- Howe, M.S. On the Helmholtz Resonator. J. Sound Vib. 1976, 45, 427–440. [Google Scholar] [CrossRef]
- Großgebauer, S. Mathematische Modellierung und experimentelle Untersuchung von selbstständig pulsierenden Brennern zur Stoffbehandlung. Ph.D. Thesis, Technische Universität Dresden, Dresden, Germany, 2008. [Google Scholar]
- Zhonghua, W. Mathematical Modeling of Pulse Combustion and its Applications to Innovative Thermal Drying Techniques. Ph.D. Thesis, National University of Singapore, Singapore, 2007. [Google Scholar]
- Ha, M.Y.; Yavuzkurt, S. A Theoretical Investigation of Acoustic Enhancement of Heat and Mass Transfer-I. Pure Oscillating Flow. Int. J. Heat Mass Transf. 1993, 36, 2183–2192. [Google Scholar] [CrossRef]
- Ha, M.Y.; Yavuzkurt, S.; Kim, K.C. Heat Transfer Past Particles Entrained in an Oscillating Flow with and without a Steady Velocity. Int. J. Heat Mass Transf. 1993, 36, 949–959. [Google Scholar] [CrossRef]
- Alassar, R.S.; Badr, H.M.; Mavromatis, H.A. Heat Convection from a Sphere Placed in an Oscillating Free Stream. Int. J. Heat Mass Transf. 1999, 42, 1289–1304. [Google Scholar] [CrossRef]
- Xu, W.; Jiang, G.; An, L.; Liu, Y. Numerical and Experimental Study of Acoustically Enhanced Heat Transfer from a Single Particle in Flue Gas. Combust. Sci. Technol. 2018, 190, 1158–1177. [Google Scholar] [CrossRef]
- PCB Piezotronics. Probe Microphone ICP Model 377B26: Installation and Operating Manual. 2013. Available online: https://www.pcb.com/products?m=377b26 (accessed on 7 September 2022).
- Mondal, S.; Mukhopadhyay, A.; Sen, S. Dynamic Characterization of a Laboratory-Scale Pulse Combustor. Combust. Sci. Technol. 2014, 186, 139–152. [Google Scholar] [CrossRef]
- Faramawy, S.; Zaki, T.; Sakr, A.E. Natural Gas Origin, Composition, and Processing: A review. J. Nat. Gas Sci. Eng. 2016, 34, 34–54. [Google Scholar] [CrossRef]
- Engineering ToolBox. Air-Composition and Molecular Weight. 2003. Available online: https://www.engineeringtoolbox.com/air-composition-d_212.html (accessed on 19 September 2022).
- Kinsler, L.E.; Frey, A.R.; Coppens, A.B.; Sanders, J.V. Fundamentals of Acoustics, 4th ed.; John Wiley & Sons, Inc.: New York, NY, USA, 2000. [Google Scholar]
- McBride, B.J.; Heimel, S.; Ehlers, J.G.; Gordon, S. Thermodynamic Properties to 6000 K for 210 Substances Involving The First 18 Elements; National Aeronautics and Space Administration: Washington, DC, USA, 1963.
- Keller, J.O.; Bramlette, T.T.; Dec, J.E.; Westbrook, C.K. Pulse Combustion: The Importance of Characteristic Times. Combust. Flame 1989, 75, 33–44. [Google Scholar] [CrossRef]
- Keller, J.O.; Bramlette, T.T.; Westbrook, C.K.; Dec, J.E. Pulse Combustion: The Quantification of Characteristic Times. Combust. Flame 1990, 79, 151–161. [Google Scholar] [CrossRef]
- Hongo, I.; Saito, K. Development of Small Twin-Valveless Pulse Combustors: Effect of Injection System. Combust. Sci. Technol. 1993, 94, 43–55. [Google Scholar] [CrossRef]
- Offord, T.; Miller, R.; Dawson, J.; Heffer, J.; Mason, S.; Taylor, M. (Eds.) Improving the Performance of a Valveless Pulse Combustor Using Unsteady Fuel Injection; American Institute of Aeronautics and Astronautics, Inc.: Reston, VA, USA, 2008. [Google Scholar] [CrossRef]
- Xu, Y.; Zhai, M.; Dong, P.; Wang, F. (Eds.) Experimental Research on Operational Characteristics of a Helmholtz-Type ValvelessSelf-Excited Pulse Combustor Self-excited Pulse Combustor. In Proceedings of the 2011 Asia-Pacific Power and Energy Engineering Conference, Wuhan, China, 28–28 March 2011; IEEE: Piscataway, NJ, USA, 2011. [Google Scholar] [CrossRef]
Disclaimer/Publisher’s Note: The statements, opinions and data contained in all publications are solely those of the individual author(s) and contributor(s) and not of MDPI and/or the editor(s). MDPI and/or the editor(s) disclaim responsibility for any injury to people or property resulting from any ideas, methods, instructions or products referred to in the content. |
© 2023 by the authors. Licensee MDPI, Basel, Switzerland. This article is an open access article distributed under the terms and conditions of the Creative Commons Attribution (CC BY) license (https://creativecommons.org/licenses/by/4.0/).