Article

Mathematical Modeling and Robust Multi-Objective Optimization of the Two-Dimensional Benzene Alkylation Reactor with Dry Gas

Key Laboratory of Smart Manufacturing in Energy Chemical Process, Ministry of Education, East China University of Science and Technology, Shanghai 200237, China
*
Author to whom correspondence should be addressed.
Processes 2022, 10(11), 2271; https://doi.org/10.3390/pr10112271
Submission received: 22 September 2022 / Revised: 24 October 2022 / Accepted: 28 October 2022 / Published: 3 November 2022
(This article belongs to the Special Issue Modelling and Optimization of Chemical Reactors)

Abstract

:
The benzene alkylation reactor using the dry gas is the most significant equipment in the ethylbenzene manufacturing process. In this paper, a two-dimensional homogeneous model is developed for steady state simulation of the industrial multi-stage catalytic reactor for ethylbenzene. The model validation on a practical benzene alkylation reactor shows the model is accurate and can calculate the hot spot temperatures. The composition of dry gas from upstream process varies with the operating conditions, which can cause unexpected hot spots in the reactor and catalyst deactivation. Considering the uncertainty in dry gas composition, a robust multi-objective optimization framework is proposed: first, the back-off in constraints is introduced to the multi-objective optimization problem to hedge against the worst case; then the optimal operating point can be selected using the multi-criteria decision-making. The reactor optimization objectives are maximizing selectivity of ethylene and conversion of ethylbenzene, and the distribution ratios of dry gas are defined as decision variables. Results of robust multi-objective optimization show the selectivity and conversion at the optimal operating point are 90.88% (decreased by 0.24% compared to the practical condition) and 99.94% (increased by 0.72%). Importantly, the proportion of violations of the hot spot constraints decreases from 13.7% of the traditional method to 3.8% by applying the proposed robust multi-objective optimization method.

Graphical Abstract

1. Introduction

Ethylbenzene (EB) is an important chemical material to produce textile fabric, plastics, detergents, etc. Meanwhile, it is also an intermediate in the production of styrene [1]. The output and consumption of global ethylbenzene continue to increase with the improvement of industrial production [2]. Almost all ethylbenzene is converted from the alkylation of benzene and ethylene.
In order to maximize the use of refinery resources, ethylene in dry gas from fluid catalytic cracking (FCC) process has been one of the main raw materials of ethylbenzene. The FCC process produces a large amount of dry gas, which contains 10–30% ethylene [3,4]. The recovery of ethylene in dry gas is of great significance to resource utilization and environmental protection. Some studies were carried out on the process development and optimization of dry gas to ethylbenzene. Chen et al. [5] has developed five generations process technologies of dry gas to ethylbenzene. With each generation of technology update, different processes or technical combinations are adopted to improve the life of the catalyst and the selectivity of ethylbenzene. Zhu et al. [6] designed a new process for producing ethylbenzene from FCC dry gas by combining gas phase alkylation and liquid phase transalkylation. Through optimizing the operating conditions of the reactor, the ethylbenzene selectivity can be increased from about 90% to more than 99%. Liu et al. [7] used dilute ethylene, benzene, and transalkylation streams as reactor feeds to improve ethylbenzene selectivity. In the reactor, liquid benzene and gaseous benzene can coexist, so that the alkylation process and the transalkylation process can occur simultaneously. Qian et al. [8] have studied catalyst deactivation in dry gas to ethylbenzene reactor. A catalyst deactivation model was established based on the on-site data and those from laboratory analysis. The real-time online dynamic simulation of the reactor is carried out, which can provide timely and reasonable guidance for the equipment operators.
However, the reactor models in the process optimization have been simplified, which may lead to deviations in temperature and composition. Therefore, it is necessary to study the model and optimal operation of the alkylation reactor, which is the critical equipment in the ethylbenzene manufacturing process [9]. Hamid et al. [10] developed a one-dimensional alkylation and transalkylation reactor model for the factory, which provided a basis for subsequent optimization. Ivashkina et al. [11] established a mathematical model for the liquid-phase benzene alkylation batch reactor to study the influence of heavy hydrocarbon concentration on catalyst activity. Additionally, through optimization, the impact of catalyst deactivation can be offset by adjusting operating conditions.
All aforementioned studies on the reactor consider the case of pure ethylene as a raw material. However, the open literature lacks studies on dry gas based ethylbenzene reactors. The dry gas comes from the catalytic cracking unit, which contains many impurities. Additionally, the composition of the dry gas can vary depending on the cracking process. Uncertainty in dry gas composition can lead to unexpected hot spots, which can result in catalyst deactivation. Hot spot constraint violations can be avoided by optimizing the operating conditions. To address hot spot constraint violations under feed uncertainty, a back-off to the hot spot constraints has been introduced and validated [12,13]. In order to address the above problems, in this work, a two-dimensional alkylation multistage reactor model is developed to simulate the process of benzene with dry gas to ethylbenzene. A two-dimensional reactor model can more accurately describe the hotspots within the reactor [14]. The model consists of energy and mass balances considering the radial transfer and hyperbolic reaction kinetics. In addition, the Soave–Redlich–Kwong equation of state (SRK-EoS) is used to calculate the physical properties of the mixture to improve the model accuracy. Considering the hot spot constraint violations, a robust multi-objective optimization framework is proposed: the strategy of introducing back-off [15] in constraints is combined with the multi-objective optimization algorithm to hedge against the worst case, and then multi-criteria decision-making (MCDM) [16] is introduced to select the optimal operating point. The reactor optimization objectives considered are maximizing selectivity of ethylene and conversion of ethylbenzene. Additionally, the distribution ratios of dry gas are defined as decision variables, which are important operating conditions for the performance of the reactor.
The key contributions of this paper are listed below:
  • A two-dimensional homogeneous alkylation reactor model is established to describe a dry gas-based ethylbenzene production process. This model can obtain the temperature distribution in the reactor, and then observe the hot spots.
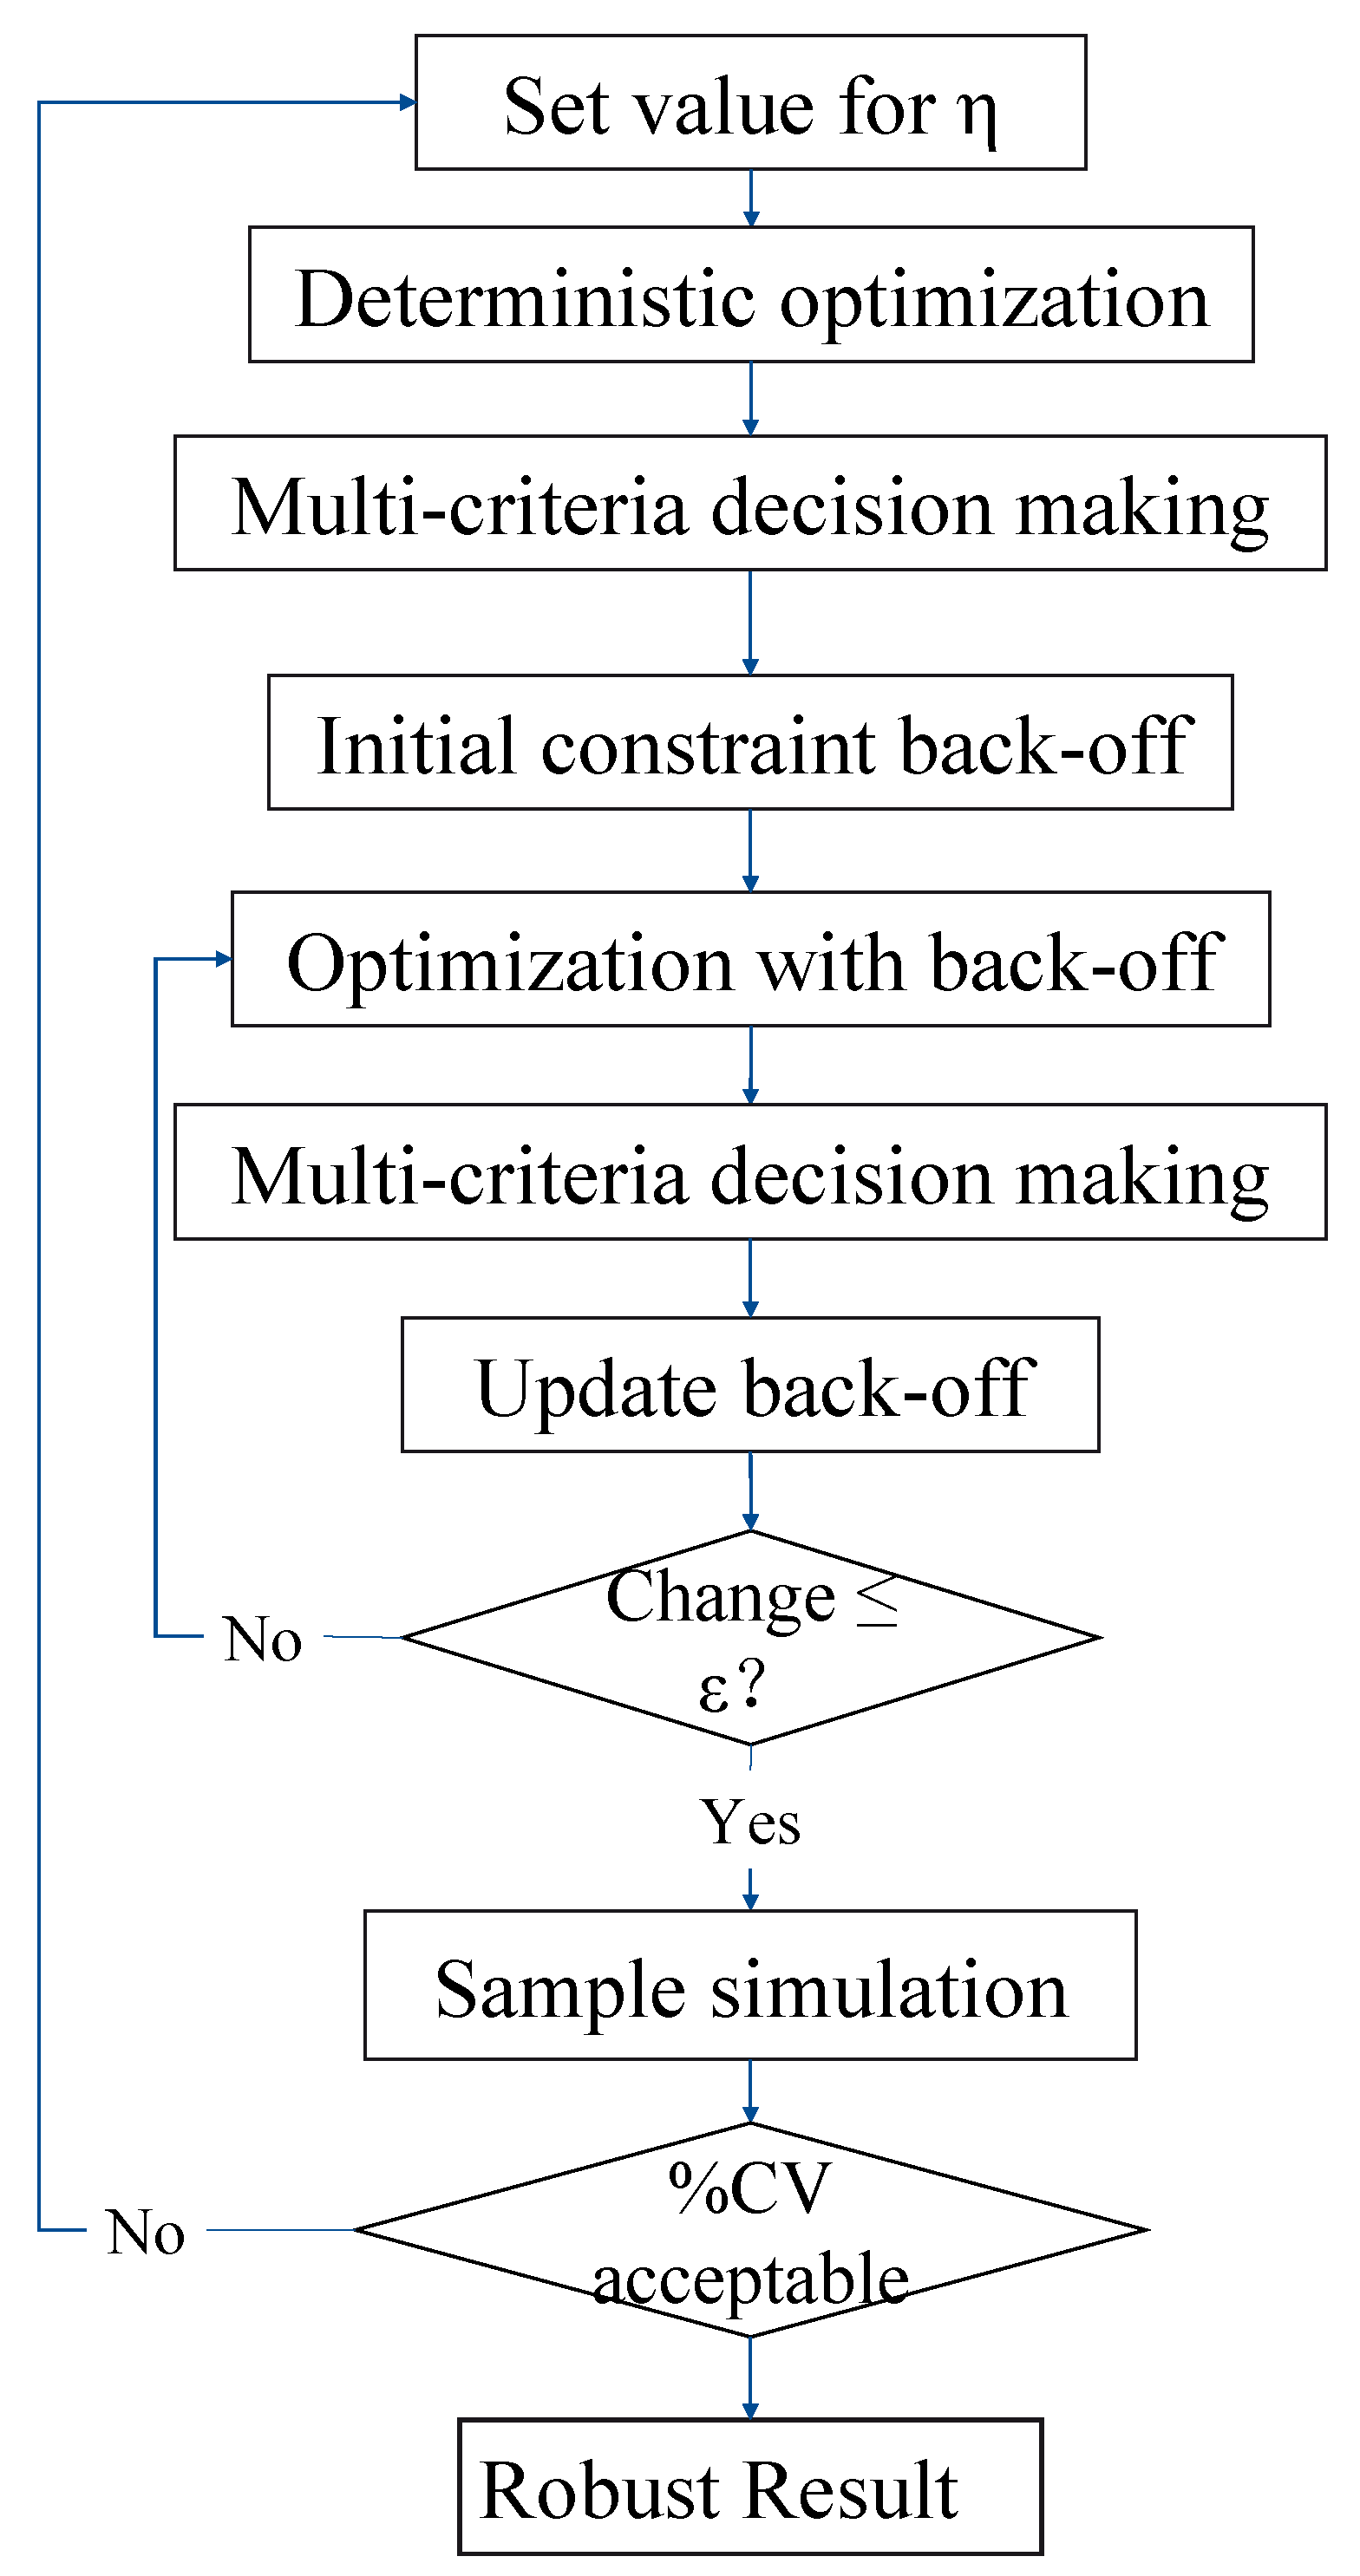
  • A robust multi-objective optimization framework is proposed by combining back-off in constraints, multi-objective optimization algorithm and multi-criteria decision-making. The proposed framework can effectively handle the hotspot temperature violation caused by uncertain dry gas composition.
  • The effectiveness of the proposed robust multi-objective optimization framework is verified through an industrial case study.
The rest of the paper is organized as follows. Section 2 presents the process description and detailed information on the process simulation. In Section 3, model equations, as well as physical properties, parameter calculation methods are introduced. Section 4 illustrates the optimization problem and the robust multi-objective optimization method. The reactor model validation and robust multi-objective optimization results are provided in Section 5. Finally, the conclusions are drawn in Section 6.

2. Industrial Process

The reactor studied is based on a practical alkylation reactor consisting of a five-stage adiabatic fixed bed. The first four stages are used as the bed of the main reaction zone. The fifth stage is used to ensure the complete conversion of ethylene at the outlet of the reactor. Dry gas enters the reactor from the inlet of the first four stages according to certain ratios. Therefore, the high concentrations of ethylene and ethylbenzene will not coexist, which will avoid the progress of side reactions. The alkylation reaction is a strongly exothermic reaction. However, a high temperature will cause the catalyst to deactivate [17]. The staged entry of dry gas can keep the temperature in the reactor within a certain range. Figure 1 shows a simple diagram of the alkylation reactor of EB production.
The gas-phase alkylation of benzene with ethylene for ethylbenzene manufacture is studied in this paper: the main reaction of benzene (BZ) with ethylene (ET) alkylation into ethylbenzene (EB), and the side reactions producing diethylbenzene (DEB). The other side effects are much smaller and, therefore, neglected in this study [18]. Two reactions in Equations (1) and (2) are considered, which describe the overall process.
C 2 H 4 + C 6 H 6 C 8 H 10
C 2 H 4 + C 8 H 10 C 10 H 14
The reaction rates [10] are presented in Equations (3) and (4). Kinetic parameters are obtained by fitting real production data. For non-linear parameter optimization, a pattern search method has been applied. The kinetic coefficients follow the Arrhenius equation with parameters presented in Table 1.
r 1 = k 1 · C E T · C B Z 1 + k E B · C E B
r 2 = k 2 · C E T · C E B
r j is reaction rate for the reaction j in mol · m 3 · s 1 , R is universal gas constant in J · mol 1 · K 1 , T is the absolute temperature in K. C E T , C B Z and C E B represent, respectively, ethylene, benzene, and ethylbenzene concentrations in mol · m 3 .

3. Mathematical Model

The model of the alkylation reactor is composed of three parts, namely physical property calculation, transfer parameters and balance equations. The physical behavior of the mixture includes the residual enthalpy, the residual heat capacity, and the viscosity, which is obtained by the SRK-EoS. The transfer parameters used to describe the radial transfer process are the radial effective thermal conductivity and the effective radial diffusion coefficient. Balance equations are composed of material balance equation and energy balance equation to describe the energy and material change process inside the reactor. In addition to the equations of the reactor, there are also the material balance equations to calculate mixing process between the reactor stages.

3.1. Mixture Behavior with SRK-EoS

The dry gas contains many impurities, and the composition is also uncertain. Therefore, ideal gas behavior is not accurate to describe the thermodynamic properties of the mixture. The SRK-EoS, mainly used in gas and refining processes, is appropriate to describe its thermodynamic properties, which was proposed by Soave to improve the RK-EoS [19]. The equation is expressed as follows.
p = R T ν b a ν ν + b
Meanwhile, the SRK-EoS can also be expressed in the form of a compression factor.
z 3 z 2 + z A B B 2 A B = 0
where A and B are given by Equations (7) and (8).
A = a p / ( R 2 T 2 )
B = b p / R T
Residual variables are calculated to modify the behavior of the mixture by adding residual items in the model. The residual variables used are residual enthalpy and residual heat capacity [20]. The residual enthalpy of mixture, h R , can be calculated as:
h R R T = z 1 ln 1 + B z A B + a R T b i y i κ i a c i T r i
where y i is the mole fraction of component i. a c . is the same as defined by Soave. The correlation between κ and the eccentricity factor ω is given by Equation (10).
κ = 0.480+ 1.574ω 0.1715 ω 2
The residual heat capacity of mixture, C p R , can be calculated as:
C p R = R z 1 + R T z T + 1 b T a + a 1 / 2 i y i κ i a c i T r i · 1 2 a ln 1 + B z i y i κ i a c i T r i + B z + T z T z z + B
where z T is calculated as:
z T = B T · T a T 2 a 1 z / B A / a z 2 B z A 3 z 2 2 z + A B B 2
where T a T is given by Equation (13),
T a T = a 1 / 2 i x i κ i a c i T r i

3.2. Transfer Parameter

The radial effective thermal conductivity of fixed reactor is affected by the convection heat exchange of particle and fluid, the heat conduction of particle and fluid and the heat exchanged by radiation. Thermal conductivity of the mixture can be calculated by Equation (14) [21]:
λ f = i = 1 n λ i 1 + j = 1 j i n M j M i 1 3 y j y i
Here, λ i is thermal conductivity of component i in w · m 1 · K 1 . M i is molar mass of component i in g · mol 1 .
The effective thermal conductivity can be calculated by Equation (15) [22]:
λ e r = λ f × 10 0.785 0.057× lg λ s λ f × lg λ s λ f
where λ s is thermal conductivity of catalyst in W · m 1 · K 1 .
The molecular diffusion coefficient for each component i in the multicomponent gas mixture can be obtained by Equation (16) [23]:
D i m = 1 y i j i y j D i j
Here, D i j is the binary molecular diffusion coefficient for component i in component j. The binary molecular diffusion coefficient D i j can be calculated using Equation (17) [24]:
D i j = 0.001 T 1.75 P ( υ ) i 1 / 3 + ( υ ) j 1 / 3 2 1 M i + 1 M j 1 2
where υ is the atomic diffusion volumes in m 3 · mol 1 . The effective radial diffusion coefficient of the component i is calculated as [14]:
D r , i = ( 1 1 ε ) D i m + u z d p 8
Here, ε is the bed void fraction.

3.3. Balances for the Reactor

The continuity equations and energy balance equations are defined considering the system operating in steady-state. The continuity equations for each component follow the basic format presented by Equation (19).
u C i l + D r , i 2 C i r 2 + 1 r C i r = j r i j
Here, u is the fluid velocity only in the flow direction in m · s 1 . C i is concentration of component i. l is the length of the reactor in m. D r , i is the effective radial diffusion coefficient of component i in m 2 · s 1 . r is the radius of the reactor in m. r i j is the rate of generation of component i in reaction j in mol · m 3 · s 1 .
There is a velocity gradient in the reactor. The relationship between the velocity gradient and the radius is as follow [25].
u = u max · 1 r R t 1 9
where u max is the maximum flow rate at the center of the reactor. R t is the reactor radius.
Due to the addition of the residual heat capacity, the energy balance equation will add a term F · C p R . The energy balance is expressed by Equation (21).
i F i · C p i + F · C p R T A t l + λ e r 2 T r 2 + 1 r T r = i , j r i j Δ H j
where F i is the molar flow rate of component i in mol · s 1 . C p i is ideal isobaric heat capacity of component i in J · mol 1 · K 1 . T is the reactor temperature in K. A t is reactor cross-sectional area in m 2 . λ e r is effective diffusion coefficient of the reactor in W · m 1 · K 1 . Δ H j is reaction heat of reaction j in J · mol 1 .
The boundary conditions are rewritten as follows:
l = 0 : C i = C i 0 , T = T 0
r = 0 : C i r = 0 , T r = 0
r = d t 2 : C i r = 0 , T r = 0
Here, d t is reactor diameter in m.
Between the stages, the cold shock heat exchange method is used by directly mixing the dry gas with the export materials of the previous stage. The material balance formula is as follows.
F i , p r e + Y k F i , i n i = F i , c u r
F i , p r e , F i , i n i , F i , c u r is the molar flow rate, respectively, of previous stage, dry gas raw material and current stage of component i, Y k is the dry gas ratio of stage k.
Because the temperature of the dry gas feed is lower than the outlet temperature of the stage, the energy balance between stages expressed by Equation (26) is used to find the inlet temperature of the next stage.
h i n i R T i n i + i T i n i T p r e C p i · F i , p r e d T + h p r e R T p r e = i T i n i T c u r C p i · F i , c u r d T + h c u r R T c u r

3.4. Numerical Methods

The alkylation reactor model is composed of Equations (19)–(26), which are a set of coupled, linear partial differential and algebraic equations. The partial differential equations (PDEs) are solved with the method of lines. The radial coordinate is discretized by applying orthogonal collocation. Ordinary differential equations are solved using Runge–Kutta method (ode45) in MATLAB R2020a.

4. Robust Multi-Objective Optimization

The source of dry gas is the upstream catalytic cracking unit. The composition of the dry gas is affected by the catalytic cracking process. Uncertainty in dry gas composition can result in a violation of hot spot temperatures. This causes catalyst deactivation and exacerbates side reactions. A robust multi-objective optimization framework is proposed by introducing the back-off in the constraints of general multi-objective optimization problems. Since the multi-objective algorithm will generate a series of non-dominated solutions, which is not conducive to the iteration of constrained back-off. Multi-criteria decision-making can select a non-dominated solution from the Pareto front for iteration of constrained back-off. This section will introduce the optimization problem, multi-criteria decision-making, and the strategy of constrained back-off in this study.

4.1. Multi-Objective Optimization Problem

This study considers the operating optimization of an existing reactor. The optimization process is to find the best dry gas feed ratios. The size of the reactor, the total amount of feed, and the composition of the feed are all taken under standard conditions (the average value of the plant data). The goals of the multi-objective optimization are to maximize ethylene conversion ( X E T ), and ethylbenzene selectivity ( S E B ):
max S E B = F E B , o u t F E T , i n F E T , o u t
max X E T = F E T , i n F E T , o u t F E T , i n
In Equations (27) and (28), F i , i n is the outlet molar flow rate of component i in mol · s 1 and F i , o u t is the inlet molar flow rate of component i in mol · s 1 .
The decision variables are defined as the distribution ratios of dry gas in the first four stages. The distribution ratios of dry gas are related to the temperature inside the reactor and affect the performance of the reaction, which are a very important operating condition. The decision variable constraints are:
0 < Y k 1
k = 1 Y k = 1
Furthermore, this optimization also subject to the hot spot constraints. Because excessive temperature will aggravate side reaction and reduce the selectivity of ethylbenzene. In addition, the deactivation of the catalyst will be accelerated at high temperature, and the life of the catalyst will be reduced. Frequent catalyst replacement increases production costs and is undesirable. There are the constraints for the temperature of each stage k:
T h o t s p o t , k 658 K
The multi-objective optimization problem of the benzene alkylation reactor with dry gas can be stated as:
max Y k S E B , X E T s . t . Mass and Energy Constraints Equations ( 19 ) ( 26 ) Variables range constraints Equations ( 29 ) and ( 30 ) Temerature constrains of each stage Equation ( 31 )
The non-dominated sorting genetic algorithm II (NSGA-II is used to solve the multi-objective optimization problem. The algorithm NSGA-II is a classic multi-objective optimization algorithm, which is often used for multi-objective optimization of reactor models [26,27].

4.2. Multi-Criteria Decision-Making

Multi-objective optimization will obtain a series of non-dominated solutions, and some studies are devoted to select an optimal solution from them. Here multi-criteria decision-making will be introduced and the specific steps are as follows [28]. The objective matrix is obtained by the optimization method. The target matrix contains m rows and n columns, representing m solutions and n targets, respectively. Common symbols used are f i j , which refers to the value of objective j at the solution i in the objective matrix; F i j is the value of f i j after normalization and w j is the weightage for the objective j.
Step 1. Normalization Methods. The normalization method adopts the vector normalization.
F i j = f i j k = 1 m f k j 2
Step 2. Weighting Methods. The weighting method adopts the entropy method. First, the entropy value of each objective will be calculated, and then the weight of each objective will be determined.
E j = 1 ln ( m ) i = 1 m ( F i j ln F i j )
w j = 1 E j j = 1 n ( 1 E j )
Step 3. Selection Methods. The selection method is the multi-attributive border approximation area comparison. First, the weighted normalization matrix will be constructed, and then the approximate boundary region of each objective will be determined. Finally, the evaluation score of each non-dominated solution will be calculated.
v i j = ( 1 + F i j ) × w j
b j = i = 1 m v i j 1 / m
Q i = j = 1 n ( v i j b j )
Finally, non-dominated solution having the largest Q i is recommended as the optimal solution.

4.3. Robust Optimization Method

A robust optimization method by introducing a back-off to the hot spot constraints has been applied and verified in reactor optimization under uncertainty [29]. Hence, the hot spot constraints Equation (39) will be modified to:
T h o t s p o t , k ( θ ) + b g 658 K
where θ is the vector of n θ uncertain parameters, b is a back-off for the hot spot constraints. The back-off is given according to Srinivasan et al. [30] as:
b g = η σ T h o t s p o t , k ( θ )
where η is a positive constant and σ T h o t s p o t , k ( θ ) is the variance of the hot spot constraints of stage k. Scalar η can be minorly adjusted for different robustness. The reactor is simulated for each sample of uncertain parameters to obtain the hot spot temperature. The expectation and variance of the hot spot constraints can be approximately obtained as:
μ T h o t s p o t , k ( θ ) 1 N i = 1 N T h o t s p o t , k ( θ i )
σ T h o t s p o t , k ( θ ) 1 N 1 i = 1 N T h o t s p o t , k ( θ i ) μ T h o t s p o t , k ( θ i ) 2
where N is the number of samples.
The proposed robust multi-objective optimization framework is shown in Figure 2. First the value of the scalar η is set. Multi-objective optimization of the model under standard conditions can obtain the Pareto front. Multi-criteria decision making is used to select a solution in the Pareto front and the solution is the deterministic multi-objective optimization result. Through the Equations (40)–(42), the back-off of the temperature constraints are calculated. Then, the multi-objective optimization problem with constraints including the back-off is repeated until a suitable back-off value is obtained. Finally, samples of uncertain dry gas composition over a one-year period collected from an actual plant are used to calculate the proportion of violating the constraints (%CV) in the sample simulation part. The robust multi-objective optimization result will be obtained with an acceptable proportion of violation, otherwise the value of the scalar η will be adjusted.

5. Results and Discussion

5.1. Model Validation

The existing alkylation reactor dimensions and constant feed variables collected from the industry are presented in Table 2. Five operating conditions of the actual device are randomly selected to verify numeric solution consistency. The material flow data of these five cases are shown in Table 3. The standard case takes the average value of the factory data.
Five case studies on the developed two-dimensional reactor model are performed and the test results are presented in Table 4. The model results of product mass fraction are in good agreement with actual device data, which made the model suitable for performance improvement study. Although the temperature has a deviation of a few degrees, it is within the acceptable range.

5.2. Temperature Distribution of the Reactor

The reactor is simulated at the standard operating conditions with the reactor constant parameters and material flow presented in Table 2 and Table 3 to calculate the temperature distribution of each stage of the reactor, which is shown in Figure 3.
As the reaction progresses, the temperature in the reactor gradually increases. Because raw dry gas enters between stages, the reactor is cooled by cold shock. Side reaction and catalyst life are both affected by reactor temperature. In each stage of the reactor there will be a hot spot in the center of the reactor. At hot spots, the above two phenomena are more obvious. In adiabatic reactors, the presence of hot spots is mainly due to velocity gradients in the reactor. The velocity of the fluid in the center of the reactor is the fastest, so the hot spots appear in the center of the reactor.

5.3. Robust Multi-Objective Optimization

The Pareto preface of the robust multi-objective optimization is obtained as Figure 4a. The obtained non-dominated solutions are in the range of 90.87% to 91.02% for selectivity, and 99.0% to 99.9% for conversion. The deterministic multi-objective optimization results are shown in Figure 4b. The obtained non-dominated solutions are in the range of 90.95% to 91.8% for selectivity, and 86.9% to 99.9% for conversion. Therefore, the addition of hot spot temperature back-off decreases the number of feasible solutions, making the Pareto front shorter. Table 5 lists the standard condition and optimal solutions selected by multi-criteria decision-making. The optimization results show that the first three-stage dry gas feed is more advantageous than the four-stage dry gas feed. Meanwhile, the conversion of the reactor is higher when there is more dry gas feed at the front end of the reactor. This is because the residence time of dry gas becomes longer in that case. When the distribution ratios of dry gas are more uniform, the selectivity of the reactor is higher. This avoids the coexistence of ethylbenzene and higher concentrations of ethylene, causing side reactions to become significant.
Next, the optimized dry gas distribution ratios of the robust and deterministic multi-objective optimization result are applied in the 262 real conditions, and the sample simulations are performed to demonstrate the robustness of the proposed method using the proportion of violating the constraints. In the case of different optimization results, the violation of temperature constraints is shown in Figure 5. In the figure, (a) represents the sample simulation under robust multi-objective optimization results, and (b) represents the sample simulation under deterministic multi-objective optimization results. The proportion of temperature constraint violations decreases from 13.7% to 3.8% under the proposed robust multi-objective optimization method. Therefore, the reactor will be more stable applying the optimal operating condition obtained by the proposed method.

6. Conclusions

In this paper, a two-dimensional homogeneous model is developed and implemented in Matlab, for steady state simulation of an industrial multi-stage catalytic reactor for ethylbenzene. Through the validation procedure, it is proven that the developed model is accurate. The establishment of a two-dimensional reactor model can calculate the hot spots inside the reactor. The hot spots appear in the center of the reactor. A robust multi-objective optimization method is proposed by introducing a back-off to the hot spot constraints, which can drastically reduce constraint violations and provide a trade-off of conversion and selectivity. The distribution ratios of dry gas are defined as decision variables, which is related to the temperature inside the reactor and affects the performance of the reaction. After robust multi-objective optimization, the robust result is obtained. The ratios of the first four stages of dry gas are, respectively, 0.7438, 0.2234, 0.0325, and 0.0003. The conversion and selectivity can be, respectively, achieved as 99.94% and 90.88%. In addition, robust optimization methods reduce the impact of dry feed composition uncertainty. Compared with the general optimization method, the robust optimization results show that the proportion of temperature constraint violations decreases from 13.7% to 3.8%.

Author Contributions

Conceptualization, Z.Y. and W.D.; Data curation, M.Y.; Methodology, Z.Y. and W.D.; Validation, M.Y.; Writing—original draft, M.Y.; Writing—review and editing, F.S. and W.D. All authors have read and agreed to the published version of the manuscript.

Funding

This research was funded by the National Natural Science Fund for Distinguished Young Scholars (61725301), National Natural Science Foundation of China (22178103, 62073142), Fundamental Research Funds for the Central Universities and Shanghai AI Lab.

Conflicts of Interest

The authors declare no conflict of interest.

Abbreviations

The following abbreviations are used in this manuscript:
BZBenzene
DEBDiethylbenzene
EBEthylbenzene
ETEthylene
FCCFluid Catalytic Cracking
MCDMMulti-Criteria Decision-Making
PDEsPartial Differential Equations
SRK-EoSSoave–Redlich–Kwong Equation of State

References

  1. Shen, Z.; Ma, C.; Wang, D.; He, J.; Sun, H.; Zhu, Z.; Yang, W. Shape-selective alkylation of benzene with ethylene over a core-shell ZSM-5@MCM-41 composite material. Chin. J. Chem. Eng. 2021, 37, 64–71. [Google Scholar] [CrossRef]
  2. Yang, W.; Wang, Z.; Sun, H.; Zhang, B. Advances in development and industrial applications of ethylbenzene processes. Chin. J. Catal. 2016, 37, 16–26. [Google Scholar] [CrossRef]
  3. Vogt, E.T.C.; Weckhuysen, B.M. Fluid catalytic cracking: Recent developments on the grand old lady of zeolite catalysis. Chem. Soc. Rev. 2015, 44, 7342–7370. [Google Scholar] [CrossRef] [Green Version]
  4. Melero, J.A.; Iglesias, J.; Garcia, A. Biomass as renewable feedstock in standard refinery units. Feasibility, opportunities and challenges. Energy Environ. Sci. 2012, 5, 7393–7420. [Google Scholar] [CrossRef]
  5. Chen, F.; Zhu, X.; Xie, S.; Zeng, P.; Guo, Z.; An, J.; Wang, Q.; Liu, S.; Xu, L. Technology development of ethylbenzene production from catalytic dry-gas. Chin. J. Catal. 2009, 30, 817–824. [Google Scholar]
  6. Zhu, X.; Chen, F.; An, J.; Zeng, P.; Xu, L. Development and industrialization of the ethylbenzene production technologies from dilute ethylene in FCC dry gas. Adv. Mater. Res. 2011, 1708–1713. [Google Scholar] [CrossRef]
  7. Liu, S.; Chen, F.; Xie, S.; Zeng, P.; Du, X.; Xu, L. Highly selective ethylbenzene production through alkylation of dilute ethylene with gas phase-liquid phase benzene and transalkylation feed. J. Nat. Gas Chem. 2009, 18, 21–24. [Google Scholar] [CrossRef]
  8. Xinhua, Q.; Shiyang, J.; Xing, S.; Yue, C.; Kefeng, W.; Pingjing, Y. Adaptive On-line Operation Guide for Dry Gas-to-ethylbenzene Reactor. Chin. J. Chem. Eng. 2010, 18, 419–424. [Google Scholar]
  9. Ebrahimi, A.N.; Sharak, A.Z.; Mousavi, S.A.; Aghazadeh, F.; Soltan, A. Modification and optimization of benzene alkylation process for production of ethylbenzene. Chem. Eng. Process. Process Intensif. 2011, 50, 31–36. [Google Scholar] [CrossRef]
  10. Hamid, G.; Ahari, J.S.; Farshi, A.; Kakavand, M. Modelling and Simulation of Benzene Alkylation Process Reactors for Production of Ethylbenzene. Pet. Coal 2004, 46, 55–63. [Google Scholar]
  11. Ivashkina, E.; Khlebnikova, E.; Dolganova, I.; Dolganov, I.; Khroyan, L.A. Mathematical Modeling of Liquid-Phase Alkylation of Benzene with Ethylene Considering the Process Unsteadiness. Ind. Eng. Chem. Res. 2020, 59, 14537–14543. [Google Scholar] [CrossRef]
  12. Rossner, N.; Heine, T.; King, R. Quality-by-Design Using a Gaussian Mixture Density Approximation of Biological Uncertainties. IFAC Proc. Vol. 2010, 43, 7–12. [Google Scholar] [CrossRef] [Green Version]
  13. Telen, D.; Vallerio, M.; Cabianca, L.; Houska, B.; Van Impe, J.; Logist, F. Approximate robust optimization of nonlinear systems under parametric uncertainty and process noise. J. Process Control 2015, 33, 140–154. [Google Scholar] [CrossRef]
  14. Paixao, V.P.; Franco, L.F.M.; D’Angelo, J.V.H. Simulation and Design of a Water-Gas Shift Catalytic Multitubular Reactor with Integrated Heat Exchange. Ind. Eng. Chem. Res. 2020, 59, 21429–21438. [Google Scholar] [CrossRef]
  15. Xie, X.; Schenkendorf, R. Robust Process Design in Pharmaceutical Manufacturing under Batch-to-Batch Variation. Processes 2019, 7, 509. [Google Scholar] [CrossRef] [Green Version]
  16. Wierzbicki, A.P. The Use of Reference Objectives in Multiobjective Optimization; Springer: Berlin/Heidelberg, Germany, 1980; pp. 468–486. [Google Scholar]
  17. Raj, K.J.A.; Malar, E.J.P.; Vijayaraghavan, V.R. Shape-selective reactions with AEL and AFI type molecular sieves alkylation of benzene, toluene and ethylbenzene with ethanol, 2-propanol, methanol and t-butanol. J. Mol. Catal. A Chem. 2006, 243, 99–105. [Google Scholar] [CrossRef]
  18. Qi, Z.W.; Zhang, R.S. Alkylation of benzene with ethylene in a packed reactive distillation column. Ind. Eng. Chem. Res. 2004, 43, 4105–4111. [Google Scholar] [CrossRef]
  19. Soave, G.T. Equilibrium constants from a modified Redlich-Kwong equation of state. Chem. Eng. Sci. 1972, 27, 1197–1203. [Google Scholar] [CrossRef]
  20. Li, Z. Derivation of Deviation Function of Constant Pressure and Heat Capacity by Equation of State Method. Shiyou Yu Tianranqi Huagong 1987, 4, 55–59. [Google Scholar]
  21. Liu, Y.; Wu, Y.; Xu, Z.; Zhu, Z. Study on Effective Thermal Conductivity of Fixed Bed. J. East China Univ. Sci. Technol. 2004, 30, 130–134. [Google Scholar]
  22. Tong, J. Viscosity and thermal conductivity of gaseous and liquid mixtures. Chem. Eng. 1977, 6, 66–84. [Google Scholar]
  23. Fairbanks, D.F.; Wilke, C.R. Diffusion Coefficients in Multicomponent Gas Mixtures. Ind. Eng. Chem. 1950, 42, 471–475. [Google Scholar] [CrossRef]
  24. Fuller, E.N.; Schettler, P.D.; Giddings, J. A new method for prediction of binary gas-phase diffusion coefficients. Ind. Eng. Chem. 1966, 58, 18–27. [Google Scholar] [CrossRef]
  25. Guoa, C.Q.; Zhanga, C.H.; Païdoussis, M.P. Modification of equation of motion of fluid-conveying pipe for laminar and turbulent flow profiles. J. Fluid. Struct. 2010, 26, 793–803. [Google Scholar] [CrossRef]
  26. Yee, A.K.Y.; Ray, A.K.; Rangaiah, G.P. Multiobjective optimization of an industrial styrene reactor. Comput. Chem. Eng. 2003, 27, 111–130. [Google Scholar] [CrossRef]
  27. Liu, C.; Wang, H.; Tang, Y.; Wang, Z. Optimization of a Multi-Energy Complementary Distributed Energy System Based on Comparisons of Two Genetic Optimization Algorithms. Processes 2021, 9, 1388. [Google Scholar] [CrossRef]
  28. Wang, Z.; Parhi, S.S.; Rangaiah, G.P.; Jana, A.K. Analysis of Weighting and Selection Methods for Pareto-Optimal Solutions of Multiobjective Optimization in Chemical Engineering Applications. Ind. Eng. Chem. Res. 2020, 59, 14850–14867. [Google Scholar] [CrossRef]
  29. Koller, R.W.; Ricardez-Sandoval, L.A.; Biegler, L.T. Stochastic back-off algorithm for simultaneous design, control, and scheduling of multiproduct systems under uncertainty. AlChE J. 2018, 64, 2379–2389. [Google Scholar] [CrossRef]
  30. Srinivasan, B.; Bonvin, D.; Visser, E.; Palanki, S. Dynamic optimization of batch processes: II. Role of measurements in handling uncertainty. Comput. Chem. Eng. 2003, 27, 27–44. [Google Scholar] [CrossRef]
Figure 1. The alkylation reactor of EB production.
Processes 10 02271 g001
Figure 2. Schematic diagram of the proposed robust multi-objective optimization method.
Processes 10 02271 g002
Figure 3. The temperature distribution of each stage of the reactor. (a) Temperature distribution of the first stage, (b) Temperature distribution of the second stage, (c) Temperature distribution of the third stage, (d) Temperature distribution of the fourth stage, (e) Temperature distribution of the fifth stage.
Processes 10 02271 g003
Figure 4. Pareto front of the selectivity and conversion. (a) Robust multi-objective optimization results, (b) Deterministic multi-objective optimization results.
Processes 10 02271 g004
Figure 5. The sample simulation under different results. (a) Cases under robust multi-objective optimization results, (b) cases under deterministic multi-objective optimization results.
Processes 10 02271 g005
Table 1. Kinetic parameters for reactions.
CoefficientExpression
k 1 207 . 8 exp 61,206 / R / T
k 2 33 . 5 exp 51,449 / R / T
k E B 23 exp 438,512 / R / T
Table 2. Reactor constant parameters.
ParameterValue
Reactor diameter , m 3
Catalyst filling length in each reactor stage , m 4.2
Dry gas temperature , K 292.65
Dry gas pressure , pa 0.86× 10 6
Benzene temperature , K 628.95
Benzene pressure , pa 0.78× 10 6
Pressure inside the reactor , pa 0.699× 10 6
Table 3. Reactor constant parameters.
ParameterCase 1Case 2Case 3Case 4Case 5Standard
Benzene flow , mol · s 1 250.6240.5234.7250.2282.6260.3
Dry gas flow , mol · s 1 187.6194.8171.4186.4200.4196.7
Dry gas Composition , %(mole)
C H 4 27.77525.97327.26727.76529.08327.770
C 2 H 6 8.7147.9558.6559.0089.2448.646
C 2 H 4 26.19725.22928.6626.35524.52125.22
C 3 H 8 0.0040.0040.0050.0040.0050.005
C 3 H 6 0.030.0280.020.0310.0340.066
C 4 and above 0.0050.010.0140.0030.0050.014
O 2 0.7871.2240.4660.6550.4380.664
N 2 7.5378.8246.927.2395.6456.969
C O 2 0.4420.4060.481.0570.4980.572
C O 0.5170.5410.5470.550.5570.495
H 2 27.99229.80626.96627.33329.9729.579
Dry gas distribution ratio
first stage 0.22780.21830.22250.22950.22860.2274
sec ond stage 0.24690.25890.24180.24060.25450.2524
third stage 0.27210.27490.28110.28080.26830.2710
fourth stage 0.25320.24790.25460.24910.24860.2492
Table 4. Reactor model test results.
Item Output Temperature, KProduct Mass Fraction, % (Mass)
C 6 H 6 C 8 H 10 C 10 H 14
Case 1Unit657.076.8120.442.75
Model658.676.9020.252.85
Case 2Unit656.975.9521.112.94
Model655.676.1120.823.07
Case 3Unit658.275.5921.722.69
Model663.175.4821.33.22
Case 4Unit654.076.3320.922.75
Model658.776.8620.282.86
Case 5Unit657.278.9918.592.42
Model656.779.2718.462.27
Table 5. Standard condition and multi-objective optimization results.
ItemDry Gas Distribution Ratios S EB X ET
Stage 1Stage 2Stage 3Stage 4
Standard condition0.22790.24690.27210.253291.119199.2150
Deterministic optimization results0.52080.30100.11760.000590.981299.8900
Robust optimization results0.74380.22340.03250.000390.880299.9372
Publisher’s Note: MDPI stays neutral with regard to jurisdictional claims in published maps and institutional affiliations.

