Abstract
Pulmonary Fibrosis (PF) is a non-curable chronic lung disease. Therefore, a quick and accurate PF diagnosis is imperative. In the present study, we aim to compare the performance of the six state-of-the-art Deep Transfer Learning techniques to classify patients accurately and perform abnormality localization in Computer Tomography (CT) scan images. A total of 2299 samples comprising normal and PF-positive CT images were preprocessed. The preprocessed images were split into training (75%), validation (15%), and test data (10%). These transfer learning models were trained and validated by optimizing the hyperparameters, such as the learning rate and the number of epochs. The optimized architectures have been evaluated with different performance metrics to demonstrate the consistency of the optimized model. At epoch 26, using an optimized learning rate of 0.0000625, the ResNet50v2 model achieved the highest training and validation accuracy (training = 99.92%, validation = 99.22%) and minimum loss (training = 0.00428, validation = 0.00683) for CT images. The experimental evaluation on the independent testing data confirms that optimized ResNet50v2 outperformed every other optimized architecture under consideration achieving a perfect score of 1.0 in each of the standard performance measures such as accuracy, precision, recall, F1-score, Mathew Correlation Coefficient (MCC), Area under the Receiver Operating Characteristic (ROC-AUC) curve, and the Area under the Precision recall (AUC_PR) curve. Therefore, we can propose that the optimized ResNet50v2 is a reliable diagnostic model for automatically classifying PF-positive patients using chest CT images.
1. Introduction
Pulmonary fibrosis is a chronic progressive interstitial lung disease that causes permanent damage to the lung, affecting normal lung function and eventually leading to death [1]. Currently, the pathogenesis of PF needs to be discovered, and it is impossible to be cured. Therefore, the essential purpose of treating this disease is to control and slow down the deterioration and progress of PF and thereby prolong the life of patients. For conditions like PF, an earlier diagnosis and early interventional treatment are of great significance in increasing the survival time of PF patients. Therefore, a quick and accurate PF diagnosis is imperative [2]. Clinically diagnosing PF involves lung function tests, tissue biopsy, and imaging. The accuracy of diagnosing PF using lung imaging techniques relies on the relevant precision of the radiology imaging equipment.
Moreover, the experience and knowledge of the radiologist and clinicians are also limiting factors in the diagnosis of PF using imaging techniques. Even for the same cases, different pulmonologists have different diagnostic decisions on this disease [3,4]. In clinical practice, the diagnosis of PF using a chest X-ray examination is one of the most cost-effective and standard medical imaging examinations. In critical cases, computed tomography (CT) runs a series of body scans that are pooled to generate a three-dimensional X-ray image that is analyzable using a computational device to confirm the diagnosis performed using X-ray images. Multiple CT scans are required for lung diseases that develop rapidly, such as PF. Therefore, CT scans are exceedingly costly, time-demanding, and perhaps harmful to the patient as they use radiation.
Therefore, there is a diagnostic call for an artificial intelligence-based decision system capable of rapid and accurate classification and detection of PF. Implementing AI in PF diagnostics includes applying deep learning (DL) to make predictions from medical images by extracting features (relevant information) such as shape and three-dimensional rotation from the human chest images. The DL consists of a multi-layer image learning architecture. The input images stimulate the initial layer of neurons via a sensor, which sequentially enables the subsequent layer using complex connections. The individual layers in DL architecture process the input images in a non-linear fashion, producing a progressively intricate schema of image classification and detection [5,6]. Object detection in a convolutional neural network (CNN) involves transmitting information across multiple convolutional layers, enabling the detection of patterns such as lines, corners, and edges to shape and, finally, the object. The final layer predicts the image class possibilities, defining the most relevant and informative feature class [7].
In this context, deep transfer learning-based methods are a popular way to generate image representations and have been used in medical image analysis [8]. In transfer learning, a deep, pre-trained CNN model’s remarkable feature extraction competence can be transferred by fine-tuning the network on the target dataset for several epochs. These pre-trained models avoid overfitting when trained on the smaller target image dataset, as the CNN architectures are often pre-trained on large labeled image datasets, including 1000 categories. Therefore, fine-tuning is much faster on a smaller target medical image dataset with fewer categories to classify on a personal computer or standard laptop. With the success of the AlexNet [7], many pre-trained CNN models have been created, namely Dense Network (DenseNet) [9], Visual Geometry Group (VGG) [10], Residual Network (ResNet) [11], Mobile Network (MobileNet) [12], Efficient Network (EfficientNet) [13], Extreme Inception (Xception) [14], Inception Residual Network version 2 (InceptionResNetV2) [15], Residual Network 50 Version 2 (ResNet50v2) [16], etc. In recent years, transfer learning has progressed to the extent that it can be used in various fields, such as biometrics [17], cloud computing [18], renewable energy [19], agriculture [20], and health [21]. Recently, many researchers have developed many systems based on deep transfer learning and machine learning in medical imaging to diagnose various human ailments, certifying smart healthcare automatically.
In this context, an efficient novel CGENet (COVID-19 Graph Extreme learning machine Network) tool to assist COVID-19 diagnosis was developed [22]. First, an optimal backbone selection algorithm was employed to select the best pre-trained transfer learning-based architecture. Then, the optimal backbone architecture was modified into a graph neural network for feature extraction. Finally, extreme machine learning as a classifier was used to classify and detect COVID-19 in the chest CT images. The findings show that the CGENet achieved state-of-the-art classification performance in classifying COVID-19.
Similarly, a deep learning technique based on the combination of a CNN and long short-term memory (LSTM) was developed to efficiently and effectively diagnose COVID-19 automatically from X-ray images [23]. Moreover, Batch normalized AlexNet, an extreme learning machine and chaotic bat algorithm (BN-AlexNet-ELM-CBA), another novel abnormal brain detection technique for magnetic resonance image (MRI), was developed to obtain an enhanced classification accuracy to classify abnormal brains [24]. Experiment results showed that the BN-AlexNet-ELM-CBA method achieved state-of-the-art performance in the brain MRI classification task.
Likewise, deep CNNs have been critical in extracting vital information and pattern recognition that facilitate the prediction and detection of Lung disease [25]. The deep pre-trained transfer learning-based diagnostic tool will accelerate the diagnosis of PF and reliably detect minute details that human vision may miss, which is of immense value to the diagnosis and prognosis of lung patients. Moreover, the objective judgment of a deep pre-trained transfer learning-based decision-making system will have a significant effect on correcting subjective errors by clinicians and radiologists.
In this regard, in our study, the PF disease’s feature was extracted and detected using six popular Deep CNN models, such as VGG-19, DenseNet121, Xception, InceptionResNetV2, ResNet50v2, and InceptionResNetV2, pre-trained on the ImageNet dataset. The chest CT images comprising normal and PF-positive CT images were collected from multiple sources. The structures of the six deep transfer learning model architectures need to be modified as per our dataset. Since there are only two classes of samples (fibrosis and normal images), the dimension of the output vector was set to two, and a sigmoid function was used as classifier activation. The pre-trained models were optimized for the learning rate and the number of epochs. After fine-tuning the optimized models’ hyperparameters on the training and validation data, the best-performing model was selected by comparing the overall accuracy and loss function values. Upon fine-tuning the hyperparameters, the ResNet50v2 model yielded the best accuracy and minimum loss. Therefore, the disease’s features of PF can be easily and quickly detected using the ResNet50v2 model, allowing for a quicker and more accurate diagnosis and detection of fibrosis from the chest CT scan slices. The main contributions and the novel aspects of this study are as follows:
- We applied different intrinsic and extrinsic regularization techniques during the training of the DNN model to decrease the generalization error, thereby avoiding overfitting the model on the training and validation data.
- We have applied on-the-fly augmented image data and active learning using the Augmented Queue method during the training and validation of the transfer learning models to classify PF-positive CT scan images.
- The optimized CNN architectures of the six state-of-the-art pre-trained deep transfer learning models, including VGG-19, DenseNet121, Xception, InceptionResNetV2, ResNet50v2, and InceptionResNetV2, were used to classify PF and Non-PF images to increase the precision of classification and detection of PF using chest CT scan slices.
- The robustness of the pre-trained Deep CNN models was further estimated using accuracy, recall, precision, MCC, F1-score, ROC_AUC, and AUC_PR value on the independent test data.
- Grad-CAM heatmap of the last layer of the best-performing model (ResNet50v2) was generated to represent the region of interest (tissue scarring regions) in PF-positive CT scan slices.
- An improved PF diagnosis system was developed based on hyperparameters optimization, namely learning rate and a maximum number of epochs, to achieve the highest degree of diagnostic accuracy for PF classification using chest CT scan slices.
- The experimental results show that the ResNet50v2 model with optimized hyperparameters achieves higher PF diagnostic accuracy than other Deep CNN models previously published by researchers for analyzing the same problem.
The operating framework of the present study to classify PF images and detect fibrosis regions in PF-positive images is shown in Figure 1. The remainder of the paper is ordered in the following way. Section 2 reviews the performances of the previous research on PF diagnosis using some of the DL-based PF classification and detection methods. Section 3 describes the process of data collection, pre-processing, and procedures related to preparing the image datasets before supplying the data to the pre-trained Deep CNN model. Section 4 covers the details of the chosen pre-trained transfer learning models and their evaluation procedures. Section 5 discusses the experiment finding and compares our results with the other published work. Finally, Section 6 highlights points of our current research findings and makes endorsements for future research.
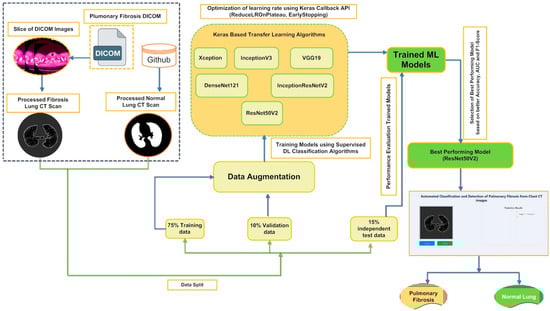
Figure 1.
Workflow outlining the framework for classifying and detecting Pulmonary Fibrosis in chest CT scan slices.
2. Literature Review
The capacity of the deep learning-based CNN model to identify anomalies in chest CT scans and X-ray images has gained importance in the last few years. Deep pre-trained transfer learning CNN architectures are being used to facilitate diagnosis in medical research, and some studies have presented positive and accurate results. The DL approaches used by past researchers to diagnose and detect PF disease are reviewed.
In 2017, the NIH Clinical Center released the chest X-ray 14 dataset, which had more than 100,000 chest X-ray images and the corresponding labels, for use by researchers worldwide [26]. The publicly available chest X-ray 14 dataset contained images of 14 lung diseases, including emphysema and fibrosis. Li et al. [27] used the Inception-ResNet v2 on the chest X-ray 14 dataset to predict lung fibrosis with 93% accuracy. Shamrat et al. [28] classified multiple lung-disease X-ray images that include X-ray images of lung fibrosis collected from various resources, namely GitHub, Kaggle, and NIH Clinical Center, and the detection of various lung diseases, including PF. LungNet22 architecture was proposed based on the primary architecture of the pre-trained VGG16 transfer learning model. An optimization study was performed to determine the optimum value of important hyper-parameters. Using the Adam Optimizer, the proposed model with tuned hyper-parameters yielded a higher accuracy of 99.78% for classifying PF from control normal X-ray images. Souid et al. [29] proposed a modified MobileNet V2, a Deep CNN model, to classify and predict lung pathologies such as PF from the frontal thoracic X-ray images. The paper’s findings show that the authors could classify PF-positive X-ray images with an accuracy of 96.6%, a sensitivity of 47.2%, a specificity to screen the normal chest X-ray images was 99.1%, an F1-score of 65.2%, and AUC value of 0.762. Bharati et al. [30] propose a novel hybrid learning framework named VGG Data spatial transformer network (STN) with CNN (VDSNet) by combining VGG, STN, and data augmentation with CNN. The VDSNet showed a validation accuracy of 73% in classifying lung diseases. Baltruschat et al. [31] compared different DL architectures to classify multi-label Chest X-Ray. The authors reported that X-ray-specific Res-Net-38 produced the best overall results in classifying fibrosis with an AUC value of 80.0 ± 0.9. Li et al. [32] used the ResNetv2 architecture to classify and localize the region of abnormality with only a small amount of fibrosis location information. Kim et al. [33] compared DL with shallow learning (SL) for pattern classification. In their approach, only increasing the number of convolutional layers in the proposed CNN architecture (four convolutional layers and two fully connected layers) significantly enhanced the classification accuracy from 81.27 to 95.12%.
Moreover, the misclassification rate between unclear cases such as HC/RE or NL/EM was also lowered, emphasizing that a higher complexity of DL methods is required for better PF pattern classification. Wang et al. [34] reported with ResNet-50 using the ChestX-ray14 database to classify thoracic diseases such as PF, and testing image data produced an AUC value of 0.7859. Wang et al. [35] proposed a CNN algorithm centered on multi-scale rotation-invariant. The authors used a filter named Gabon that can examine the specific frequency and directions in a confined region, making it similar to the human visual cortex. The proposed algorithm achieved an accuracy of up to 90% for classifying PF patterns, such as GO and MN. Anthimopoulos et al. [36] proposed the first CNN to classify the most common PF patterns (consolidation (CD), micronodules (MN), reticulation (RE), ground glass opacity (GGO), a combination of GGO/reticulation and honeycombing (HC)) from healthy chest CT images (14,696 image patches, derived from 120 CT scans images obtained from various hospitals) attaining accuracy of 85.5%, therefore demonstrating the recognition capacity of CNNs for detecting lung patterns. The performances obtained by the previous investigators by employing various Deep CNN model to classify PF is summarized in Table 1.

Table 1.
A list of related studies on PF classification and their corresponding advantages and limitations.
Therefore, based on the previous studies and their corresponding limitations, as tabulated in Table 1, encouraged us to propose our optimized and improved transfer learning network to automatically classify PF-positive CT scan slices from normal chest CT scan images with the highest degree of diagnostic accuracy.
3. Materials and Methods
3.1. Transfer Learning Pipeline for PF Diagnosis and Detection
The PF disease’s patterns may be quickly and accurately detected using various pre-trained transfer learning Deep CNN models, allowing for a more accurate diagnosis of PF. Therefore, in the present context, the following transfer learning-based methodology has been followed to classify PF images and detect fibrosis regions in PF-positive images.
- The raw chest CT scan Digital Imaging and Communications in Medicine DICOM) image data of PF-positive patients and masked images of normal lungs were collected from multiple data sources and merged into a collective dataset. preprocessing of CT scan images of each class was performed to ensure that both groups of images were on the same scale.
- Image segmentation is executed using TensorFlow and Keras packages that involve:
- Image normalization
- Clustering and image thresholding
- Erosion and Dilation
- Masking of the Region of Interest (ROI)
- Applying masked images to the original lung images
- During the training phase, perform extrinsic (dropout rate) and intrinsic (augmentation and early stopping) regularization techniques to avoid overfitting the models on the training data.
- Due to a limited dataset for each class, a novel augmentation queues method was used to generate more similar images for each category. In addition, to enhance the training data, various transformation strategies, such as flipping, shifting, rotation, zoom, shear transformation, channel shift, and brightness, were used under a specific range.
- Adam’s optimizer was used to optimize the learning rate of the six pre-trained models.
- The performance of the six pre-trained transfer learning models, namely VGG-19, DenseNet121, Xception, InceptionResNetV2, ResNet50v2, and InceptionResNetV2, at an optimized learning rate was compared to screen the best-performing model for classifying PF images from Normal chest CT images. In addition, the accuracy and loss function for each pre-trained model was also used to estimate the performance after training completion of the six transfer learning models.
- To justify the robustness of the model, the pre-trained Deep CNN model’s accuracy, recall, precision, MCC, F1-score, ROC_AUC, and AUC_PR value were estimated on the independent test data.
- Grad-CAM of the last layer of the best-performing model (ResNet50v2) was generated to represent the visual description of fibrosis by the best-performing model.
- The best-performing model performance is compared with other Deep CNN models published previously by researchers for analyzing the same problem (PF images).
Figure 2 demonstrates a comprehensive overview of the proposed framework for screening optimized deep CNN models that will be used to classify and detect PF in chest CT images.
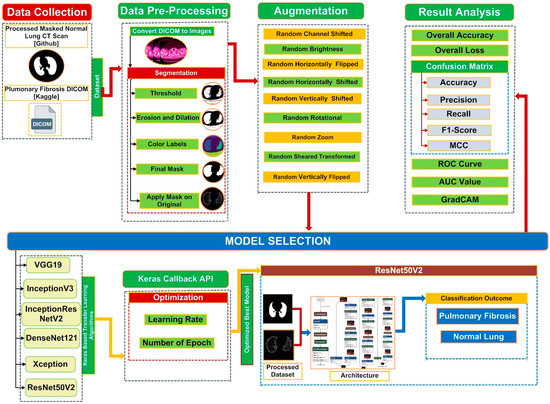
Figure 2.
Illustration to show the main structure of the proposed system to screen optimized deep transfer learning models to classify and detect PF from chest CT images.
Pseudocode of the Proposed Method
To further explain the proposed method to screen optimized deep transfer learning models to classify and detect PF from chest CT images, the following pseudocode is presented in Figure 3:
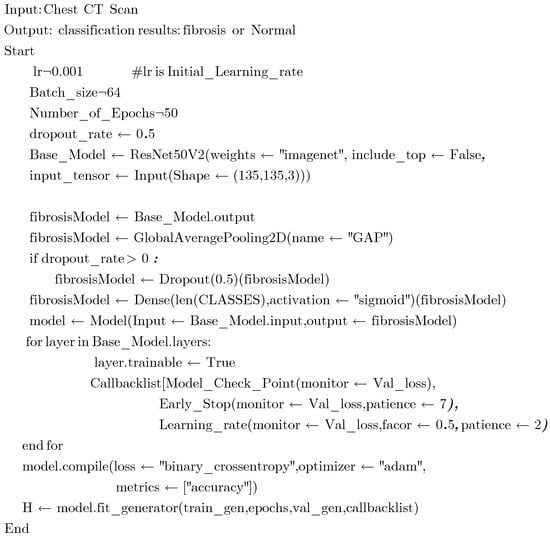
Figure 3.
Pseudocode of the proposed method for screening the best optimized pre-trained transfer learning model for PF diagnosis using chest CT images.
3.2. Dataset
In the study, chest CT scan images were collected from two sources. First, the PF patients’ baseline CT scan images in DICOM format were downloaded from Kaggle (https://www.kaggle.com/code/digvijayyadav/lung-fibrosis-dicom-image-preprocessing/data (assessed on 11 June 2022)). The pre-processed masked normal (control group) chest CT scan images were obtained from GitHub (https://s3.ca-central-1.amazonaws.com/ubccic.covid19.models/L3netDemoData.zip (assessed on 11 June 2022)). The collection consists of two classes of chest CT scan images: control (829 normal images) and Pulmonary Fibrosis (1470 images). A sample of the raw unprocessed image data of each class is shown in Figure 4a,b. The total chest CT scan images were divided into three groups according to 75:15:10 split across the training, validation, and test sets. Table 2 contains information on the distribution of CT scan slices belonging to each class in the training, validation, and test data.
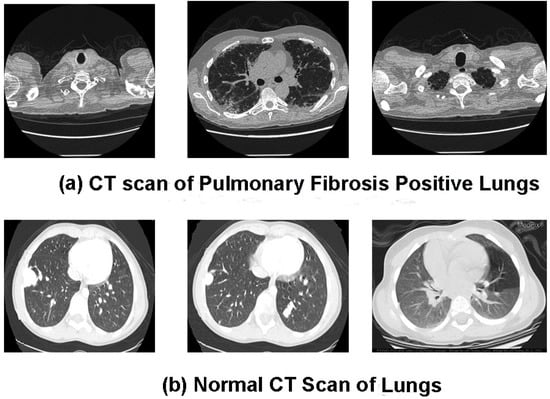
Figure 4.
(a,b). Data samples from the combined chest CT scan image dataset (a) show Pulmonary Fibrosis chest CT image slices, and (b) show normal chest CT image slices.
Table 2.
Details of the distribution of chest CT images in each class and across the training, validation, and testing data.
3.3. Data Preprocessing
In the present study, the raw patient CT scan images in DICOM format need to be pre-processed to make the CT images compatible with the pre-trained Deep CNN models. The data pre-processing steps employed in the present study are as follows: changes in the input image data type to improve the type, quality, and consistency of the CT images, resizing and normalizing the input chest CT scan slices. However, the number of CT scan data of PF-positive and Normal samples is limited. Therefore, in the present study, data augmentation was performed to resolve the issue of limited data for training the considered Deep CNN models.
Initially, the input images were transformed to Hounsfield units (HU) scale values. Then, the windowing technique was applied by selecting a window level of −650 HU and a window width of 1700 HU to highlight clinically relevant lung features (structures) significant for the current study. Next, lung segmentation was performed on the chest CT scan slices to extract the Region of Interest (ROI). The training of the Deep CNN algorithm on the extracted ROI enables the Deep CNN to learn and perform better on the segmented images than on the whole chest lungs. The process of segmentation is executed using TensorFlow and Keras packages that involve steps such as:
- Image normalization: Performed by standardizing the pixel value by deducting the average pixel value and dividing by the standard deviation (SD).
- Clustering and image thresholding: Separation of lungs from the entire scan using the K-Mean clustering technique. Then, identify the best threshold to create a binary image (foreground image (soft tissue/bone) and background (lung/air)).
- Erosion and Dilation: The morphology technique was employed to morph CT scan images by using erosion (contraction) followed by dilation (expansion) to remove tiny features like pulmonary vessels or noise and label each scan region differently with distinct colors.
- Using bounding boxes for each image label, identify a label representing the lung and another bounding box representing “everything else.”
- After just the lungs are left, we perform another morphology-based dilation to apply a lung mask only on the lung field and apply a masked lung on the original image to get the final masked lung image.
The overall process of segmentation involving the steps mentioned above is illustrated in Figure 5.

Figure 5.
Pictorial representation of the segmentation steps used to generate the final masked chest CT image.
Further, in the present study, six different transfer learning models (VGG-19, DenseNet121, Xception, InceptionResNetV2, ResNet50v2, and InceptionResNetV2) employed for the binary classification task require specific input image sizes. Therefore, during the transfer learning process, the image size of the original input images is resized from (512, 512, 3) to (135, 135, 3) pixels, as represented in Figure 6.
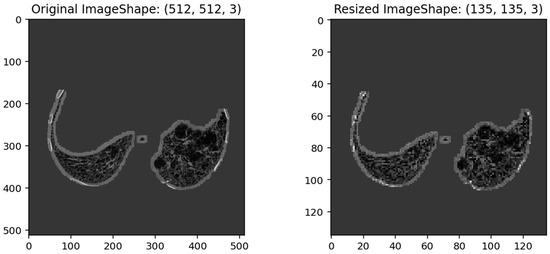
Figure 6.
Illustrates the pixel size of an original chest CT image (512, 512, 3) and its corresponding resized input image (135, 135, 3) for the six-transfer learning model.
The pre-trained models can learn and classify input images based on the class labels (PF and Normal). Therefore, individual image data in the training, validation and testing dataset were labeled accordingly for each class. Furthermore, we used the one-hot encoding technique to generate a column for the two categories; an instance (image data) in the column will be given a “1” if the example in question has been labeled fibrosis; otherwise, a “0” for normal chest CT images.
3.4. Transfer Learning Models
Six pre-trained models, including Inception-v3, DenseNet121, VGG-19, Xception, InceptionResNetV2, and ResNet50v2, were evaluated to identify the most efficient transfer learning DEEP CNN models for the classification and detection of PF from chest CT scan images.
3.4.1. Inception-v3
Inception-v3 [37] is a pre-trained convolutional neural network from the inception family that consists of 48 layers deep to classify 1000 object categories, such as pencil, mouse, many animals, and keyboard. The network requires an input image size of 299 × 299 pixels. The Inceptin-V3 uses Factorized 3 × 3 convolutions, label smoothing, asymmetric convolution (a 3 × 3 convolution can be substituted by a 1 × 3 convolution followed by a 3 × 1 convolution), use of an auxiliary classifier as a regularizer, and grid size reduction performed using pooling operations. The Inception-v3 uses batch normalization throughout the model and is utilized for activation inputs. The loss in Inception-v3 is estimated using the SoftMax function.
3.4.2. DenseNet-121
A DenseNet-121 [9] is a feed-forward CNN where each layer gets additional inputs from all previous layers and passes on its feature maps to the subsequent layer. The DenseNet-121 employs Dense Blocks to establish a direct connection between all layers with matching feature map sizes. In addition, the DenseNet-121 algorithm uses the SoftMax function for classifier activation. The denseNet-121 network requires an input image size of 224 × 224 pixels.
3.4.3. VGG-19
VGG-19 [10] is a CNN model comprising 19 layers deep with 16 convolution layers used for feature extraction and three fully connected layers for classifying images into 1000 object categories. Moreover, the VGG-19 employs five MaxPool layers for the down-sampling feature map and a SoftMax layer for classifier activation. The VGG-19 is one of the most popular methods for classifying images, as the network architecture of VGG-19 uses multiple 3 × 3 filters in each convolutional layer. In addition, the VGG-19 network requires an input image size of 224 × 224 pixels.
3.4.4. Xception
Xception [14] is a convolutional neural network that comprises 71 layers. Xception is extreme inception, where depth-wise separable convolutions have substituted the inception modules. Xception initially uses the filters on each depth map and eventually constricts, using 1 × 1 convolution, the input space by employing it throughout the depth. The absence of non-linearity after the first operation distinguishes it from the inception architecture. The Xception network requires an image input size of 299 × 299 pixels. The Xception model uses the SoftMax function for classifier activation.
3.4.5. Inception-ResNet-v2
Inception-ResNet-v2 [15] is a CNN model built on the inception network architecture and involves residual connection instead of the filter concatenation feature of the inception network architecture. Moreover, the Inception-ResNet-v2 architecture is 164 layers deep and can classify images into 1000 object categories. The Inception-ResNet-v2 network requires an image input size of 299 × 299 pixels. The Inception-ResNet-v2 model uses the SoftMax function for classifier activation.
3.4.6. ResNet50 v2
ResNet50 v2 [11,16,38], short for Residual Networks 50 version 2, is a classic neural network (NN) 50 layers deep and is used as a fundamental principle for various computer vision tasks. ResNet50 v2 is derived from the original ResNet 50 network. The actual invention of ResNet architecture was that it permitted the researchers to successfully train very deep neural networks (DNNs) with more than 150 layers. Before ResNet, training data with very DNNs was problematic because of dying gradients. The problem was addressed by implementing a deep residual learning framework. So, shortcut connections that perform identity mappings were introduced to implement deep ResNet. The advantage of these shortcut identity mapping was that no extra parameters were supplemented to the model, and the computational time was also kept in check. Figure 7a shows the architecture of a Residual Block of a ResNet, and Figure 7b shows the architecture of ResNet50V2 (https://keras.io/api/applications/resnet/#resnet50v2-function, accessed on 1 December 2022)
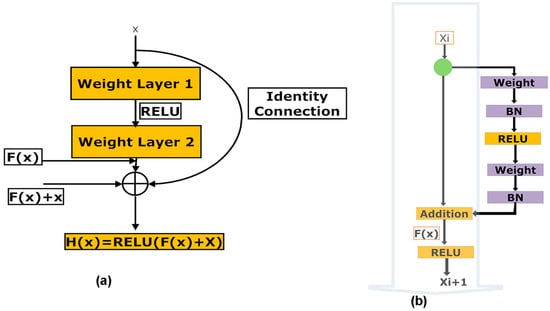
Figure 7.
(a,b). (a) Illustration of the architecture of a residual block in a ResNet, (b) Illustrates the architecture of the ResNet50 v2 network.
The residual unit estimates the function F(x) by processing x across the two layers as represented in Figure 7a [Resnet equations n.d. https://shuzhanfan.github.io/2018/11/ResNet/ (accessed on 11 December 2022)] and H(x) is estimated employing Equation (1):
ResNet50 v2 focuses on forwarding the addition function’s output between the residual and identity mapping. In ResNet 50 v2, the final non-linearity does not happen, leading to an identity connection between the input and output. Instead, ResNet50 v2 utilizes batch normalization and Rectified Linear Unit (ReLU) activation to the input before multiplying with the convolution operation (weight matrix). The ResNet50 v2 network requires an image input size of 224 × 224 pixels. A detailed architecture of the ResNet50 v2 is shown in Supplementary Figure S1.
3.5. Preparation for Training the Processed Image Data
The training and validation parameters chosen for the six-transfer learning-based Deep CNN model under consideration in the present study are tabulated in Table 3.
Table 3.
Training and validation parameters of the six-transfer learning deep CNN models.
To generalize the pre-trained models on the fibrosis region masked CT images, the DNN models should stay balanced during training and validation. Deep CNN model overfitting happens when a very deep CNN model is fitted on the training data, and the DNN is unsuccessful in generalizing new image data [39]. However, regularization can solve the overfitting problem in the DNN model. Regularization applies amendment to a training DNN model that decreases the generalization error, perhaps at the cost of higher training error [40]. The regularization is of two types: explicit and implicit.
Explicit regularization involves adjustments in the DNN architecture that can confide the capability of the DNN. Standard explicit regularization uses approaches such as dropout rate. The dropout rate is a regularization technique that avoids over-fitting the DNN model. In dropout during training, few neurons in the hidden layers are arbitrarily disconnected. Therefore, training occurs on diverse neuron combinations of several network architectures, and the output of many networks derived from the original network is utilized to give the final result. In this study, we used a dropout rate of 0.5.
However, implicit regularization is employed during the training without confining the capabilities of the DNN model. Implicit regularization is of two types: early stopping and data augmentation. Early stopping is the end of the training process whensoever there is an increase in the generalization error (difference between the training and the validation error). We used early stopping to avoid overfitting because of a vast data load in the step per epoch. Data augmentation generates new training sample data from the original by employing image transformations using various artificial image synthesis methods. In the present study, to perform the binary classification of the input chest CT images, the pre-trained transfer learning models are retrained by updating fully connected layers according to the input-labeled masked image data. Pre-trained deep CNN models require a large amount of labeled training image data, which enables the deep CNN models to learn all the details and variations in the images for improved learning performances and enhanced generalization. Augmentation is applied to an image dataset to increase the size of the dataset by artificially generating variation in the input image data. Using data augmentation during training, the DNN is trained and validated on continuously changing versions of the input-masked images, allowing the DNN to have effective learning and more robust features [41]. Note that the labels of the augmented images will be the same as those of the original input mask images. In this study, we have applied a novel Augmented Queue method [42] to yield images on-the-fly during deep CNN model training and validation. The augmented queue method addresses the dual problem (limited data and class imbalance) by performing on-the-fly data augmentation, a multi-queue memory to keep separate and balanced queues for each class, and active online learning. Thus, to enhance the training and validation of image data, augmentation operations such as flipping, rotation, shifting, zoom, shear transformation, channel shift, and brightness were performed under a specific range, as shown in Figure 8.
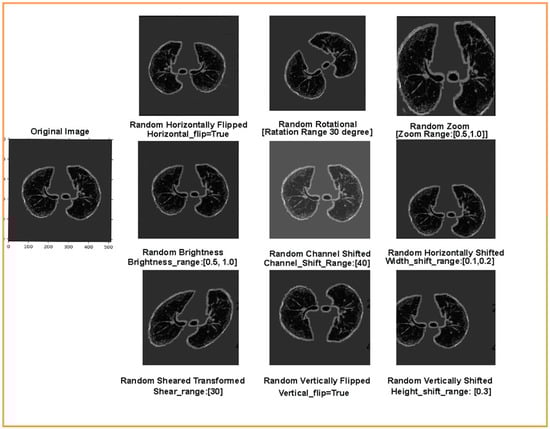
Figure 8.
Augmented training and validation data after flipping, rotation, shifting, zoom, shear transformation, channel shift, and brightness operations.
3.6. Learning Rate Optimization of the Transfer Learning Models
Finally, the learning rate (LR) is one of the essential hyperparameters that find the jump amplitude in an individual iteration. If the LR is very low, it will take a lengthy convergence time. On the contrary, if the LR is very high, then convergence time can diverge [43]. The present study optimized the learning rate for the six-transfer learning models during training. The learning rate is initiated from 0.001 and is multiplied by a factor of 0.50 whenever the generalized error rises, and the models are trained for 50 epochs. The dropout rate is set to 0.5, and the augmentation parameters are defined as aforementioned. We optimized the learning rate using the Adam optimizer, and the performances of the trained models with the optimized learning rate were compared based on the following metrics: training/validation accuracy and training/validation loss. The validation accuracy is characterized as “Val_Acc.” The validation loss is labeled as “Val_Loss.” The training accuracy is labeled as “Train_Acc.” The training loss is depicted as “Train_Loss.”
3.7. Performance Matrix for Classification Evaluation
For a robust performance evaluation, the six pre-trained networks were also evaluated on the independent 10% test data based on the following parameters: accuracy (acc), sensitivity (Sens), precision, MCC, F1-score, AUC, and AUC_PR.
In the above equations, while classifying PF patient’s CT scan images from the normal CT images after the conclusion of the training phase, the true positive (TP), true negative (TN), false positive (FP), and false negative (FN) were used to denote the number of PF positive images classified as PF positive images (TP), the number of normal CT images classified as normal CT images, the number normal CT images incorrectly classified as PF positive images, and the number of PF positive images incorrectly classified as normal images, respectively.
3.8. Abnormality Localization Using Gradient Weighted Class Activation Mapping (Grad-CAM)
Researchers in the past have performed experiments to increase the viability of deep learning applications in solving medical problems. Therefore, it is vital to enhance the localization of abnormality in lung CT scan images by the deep neural models in various deep learning applications for medical imaging-based diagnosis of PF. Selvaraju et al. [44] proposed a Gradient Weighted Class Activation Mapping (Grad-CAM) method. Grad-CAM visualizes densely linked neural networks. Visualization allows the determination of the model’s extra information when performing prediction or classification processes. After completing the training stage, the last layer of the best-performing (highest training and validation accuracy and the lowest training and validation loss) transfer learning deep CNN model was used to detect abnormality regions in chest CT scan images of PF-positive cases using Grad-CAM.
4. Results
In the present study, the pre-trained transfer learning deep CNN models were trained and validated for classifying input chest CT scan images into Normal and PF. Six state-of-the-art deep CNN transfer learning models (Xception, VGG-19, InceptionV3, InceptionResNetV2, DenseNet121, and ResNet50v2) were evaluated for the current classification task. Supplementary Tables S1–S6 show the results of Adam optimizer-based optimization of the learning rate for the six-transfer learning models for 50 epochs performed on 75% training and 15% validation data. As shown in Supplementary Material Tables S1–S6, the optimizer Adam with an optimized learning rate for each transfer learning model considerably enhanced the performance of the six deep transfer learning CNN models. Table 4 compares the highest training and validation accuracy and the lowest loss attained by each DNN model at their corresponding optimized learning rate.
Table 4.
Comparative performance examination of the six-transfer learning model at their corresponding optimized learning rates.
The ResNet50v2, with an optimized learning rate of 0.0000625, was best at classifying the PF_positive images with a training accuracy of 99.92% and a validation accuracy of 99.22%. As a result, the ResNet50v2 had a minor training loss and validation loss of 0.00428 and 0.00683, respectively, as tabulated in Table 4. Moreover, similar training and validation accuracy values were observed for the ResNet50v2 transfer learning model after training. This signifies that overfitting was avoided in the ResNet50v2 model. The final hyperparameters values of the trained ResNet50v2 model on the training chest CT scan image data are tabulated in Table 5.
Table 5.
Hyperparameters settings of the best-performing model (ResNet50v2) on the training and validation dataset.
Figure 9a,b shows the convergence curve depicting the training and validation accuracy and loss function values of the ResNet50v2 model up to 10 epochs performed on 75:15 training and validation data at a learning rate of 0.0000625. It can be noted from Figure 9a that the training and validation accuracy curve shows considerable improvement in the performance of the ResNet50v2 model, depicted by the gradual increase in the accuracy with the rise in the number of epochs. In the first epoch, the training accuracy of the ResNet50v2 model was 72.55%, which significantly increased to 99.92% in the final epoch. Correspondingly, the validation accuracy of the initial epoch was 93.89%, subsequently rising to 99.22% in the last epoch. In Figure 9b, the loss graph of the ResNet50v2 model is illustrated. In the first epoch, the training loss was 0.57462, and the validation loss was 0.33916. However, at the final epoch, the training and validation loss reduced considerably to 0.00428 and 0.00683, respectively. It can be observed from Figure 9b that the loss value of the ResNet50v2 model decreased with a gradual increase in the number of epochs, signifying an increase in the performance of the ResNet50v2 model.
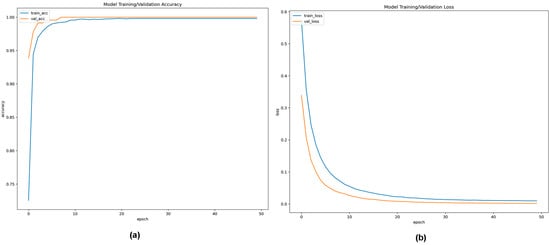
Figure 9.
(a,b). (a) Training and validation accuracy convergence curve of ResNet50v2 model up to 50 epochs with an optimized learning rate of 0.00625; (b) Training and validation loss convergence curve of ResNet50v2 model for 50 epochs at an optimized learning rate of 0.00625.
Additionally, the classification capabilities of the pre-trained transfer learning deep CNN models were estimated on the independent 10% testing masked image data centered on the following statistical matrices: (a) recall which signifies patients with a PF, (b) precision that signifies the model’s accuracy in classifying a PF patient as positive, (c) accuracy is the ratio of correct predictions of PF to the total number of predictions, (d) F1-Score combines the recall and precision of a model into a performance metric by taking their harmonic mean, (e) MCC measures the correlation between true and predicted values, the higher the correlation, the better the prediction of samples with and without PF, (f) AUC value signifies the capability of pre-trained transfer learning deep CNN model to distinguish between two classes, i.e., PF-positive and normal chest CT scan images, and (g) AUC-PR evaluate the performance of the binary classification of PF-positive and normal chest CT scan images by the different transfer learning models. The performance comparison for different pre-trained transfer learning deep CNN models tested for the classification scheme (normal Vs. lung fibrosis) on the chest CT scan image independent test masked image data is shown in Table 6 and Figure 10, respectively.
Table 6.
Comparison of different performance evaluators between the six pre-trained transfer learning deep CNN models.
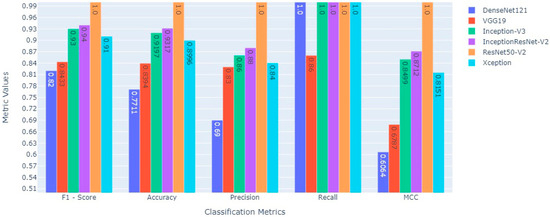
Figure 10.
Comparative performance evaluation of various statistical evaluators between six state-of-the-art deep transfer learning models to classify fibrosis and non-fibrosis images using the 10% independent testing CT scan image dataset.
The pre-trained ResNet50v2 object detection architecture outperforms other transfer learning deep CNN models in the given classification task. The ResNet50v2 model attained a testing accuracy of 100%. The performance of ResNet50v2 in different key outcomes are as follows: PF and normal chest CT scan images are classified with 100% recall and 100% precision. While 1.00 in each statistical evaluator, such as F1-score, MCC value, and AUC, signifies that the ResNet50v2 model is ideal at classifying PF images from normal chest CT images. The pre-trained transfer learning models had 50 epochs (with an early stopping function enabled) to classify the two classes (PF and normal) chest CT images. The performance comparison of the ROC_AUC curve and AUC_PR curve of pre-trained transfer learning models (Xception, VGG-19, InceptionV3, InceptionResNetV2, DenseNet121, and ResNet50v2) are shown in Figure 11 and Figure 12, respectively.
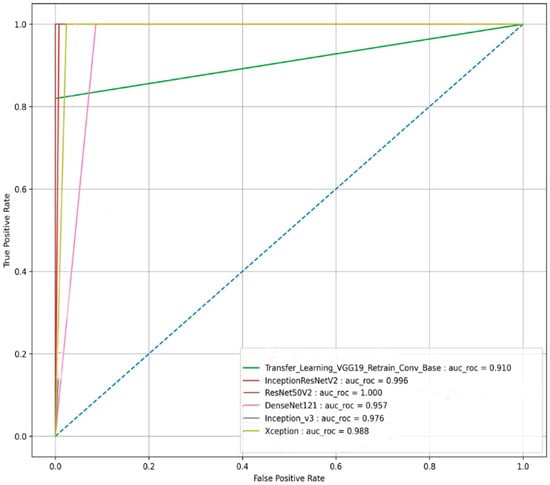
Figure 11.
The ROC_AUC curve-based performance comparison of the six state-of-the-art transfer learning models for the image-based classification of the fibrosis and normal classes from the testing CT scan image dataset.
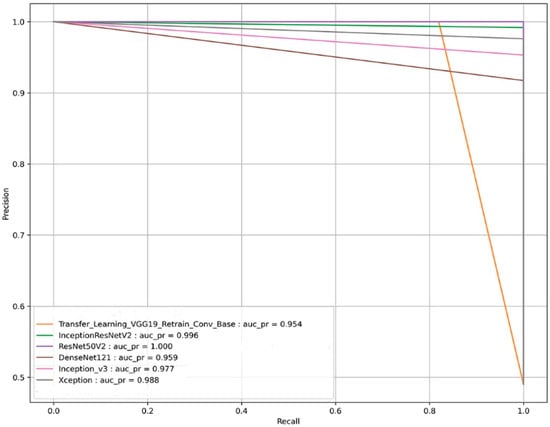
Figure 12.
The AUC_PR curve-based performance comparison of the six state-of-the-art transfer learning models for the image-based classification of the fibrosis and normal classes from the testing CT scan image dataset.
We can observe from Figure 11 and Figure 12, respectively, that the pre-trained ResNet50v2 model outperforms the other pre-trained transfer learning models under consideration in the present study. The pre-trained ResNet50v2 model can effectively classify PF positive images as denoted by the higher accuracy, precision, ROC_AUC, AUC_PR, MCC, and F1-score obtained by the ResNet50v2 model, as tabulated in Table 6 and shown in Figure 10, respectively.
Figure 13 shows the confusion matrix of the best-performing ResNet50v2 model. As per the confusion matrix, the ResNet50v2 model can correctly classify 345 out of 345 image data. Of the correctly classified images, 228 belong to the PF positive class, and 117 belong to the negative class (normal images).
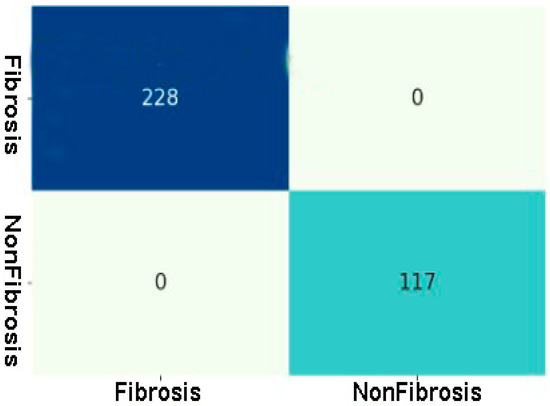
Figure 13.
Confusion matrix of Fibrosis and Non-Fibrosis classes of the testing CT scan image dataset using the best performing ResNet50v2 model.
Grad-CAM is accomplished on the last convolution layer once the ResNet50v2 model classifies the outcome label. Figure 14a depicts the heatmaps signifying the area of abnormality (red) on the chest CT scan images that are visualized using the Grad-CAM method. On the contrary, the class activation heatmap in Figure 14b shows nothing for the normal masked CT scan image. The results of Grad-CAM show that the ResNet50v2 model can efficiently predict and detect the problematic region of interest (fibrosis) in the PF-positive chest CT images when compared to the normal chest CT images.
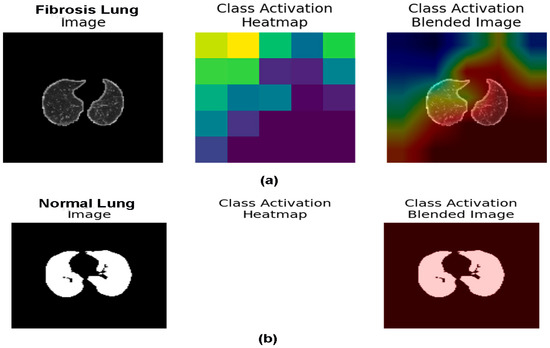
Figure 14.
(a,b). (a) The fibrosis region is represented in the chest CT images utilizing Grad-CAM heatmap on the final layer of the ResNet50v2 model, and (b) Illustrate the normal chest CT image by applying Grad-CAM heatmap on the last layer of the ResNet50v2 model.
Additionally, Table 6 compares the performance of the ResNet50v2 model for PF positive image prediction and detection in the present study with the recently published work available for solving a similar problem using pre-trained transfer learning models. We can observe that the ResNet50v2 architecture with optimized learning rate outperforms other DNN architecture in classifying PF-positive chest CT scan images from normal chest CT images with an AUC value of 1.00 and an accuracy of 100%.
The pre-trained ResNet50v2 model was implemented as a prototype web application and hosted at https://fibrosisweb.azurewebsites.net/, (accessed on 1 January 2023). In real-time, using the online prototype PF detector, the clinicians can classify the PF from normal chest CT scan images using the ResNet50v2 DCNN model.
5. Discussion
Pulmonary fibrosis is widespread worldwide and a significant cause of morbidity and mortality among lung diseases [1]. Therefore, it is essential to diagnose PF early and efficiently. In this perspective, many image processing and deep CNN model have been proposed [8]. The present work aimed to screen the best-performing pre-trained deep CNN model to classify the considered chest CT scan images into positive (PF images) and negative (normal images) classes. First, the collected CT scan images were resized based on the requirement of the pre-trained transfer learning models, and image enhancement methods were used to increase the quality of the chest CT scan images. Second, extrinsic and intrinsic data regularization techniques were employed to avoid overfitting by the model during training [40]. Third, novel data augmentation techniques, namely the augmented queues method [41,42], were used to perform data augmentation on-the-fly and Active Learning (during training) for PF-positive and normal CT scan image classification.
Moreover, different augment strategies, such as flipping, shifting, rotation, zoom, shear transformation, channel shift, and brightness, were performed to increase the volume and balance the chest CT scan image belonging to each class. Finally, the models were optimized by fine-tuning the hyperparameters, such as the learning rate and the number of epochs, to enhance the model’s performance in performing the current binary classification task. Next, a binary classification was performed using six pre-trained optimized transfer learning deep CNN models, namely VGG-19, DenseNet121, Xception, InceptionResNetV2, ResNet50v2, and InceptionResNetV2 and their performance was evaluated to screen the best performing optimized deep CNN model. The optimized ResNet50v2 model has the highest classification accuracy for training (99.91%) and validation (99.22%) chest CT scan image data.
Similarly, the ResNet50v2 model achieved a minimum loss function value for the training (0.00428) and validation (0.00683) data at 26 epochs (with an early stopping function enabled). Moreover, the ResNet50v2 model, when tested on the 10% independent test data, yielded the highest value of 1.00 for each performance evaluator, such as accuracy, precision, F1-score, MCC, ROC_AUC value, and AUC_PR. Finally, the best-performing model, the ResNet50v2 model, was used for the abnormality localization of fibrosis (scarring) in the PF-positive CT images using the Grad-CAM heatmap [44]. The ResNet50v2 model showed great potential in rapidly and accurately detecting regions of interest from the PF-positive sample’s chest CT scan image slices. Table 7 shows that the proposed MRCNN system in [35] obtained an accuracy of 90% for lung texture or pattern classification in PF disease. Moreover, the systems proposed by authors in [27] used the Attention-U-Net plus Inception-ResNet pulmonary fibrosis prediction model to provide appropriate predictions on the X-ray images. The modified pre-trained Inception-ResNetv2 model achieved an accuracy of 93%, and the relevant diagnostic precision of the developed model was close to a professional radiologist. In [33], the authors compared the shallow and deep Learning architectures to classify the pattern in lung diseases such as interstitial lung diseases (ILD). The architecture developed in [33] obtained an overall accuracy of 95.12% considering the multi-classes classification of five ILD patterns (consolidation, ground-glass opacity, emphysema, reticular opacity, and honeycombing).
Table 7.
A list of related studies on PF classification with their corresponding attainment in different performance matrices.
While the optimized pre-trained ResNet50v2 model in the present study exhibited the highest accuracy of 100% in classifying the positive class (PF images) from the negative class in the tested dataset compared to the results of recently published works on the same problem as tabulated in Table 7. Therefore, the experimental results suggest that our proposed optimized ResNet50v2 model outperforms recent state-of-the-art deep CNN models in PF classification accuracy.
6. Conclusions and Future Scope
In this study, we showed the optimized ResNet50v2 ability to classify and detect pulmonary fibrosis from chest CT images with state-of-the-art classification accuracy in classifying PF-positive Ct images compared to other comparable methods published in recent years. The optimized ResNet50v2 model achieved the highest classification accuracy of 99.91% for training and 99.22% for chest CT scan image data validation. Similarly, the ResNet50v2 model reached a minimum loss function value of 0.00428 and 0.00683 for the training and validation data, respectively, within 26 epochs (with an early stopping function enabled). Moreover, the robustness of the proposed method was tested using standard performance measures. The experimental results of the various performance metrics showed that the optimized ResNet50v2 model achieved an outstanding 100% value in all the evaluated performance measures. In addition, the Grad-CAM heatmap technique demonstrated the practicality of the optimized ResNet50v2 in identifying the region of interest (the problematic area in fibrotic lungs), which provides extra information for an efficient and reliable diagnosis and detection of fibrosis in chest CT scan images.
Furthermore, the outstanding performance of the ResNet50v2 model motivated the authors to implement a prototype application to examine clinically PF-positive patients to detect abnormality regions of interest (fibrosis) in the CT scan slices. Moreover, the prototype online application will be able to locate the fibrosis region in positive PF patient CT scan images, enabling clinicians to detect PF efficiently and effectively. The outcomes of the present study show that appropriate image processing, regularization, and hyperparameter tuning enhance the model’s performance. In addition, the results demonstrate that the optimized ResNet50v2 model achieved state-of-the-art classification performance compared to the versions of the other fine-tuned pre-trained deep CNN models in classifying PF-positive CT images from normal chest CT images.
In the future, we aim to use various ablation studies to hyper tune the different components, such as loss function, optimizer, flatten layer, and learning rate, of the ResNet50v2 or other pre-trained transfer learning model to develop a more resilient architecture with enhanced classification accuracy. These resilient pre-trained deep CNN models will automatically detect and classify various lung diseases, such as chronic obstructive pulmonary disease and lung cancer, pleural effusion, COVID-19, and pneumonia, more accurately and reliably. Moreover, the pre-trained ResNet50v2 model robustness in rapidly and accurately classifying PF CT images from normal CT images needs to be further studied on larger chest CT scan image data of each class (PF and normal). Cross-validation studies may be used to validate the robustness of the results on the training, validation, and testing dataset. In future studies, we will try to find the disease localization accuracy of a deep CNN transfer learning model in identifying the region of interest in PF-positive CT images.
Even if we have achieved state-of-the-art performance accuracy in classifying PF using the improved ResNet50v2, some limitations are still there in the present study. Firstly, we did not perform cross-validation studies to validate our findings’ robustness. Secondly, only tuning the learning rate and the number of epochs was performed. Therefore, the scope of modifying other components of the base architecture of the pre-trained transfer learning model. Thirdly, we were not able to calculate the accuracy of the disease localization using a reference model. Finally, we must collaborate with clinicians and prepare a study to compare our results with the doctors to understand the precision with which our optimized pre-trained model detects the region of interest in PF-positive CT scan images.
Supplementary Materials
The following supporting information can be downloaded at: https://www.mdpi.com/article/10.3390/pr11020443/s1. Supplementary Tables S1–S6: Supplementary Tables S1–S6 show the results of Adam optimizer-based optimization of the learning rate of the six-transfer learning models for 50 epochs performed on 75% training and 15% validation data. Supplementary Figure S1: Illustrate the detailed architecture of the ResNet50 v2 network.
Author Contributions
All authors made substantial intellectual involvement in the present study to meet the requirements as authors. First, S.A.K. and T.K. apprehended the study’s design. Second, A.H.S. and T.K. collected the data, and A.H.S. performed the research and analyzed the data. Third, T.K. drafted the materials and methodology and edited the figures. Fourth, A.H.S. prepared the abstract, introduction, result, and discussion. Finally, A.H.S. and T.K. edited the manuscript. All authors were substantially and intellectually involved in the present study to meet the requirements. All authors have read and agreed to the published version of the manuscript.
Funding
The research work is funded by Institutional Fund Projects under grant no. (IFPIP 435-830-1442). Therefore, the authors gratefully acknowledge technical and financial support from the Ministry of Education and King Abdulaziz University, DSR, Jeddah, Saudi Arabia.
Institutional Review Board Statement
In the present study, we have worked on the Lung Fibrosis CT image dataset made publicly available by Open-Source Imaging Consortium (OSIC). The Lung Fibrosis CT image data can be downloaded from Open-Source Imaging Consortium (OSIC), accessed on 1 June 2022. Therefore, the authors in the present study were not involved with animals or human participants. However, the relevant local Ethics Committee approved the original retrospective studies [https://www.kaggle.com/code/digvijayyadav/lung-fibrosis-dicom-image-preprocessing/data, (accessed on 11 June 2022)].
Informed Consent Statement
Not applicable.
Data Availability Statement
Datasets are publicly available at: [https://www.kaggle.com/code/digvijayyadav/lung-fibrosis-dicom-image-preprocessing/data, (assessed on 11 June 2022)], and the CT scan images of the control group (normal lung images) are available from GitHub [https://s3.ca-central-1.amazonaws.com/ubccic.covid19.models/L3netDemoData.zip, (accessed on 11 June 2022)].
Acknowledgments
The research work is funded by Institutional Fund Projects under grant no. (IFPIP 435-830-1442). Therefore the authors gratefully acknowledge technical and financial support from the Ministry of Education and King Abdulaziz University, DSR, Jeddah, Saudi Arabia.
Conflicts of Interest
The authors declare that the research was conducted without any commercial or financial relationships construed as a potential conflict of interest.
References
- Glassberg, M.K. Overview of Idiopathic Pulmonary Fibrosis, Evidence-Based Guidelines, and Recent Developments in the Treatment Landscape. Am. J. Manag. Care 2019, 25, S195–S203. [Google Scholar] [PubMed]
- Trusculescu, A.A.; Manolescu, D.; Tudorache, E.; Oancea, C. Deep Learning in Interstitial Lung Disease—How Long until Daily Practice. Eur. Radiol. 2020, 30, 6285–6292. [Google Scholar] [CrossRef] [PubMed]
- Walsh, S.L.F.; Calandriello, L.; Sverzellati, N.; Wells, A.U.; Hansell, D.M. UIP Observer Consort Interobserver Agreement for the ATS/ERS/JRS/ALAT Criteria for a UIP Pattern on CT. Thorax 2016, 71, 45–51. [Google Scholar] [CrossRef] [PubMed]
- Walsh, S.L.F.; Wells, A.U.; Desai, S.R.; Poletti, V.; Piciucchi, S.; Dubini, A.; Nunes, H.; Valeyre, D.; Brillet, P.Y.; Kambouchner, M.; et al. Multicentre Evaluation of Multidisciplinary Team Meeting Agreement on Diagnosis in Diffuse Parenchymal Lung Disease: A Case-Cohort Study. Lancet Respir. Med. 2016, 4, 557–565. [Google Scholar] [CrossRef]
- LeCun, Y.; Bengio, Y.; Hinton, G. Deep Learning. Nature 2015, 521, 436–444. [Google Scholar] [CrossRef]
- Schmidhuber, J. Deep Learning in Neural Networks: An Overview. Neural Netw. 2015, 61, 85–117. [Google Scholar] [CrossRef]
- Krizhevsky, A.; Sutskever, I.; Hinton, G.E. ImageNet Classification with Deep Convolutional Neural Networks. Commun. ACM 2017, 60, 84–90. [Google Scholar] [CrossRef]
- Shin, H.-C.; Roth, H.R.; Gao, M.; Lu, L.; Xu, Z.; Nogues, I.; Yao, J.; Mollura, D.; Summers, R.M. Deep Convolutional Neural Networks for Computer-Aided Detection: CNN Architectures, Dataset Characteristics and Transfer Learning. IEEE Trans. Med. Imaging 2016, 35, 1285–1298. [Google Scholar] [CrossRef]
- Huang, G.; Liu, Z.; Laurens, V.; Weinberger, K. Densely Connected Convolutional Networks. In Proceedings of the IEEE Conference on Computer Vision and Pattern Recognition (CVPR), Honolulu, HI, USA, 21–26 July 2017; pp. 2261–2269. [Google Scholar]
- Simonyan, K.; Zisserman, A. Very Deep Convolutional Networks For Large-Scale Image Recognition. In Proceedings of the International Conference on Learning Representations, San Diego, CA, USA, 7–9 May 2015. [Google Scholar]
- He, K.; Zhang, X.; Ren, S.; Sun, J. Deep Residual Learning for Image Recognition. In Proceedings of the IEEE Conference on Computer Vision and Pattern Recognition (CVPR), Las Vegas, NV, USA, 27–30 June 2016. [Google Scholar]
- Sandler, M.; Howard, A.; Zhu, M.; Zhmoginov, A.; Chen, L.-C. MobileNetV2: Inverted Residuals and Linear Bottlenecks. In Proceedings of the IEEE Conference on Computer Vision and Pattern Recognition (CVPR), Salt Lake City, UT, USA, 18–23 June 2018. [Google Scholar]
- Tan, M.; Le, Q.V. EfficientNet: Rethinking Model Scaling for Convolutional Neural Networks. In Proceedings of the International Conference on Machine Learning, Long Beach, CA, USA, 9–15 June 2019. [Google Scholar]
- Chollet, F. Xception: Deep learning with depthwise separable convolutions. In Proceedings of the IEEE Conference on Computer Vision and Pattern Recognition 2017, Honolulu, HI, USA, 21–26 July 2017; pp. 1251–12580. [Google Scholar]
- Szegedy, C.; Ioffe, S.; Vanhoucke, V.; Alemi, A.A. Inception-v4, Inception-ResNet, and the impact of residual connections on learning. In Proceedings of the 31st AAAI Conference on Artificial Intelligence 2017, San Francisco, CA, USA, 4–9 February 2017. [Google Scholar]
- He, K.; Zhang, X.; Ren, S.; Sun, J. Identity Mappings in Deep Residual Networks. In Lecture Notes in Computer Science (including subseries Lecture Notes in Artificial Intelligence and Lecture Notes in Bioinformatics), Proceedings of the Computer Vision–ECCV 2016: 14th European Conference, Amsterdam, The Netherlands, 11–14 October 2016; Springer: Berlin/Heidelberg, Germany, 2016; Volume 9908, pp. 630–645. [Google Scholar] [CrossRef]
- Jin, B.; Cruz, L.; Goncalves, N. Deep Facial Diagnosis: Deep Transfer Learning From Face Recognition to Facial Diagnosis. IEEE Access 2020, 8, 123649–123661. [Google Scholar] [CrossRef]
- Gao, J.; Wang, H.; Shen, H. Task Failure Prediction in Cloud Data Centers Using Deep Learning. In Proceedings of the 2019 IEEE International Conference on Big Data (Big Data), Los Angeles, CA, USA, 9–12 December 2019; pp. 1111–1116. [Google Scholar]
- Gao, J.; Wang, H.; Shen, H. Smartly Handling Renewable Energy Instability in Supporting A Cloud Datacenter. In Proceedings of the 2020 IEEE International Parallel and Distributed Processing Symposium (IPDPS), New Orleans, LA, USA, 18–22 May 2020; pp. 769–778. [Google Scholar]
- Rauf, H.T.; Saleem, B.A.; Lali, M.I.U.; Khan, M.A.; Sharif, M.; Bukhari, S.A.C. A Citrus Fruits and Leaves Dataset for Detection and Classification of Citrus Diseases through Machine Learning. Data Brief 2019, 26, 104340. [Google Scholar] [CrossRef]
- Akter, S.; Shamrat, F.M.J.M.; Chakraborty, S.; Karim, A.; Azam, S. COVID-19 Detection Using Deep Learning Algorithm on Chest X-Ray Images. Biology 2021, 10, 1174. [Google Scholar] [CrossRef]
- Lu, S.-Y.; Zhang, Z.; Zhang, Y.-D.; Wang, S.-H. CGENet: A Deep Graph Model for COVID-19 Detection Based on Chest CT. Biology 2022, 11, 33. [Google Scholar] [CrossRef]
- Islam, M.Z.; Islam, M.M.; Asraf, A. A combined deep CNN-LSTM network for the detection of novel coronavirus (COVID-19) using X-ray images. Inform. Med. Unlocked. 2020, 20, 100412. [Google Scholar] [CrossRef]
- Lu, S.; Wang, S.H.; Zhang, Y.D. Detection of the abnormal brain in MRI via improved AlexNet and ELM optimized by chaotic bat algorithm. Neural Comput. Appl. 2021, 33, 10799–10811. [Google Scholar] [CrossRef]
- Demir, F.; Sengur, A.; Bajaj, V. Convolutional Neural Networks Based Efficient Approach for Classification of Lung Diseases. Health Inf. Sci. Syst. 2020, 8, 4. [Google Scholar] [CrossRef]
- Zhang, J.; Xie, Y.; Pang, G.; Liao, Z.; Verjans, J.; Li, W.; Sun, Z.; He, J.; Li, Y.; Shen, C.; et al. Viral Pneumonia Screening on Chest X-Rays Using Confidence-Aware Anomaly Detection. IEEE Trans. Med. Imaging 2021, 40, 879–890. [Google Scholar] [CrossRef]
- Li, D.; Liu, Z.; Luo, L.; Tian, S.; Zhao, J. Prediction of Pulmonary Fibrosis Based on X-Rays by Deep Neural Network. J. Healthc. Eng. 2022, 2022, 1–13. [Google Scholar] [CrossRef]
- Shamrat, F.M.J.M.; Azam, S.; Karim, A.; Islam, R.; Tasnim, Z.; Ghosh, P.; De Boer, F. LungNet22: A Fine-Tuned Model for Multiclass Classification and Prediction of Lung Disease Using X-Ray Images. J. Pers. Med. 2022, 12, 680. [Google Scholar] [CrossRef]
- Souid, A.; Sakli, N.; Sakli, H. Classification and Predictions of Lung Diseases from Chest X-Rays Using MobileNet V2. Appl. Sci. 2021, 11, 2751. [Google Scholar] [CrossRef]
- Bharati, S.; Podder, P.; Mondal, M.R.H. Hybrid Deep Learning for Detecting Lung Diseases from X-Ray Images. Inform. Med. Unlocked 2020, 20, 100391. [Google Scholar] [CrossRef]
- Baltruschat, I.M.; Nickisch, H.; Grass, M.; Knopp, T.; Saalbach, A. Comparison of Deep Learning Approaches for Multi-Label Chest X-Ray Classification. Sci. Rep. 2019, 9, 6381. [Google Scholar] [CrossRef] [PubMed]
- Li, Z.; Wang, C.; Han, M.; Xue, Y.; Wei, W.; Li, L.J.; Fei-Fei, L. Thoracic disease identification and localization with limited supervision. In Proceedings of the IEEE Conference on Computer Vision and Pattern Recognition, Salt Lake City, UT, USA, 18–23 June 2018; pp. 8290–8299. [Google Scholar]
- Kim, G.B.; Jung, K.-H.; Lee, Y.; Kim, H.-J.; Kim, N.; Jun, S.; Seo, J.B.; Lynch, D.A. Comparison of Shallow and Deep Learning Methods on Classifying the Regional Pattern of Diffuse Lung Disease. J. Digit. Imaging 2018, 31, 415–424. [Google Scholar] [CrossRef] [PubMed]
- Wang, X.; Peng, Y.; Lu, L.; Lu, Z.; Bagheri, M.; Summers, R.M. ChestX-Ray8: Hospital-Scale Chest X-Ray Database and Benchmarks on Weakly-Supervised Classification and Localization of Common Thorax Diseases. In Proceedings of the 30th IEEE Conference on Computer Vision and Pattern Recognition (CVPR), Honolulu, HI, USA, 21–26 July 2017; pp. 3462–3471. [Google Scholar] [CrossRef]
- Wang, Q.; Zheng, Y.; Yang, G.; Jin, W.; Chen, X.; Yin, Y. Multiscale Rotation-Invariant Convolutional Neural Networks for Lung Texture Classification. IEEE J. Biomed. Health Inform. 2018, 22, 184–195. [Google Scholar] [CrossRef]
- Anthimopoulos, M.; Christodoulidis, S.; Ebner, L.; Christe, A.; Mougiakakou, S. Lung Pattern Classification for Interstitial Lung Diseases Using a Deep Convolutional Neural Network. IEEE Trans. Med. Imaging 2016, 35, 1207–1216. [Google Scholar] [CrossRef] [PubMed]
- Szegedy, C.; Vanhoucke, V.; Ioffe, S.; Shlens, J.; Wojna, Z. Rethinking the Inception Architecture for Computer Vision. In Proceedings of the 2016 IEEE Conference on Computer Vision and Pattern Recognition (CVPR), Las Vegas, NV, USA, 27–30 June 2016; pp. 2818–2826. [Google Scholar] [CrossRef]
- Detailed Guide to Understand and Implement ResNets, n.d. Available online: https://cv-tricks.com/keras/understand-implement-resnets/ (accessed on 9 June 2022).
- Rosebrock, A. Deep Learning for Computer Vision with Python(ImageNet); PyImageSearch: Philadelphia, PA, USA, 2017; Volume 3. [Google Scholar]
- Goodfellow, I.; Bengio, Y.; Courville, A. Deep Learning; MIT Press: Middlesex County, MA, USA, 2016. [Google Scholar]
- Shorten, C.; Khoshgoftaar, T.M. A Survey on Image Data Augmentation for Deep Learning. J. Big Data 2019, 6, 60. [Google Scholar] [CrossRef]
- Malialis, K.; Papatheodoulou, D.; Filippou, S.; Panayiotou, C.G.; Polycarpou, M.M. Data Augmentation On-the-Fly and Active Learning in Data Stream Classification. arXiv 2022, arXiv:2210.06873. [Google Scholar]
- Llamas, J.; Lerones, P.M.; Medina, R.; Zalama, E.; Gómez-García-Bermejo, J. Classification of Architectural Heritage Images Using Deep Learning Techniques. Appl. Sci. 2017, 7, 992. [Google Scholar] [CrossRef]
- Selvaraju, R.R.; Cogswell, M.; Das, A.; Vedantam, R.; Parikh, D.; Batra, D. Grad-CAM: Visual Explanations from Deep Networks via Gradient-Based Localization. In Proceedings of the 2017 IEEE International Conference on Computer Vision (ICCV), Venice, Italy, 22–29 October 2017; pp. 618–626. [Google Scholar]
Disclaimer/Publisher’s Note: The statements, opinions and data contained in all publications are solely those of the individual author(s) and contributor(s) and not of MDPI and/or the editor(s). MDPI and/or the editor(s) disclaim responsibility for any injury to people or property resulting from any ideas, methods, instructions or products referred to in the content. |
© 2023 by the authors. Licensee MDPI, Basel, Switzerland. This article is an open access article distributed under the terms and conditions of the Creative Commons Attribution (CC BY) license (https://creativecommons.org/licenses/by/4.0/).