
Geometallurgical Detailing of Plant Operation within Open-Pit Strategic Mine Planning


Abstract
1. Introduction
2. Advances in Stochastic Open-Pit Mining Algorithms
3. Formulation
3.1. First Stage Optimization—The Overarching Strategic Plan
3.2. Second Stage Optimization—The Short-Term Processing Decisions
3.3. Summary of Sets and Parameters
- the set of all blocks within the scope of the simulation.
- is the set of direct predecessors of block b.
- is the set of available operational modes.
- is the set of rock types.
- cbt is the expected discounted cost of mining block b in period t.
- mb is the mass of block b.
- dt is the availability of the plant during the same period t of the set of blocks t.
- ro is the tonnage processing rate under operational mode o ∈ .
- vbso is the discounted value of block b by operational mode o ∈ under scenario s.
- wop is the fraction of rock p ∈ needed to process ore under operational mode o ∈ .
4. Sample Calculations
4.1. Case Study
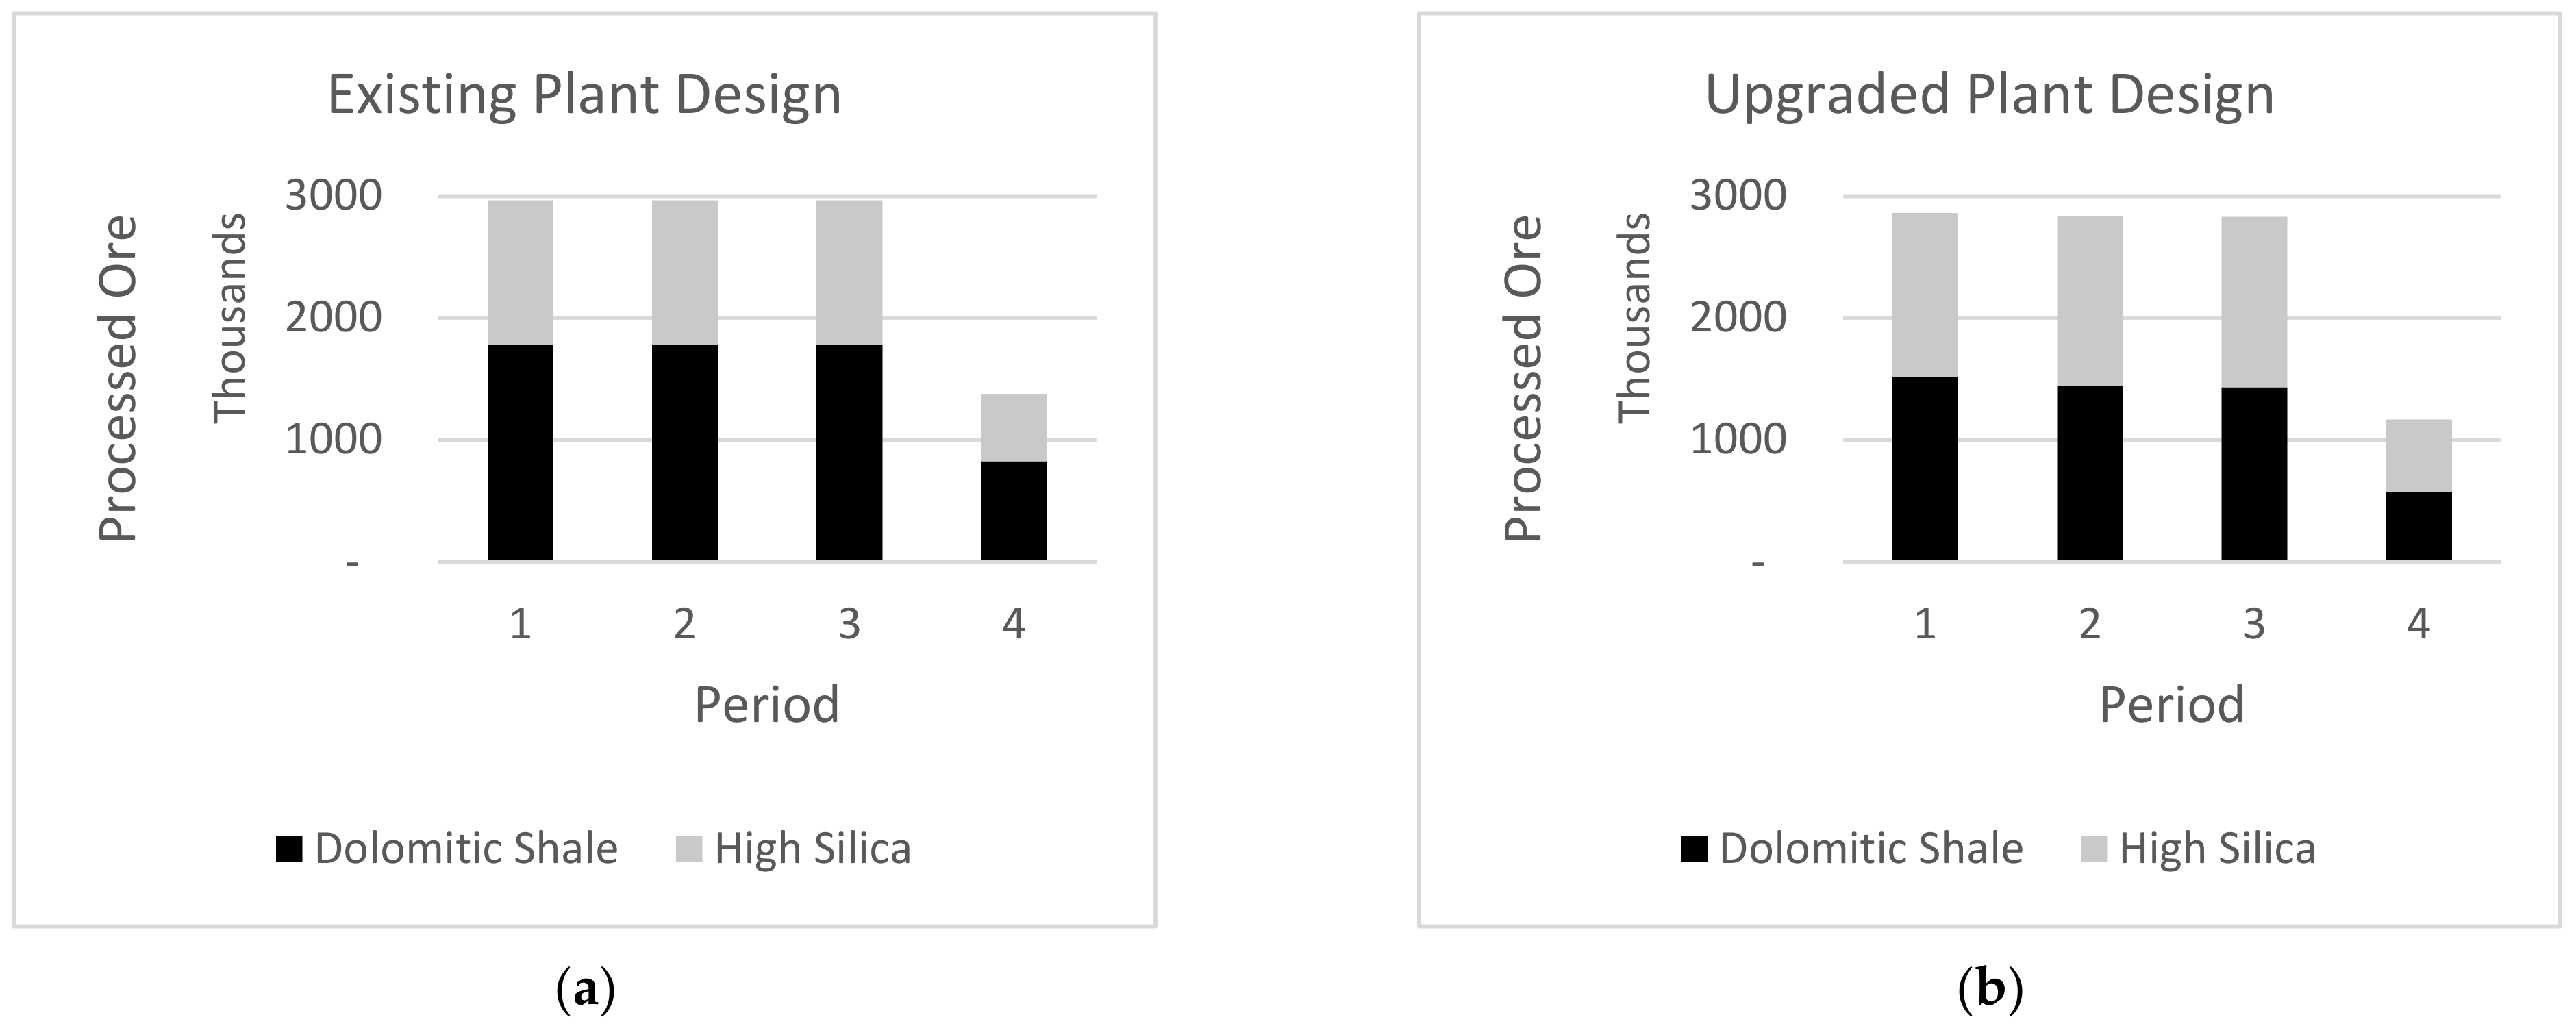
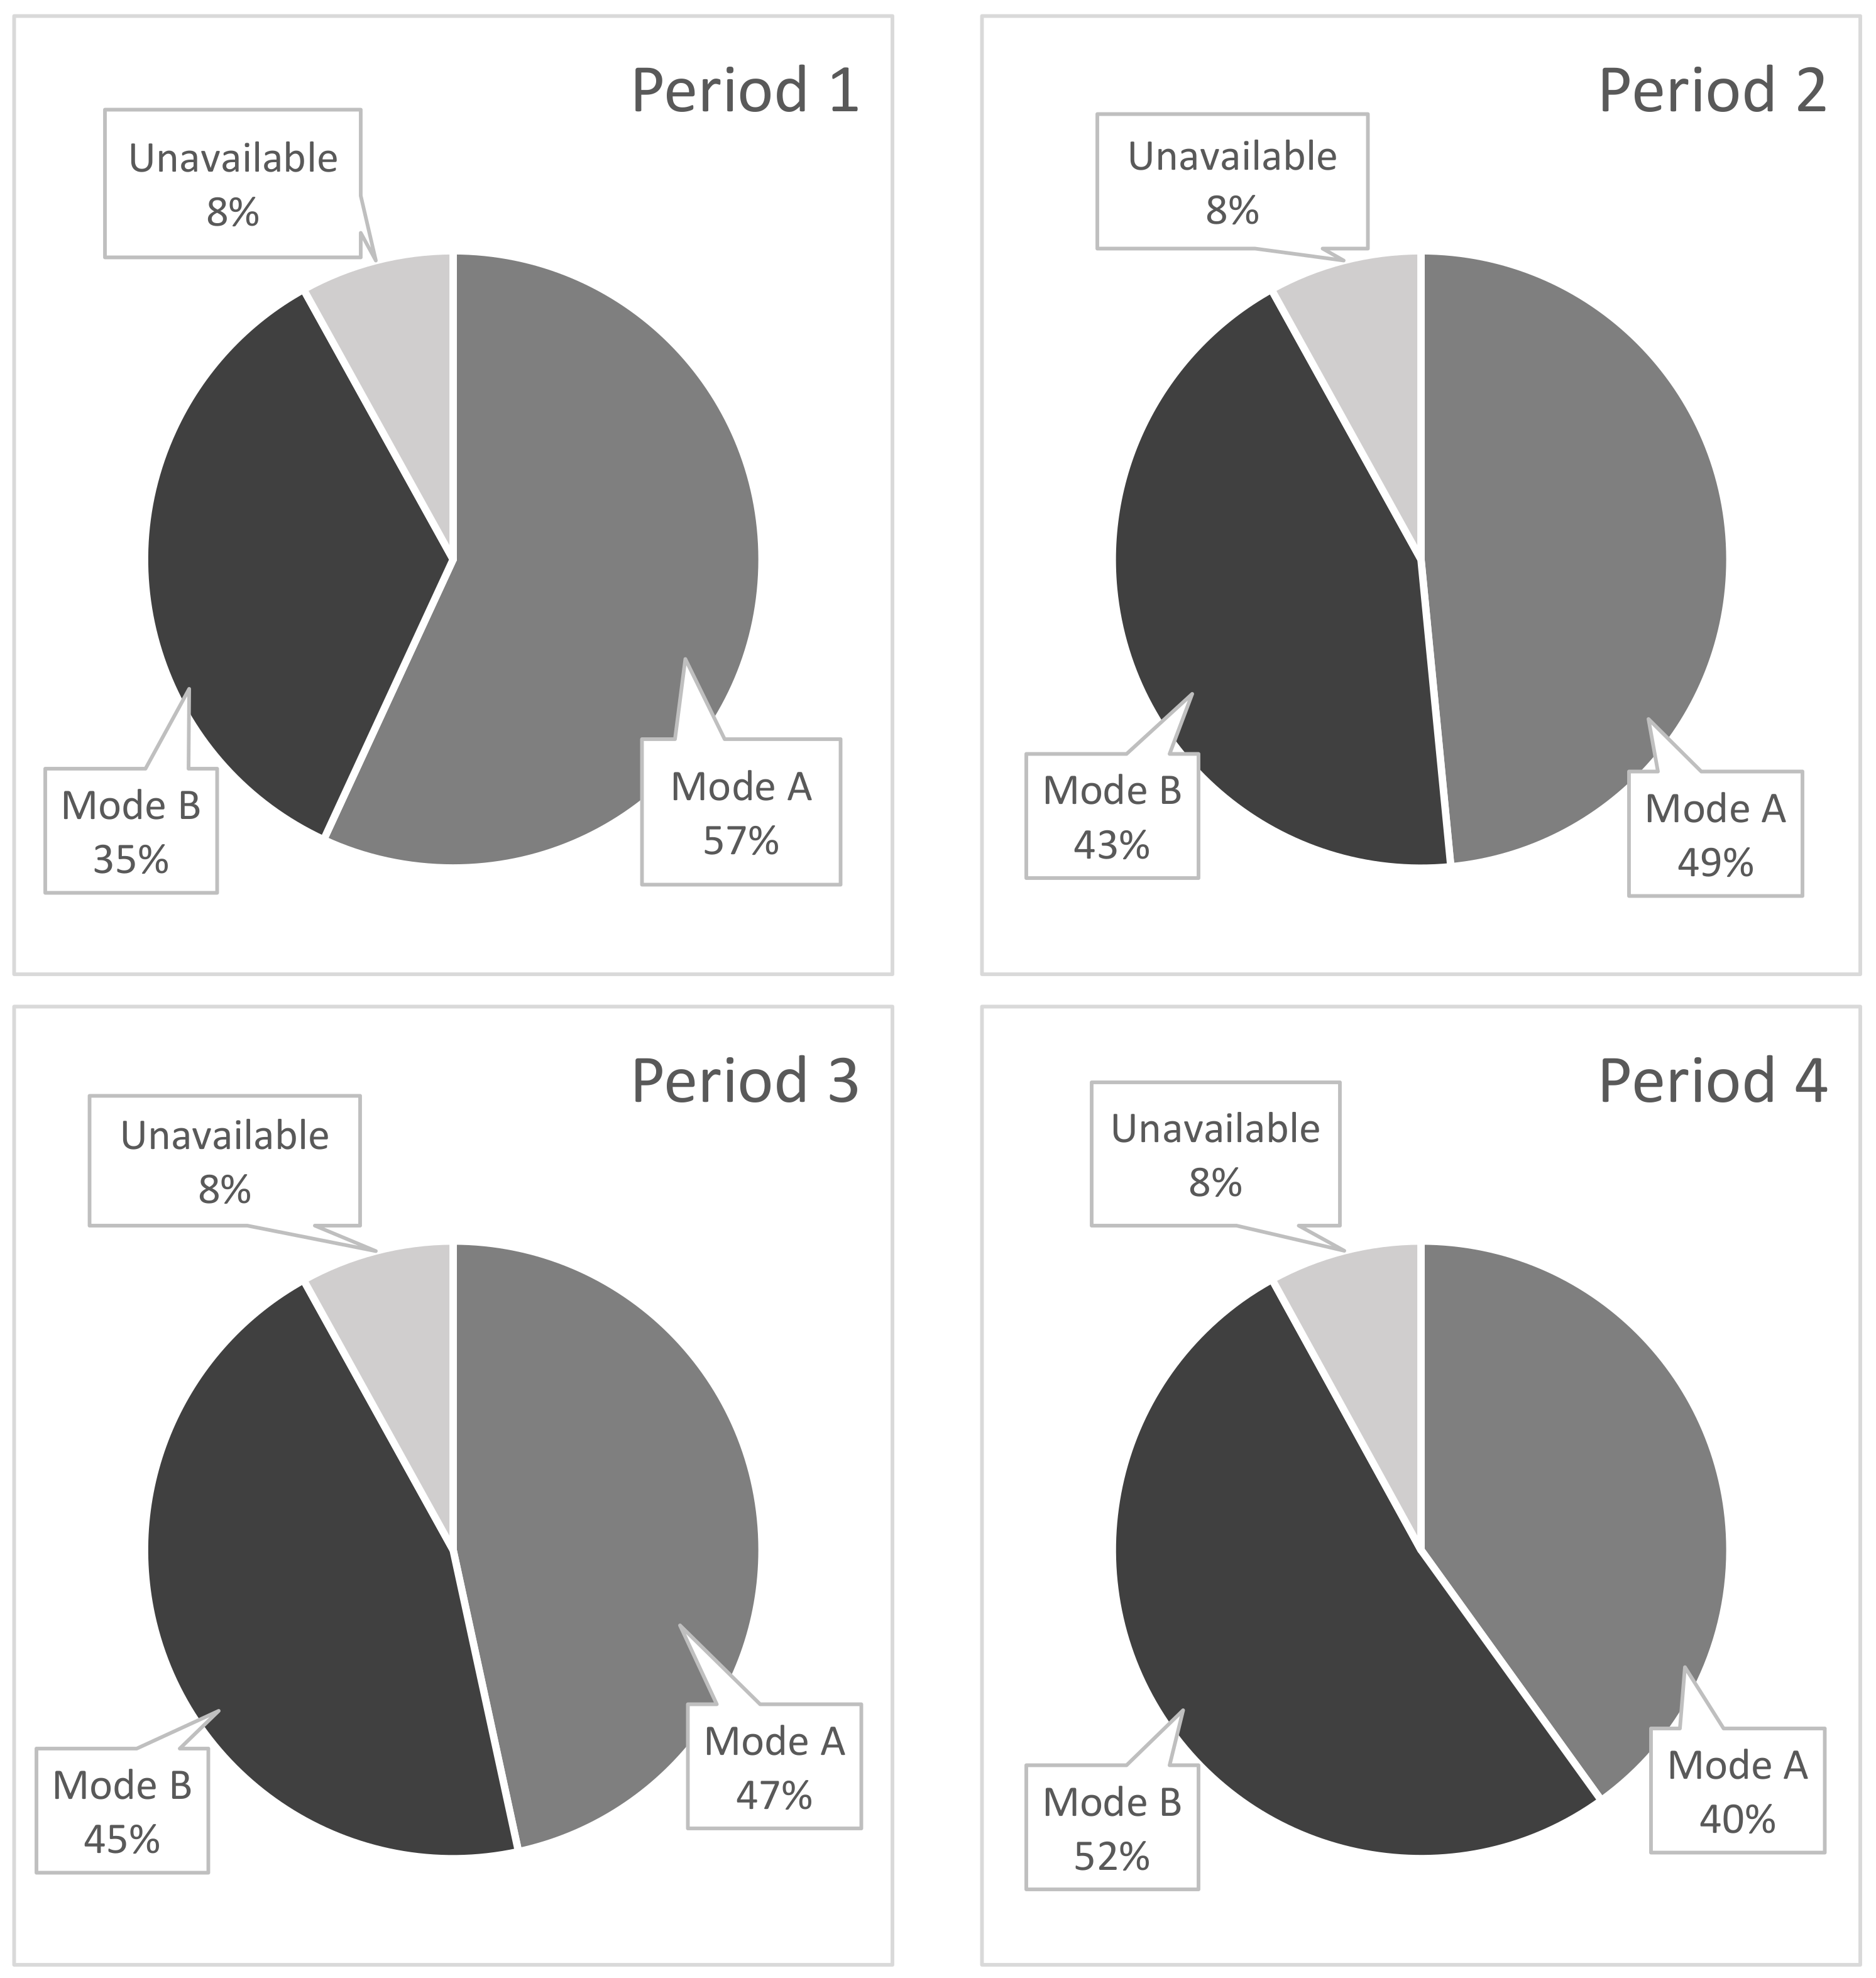
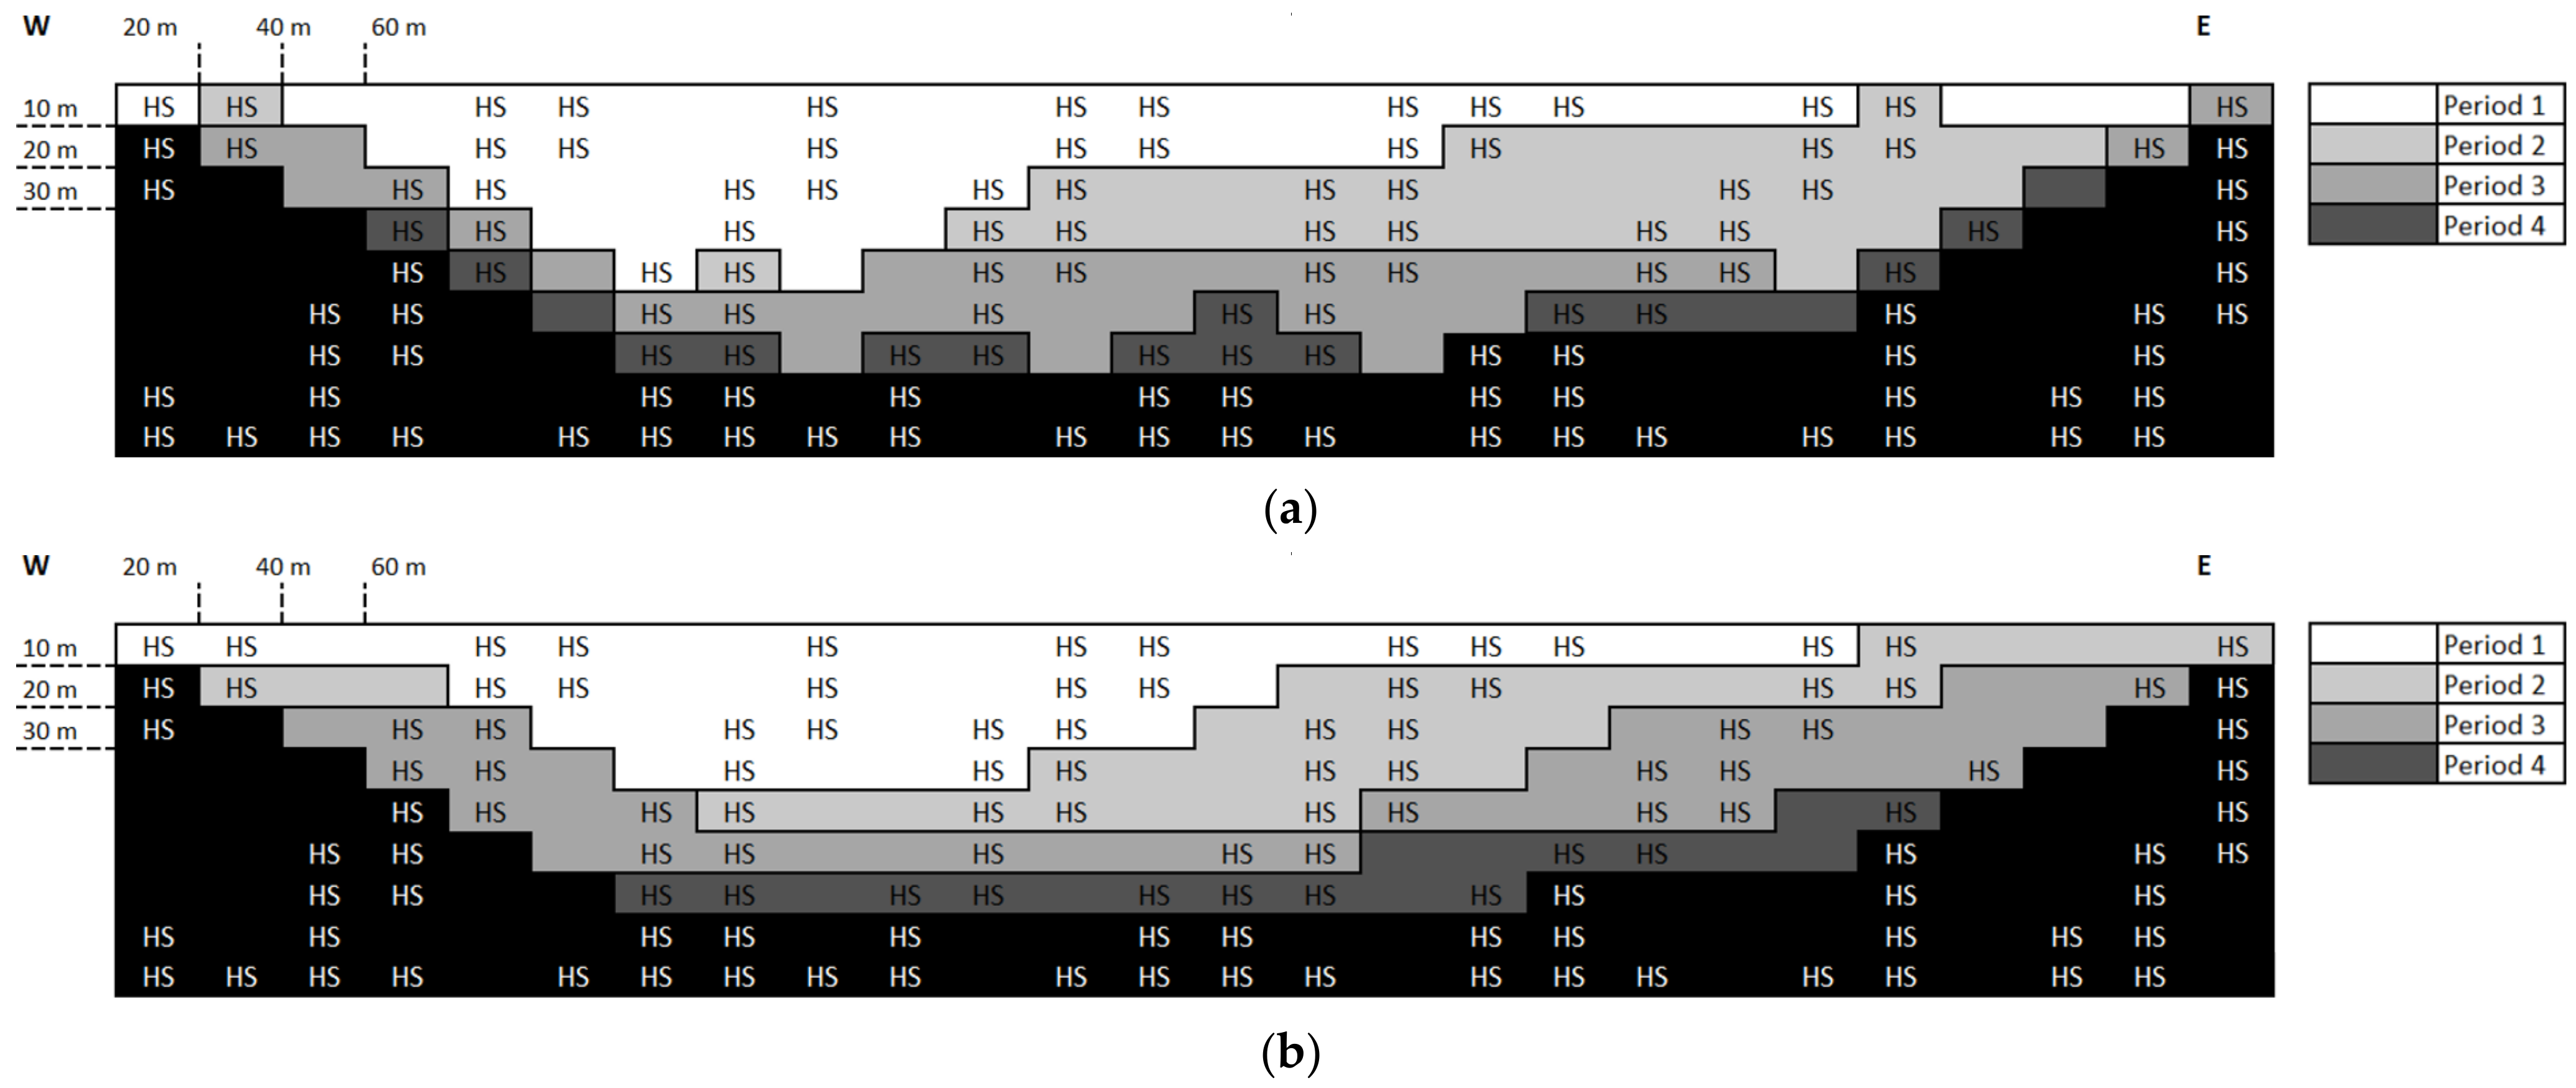
4.2. Results
5. Conclusions
Author Contributions
Funding
Data Availability Statement
Acknowledgments
Conflicts of Interest
Appendix A


References
- Skyttner, L. General Systems Theory–Ideas & Applications; World Scientific Publishing Co. Pte. Ltd.: Singapore, 2001; pp. 45–101. [Google Scholar]
- Lishchuk, V.; Pettersson, M. The mechanisms of decision-making when applying geometallurgical approach to the mining industry. Miner. Econ. 2021, 34, 71–80. [Google Scholar] [CrossRef]
- Wei, Y.; Sandenbergh, R. Effects of grinding environment on the flotation of Rosh Pinah complex Pb/Zn ore. Miner. Eng. 2007, 20, 264–272. [Google Scholar] [CrossRef]
- Nad, A.; Saramak, D. Comparative Analysis of the Strength Distribution for Irregular Particles of Carbonates, Shale and Sandstone Ore. Minerals 2018, 8, 37. [Google Scholar] [CrossRef]
- Wang, C.; Nadolski, S.; Mejia, O.; Drozdiak, J.; Klein, B. Energy and Cost Comparisons of HPGR Based Circuits with the SABC Circuit Installed at the Huckleberry Mine. In Proceedings of the 45th Annual Canadian Mineral Processors Operators Conference, Ottawa, ON, Canada, 22–24 January 2013. [Google Scholar]
- Lois-Morales, P.; Evans, C.; Weatherley, D. Analysis of the size–dependency of relevant mineralogical and textural characteristics to particles strength. Miner. Eng. 2022, 184, 107572. [Google Scholar] [CrossRef]
- Fuerstenau, D. Report US NRC Committee on Comminution and Energy Consumption; National Materials Advisory Board, Commission on Sociotechnical Systems: Washington, DC, USA, 1981. [Google Scholar]
- Bueno, M.; Foggiatto, B.; Lane, G. Geometallurgy Applied in Comminution to Minimize Design Risks. In Proceedings of the 6th International Conference on Autogenous Semi-autogenous Grinding and High-Pressure Grinding Roll Technology, Vancouver, BC, Canada, 25–28 September 2015; pp. 1–19. [Google Scholar]
- Both, C.; Dimitrakopoulos, R. Integrating geometallurgical ball mill throughput predictions into short-term stochastic production scheduling in mining complexes. Int. J. Min. Sci. Technol. 2022, in press. [Google Scholar] [CrossRef]
- Flores, L. Hardness model and reconciliation of throughput models to plant results at Minera Escondida Ltda, Chile. Tech. Bull. SGS Miner. Serv. 2005, 5, 1–14. [Google Scholar]
- Wills, B.; Finch, J. Chapter 5-Comminution. In Wills’ Mineral Processing Technology: An Introduction to the Practical Aspects of Ore Treatment and Mineral Recovery, 8th ed.; Wills, B., Finch, J., Eds.; Butterworth-Heinemann: Oxford, UK, 2016; pp. 109–122. [Google Scholar]
- Bond, F. Crushing and Grinding Calculations; Allis Chalmers Manufacturing Co.: Milwaukee, WI, USA, 1961. [Google Scholar]
- Haffez, G. Correlation between work index and mechanical properties of some Saudi Ores. Mater. Test. 2012, 54, 108–112. [Google Scholar] [CrossRef]
- Dimitrakopoulos, R. Stochastic Optimization for Strategic Mine Planning: A Decade of Developments. J. Min. Sci. 2011, 47, 138–150. [Google Scholar] [CrossRef]
- Navarra, A.; Rafiei, A.; Waters, K. A system approach to mineral processing based on mathematical programming. Can. Metall. Q. 2017, 56, 35–44. [Google Scholar] [CrossRef]
- Navarra, A.; Waters, K. Concentrator utilization under geological uncertainty. Can. Metall. Q. 2016, 55, 470–478. [Google Scholar] [CrossRef]
- Navarra, A.; Menzies, A.; Jordens, A.; Waters, K. Strategic evaluation of concentrator operational modes under geological uncertainty. Int. J. Miner. 2017, 164, 45–55. [Google Scholar] [CrossRef]
- Navarra, A.; Grammatikopoulos, T.; Waters, K. Incorporation of geometallurgical modelling into long-term production planning. Miner. Eng. 2018, 120, 118–126. [Google Scholar] [CrossRef]
- Newman, A.; Rubio, E.; Caro, R.; Weintraub, A.; Eureke, K. A review of operations research in mining planning. Interface 2010, 40, 222–245. [Google Scholar] [CrossRef]
- Tolouei, K.; Moosavi, E.; Tabrizi, A.; Afzal, P.; Bazzazi, A. An optimization approach for uncertainty-based long-term production scheduling in open-pit mines using meta-heuristic algorithms. Int. J. Min. Reclam. Environ. 2020, 35, 115–140. [Google Scholar] [CrossRef]
- Lamghari, A.; Dimitrakopoulos, R.; Ferland, J. A variable neighborhood descend algorithm for an open-pit mine production scheduling problem with metal uncertainty. J. Oper. Res. Soc. 2014, 65, 1305–1314. [Google Scholar] [CrossRef]
- Dimitrakopoulos, R. (Ed.) Stochastic Mine Planning–Methods, Examples and Value in an Uncertain World. In Advances in Applied Strategic Mine Planning; Springer: Cham, Switzerland, 2018; pp. 101–115. [Google Scholar]
- Paravarzar, S.; Emery, X.; Madani, N. Comparing sequential Gaussian and turning bands algorithms for cosimulating grades in multi-element deposits. Comptes Rendus Geosci. 2015, 347, 84–93. [Google Scholar] [CrossRef]
- Morales, N.; Nancel-Penard, P.; Espejo, N. Development and analysis of a methodology to generate operational open-pit mine ramp designs automatically. Optim. Eng. 2022, 23, 1573–2924. [Google Scholar] [CrossRef]
- Nancel-Penard, P.; Morales, N.; Cornillier, F. A recursive time aggregation-disaggregation heuristic for the multidimensional and multiperiod precedence-constrained knapsack problem: An application to the open-pit mine block sequencing problem. Eur. J. Oper. Res. 2022, 303, 1088–1099. [Google Scholar] [CrossRef]
- Deutsch, M.; Dagdelen, K.; Johnson, T. An Open-Source Program for Efficiently Computing Ultimate Pit Limits: MineFlow. Nat. Resour. J. 2022, 31, 1175–1187. [Google Scholar] [CrossRef]
- Rivera-Letelier, O.; Espinoza, D.; Goycoolea, M.; Moreno, E.; Muñoz, G. Production Scheduling for Strategic Open Pit Mine Planning: A Mixed-Integer Programming Approach. Oper. Res. 2020, 68, 1425–1444. [Google Scholar] [CrossRef]
- Ramazan, S.; Dimitrakopoulos, R. Production scheduling with uncertain supply: A new solution to the open pit mining problem. Optim. Eng. 2013, 14, 361–380. [Google Scholar] [CrossRef]
- Montiel, L.; Dimitrakopoulos, R. Optimizing mining complexes with multiple processing and transportation alternatives. Eur. J. Oper. Res. 2015, 247, 166–178. [Google Scholar] [CrossRef]
- Goodfellow, R.; Dimitrakopoulos, R. Global optimization of open pit mining complexes with uncertainty. Appl. Soft Comput. 2016, 40, 292–304. [Google Scholar] [CrossRef]
- Saliva, Z.; Dimitrakopoulos, R. Simultaneous stochastic optimization of an open pit gold mining complex with supply and market uncertainty. Int. J. Min. Sci. Technol. 2019, 128, 216–229. [Google Scholar]
- L’Heureux, G.; Gamache, M.; Soumis, F. Mixed integer programming model for short term planning in open-pit mines. Int. J. Min. Sci. Technol. 2013, 122, 101–109. [Google Scholar] [CrossRef]
- Leite, A.; Dimitrakopoulos, R. Stochastic optimization model for open pit mine planning: Application and risk analysis at copper deposit. Int. J. Min. Sci. Technol. 2007, 116, 109–118. [Google Scholar]
- Lamghari, A.; Dimitrakopoulos, R. A diversified Tabu Search approach for the open-pit mine production scheduling problem with metal uncertainty. Eur. J. Oper. Res. 2012, 222, 642–652. [Google Scholar] [CrossRef]
- Kan, A. Long-term production scheduling of open pit mines using particle swarm and bat algorithms under grade uncertainty. J. S. Afr. Inst. Min. Metall. 2018, 118, 361–368. [Google Scholar] [CrossRef]
- Muñoz, G.; Espinoza, D.; Goycoolea, M.; Moreno, E.; Queyranne, M.; Rivera, O. A study of the Bienstock-Zuckerberg algorithm: Applications in mining and resource constrained project scheduling. Comput. Optim. Appl. 2018, 69, 501–534. [Google Scholar] [CrossRef]
- Lamghari, A.; Dimitrakopoulos, R.; Ferland, J. A hybrid method based on linear programming and variable neighborhood descent for scheduling production in open-pit mines. J. Glob. Optim. 2015, 65, 555–582. [Google Scholar] [CrossRef]
- Pease, J.; Curry, D.; Young, M. Designing flotation circuits for high fines recovery. Miner Eng. 2006, 19, 831–840. [Google Scholar] [CrossRef]
- Leach, D.; Bradley, D.; Huston, D.; Pisarevsky, S.; Taylor, R.; Gardoll, S. Sediment-hosted lead-zinc deposits in Earth history. Econ. Geol. 2010, 105, 593–625. [Google Scholar] [CrossRef]
- Neumann, N.L.; Southgate, P.N.; Gibson, G.M. Defining unconformities in Proterozoic sedimentary basins using detrital geochronology and basin analysis—An example from the Mount Isa inlier, Australia. Precambrian Res. 2009, 168, 149–166. [Google Scholar] [CrossRef]
- Page, R.W.; Jackson, M.J.; Krassay, A.A. Constraining sequence stratigraphy in north Australia basins: SHRIMP U-Pb zircon geochronology between Mt. Isa and McArthur River. Aust. J. Earth Sci. 2000, 47, 431–460. [Google Scholar] [CrossRef]
- Large, R.R.; Bull, S.W.; McGoldrick, P.J.; Derrick, G.; Carr, G.; Walters, S. Stratiform and strata-bound Zn-Pb-Ag deposits of the Proterozoic sedimentary basins of northern Australia. In Economic Geology One Hundredth Anniversary Volume; Hedenquist, J.W., Thompson, J.F.H., Goldfarb, R.J., Richards, J.P., Eds.; Society of Economic Geologists: Littleton, CO, USA, 2005; pp. 931–963. [Google Scholar]
- Davis, T. Mine-scale structural controls on the Mount Isa Zn-Pb-Ag and Cu orebodies. Econ. Geol. 2004, 99, 543–559. [Google Scholar] [CrossRef]
- Perkins, W.G. Mount Isa silica dolomite and copper orebodies; the result of a syntectonic hydrothermal alteration system. Econ. Geol. 1984, 79, 601–637. [Google Scholar] [CrossRef]
- Cave, B.; Richard Lilly, R.; Barovich, K. Textural and geochemical analysis of chalcopyrite, galena and sphalerite across the Mount Isa Cu to Pb-Zn transition: Implications for a zoned Cu-Pb-Zn system. Ore Geol. Rev. 2020, 124, 103647. [Google Scholar] [CrossRef]
- Neudert, M. A Depositional Model for the Upper Mount Isa Group and Implications for Ore Formation. Ph.D. Thesis, Australian National University, Canberra, Australia, May 1983. [Google Scholar]
- Dantzig, G.; Wolfe, P. Decomposition Principle for Linear Programs. Oper. Res. 1960, 8, 101–111. [Google Scholar] [CrossRef]
- Hillier, F.; Lieberman, G. Introduction to Operations Research; McGraw-Hill Education: New York, NY, USA, 2015; pp. 1186–1198. [Google Scholar]


| Zn (Tonnes) | Pb (Tonnes) | |||||||||
|---|---|---|---|---|---|---|---|---|---|---|
| Scenario | Mean | Std Dev | Q1 | Median | Q3 | Mean | Std Dev | Q1 | Median | Q3 |
| 1 | 1089.84 | 789.48 | 503.02 | 874.05 | 1471.70 | 408.90 | 334.29 | 165.05 | 307.99 | 554.64 |
| 2 | 1065.58 | 802.90 | 490.57 | 831.72 | 1431.85 | 399.23 | 341.90 | 160.44 | 291.20 | 537.72 |
| 3 | 1066.58 | 798.24 | 470.64 | 851.64 | 1471.70 | 399.77 | 338.29 | 153.11 | 299.09 | 554.64 |
| 4 | 1054.75 | 796.90 | 460.68 | 844.17 | 1429.36 | 394.79 | 339.05 | 149.45 | 296.12 | 536.66 |
| 5 | 1047.28 | 755.80 | 473.13 | 864.09 | 1424.38 | 390.75 | 318.87 | 154.02 | 304.03 | 534.55 |
| 6 | 1129.73 | 860.30 | 478.11 | 874.05 | 1538.93 | 427.08 | 367.37 | 155.85 | 307.99 | 583.34 |
| 7 | 1046.75 | 750.92 | 490.57 | 854.13 | 1409.44 | 390.38 | 316.45 | 160.44 | 300.07 | 528.23 |
| 8 | 1077.67 | 822.96 | 508.00 | 861.60 | 1451.77 | 404.56 | 353.03 | 166.89 | 303.04 | 546.17 |
| 9 | 1047.57 | 767.57 | 475.62 | 831.72 | 1434.34 | 391.33 | 323.64 | 154.94 | 291.20 | 538.78 |
| 10 | 1035.72 | 738.17 | 478.11 | 826.74 | 1404.46 | 385.57 | 310.60 | 155.85 | 289.23 | 526.12 |
| 11 | 1081.10 | 814.24 | 470.64 | 851.64 | 1476.68 | 406.10 | 345.77 | 153.11 | 299.09 | 556.76 |
| 12 | 1107.90 | 811.53 | 490.57 | 881.52 | 1504.07 | 416.81 | 344.77 | 160.44 | 310.96 | 568.44 |
| 13 | 1072.85 | 782.07 | 500.53 | 864.09 | 1429.36 | 401.63 | 331.94 | 164.13 | 304.03 | 536.66 |
| 14 | 1107.11 | 825.36 | 478.11 | 859.11 | 1523.99 | 417.12 | 349.74 | 155.85 | 302.05 | 576.95 |
| 15 | 1077.66 | 793.25 | 483.09 | 866.58 | 1479.17 | 403.93 | 337.19 | 157.69 | 305.02 | 557.82 |
| 16 | 1053.30 | 794.65 | 468.15 | 811.80 | 1426.87 | 394.28 | 336.59 | 152.19 | 283.34 | 535.61 |
| 17 | 1076.01 | 752.17 | 500.23 | 874.05 | 1511.54 | 402.39 | 316.13 | 164.13 | 307.99 | 571.63 |
| 18 | 1097.92 | 802.02 | 498.04 | 891.48 | 1484.15 | 412.50 | 340.20 | 163.20 | 314.93 | 559.94 |
| 19 | 1065.79 | 781.99 | 480.60 | 851.64 | 1461.74 | 399.06 | 330.46 | 156.77 | 299.09 | 550.41 |
| 20 | 1076.53 | 779.98 | 485.59 | 888.99 | 1491.62 | 403.24 | 330.09 | 158.60 | 313.94 | 563.13 |
| Parameters | Existing | Upgraded |
|---|---|---|
| Block weight (tonne) | 20,000 | 20,000 |
| Number of blocks | 4446 | 4446 |
| Block dimension (m) | 25 × 25 × 12.5 | 25 × 25 × 12.5 |
| Block density (tonne/m3) | 2.88 | 2.88 |
| Number of periods | 4 | 4 |
| Length of periods (year) | 1 | 1 |
| Discount rate (%) | 8 | 8 |
| Metal price Zn ($/tonne) | 2400 | 2400 |
| Metal price Pb ($/tonne) | 2000 | 2000 |
| Mining cost ($/tonne) | 14.50 | 14.50 |
| Rejection rate | 50% | 50% |
| * Mining capacity (tonne/period) | 10,000,000 | 10,000,000 |
| Processing availability (hr./period) | 8059 | 8059 |
| Rock Types | Dolomitic Shale (D) | |
| High Silica (HS) | ||
| Operational Mode A | ||
| Processing cost ($/tonne) | 29.15 | 29.15 |
| Recovery Zn (%) | 0.85 | 0.85 |
| Recovery Pb (%) | 0.62 | 0.62 |
| Processing rate (tonne/hr.) | 368 | 368 |
| Percentage rock D | 60 | 60 |
| Percentage rock HS | 40 | 40 |
| Operational Mode B | ||
| Processing cost ($/tonne) | N/A | 34 |
| Recovery Zn (%) | N/A | 0.87 |
| Recovery Pb (%) | N/A | 0.63 |
| Processing rate (tonne/hr.) | N/A | 334 |
| Percentage rock D | N/A | 40 |
| Percentage rock HS | N/A | 60 |
Disclaimer/Publisher’s Note: The statements, opinions and data contained in all publications are solely those of the individual author(s) and contributor(s) and not of MDPI and/or the editor(s). MDPI and/or the editor(s) disclaim responsibility for any injury to people or property resulting from any ideas, methods, instructions or products referred to in the content. |
© 2023 by the authors. Licensee MDPI, Basel, Switzerland. This article is an open access article distributed under the terms and conditions of the Creative Commons Attribution (CC BY) license (https://creativecommons.org/licenses/by/4.0/).
Share and Cite
Quelopana, A.; Órdenes, J.; Araya, R.; Navarra, A. Geometallurgical Detailing of Plant Operation within Open-Pit Strategic Mine Planning. Processes 2023, 11, 381. https://doi.org/10.3390/pr11020381
Quelopana A, Órdenes J, Araya R, Navarra A. Geometallurgical Detailing of Plant Operation within Open-Pit Strategic Mine Planning. Processes. 2023; 11(2):381. https://doi.org/10.3390/pr11020381
Chicago/Turabian StyleQuelopana, Aldo, Javier Órdenes, Rodrigo Araya, and Alessandro Navarra. 2023. "Geometallurgical Detailing of Plant Operation within Open-Pit Strategic Mine Planning" Processes 11, no. 2: 381. https://doi.org/10.3390/pr11020381
APA StyleQuelopana, A., Órdenes, J., Araya, R., & Navarra, A. (2023). Geometallurgical Detailing of Plant Operation within Open-Pit Strategic Mine Planning. Processes, 11(2), 381. https://doi.org/10.3390/pr11020381