Article

Analysis of Particle Size Distribution of Coke on Blast Furnace Belt Using Object Detection

1
State Key Laboratory of Advanced Special Steel, Shanghai Key Laboratory of Advanced Ferrometallurgy, School of Materials Science and Engineering, Shanghai University, Shanghai 102100, China
2
Process and Systems Engineering Laboratory, Faculty of Science and Engineering, Åbo Akademi University, 20500 Åbo/Turku, Finland
*
Author to whom correspondence should be addressed.
Processes 2022, 10(10), 1902; https://doi.org/10.3390/pr10101902
Submission received: 11 August 2022 / Revised: 7 September 2022 / Accepted: 16 September 2022 / Published: 20 September 2022
(This article belongs to the Special Issue Process Analysis and Simulation in Extractive Metallurgy)

Abstract

:
Particle size distribution is an important parameter of metallurgical coke for use in blast furnaces. It is usually analyzed by traditional sieving methods, which cause delays and require maintenance. In this paper, a coke particle detection model was developed using a deep learning-based object detection algorithm (YOLOv3). The results were used to estimate the particle size distribution by a statistical method. Images of coke on the main conveyor belt of a blast furnace were acquired for model training and testing, and the particle size distribution determined by sieving was used for verification of the results. The experiment results show that the particle detection model is fast and has a high accuracy; the absolute error of the particle size distribution between the detection method and the sieving method was less than 5%. The detection method provides a new approach for fast analysis of particle size distributions from images and holds promise for a future online application in the plant.

1. Introduction

In the ironmaking process, coke particle size distribution (PSD) is an important factor, which affects the permeability of the coke layers and therefore the gas flow distribution, heat and mass transfer, and chemical reactions in the blast furnace [1]. At present, sieving is the most common method for determining the PSD of coke, but the associated labor costs are high, the sieving requires considerable time, the environment is dusty, maintenance of the equipment is needed, and sieving sometimes leads to inconsistent results [2] because of manual or mechanical reasons. A rapid, highly efficient, and robust coke PSD measurement method would therefore be a welcome contribution to the development of the ironmaking process.
Recently, image analysis has become a very popular method for measuring particle size due to the developments of camera and computer technology, which can realize fast and accurate measurements [3]. Many studies have reported achievements in the coal industry [4,5,6,7,8,9,10,11] and mining industry [12,13,14,15,16,17,18] by using image analysis. They have successfully estimated the PSD [4,15,16,18], particle category [13,19,20], and quality [7,8,9,10,11] of coke and ore. However, not much research has been done on the detection of particles on an operating conveyor belt [5,12,15], and, to the best present knowledge of the authors, no work has been reported on the detection of coke on the main conveyor belt of a blast furnace.
A common practice of image analysis is to segment particles in the image [12] and extract certain features, such as area, circumference, and diameter. The segmentation of particles is the key to these methods, and its success affects the accuracy of the subsequent analysis. Depending on the kind or size of particles and their different uses, different segmentation algorithms and image-processing steps may be needed, and several parameters can only be tuned manually. Another approach is to estimate the PSD based on machine learning [5,14,18]. This method usually uses the whole image or features extracted from images such as texture and color and the corresponding PSD as the target, and the model of the relationship is developed using machine learning. However, it is difficult to explain a model established by machine learning with existing knowledge [21]; the relationship between images and PSD is very complex, so it is difficult to find and correct certain errors.
Today, deep learning [22] is state-of-the-art in image interpretation. It is a machine learning method based on neural networks, employing multiple processing layers to discover correlations between the input and output based on large data sets. Many fields have experienced breakthrough developments after adopting deep learning, with examples found in medicine [23], food [24], and agriculture [25]. Shrivastava et al. [17] implemented a Mask Region Convolutional Neural Network (RCNN) to locate particles in an image and predict PSD curves of dump material. The model showed good performance, and segmentation masks were drawn accurately. Fu et al. [26] developed an automatic measurement method of rockfill PSD using Mask RCNN, yielding great improvements in speed and accuracy compared to the traditional image-processing method. Duan et al. [27] designed a lightweight U-net deep learning network to automatically detect pellets from images. It achieved better segmentation performance and showed good robustness. Li et al. [28] proposed a coal gangue detection and recognition algorithm based on deformable convolution You Only Look Once v3 (DCN-YOLOv3). Its mean average prediction (MAP) exceeded 99% and the computation time was reduced drastically compared to alternative methods. The authors compared the models trained by Single Shot MultiBox Detector (SSD), YOLOv3, YOLOv4, YOLOv5, and DCN-YOLOv3, and the results indicated that DCN-YOLOv3 showed the highest accuracy and speed. However, only a small amount (3–6 particles per image) of dispersed coke particles in the laboratory were used in the experiments.
After detecting the particles from the images, the particle size measurement, PSD statistical method, and error correction method should be formulated according to the characteristics of the coke images. The PSD obtained by the sieving method is usually expressed by mass factions. Since the image can only obtain 2D information about the particles, an (indirect) estimate of the particle volume is needed to calculate the PSD. Hamzeloo et al. [15] found the maximum inscribed disk to be the most effective feature for describing the particle size. Zhang et al. [6] established an improved coarse coal particles mass model based on the projected area and density of the particles. Mora et al. [29] proposed a simple method to convert the area gradation to mass gradation and used a size correction factor to convert the particle sizes from the images to equivalent square sieve sizes. These investigations indicate the potential of image analysis to extract salient features about particulate matter. They also indicate that there is no generic method to calculate the PSD based on information obtained from images.
A blast furnace is a giant high-temperature reactor [30]. Metallurgical coke is continuously transported to the blast furnace by a conveyor belt. The coke particles are similar in color and are dense and overlapping on the conveyor belt. There is usually a lot of dust around the blast furnace, and the lighting conditions are not stable. All these matters bring about difficulties to the detection of coke particles. The successful application of image analysis and deep learning methods in other fields led to new ideas on how to measure coke particle size. In this study, the sieving PSD and images of the metallurgical coke sampled from the main conveyor belt of a blast furnace were acquired. An efficient coke particle detection model was developed based on the object detection algorithm YOLOv3 [31]. On the basis of the particle sizes detected by this model, an effective method for estimating the PSD was proposed. The model and the PSD statistical method have been tested on several images of coke particles from the conveyor belt, demonstrating the feasibility of the approach.

2. Materials and Methods

2.1. Data Acquisition

In order to make the results of the study useful for a practical application of the method, coke particle images were acquired from an industrial blast furnace at Shaoguan Steel, Guangdong province, China. In steel plants, coke is fed onto the main conveyor belt after passing through a storage hopper, a sieve (<25 mm), and a weighing hopper before being charged into the furnace, as shown in Figure 1. This makes the main conveyor belt of the blast furnace a good location to acquire images of the coke that is used in the ironmaking process.
The setup depicted in Figure 2 was used to take coke images. To obtain high-quality images, a Nikon D810 camera (Nikon Corporation, Tokyo, Japan) with an image resolution of 7360   ×   4912 was employed. The belt moves continuously during production, so camera parameters need to be adjusted to correct for motion blur to get sharp images. Motion blur is closely related to shutter speed, so the appropriate shutter speed can be calculated based on the speed of the belt. As the speed of the belt was 2   m / s , setting the camera shutter to 1 / 1000   s kept the motion blur less than 10 pixels [32]. The camera was fixed in a position where its lens was perpendicular to the main belt. An LED light of 50   W was placed beside the camera to ensure bright images.
For comparison, ten groups of data from different charged coke batches were analyzed. The PSDs of the groups were measured by sieving. A sample of 50 kg of each batch was taken from the weighing hopper before it entered the main conveyor belt. The coke particles were separated by a mechanical sieve according to particle sizes in the ranges of <25 mm, 25~40 mm, 40~60 mm, 60~80 mm, and >80 mm. The particles in the different ranges were weighed and the PSDs were calculated. Images were taken of each group of coke on the conveyor belt.

2.2. Coke Particle Detection Model

Coke particles are tightly packed on the belt, and the color of coke is black-white-grey, similar to the belt color. This increases the difficulty of particle detection, so it is necessary to develop a niche-targeting model. The object detection method identifies and calibrates the object in the image with a bounding box, which is a rectangular box that acts as a sieve aperture. In earlier research [32], four particle detection methods—the watershed algorithm, Hot of Gradient (HOG)+ Support Vector Machine (SVM), Faster RCNN, and YOLOv3—were tested and evaluated. Based on computation speed and accuracy as criteria, YOLOv3 was chosen as the basis of the coke particle detection model.

2.2.1. YOLOv3

YOLO [33], an abbreviation for the term ‘You Only Look Once’, is a fast and accurate object detection algorithm based on a convolutional neural network. YOLOv3 [31] is an upgraded version of YOLO. It is more accurate than the original method and better suited for identifying small objects. Unlike most detection algorithms that use repurpose classifier methods, YOLO use a regression method to detect targets, which enables end-to-end object detection.
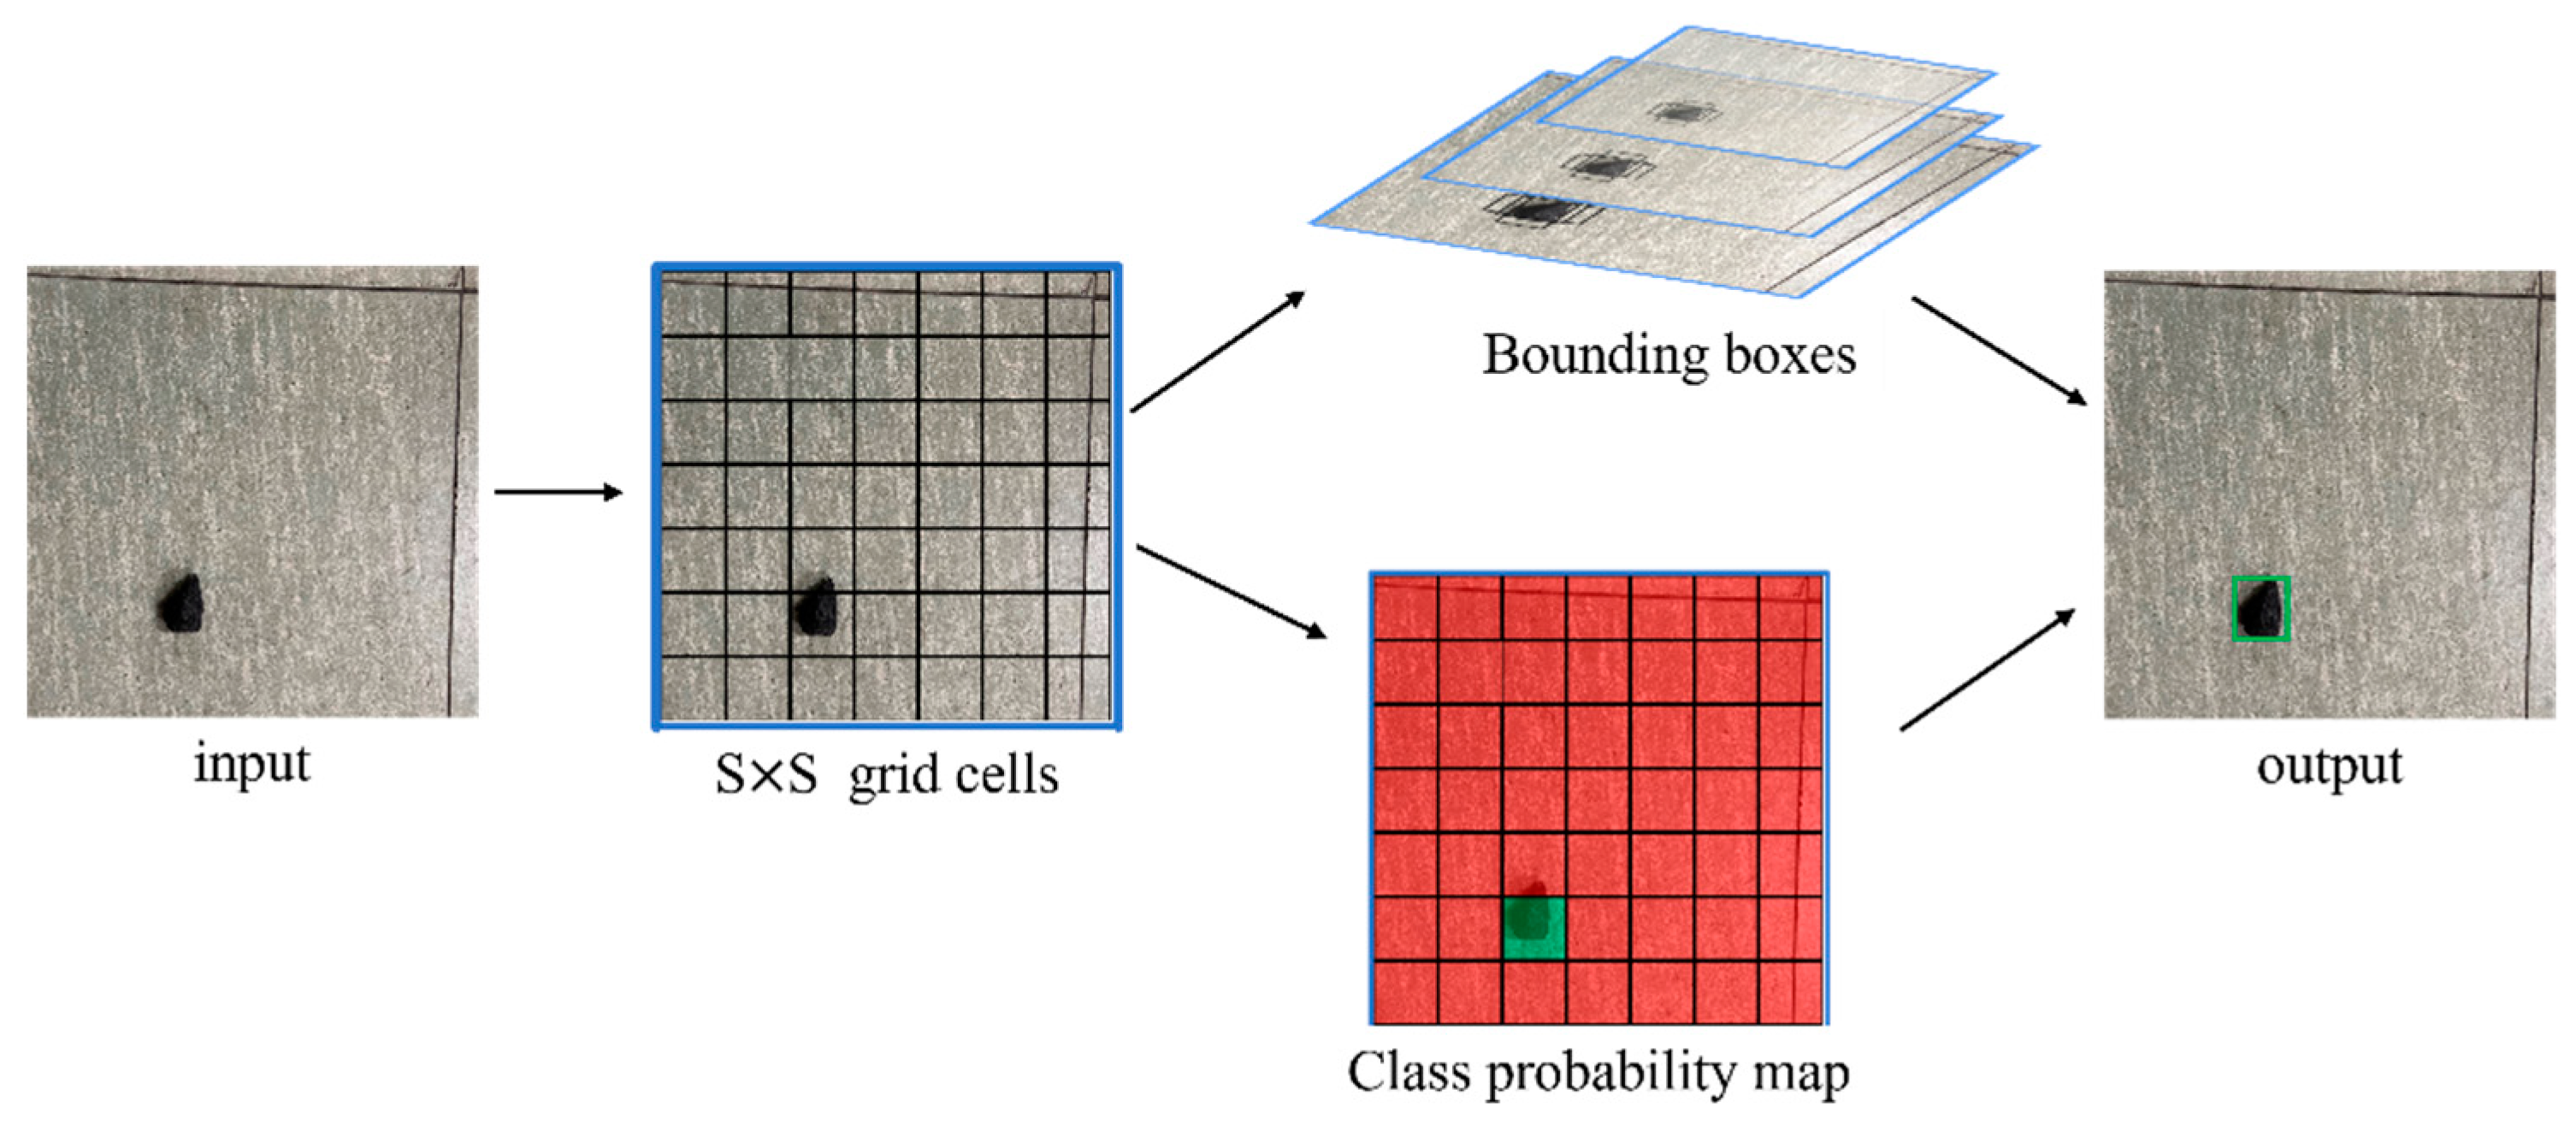
Figure 3 shows how YOLO arrives at results in an example. The input image is divided into S   ×   S grid cells, and the object location is predicted by the cell where its center is located. YOLOv3 predicts three bounding boxes for the object at three different scales and gives an objectness score for each bounding box using logistic regression. The objectness score is 1 if the bounding box is the best fit with the ground truth. This part uses the sum of squared errors loss during training. Each box predicts the classes based on multilabel classification. YOLOv3 uses independent logistic classifiers and binary cross-entropy loss for the class predictions. It is a good method for predicting complex image datasets and overlapping labels. The prediction of bounding boxes and classes are made simultaneously using a single convolutional neural network, which enables a fast prediction. YOLOv3 uses Darknet-53, a new network with 53 convolutional layers, for performing feature extraction. This network is more powerful than ResNet-101 [34] and more efficient than ResNet-101 or ResNet-152 [34], which are two efficient neural networks for image recognition.

2.2.2. Data Preparation and Model Training

The biggest difference between deep learning-based object detection methods and image-processing methods is that image features are learnt and extracted by convolutional neural networks instead of by a manual or other algorithms. This process applies supervised learning, i.e., trains the neural network using the training dataset with labels. The training set in this study holds the coke images as input and target coke particles as output. The coke particles of the training dataset were labelled manually. For coke particle detection, not only the classification but also the positions of the particles are needed. A wrong label will bring irreversible errors to the model. Therefore, due attention must be paid to assigning the correct location and size of the labelled particles.
The YOLOv3 object detection algorithm was used for model training. The input image size was 7360   ×   4912 pixels. In the training, a batch size of 8, a momentum term of 0.9, a decay term of 0.0005 and an initial learning rate of 10 4 were used. The network structure and data enhancement method were set following ref. [31]. The training was conducted in AI Studio, an artificial intelligence community based on Baidu’s deep learning platform, PaddlePaddle [35]; its configuration is reported in Table 1.

2.2.3. Evaluating Indicator

In this study, mean average precision (MAP) and frames per second (FPS) were used to evaluate the performance of the model.
The MAP was used to evaluate the accuracy of the object detection. Its maximum value is 100%, and a higher value indicates better performance of the model. The MAP is defined as [28]
MAP = 1 n i = 1 n A P i  
where n is the number of object classes, and A P i is the area under the curve of Recall-Precision of the i t h grade. Recall and precision are defined as [28]
Recall = T P T P + F N      
Precision = T P T P + F P ,
where TP, FP, and FN are the number of Ture Positives (correctly detected objects), False Positives (incorrectly detected objects), and False Negatives (undetected objects), respectively.
FPS was used to evaluate the speed of the object detection, which represents the number of images the model can process per second. Obviously, the speed of the model is also related to the performance of the hardware device, so the evaluation of model performance should be conducted on the same configuration of hardware.

2.3. Particle Size Statistics

Ideally, the object detection method can be applied in real applications in the industry. Nevertheless, there are some obvious differences between the particle size obtained by the object detection method and by the sieving method because a detection based on a single image from one direction cannot sense the three-dimensional features of the particles. Still, to assess the feasibility of the approach, a statistical method was developed to estimate the coke PSD based on the results of the object detection method.

2.3.1. Particle Size Measurement

The sieve used to analyze the coke PSD in this study had a square mesh. Whether a particle can pass through the apertures is related to its length, width, thickness, and shape [29]. The particle size measured by the object detection method is represented with a bounding box, as shown in Figure 4. The bounding box is a rectangular box with four sides parallel to the edges of the image and circumscribed around the particle. There are two parameters of the bounding box: length and width.

2.3.2. Size Conversion

The coke particle size in images is expressed in pixels, which need to be converted into a physical unit in the statistical analysis. In general, a calibration template is used for size conversion [16], but we used the belt width as a scale in this study. In the coke image, the width of the belt ( w b ) is known, so after determining the pixel size ( w p ) of the belt, the scale factor is given by
f p 2 b = w b / w p ,

2.3.3. PSD Calculation

The PSD of coke in the steelmaking industry is usually represented in terms of the mass fraction, so the volume and mass of the particles should be calculated according to the width of the bounding boxes. Particles from the same source usually have similar shape characteristics, so the average thickness ( t ) can be estimated from the other dimensions of the particle such as width ( w ) with particle thickness factor ( λ ) [29]
t = λ   ×   w  
Thus, the volume of the particle can be calculated based on the detection area ( s ) and length ( h ) as
v = s   ×   t = λ   ×   s   ×   w = λ   ×   h   ×   w 2
Assuming that particles from the same source have the same density ( ρ ), the mass of the particles can be calculated, and thus the mass ratio of particles in one size range to all particles is given by
p = ρ × λ × i = 1 k h i × w i 2 ρ × λ × i = 1 n h i × w i 2 = = i = 1 k h i × w i 2 i = 1 n h i × w i 2   ,
where k is the number of particles of one size range and n is the total number of particles. As can be seen in Equation (7), λ and ρ cancel in the calculation process, so they do not affect the calculation result of PSD. Thus, the PSD is only related to the detection area and size of the particles.

2.3.4. PSD Correction

Some differences were observed between the coke PSD obtained by the object detection method and the sieving method. These were mainly caused by two factors. One is the difference in particle size measurement. The sieving method uses mesh, and the detection method uses the width of bounding boxes to measure the size of particles. Another is that the images only show particles on the surface of the pile, while particles inside the pile are not seen.
Bernhardt [36] and Mora et al. [29] used correction coefficients to realize the conversion of circular-aperture sieve sizes to square-aperture sieve sizes and the particle sizes measured by the digital image-processing technique to the square-aperture sieve sizes, respectively. The conversions were demonstrated to work well. Inspired by these findings, we used correction coefficients ( c i , i = 1 ,   2 , ,   5 ) to adjust the particle size ( w d ) of each range.
w c = c i   ×   w d
The best c i values were determined based on the root mean square error (RMSE). The function fmincon from the MATLAB [37] optimization toolbox was used with the objective function
f = min ( i = 1 N RMSE i ) ,
RMSE = 1 5 i = 1 5 ( PSD c , i PSD r , i ) 2
PSD = [ p 1 , p 2 , , p 5 ]   ,
where N is the number of training data. PSD c and PSD r are the PSD matrix after correction and the measured value, respectively.

3. Results and Discussion

3.1. Data Analysis

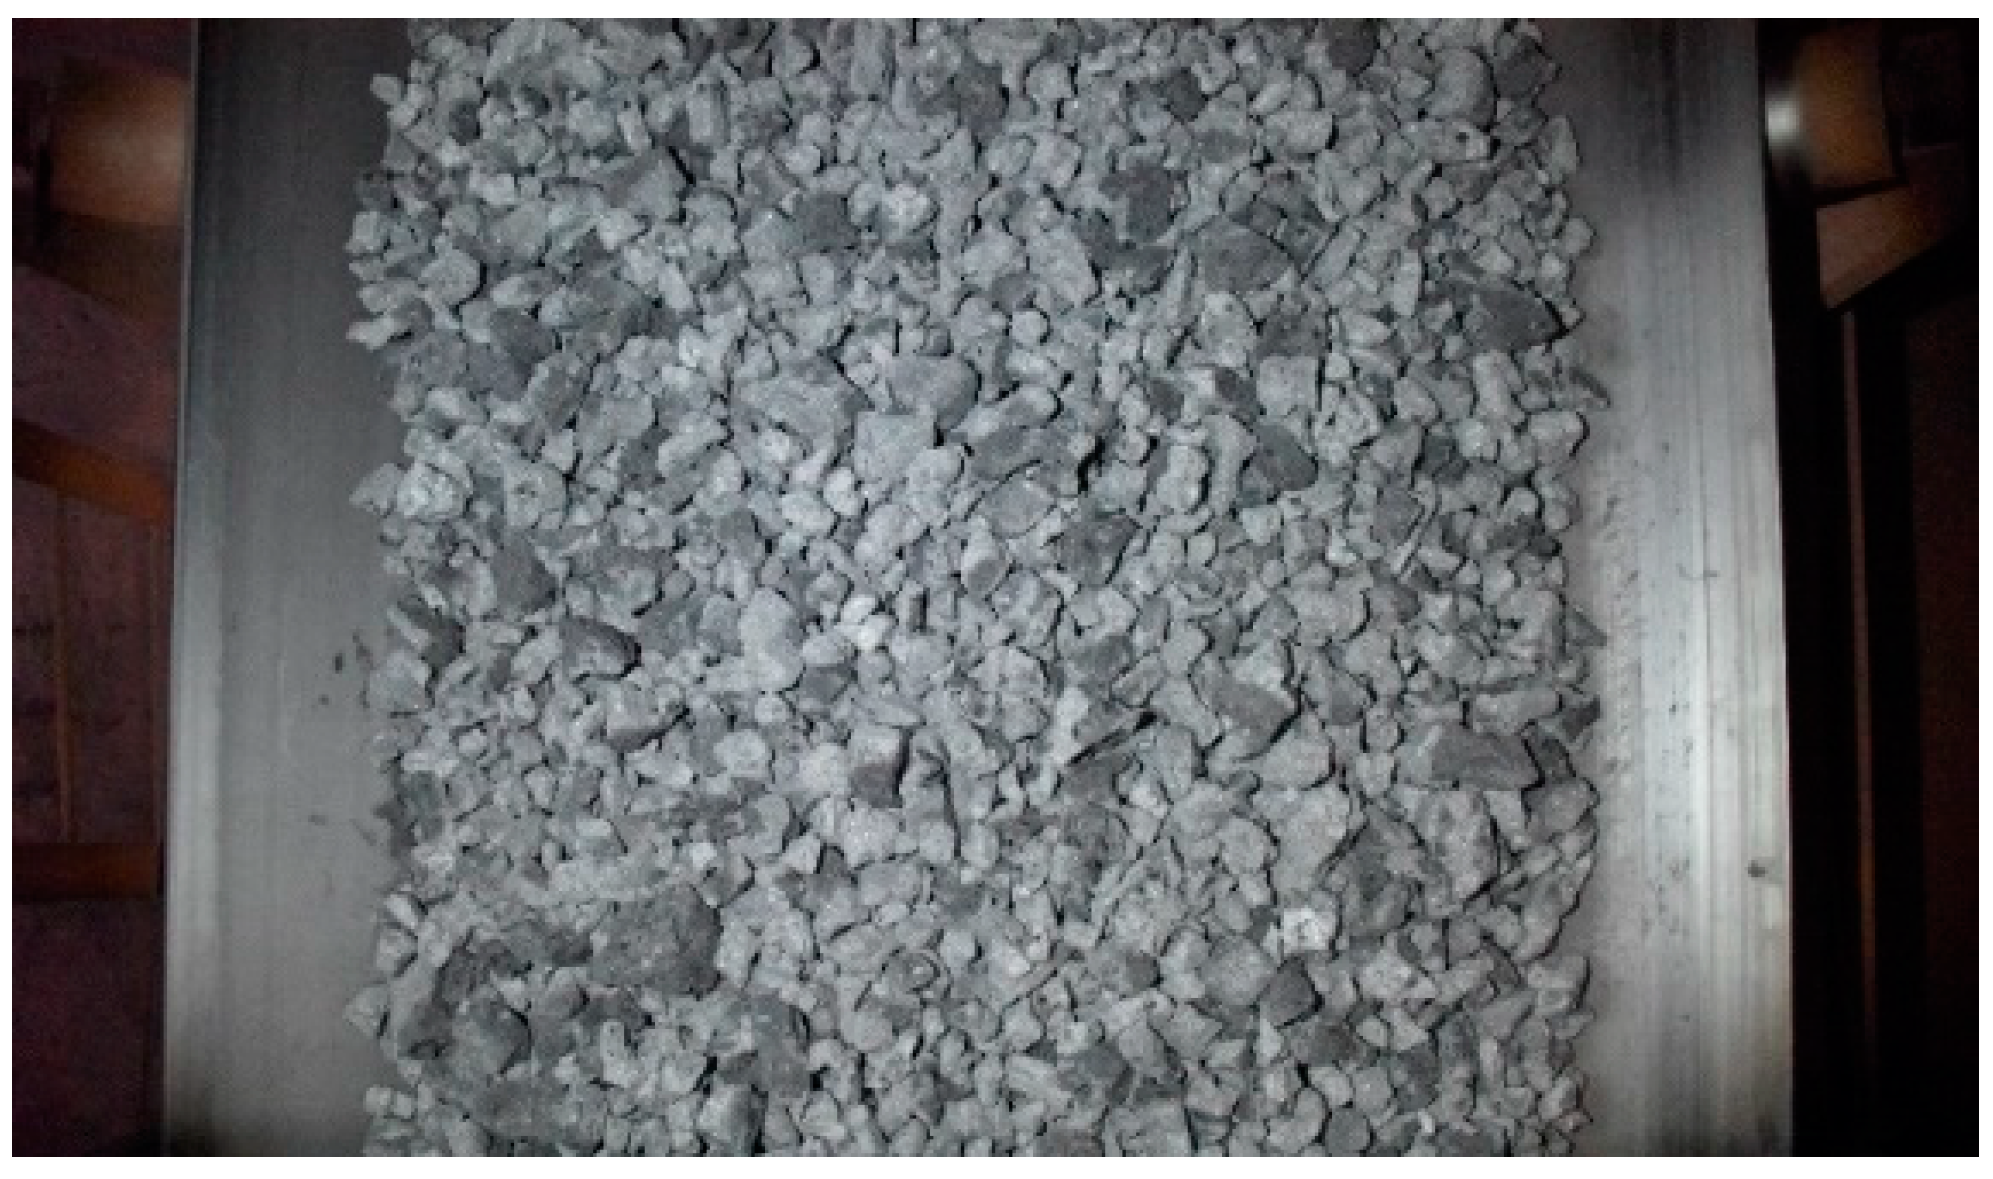
Figure 5 shows an example of an acquired image. It is clear and bright, with clearly visible coke particles. The two edges of the belt are distinct, which is also important for subsequent size conversion. About 200 of these images were used for this research, containing more than 30,000 coke particles.
The PSDs of sieving results measured by coke batches are shown in Figure 6. These groups of PSDs basically increased first, reached the maximum particle size range of 40~60 mm, and then decreased. Based on these findings, group #2 was considered an outlier and was therefore removed.

3.2. Model Development and Evaluation

The 128 coke images acquired from the main conveyor belt were labelled (as shown in Figure 7) as the dataset, in which the ratio of training set to testing set was 7:3, and there were about 23,000 coke labels in total.
The model was trained for up to eight hours and completed 20,000 iterations. The final MAP of the coke particle model was 88.3%. The coke particle detection model was evaluated on 20 coke images. Figure 8 illustrates one of the images and the detection results, which shows that almost every coke particle in the image was detected and the size of bounding boxes appear proper. The speed and accuracy of the results are shown in Figure 9. The detection speed ranged from 2.7 to 2.9 FPS and the MAP from 71.7% to 86.2%. These results show that the object detection method is feasible for estimating particle size in terms of detection accuracy and speed.

3.3. PSD Statistics

Considering the parameters of the bounding boxes and common particle sizes, the (1) length, (2) width, (3) average length and width, (4) diagonal, and (5) equivalent circle diameter were analyzed. The potential to estimate the particle size based on these five measures was evaluated by correlation analysis in MATLAB software (R2021b, 9.11.0, The MathWorks Inc., Natick, MA, USA, 2021). A test was undertaken on 118 coke particles, with results shown in Figure 10. All five parameters showed a high correlation with the sieving particle size, and the latter four have practically equally good correlation with the sieving size. According to the sieving principle, the minimum aperture that particles can pass through is closely related to the particle width [29]. Therefore, the width of the bounding box was selected to be the representative parameter of the coke particle size.
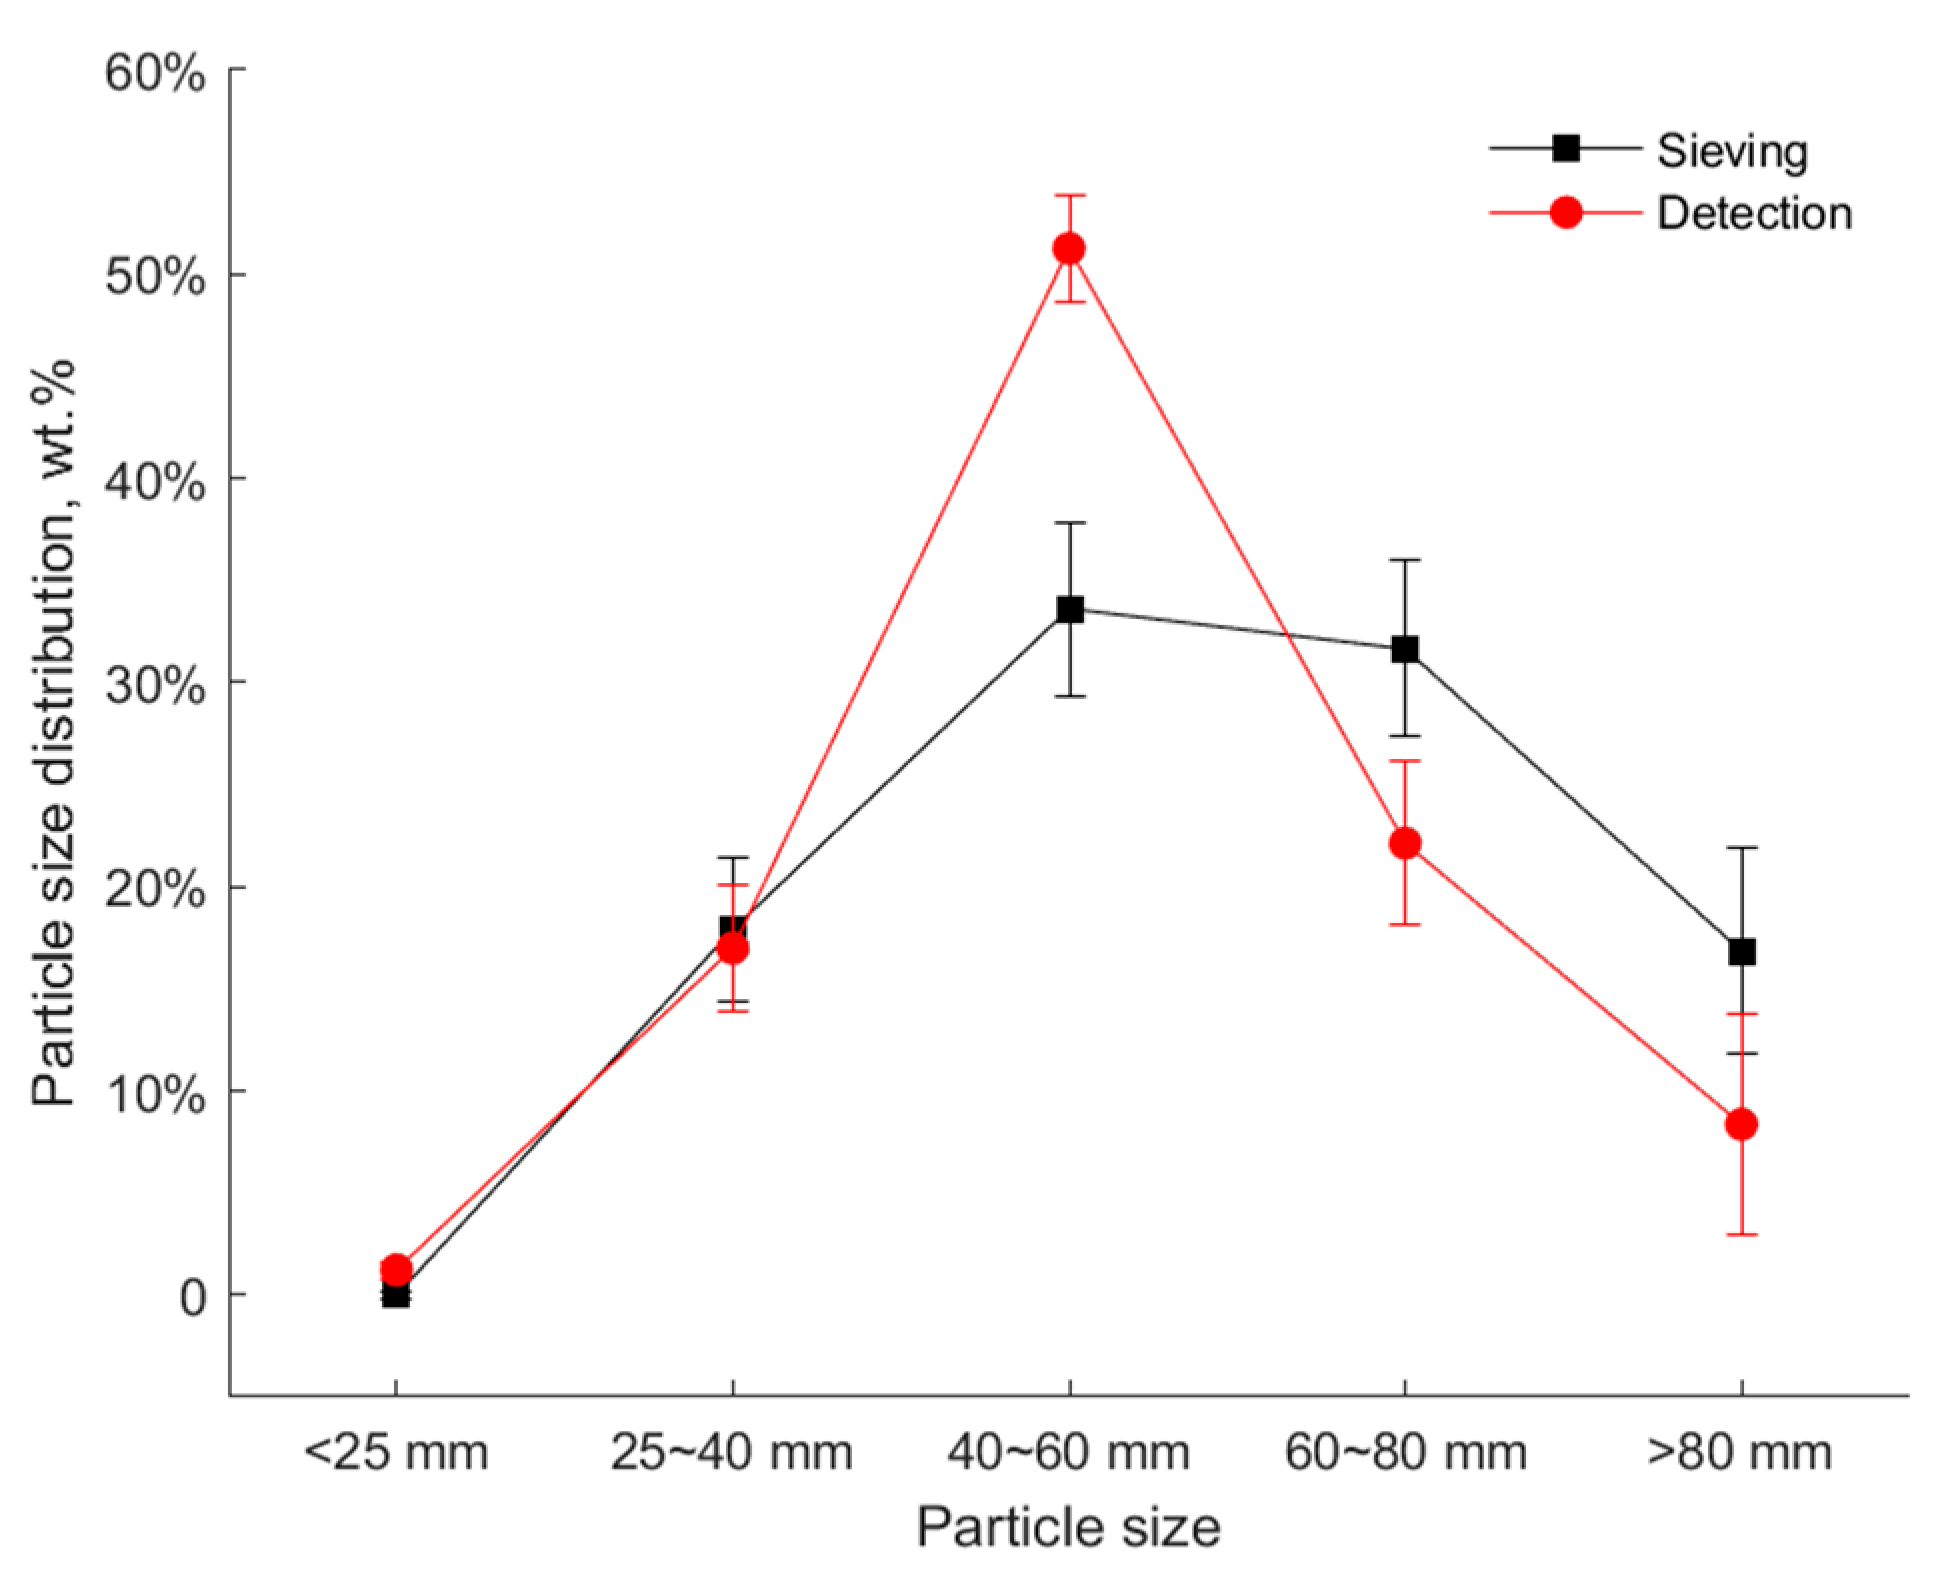
The nine groups of images for which sieving PSDs were available (cf. Figure 6) were next analyzed by the detection model. After size conversion, the PSD was estimated. There were three images in each coke group, so an average of the results for each group was taken. Figure 11 shows the PSDs determined by the sieving PSD method (black line) and by the image-based method (red line) for group #1. The differences between the distributions were small when the particle size was small, but errors appeared for the larger particle sizes.
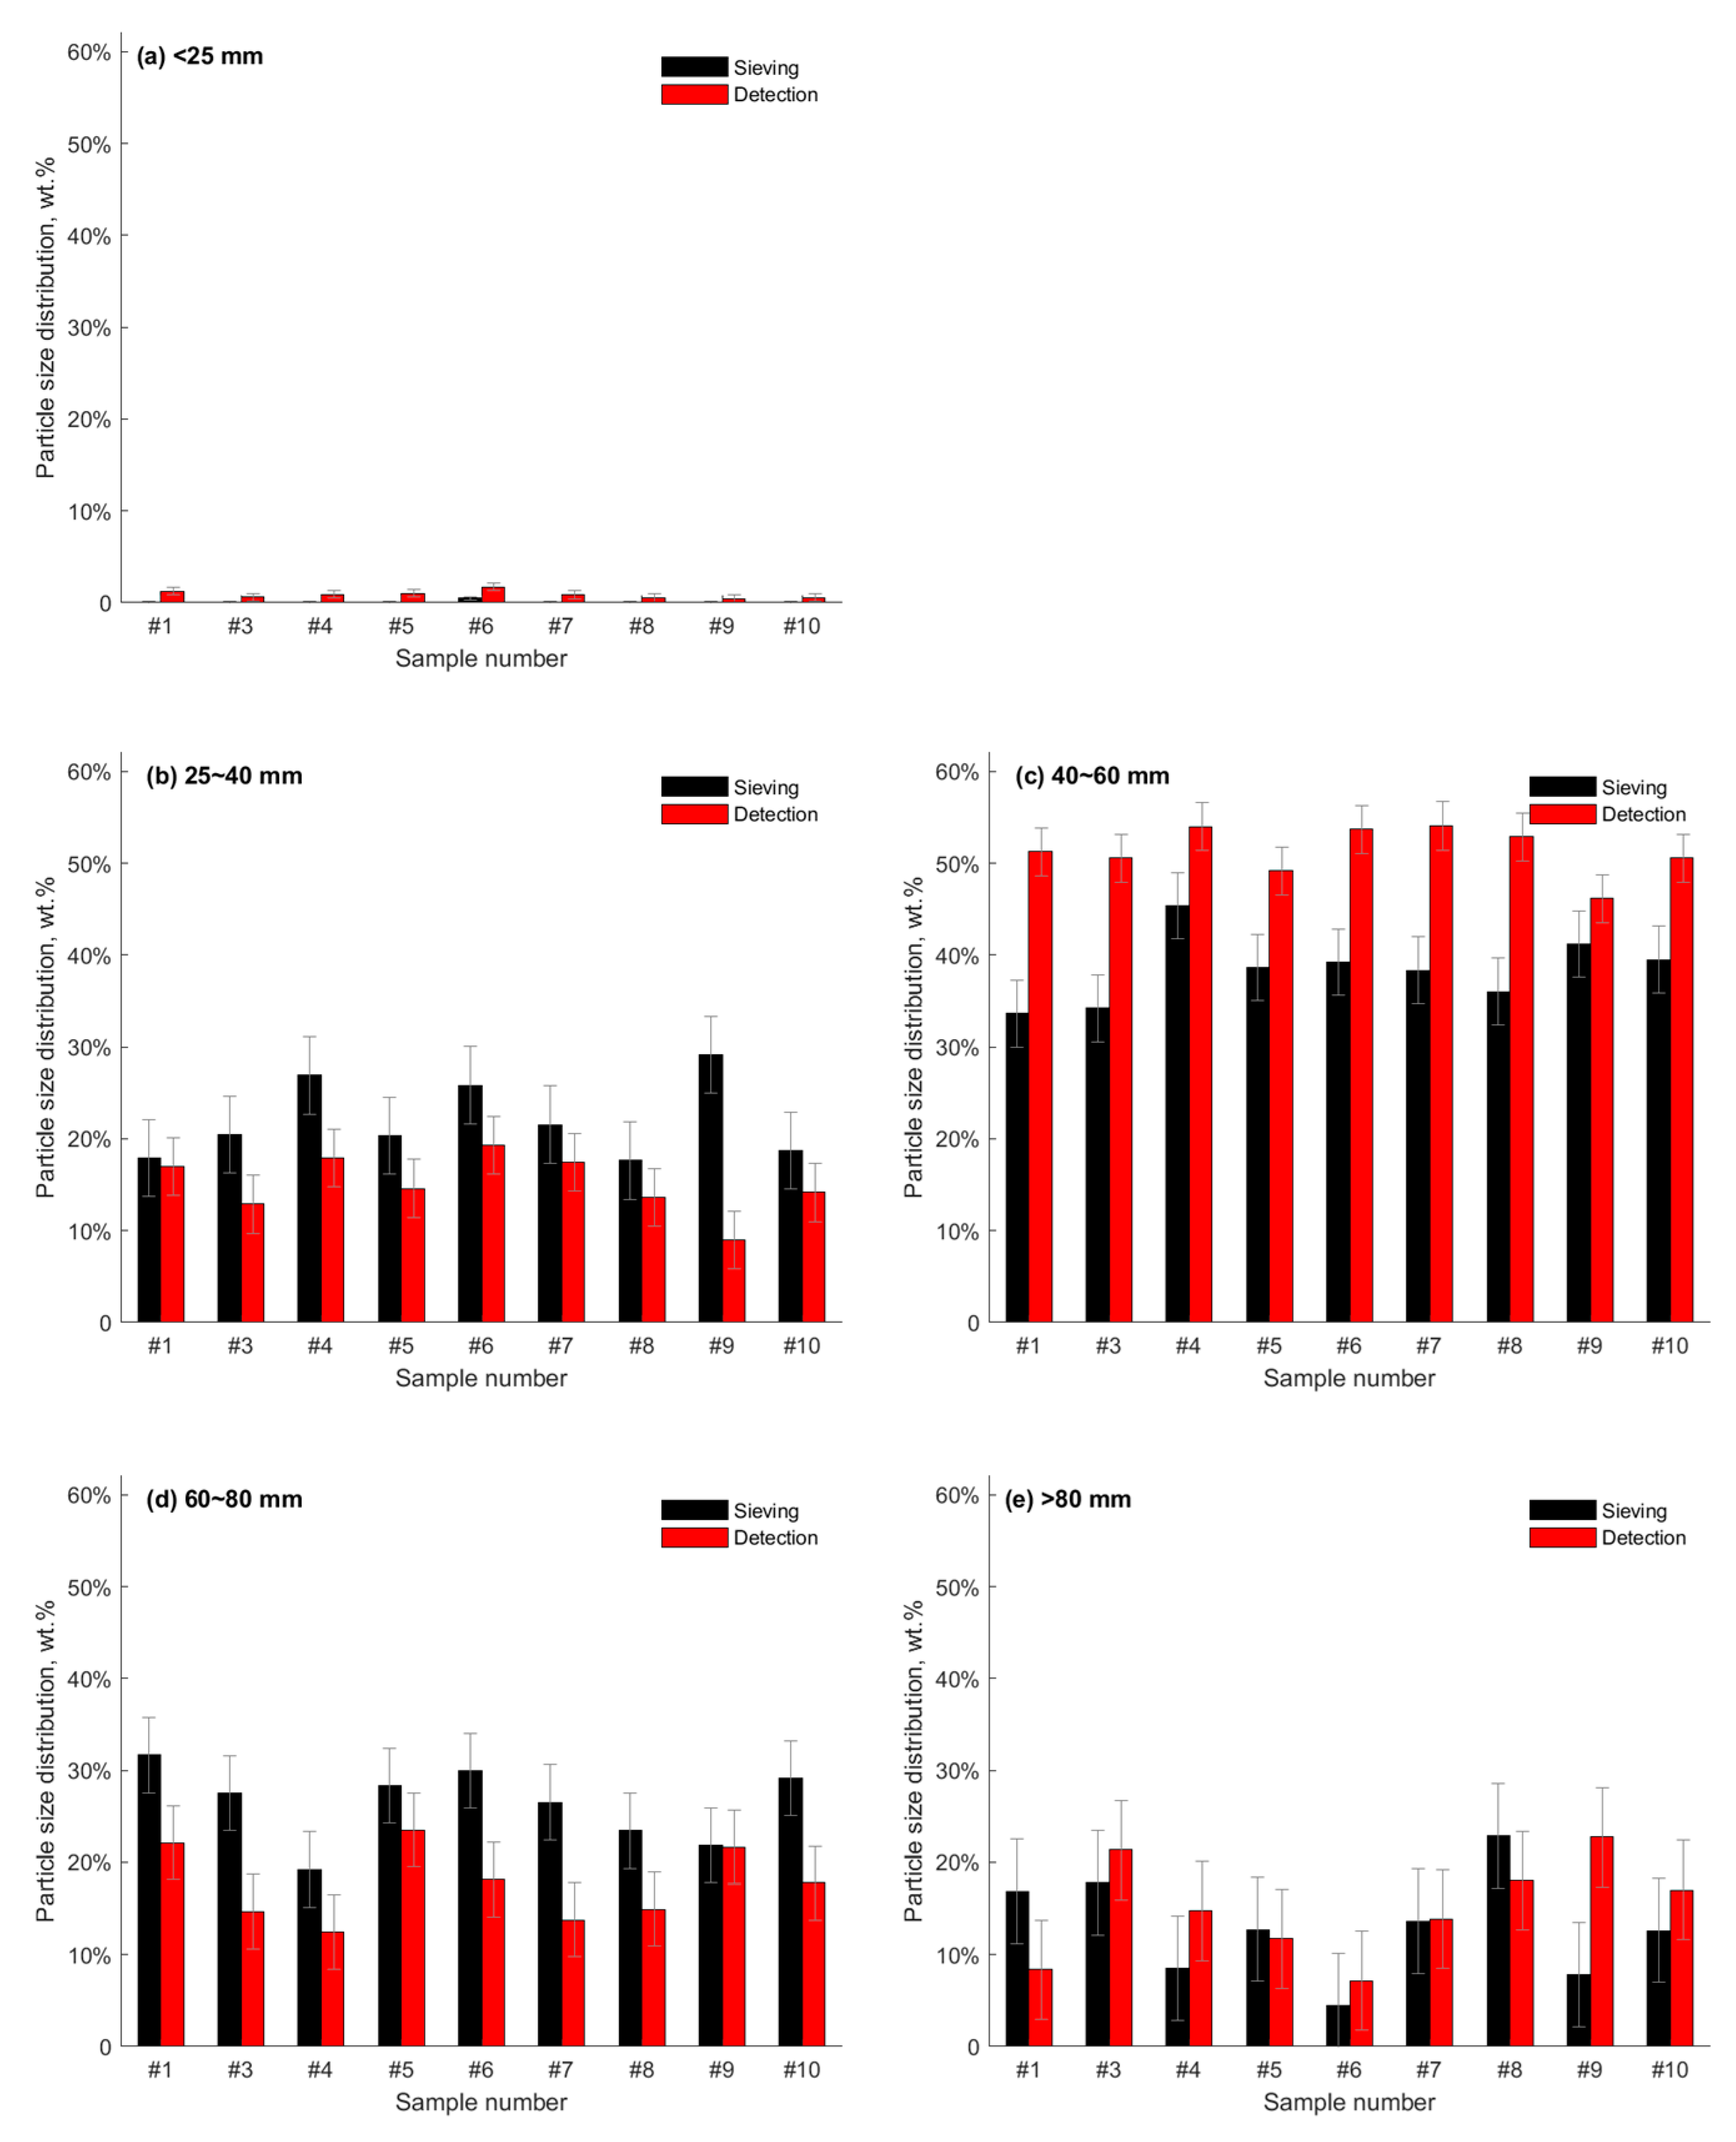
The PSD for the detected method and from sieving for the particle size classification ranges <25 mm, 25~40 mm, 40~60 mm, 60~80 mm, and >80 mm, of groups #1 and #3~10 are shown in Figure 12. Particles of size < 25 mm were almost zero in the sieving results because the coke was screened to remove the small coke (<25 mm) before being fed to the blast furnace. Although some fine particles are generated during handling and transport, the share of fine particles is limited. The detected shares of particles < 25 mm were all less than 0.5%, so the estimate was accurate. As for the ranges 25~40 mm and 60~80 mm, the detected shares were smaller than those from sieving, and, in turn, bigger for the 40~60 mm particles. A reason for this discrepancy is that the small particles (25~40 mm) surrounding large particles are misjudged as large particles by the model. Furthermore, some large particles have uneven surfaces that can be mistaken for smaller particles. As for the largest particle size range (>80 mm), based on the results in Figure 12, there were no systematic errors; the model sometimes overestimates and sometimes underestimates the shares.

3.4. Data Acquisition PSD Error Correction

Based on the above observations, an error correction was introduced for each size range. The particles were reclassified after the correction, and the revised PSDs were calculated. The first six of the nine groups were used as the training set, and the last three groups were used as the test set. Using the training set, fmincon required 12 iterations to find the solution with an objective function value of 0.226, as shown in Figure 13. The optimal correction coefficients are reported in Table 2.
The resulting corrections were evaluated in the test set. Figure 14 shows the PSD for the sieving (black lines), as well as the detected (red lines) and the corrected PSD (blue lines) for the model. The corrected PSDs were seen to be basically consistent with the sieving results for groups #8 and #10, while the improvement for group #9 was minor. The mean absolute errors of the detection PSDs and the corrected PSDs for the test set are reported in Table 3. After correction, the mean absolute error for groups #8 and #10 decreased by 4.2% and 2.6% respectively, but for group #9, it increased by 0.3%. The average absolute error of the corrected PSDs for the test set was 4.7%. This indicates that the statistical method proposed is feasible for estimating the PSD of coke particles detected by the image analysis approach.

3.5. Discussion

The data used in this study were from images and sieving the PSD of coke collected from the main conveyor belt of a blast furnace. It is obvious that the results obtained using real data [14,15,17,26] have more practical implications than those using laboratory data [4,6,12,16,28,38,39,40] and make the research results more readily applicable in practice.
The YOLOv3 algorithm based on deep learning was used to develop the coke particle detection model. Li et al. [28] proposed a coal gangue detection and recognition algorithm based on DCN-YOLOv3. The MAP of the DCN-YOLOv3 model was 99%, which is higher than for our results (80%), and the classification speed was 33 FPS, i.e., considerably faster than for our method (3 FPS). The most important reason for these results was the number of particles in the images. The dataset used by Li et al. had 3–6 scattered particles in each image while our images had hundreds of tightly packed and overlapping particles. For the images in the present research, the results met the expectations and demonstrated the feasibility of the object detection method for determining the particle size of metallurgical coke under industrial conditions. The model accuracy is expected to improve if trained on a larger amount of data, which leaves room for model improvement. Furthermore, it is feasible to gradually increase and update the dataset during the practical application of the model.
Different from the model based on the image segmentation algorithm [4,12,15,16,17] to determine the irregular edges of particles, the model based on object detection [26,28] detects the edges of particles and marks them with bounding boxes. This reduces the work for data preparation, model training, and prediction, which is useful for dense coke images. Bounding boxes can also detect incomplete particles, which is useful for overlapping particles. However, it also reduces the accuracy of particle detection since the size of the particle is only expressed by the length and width of the bounding box. The resulting errors can be reduced by a reasonable post-processing method.
Hamzeloo et al. [15] used equivalent spheres to estimate the particle volume. Although this method has achieved good results, it is not applicable to the bounding box particle characterization method used in this study. We used the width of the bounding box to represent the particle size according to the results of correlation and literature [29] analysis. Bai et al. [4] converted particle area to the equivalent circle diameter to divide particle size fractions, then calculated the PSD with the percentage of each fraction area. This method may lead to unexpected errors because the PSD of metallurgical coke is expressed as mass fractions. Therefore, we converted particle size into mass before calculating the PSD. It is interesting that the expression for estimating the PSD is related to the product of the square of particle width and length, which is similar to the formula for the area of an ellipse. In the method, the PSD of the coke pile was estimated based on observations of its surface, which introduces some errors. Therefore, the PSDs obtained by sieving were used as calibration data to correct the image-based detection results. The results showed that this led to lower errors between the PSDs determined by sieving and calculation, which is consistent with the findings of Ref. [4]. The relationship between the PSD detected based on images of the surface and the overall PSD determined by sieving is still not clarified, and the role of coke shape and stacking procedure may affect this relationship. These are issues to be studied in future research.
In summary, the present study showed that image analysis combined with deep learning can realize a rapid, relatively accurate, and contactless estimation of the PSD of metallurgical coke. The large amount of data in the production process makes it possible to train and update the model if changes in the sources handling the raw materials occur in the plant. A further development could be to detect not only coke but also sinter, pellets, and other raw materials, and analyze their PSDs.

4. Conclusions

A method for estimating the particle size distribution (PSD) of metallurgical coke from images based on object detection has been presented. Coke images on the main belt of a blast furnace were acquired for developing the model. A coke particle size detection model with the mean average prediction accuracy of 88% has been developed using YOLOv3. By testing 20 images, the average calculation speed was found to be about three frames per second and the accuracy was 80%, which shows the good performance of the model.
According to the detection results, the specific PSD estimation method, including particle size measurement, size conversion, PSD calculation, and error correction was proposed. Nine groups of coke were selected, and the PSD was determined by sieving. Six of the groups were used for model training and three for validation. The average absolute error of the resulting PSD of the test set was 4.6%, which demonstrates that the proposed method is feasible and that it holds promise for future application in the industrial plant. However, future work should use more data to increase the accuracy and robustness of the model. More attention should also be paid to how the results of the model could be utilized to support the practical operation of the blast furnace.

Author Contributions

Conceptualization, M.L. and Y.Y.; methodology, M.L., Y.Y. and H.S.; software, M.L. and X.W.; validation, M.L., X.W. and H.Y.; formal analysis, M.L.; investigation, M.L., X.W. and H.Y.; resources, Y.Y. and H.S.; data curation, M.L., X.W. and H.Y.; writing—original draft preparation, M.L.; writing—review and editing, H.S. and M.L.; visualization, M.L.; supervision, Y.Y. and H.S.; project administration, Y.Y. and M.L.; funding acquisition, Y.Y. and H.S. All authors have read and agreed to the published version of the manuscript.

Funding

This research was funded by China Scholarship Council, grant number 202106890009.

Institutional Review Board Statement

Not applicable.

Informed Consent Statement

Not applicable.

Data Availability Statement

The datasets used and/or analyzed during the current study are available from the corresponding author on reasonable request.

Conflicts of Interest

The authors declare no conflict of interest.

References

  1. Díez, M.A.; Alvarez, R.; Barriocanal, C. Coal for metallurgical coke production: Predictions of coke quality and future requirements for cokemaking. Int. J. Coal Geol. 2002, 50, 389–412. [Google Scholar] [CrossRef]
  2. Fernlund, J.M.R. The effect of particle form on sieve analysis: A test by image analysis. Eng. Geol. 1998, 50, 111–124. [Google Scholar] [CrossRef]
  3. Liang, G.; Dong, C.; Hu, B.; Zhu, H.; Yuan, H.; Jiang, Y.; Hao, G. Prediction of Moisture Content for Congou Black Tea Withering Leaves Using Image Features and Nonlinear Method. Sci. Rep. 2018, 8, 7854. [Google Scholar] [CrossRef] [PubMed]
  4. Bai, F.; Fan, M.; Yang, H.; Dong, L. Image segmentation method for coal particle size distribution analysis. Particuology 2021, 56, 163–170. [Google Scholar] [CrossRef]
  5. Jemwa, G.T.; Aldrich, C. Estimating size fraction categories of coal particles on conveyor belts using image texture modeling methods. Expert Syst. Appl. 2012, 39, 7947–7960. [Google Scholar] [CrossRef]
  6. Zhang, Z.; Yang, J.; Ding, L.; Zhao, Y. An improved estimation of coal particle mass using image analysis. Powder Technol. 2012, 229, 178–184. [Google Scholar] [CrossRef]
  7. Gorai, A.K.; Raval, S.; Patel, A.K.; Chatterjee, S.; Gautam, T. Design and development of a machine vision system using artificial neural network-based algorithm for automated coal characterization. Int. J. Coal Sci. Technol. 2021, 8, 737–755. [Google Scholar] [CrossRef]
  8. Başyiğit, M.; Özer, S.C.; Fişne, A. The relationship between coal surface chromaticity and coal quality parameters: A preliminary investigation. Int. J. Coal Prep. Util. 2021, 1–16. [Google Scholar] [CrossRef]
  9. Zhang, Z.; Yang, J.; Wang, Y.; Dou, D.; Xia, W. Ash content prediction of coarse coal by image analysis and GA-SVM. Powder Technol. 2014, 268, 429–435. [Google Scholar] [CrossRef]
  10. Zhang, Z.; Liu, Y.; Hu, Q.; Zhang, Z.; Wang, L.; Liu, X.; Xia, X. Multi-information online detection of coal quality based on machine vision. Powder Technol. 2020, 374, 250–262. [Google Scholar] [CrossRef]
  11. Qiu, Z.; Dou, D.; Zhou, D.; Yang, J. On-line prediction of clean coal ash content based on image analysis. Measurement 2021, 173, 108663. [Google Scholar] [CrossRef]
  12. Zhang, Z.; Yang, J.; Su, X.; Ding, L.; Wang, Y. Multi-scale image segmentation of coal piles on a belt based on the Hessian matrix. Particuology 2013, 11, 549–555. [Google Scholar] [CrossRef]
  13. Liu, Y.; Zhang, Z.; Liu, X.; Wang, L.; Xia, X. Efficient image segmentation based on deep learning for mineral image classification. Adv. Powder Technol. 2021, 32, 3885–3903. [Google Scholar] [CrossRef]
  14. Olivier, L.E.; Maritz, M.G.; Craig, I.K. Estimating ore particle size distribution using a deep convolutional neural network. IFAC-Pap. 2020, 53, 12038–12043. [Google Scholar] [CrossRef]
  15. Hamzeloo, E.; Massinaei, M.; Mehrshad, N. Estimation of particle size distribution on an industrial conveyor belt using image analysis and neural networks. Powder Technol. 2014, 261, 185–190. [Google Scholar] [CrossRef]
  16. Zhang, Z.; Yang, J.; Ding, L.; Zhao, Y. Estimation of coal particle size distribution by image segmentation. Int. J. Min. Sci. Technol. 2012, 22, 739–744. [Google Scholar] [CrossRef]
  17. Shrivastava, S.; Deb, D.; Bhattacharjee, S. Prediction of Particle Size Distribution Curves of Dump Materials Using Convolutional Neural Networks. Rock Mech. Rock Eng. 2022, 55, 471–479. [Google Scholar] [CrossRef]
  18. Yaghoobi, H.; Mansouri, H.; Ebrahimi Farsangi, M.A.; Nezamabadi-Pour, H. Determining the fragmented rock size distribution using textural feature extraction of images. Powder Technol. 2019, 342, 630–641. [Google Scholar] [CrossRef]
  19. Sinaice, B.B.; Owada, N.; Saadat, M.; Toriya, H.; Inagaki, F.; Bagai, Z.; Kawamura, Y. Coupling NCA dimensionality reduction with machine learning in multispectral rock classification problems. Minerals 2021, 11, 846. [Google Scholar] [CrossRef]
  20. Perez, C.A.; Saravia, J.A.; Navarro, C.F.; Schulz, D.A.; Aravena, C.M.; Galdames, F.J. Rock lithological classification using multi-scale Gabor features from sub-images, and voting with rock contour information. Int. J. Miner. Process. 2015, 144, 56–64. [Google Scholar] [CrossRef]
  21. Biran, O.; Cotton, C. Explanation and Justification in Machine Learning: A Survey. IJCAI-17 2017, 8, 8–13. [Google Scholar]
  22. LeCun, Y.; Bengio, Y.; Hinton, G. Deep learning. Nature 2015, 521, 436–444. [Google Scholar] [CrossRef] [PubMed]
  23. Ching, T.; Himmelstein, D.S.; Beaulieu-Jones, B.K.; Kalinin, A.A.; Do, B.T.; Way, G.P.; Ferrero, E.; Agapow, P.; Zietz, M.; Hoffman, M.M.; et al. Opportunities and obstacles for deep learning in biology and medicine. J. R. Soc. Interface 2018, 15, 1742–5662. [Google Scholar] [CrossRef] [PubMed]
  24. Zhou, L.; Zhang, C.; Liu, F.; Qiu, Z.; He, Y. Application of Deep Learning in Food: A Review. Compr. Rev. Food Sci. Food Saf. 2019, 18, 1793–1811. [Google Scholar] [CrossRef]
  25. Kamilaris, A.; Prenafeta-Boldú, F.X. Deep learning in agriculture: A survey. Comput. Electron. Agric. 2018, 147, 70–90. [Google Scholar] [CrossRef]
  26. Fu, L.; Xu, X.; Jin, F.; Zhou, H. Evaluation of the particle size distribution of on-site rockfill using mask R-CNN deep learning model. In Proceedings of the 2021 7th International Conference on Hydraulic and Civil Engineering & Smart Water Conservancy and Intelligent Disaster Reduction Forum (ICHCE & SWIDR), Nanjing, China, 6 November 2021. [Google Scholar] [CrossRef]
  27. Duan, J.; Liu, X.; Wu, X.; Mao, C. Detection and segmentation of iron ore green pellets in images using lightweight U-net deep learning network. Neural Comput. Appl. 2020, 32, 5775–5790. [Google Scholar] [CrossRef]
  28. Li, D.; Wang, G.; Zhang, Y.; Wang, S. Coal gangue detection and recognition algorithm based on deformable convolution YOLOv3. IET Image Process. 2022, 16, 134–144. [Google Scholar] [CrossRef]
  29. Mora, C.F.; Kwan, A.K.H.; Chan, H.C. Particle Size Distribution Analysis of Coarse Aggregate Using Digital Image Processing. Cem. Concr. Res. 1998, 28, 921–932. [Google Scholar] [CrossRef]
  30. Chen, X.; Liu, F.; Hou, Q.; Lu, Y. Industrial high-temperature radar and imaging technology in blast furnace burden distribution monitoring process. In Proceedings of the 2009 9th International Conference on Electronic Measurement & Instruments, Nanjing, China, 16–19 August 2009. [Google Scholar] [CrossRef]
  31. Redmon, J.; Farhadi, A. YOLOv3: An Incremental Improvement. arXiv 2018, arXiv:1804.02767. [Google Scholar]
  32. Li, M. Analysis of Particle Size Distribution Based on Deep Learning and Study of Coke’s Moisture. Master’s Thesis, Shanghai University, Shanghai, China, 2021. [Google Scholar]
  33. Redmon, J.; Divvala, S.; Girshick, R.; Farhadi, A. You Only Look Once: Unified, Real-Time Object Detection. In Proceedings of the IEEE Conference on Computer Vision and Pattern Recognition, Seattle, WA, USA, 27–30 June 2016. [Google Scholar] [CrossRef] [Green Version]
  34. He, K.; Zhang, X.; Ren, S.; Sun, J. Deep residual learning for image recognition. In Proceedings of the IEEE Conference on Computer Vision and Pattern Recognition, Seattle, WA, USA, 27–30 June 2016. [Google Scholar] [CrossRef]
  35. PaddlePaddle. 2021. Available online: https://github.com/PaddlePaddle/Paddle (accessed on 1 June 2021).
  36. Bernhardt, I.C.B. Particle Size Analysis: Classification and Sedimentation Methods; Chapman & Hall: London, UK, 1994; pp. 197–239. [Google Scholar]
  37. MATLAB. MATLAB (R2021b), (version 9.11.0); Windows; The MathWorks Inc.: Natick, MA, USA, 2021. [Google Scholar]
  38. Kim, H.; Haas, C.T.; Rauch, A.F.; Browne, C. 3D image segmentation of aggregates from laser profiling. Comput.-Aided Civ. Infrastruct. Eng. 2003, 18, 254–263. [Google Scholar] [CrossRef]
  39. Zhang, Z. Particle overlapping error correction for coal size distribution estimation by image analysis. Int. J. Miner. Process. 2016, 155, 136–139. [Google Scholar] [CrossRef]
  40. Liao, C.W.; Tarng, Y.S. On-line automatic optical inspection system for coarse particle size distribution. Powder Technol. 2009, 189, 508–513. [Google Scholar] [CrossRef]
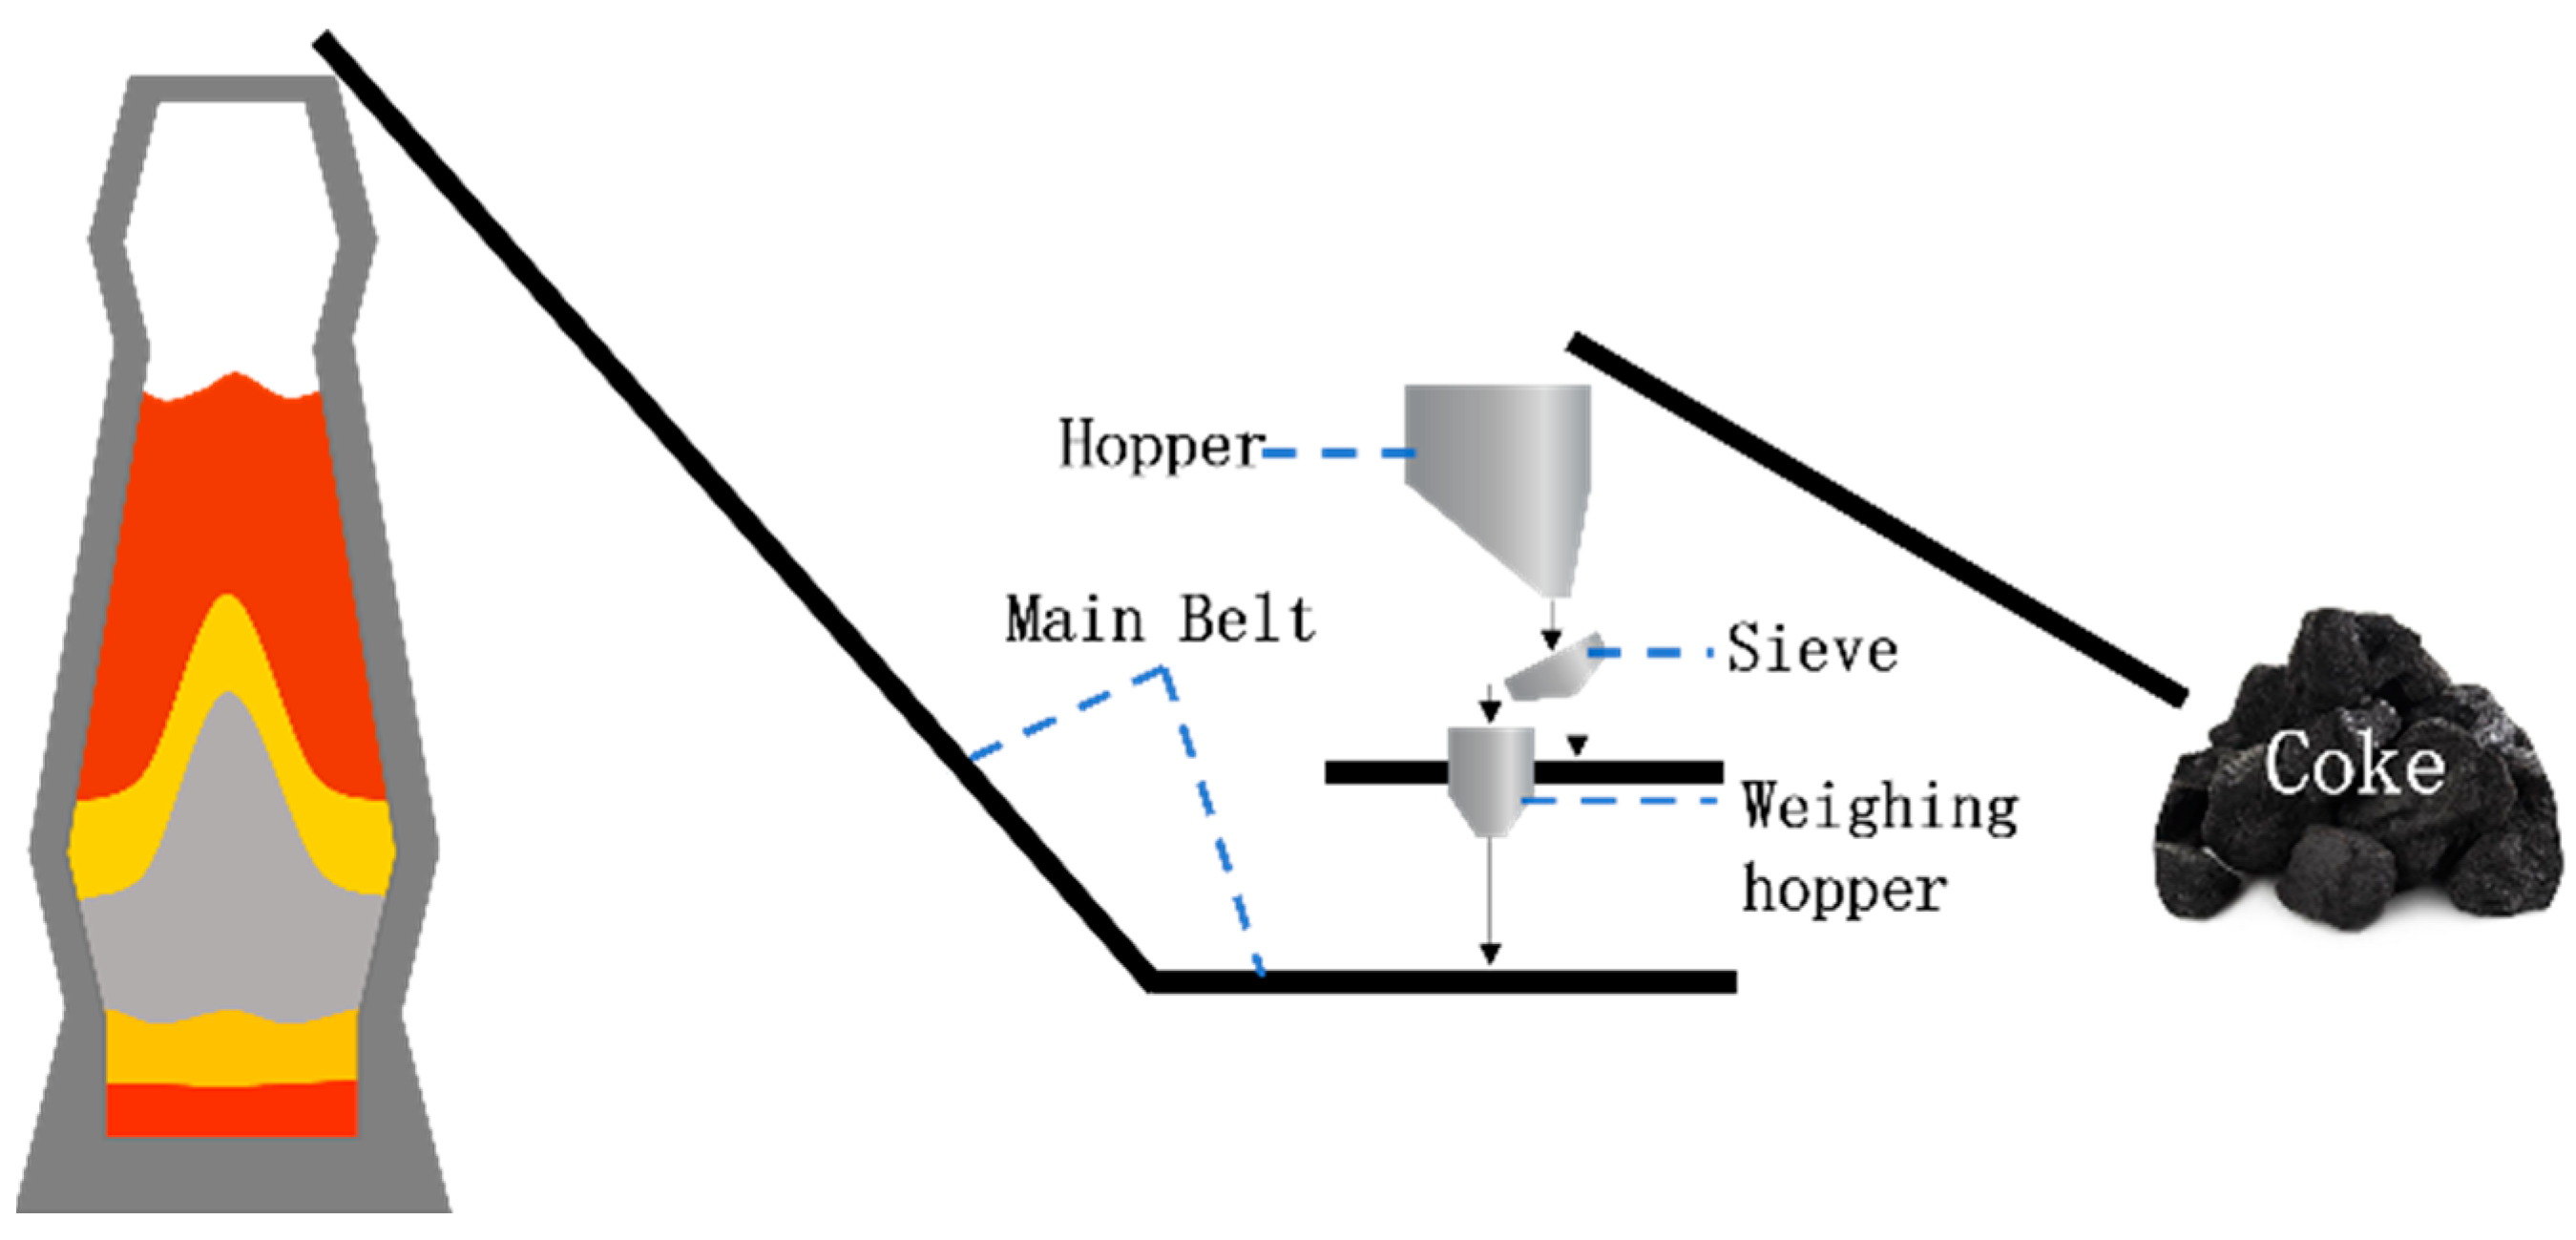
Figure 1. Schematic of the coke-feeding process into the blast furnace.
Processes 10 01902 g001
Figure 2. Schematic of the image acquisition principle.
Processes 10 01902 g002
Figure 3. Process of YOLOv3 predicting the location and class of objects.
Processes 10 01902 g003
Figure 4. Bounding box sample.
Processes 10 01902 g004
Figure 5. Example of an acquired image of coke on the conveyor belt.
Processes 10 01902 g005
Figure 6. PSD of ten groups of charged coke determined by sieving analysis.
Processes 10 01902 g006
Figure 7. Image of coke particles on belt labelled manually by green boxes.
Processes 10 01902 g007
Figure 8. Image of the results of the coke particle detection model, with coke particles marked by orange bounding boxes.
Processes 10 01902 g008
Figure 9. Detection speed (left panel) and accuracy (right panel) of the 20 samples detected by coke particle detection model.
Processes 10 01902 g009
Figure 10. Correlation coefficients between five size parameters (particle length, width, average length and width, box diagonal, and equivalent circle diameter) determined based on the bounding box and sieving particle size.
Processes 10 01902 g010
Figure 11. Comparison of the detection PSD and the sieving PSD of group #1.
Processes 10 01902 g011
Figure 12. Comparison of the detection PSD and the sieving PSD for particle size in the ranges of (a) <25 mm; (b) 25~40 mm; (c) 40~60 mm; (d) 60~80 mm; (e) >80 mm.
Processes 10 01902 g012
Figure 13. Iteration and function values of fmincon.
Processes 10 01902 g013
Figure 14. Comparison of PSD of sieving, image-based detection before and after correction for data sets (a) #8, (b) #9, and (c) #10.
Processes 10 01902 g014
Table 1. AI Studio configurations.
GPUVideo MemCPURAMDisk
Tesla V10016 GB4 Cores32 GB100 GB
Table 2. Correction coefficients for different particle size ranges.
Particle SizeCorrection Coefficient
<25 mm3.24
25~40 mm1.04
40~60 mm0.91
60~80 mm1.06
>80 mm0.96
Table 3. Mean of the absolute error between the detected and corrected PSDs.
Group#8#9#10
Detection6.9%8.1%6.4%
Correction2.7%8.4%3.0%
Publisher’s Note: MDPI stays neutral with regard to jurisdictional claims in published maps and institutional affiliations.