Article

NADES-Based Cork Extractives as Green Ingredients for Cosmetics and Textiles

1
Centre of Biological Engineering, University of Minho, Campus de Gualtar, 4710-057 Braga, Portugal
2
LABBELS—Associate Laboratory, 4710-057 Braga, 4800-058 Guimarães, Portugal
3
INIAV—National Institute for Agrarian and Veterinarian Research, Rua dos Lagidos, 4485-655 Vairão, Portugal
*
Author to whom correspondence should be addressed.
Processes 2023, 11(2), 309; https://doi.org/10.3390/pr11020309
Submission received: 23 December 2022 / Revised: 6 January 2023 / Accepted: 9 January 2023 / Published: 17 January 2023

Abstract

:
The demand for products based on natural ingredients is increasing among cosmetic and textile consumers. Cork extracts contain components of interest with special properties, including antioxidant, anti-inflammatory, and antibacterial activities, that might improve the effectiveness of cosmetic formulations currently on the market and may impart new characteristics to textiles. The main goal of this work was to investigate the effect of the incorporation of three cork extracts into two commercial cosmetic formulations (formulation A and B) and evaluate their role as textile dyeing agents. The extracts (E1, E2, and E3) were obtained from cork powder using natural deep eutectic solvents (NADES) (E1-NADES 1: lactic acid:glycerol, E2-NADES 2: lactic acid:glycine, and E3-NADES 3: lactic acid:sodium citrate) and applied in combination with the solvent. The impact of the extracts on the cosmetic formulations’ properties was evaluated in terms of pH, viscosity, antioxidant activity, transdermal permeation capacity, cytotoxicity, and organoleptic characteristics (odor, color, and appearance). The results demonstrated that the cork extracts improved the antioxidant performance of the formulations (90% reduction in DPPH (1,1-difenil-2-picril-hidrazil)). Moreover, low concentrations (5 mg/mL and 10 mg/mL) of extract did not present a cytotoxic effect on keratinocytes. Cotton fabrics were efficiently dyed with the NADES-based cork extracts which conferred to these substrates antioxidant (78% in DPPH reduction) and antibacterial abilities (inhibition halos: 12–15 mm). The application of cork extracts as ingredients in cosmetics or as dyeing/coloration agents for textile coloration is revealed to be a promising and green route to replace harmful ingredients normally used in industry.

1. Introduction

Currently, society consumes natural resources far more quickly than nature can replenish them. Sustainability must be considered to enhance the use of energy resources and raise consumer awareness. We can assist to a significant increase in the sales of natural goods, especially in Europe, as a result of behavioral changes made by businesses and customers. The cosmetics and cosmetotextile industries are no exception, and the current trend is the development of environmentally friendly products made from natural ingredients. Skincare, body care, hair care, oral care, perfume, makeup, vitalizing, energizing, refreshing, and UV protection products are just few examples of cosmetic/cosmetotextile applications of new products [1]. The bark of the species Quercus suber L., popularly known as cork, is a natural material obtained from the outer bark of an oak tree. This is an economic and ecological species in Mediterranean Basin countries and in Portugal, which controls approximately 55% of the world’s cork production [1,2]. The trees are planted in farms and are not cut down or damaged when the cork is harvested; they can be harvested every 9 years during a tree’s lifetime (roughly 270 years). Cork is a raw, biodegradable, and renewable bioresource in the ecological sense, since it regenerates after harvesting [3]. This material is used in a variety of applications due to its unique physical, chemical, and mechanical properties, such as high elasticity, low permeability to liquids, and resistance to microbial activity. Examples include the production of wine stoppers and thermal and acoustic insulation materials, among others [4,5]. Furthermore, waste generated during the manufacture of cork goods has great potential and may be applied in a variety of uses, including in cosmetic and topical treatments [1,6,7,8]. Suberin, lignin, and polysaccharides are the primary components of cork oak. Suberin is the most prevalent component of cork (about 40% m/m), exhibiting notable properties such as antioxidant, anti-inflammatory, free radical scavenging, enzyme inhibition, and antimicrobial activities [6,9]. Due to its abundance and distinct chemical composition, suberin has emerged as the most promising component for the development of new chemical products and materials derived from cork byproducts [4,5,10].
Cork oak extracts are primarily composed of aliphatic and phenolic compounds (including terpenes such as friedeline and betulinic acid), tannins (specifically ellagitannins), and phenolic acids (such as gallic, ellagic, and protocatechin) [11]. These compounds can be easily extracted with the appropriate solvents since they are only loosely linked to the cork cell wall. Sousa et al. have recently investigated the detailed chemical composition of lipophilic cork extracts and their by-products (cerine, friedeline, betulinic acid, R-hydroxy fatty acids, and R,ω-dicarboxylic acids), demonstrating that these constituents can be an interesting source of bioactive compounds [12]. Carriço et al. have produced solid particles from Quercus suber bark to stabilize a Pickering emulsion. Their goal was to optimize topical formulations by using biocompatible organic particles as emulsion stabilizers instead of common surfactants, while benefiting from the properties of Quercus suber L. After 30 days of testing, it was determined that the Quercus suber bark-stabilized emulsions were more stable as the droplet size distribution decreased [13]. Freitas et al. produced cork extracts using natural deep eutectic mixtures to design environmentally benign processes to eliminate or reduce the use of toxic chemicals. The results revealed higher extraction yields when using NADES instead of harsh solvents such as dioxane [14].
Pintor et al. found that cork powder possesses biosorbent abilities and may remove pollutants and oil compounds by biosorption [15]. They concluded that cork powder could be used as an oil absorbent for an anti-acne solution.
Textile dyeing is another potential field of application for cork extracts. Conventional textile dyeing using synthetic dyes that are used nowadays are reported to be toxic and possibly carcinogenic and mutagenic, with the toxic effects varying from contact dermatitis and skin allergies to tumors and heart problems [16]. Natural dyes have gained relevance in recent years as replacements for synthetic analogues for specific niche markets [17]. These dyes have a number of advantages over synthetic dyes, including biodegradability, non-toxicity, non-allergenicity, their ability to use wasteland, and ease in obtaining different coloration depending on the type of plant and extraction applied. Barberry roots (Berberis lyceum), safflower petals (Carthamus tinctorius), turmeric rhizomes (Curcuma longa), and harda fruits (Terminalia chebula) are some examples of natural dye sources [18]. An example of the application of natural dyes in textile dyeing has been presented by Ayele et al. Their study focused on extracting natural dyes from mango leaves and mango peel and finding sustainable ways to dye cotton. The dyes extracted from various parts of the mango plant exhibited excellent color fastness, and could be used for the effective coloration of cotton fabrics [19]. Despite the number of works reporting the dyeing of textiles with natural dyes, the use of cork extracts for this purpose is still scarcely explored.
Greener solvents have also been explored as possible replacements for harmful organic solvents in a variety of chemical processes. Deep eutectic solvents are becoming popular as highly tunable extraction solvents. A eutectic system is defined as a mixture of specific hydrogen bond donors (HBDs) and acceptors (HBAs) in a given proportion, with a lower melting temperature than the original pure components [7]. A DES is referred to as a natural deep eutectic solvent (NADES) when it contains major metabolites such as amino acids, organic acids, sugars, or choline derivatives [20].
This work aimed to obtain bioactive extracts from cork powder through NADES-based extraction. These extractives were incorporated into cosmetic formulations (A and B) and used as dyes for cotton fabric dyeing/coloration. The extractives obtained from cork were characterized by GC-MS, total content of phenolics, antioxidant activity, cytotoxicity, and transdermal permeation ability. The effect of extractive incorporation on the cosmetic formulations was determined by evaluation of the organoleptic properties of the final formulations [21,22]. The properties of dyed cotton fabrics were also evaluated in terms of color strength after dyeing/coloration (K/S evaluation). The antioxidant and antimicrobial activities of the coated fabrics were assessed, aiming to determine the propensity of cork extracts to confer additional properties to the fabrics. The purpose of this study was to investigate “greener” (NADES) alternatives to chemically harsh solvents for the extraction of bioactive components from cork. The extracts will be employed as dyeing/coloring agents for textiles to give coloration and other qualities to the textiles, such as antioxidant or antibacterial properties, or as cosmetic components to confer additional properties to cosmetic formulations.

2. Materials and Methods

2.1. Materials and Chemicals

DL-lactic acid (80%), glycerol (99%), glycine (99%), sodium citrate (99%), ethyl acetate, liquid nitrogen, Nile red (NR), ethanol (99.8%), DPPH (1,1-difenil-2-picril-hidrazil), Folin–Ciocalteu reagent, gallic acid, sodium carbonate (7.5%), N,O-bis(trimethylsilyl)trifluoroacetamide (BSTFA + TMCS, 99:1), chloroform (99.8%), ammonia solution (25%), Na2CO3 (7.5%), and MTT (3-(4,5-dimethyl-2-thiazolyl)-2,5-diphenyl-2H-tetrazolium bromide), were purchase from Sigma-Aldrich or TCI Chemicals and used without further purification. The pig skin specimens were provided by a local butcher, the human cell line NCTC2544 (skin keratinocytes) was obtained from Instituto Zooprofilattico Sperimentale Della Lombardia e Dell’Emilia-Romagna, Pavia (Italy) under the NANOFOL project (grant agreement N° 228827-2), the moisturizer ATL (Formulation A) was acquired in a local pharmacy, and the cream Cien Urea 10% (Formulation B) was acquired in a local supermarket. The cotton fabric (100% cotton, 65 g/m2, 37 × 37 yarns/cm) was obtained from a local textile company. The cork powder with a grain size of 0.5–1 mm was supplied by Cork Supply Portugal, S.A.

2.2. NADES Development and Characterization

2.2.1. NADES Development

The NADES used (Table 1) in this study were chosen based on their composition; the three NADES are based on natural compounds that have demonstrated good extraction abilities in previous studies [14].
The NADES were prepared by mixing the constituents at temperatures ranging from 25 °C to 100 °C under vigorous stirring. After 1 h, a clear solution was formed and the eutectic mixture was kept at room temperature (r.t.) for further use. The percentage of water in the final eutectic mixtures results from the low purity of the raw components (Table 1). For an accurate physicochemical characterization of the NADES, they were subjected to a lyophilization process to remove the water.

2.2.2. NADES Characterization

Melting point
Melting points were measured manually with a Hanna digital thermometer (Hanna Instruments HI 93531) by submerging the NADES and the probe in an ethyl acetate/liquid nitrogen bath at −84 °C to solidify the mixture. Then, every 1 °C, the probe (immersed in NADES) was checked to see if it was still immobile with the slow increase in temperature (natural heating of the bath) and the melting temperature was recorded when the thermometer probe began to move. The value of this parameter was tested three times, and it was found that there was only a 1-degree difference between measurements.
pH, density, refractive index, and surface tension
The pHs of all NADES were measured using an analogic pH meter. All measurements were performed at room temperature. The density was measured in triplicate by weighing 25 mL of NADES inside a 25.00 ± 0.01 mL pycnometer. The final density was obtained by calculation of the quotient between the mass and the volume of the solvent. The refractive indices of NADES were measured using a Bellingham and Stabley Abbe Refractometer (model 60/ED). The surface tension was measured using a Force Tensiometer K100, Kruss, with a ring Noüy SFT and by applying Harkin and Jordan’s correction. All measurements were performed in triplicate under atmospheric pressure and temperature (25 °C).
Viscoelastic properties
To assess the viscosity of the newly developed NADES, two approaches were used. For NADES 1, the viscosity was assessed using the Brookfield DV-II+Pro viscometer (spindle 27, 50 rpm at r.t. for 4 h, with 30 s time points, torque 3.0 × 10⁶ N.m). For NADES 2, the viscosity was assessed using the IKA ROTAVISC Io-vi viscometer (spindle 6.7, 18 rpm at r.t, torque 50%). For NADES 3, the viscoelastic properties were determined using a Kinexus Pro Rheometer (Kinuxus Prot, MaL 1097376, Malvern). The shear viscosity was measured using the geometry PU20 (20 mm plate above) at 30 °C and 25 °C.
Conductivity
A Thermo Scientific benchtop meter was used to measure conductivity (Orion Versa Star Pro). All measurements were taken at 25 °C and at atmospheric pressure.
Polarity
Nile red was used as a solvatochromatic probe in this study to determine NADES polarity and NADES molar transition energy (ENR). A solution was made up in the NADES at a concentration of 10−5 M. Then, the dye absorption spectrum (λmax) was measured on a UV/Vis spectrophotometer (BioTek SynergyMx spectrophotometer) and the polarity was calculated using the following equation (Equation (1)) [23,24,25]:
ENR: ENR (kcal mol L−1) = hcNA/λmax = 28591/λmax
All the measurements were performed at atmospheric pressure at 25 °C.

2.3. NADES-Based Extraction of Bioactive Compounds from Cork Powder

The extraction of bioactive compounds from powdered cork was carried out using three natural eutectic mixtures, namely lactic acid:glycerol (1:1) (named extract 1), lactic acid:glycine (5:1) (named extract 2), and lactic acid:sodium citrate (4:1) (named extract 3), using a high pressure closed system method. For this, 5 mL of each eutectic mixture was added to the powdered cork (0.7 g), then the container was sealed with an aluminum sealing cap and placed in a 100 °C oil bath for 6 h. The extraction process was followed by filtration of the powder and it was replaced by a new cork powder, aiming to concentrate the extractives (the cork powder was replaced 3 times). At the end of the extraction process, all the powdered cork used in the extraction was washed with water and ethanol to remove the adsorbed solvent. The remaining water content in the extract was evaporated under pressure. The extract containing the eutectic mixture was obtained by evaporation.

2.4. Extractives Characterization

Gas chromatography-mass spectrometry (GC-MS)
Prior to the characterization of the cork extracts by gas chromatography-mass spectrometry (GC-MS), a purification by chromatography (silica, height = 20 cm, diameter = 3 cm; chloroform:ethanol, 100:0 to 0:100; to finish ethanol:ammonia, 97:3) was carried out. For this, the solvent was eluted in the column, starting with chloroform and gradually adding ethanol, until it was 100% ethanol. To finish the column, a 97% ethanol and 3% ammonia solution was used. The nonpolar chemical compounds of cork, such as steroids, oils, fatty acids, terpenoids, and aromatic compounds, were eluted in the first fractions. Natural deep eutectic solvent components and other polar compounds, such as alcohols and small acids, appeared in the intermediate fractions eluted with a high percentage of ethanol. Sugars and other polar compounds were collected in the final fractions. This purification aimed to separate the extract’s components by polarity, including the NADES constituents, and facilitate chromatogram analysis. Afterwards, the samples were subjected to a derivatization process to follow GC-MS analysis. The derivatization method consisted of a transesterification, promoted by the mixture of pyridine and N,O Bis(trimethylsilyl)trifluoroacetamide (BSTFA). An amount of 1 mg of the sample was placed in a vial and dissolved in 100 µL of pyridine and 100 µL of BSTFA. The reaction mixture was placed in an oven for 15–25 min at 60 °C and then injected into the GC-MS equipment. This technique was carried out in a SCION SQ1/436 GC (Bruker), using a Rxi-5Sil MS column (Restek; 30 m, internal diameter 0.25 mm, film thickness 0.25 μm) under the following conditions: the oven temperature was held at 70 °C for 1 min, then increased in increments of 5.0 °C/min from 70 °C to 260 °C (5 min) and from 260 °C to 300 °C (0 min); the injector and detector temperatures were 280 °C and 270 °C, respectively; high purity helium C-60 (Gasin, Portugal) was used as the carrier gas at a constant flow rate of 1.0 mL/min; an electron impact (EI) mode at 70 eV was used; and data acquisition in full scan mode and a 35-600 m/z mass range with a scan time of 250 ms. The tests were carried out in triplicate. The identification of the compounds was based on the interpretation of fragmentation patterns and supported by mass spectral data from Wiley (John Wiley and Sons, Hoboken, NJ, USA) and NIST/EPA/NIH 2020 (National Institute of Standards and Technology, Gaithersburg, MD, USA) as well as by comparison with published spectra. The peak areas in the total ion gas chromatograms were used to calculate the relative abundance of the compounds.
DPPH radical-scavenging activity
The antioxidant activity was evaluated by measuring the capacity of the antioxidant compounds present in the analyzed samples to capture the free radicals of DPPH (1,1-diphenyl-2-picryl-hydrazyl), following the method described by Yeo et al., 2022 [26]. The tests were carried out indirectly due to the substances’ viscosity. On a microplate, a 200 µM DPPH solution was placed in contact with each formulation, without mixing. The microplate was kept in the dark for 120 min. Afterwards, 100 µL of supernatant was removed and the absorbance (515 nm) was measured in a SpectraMaxPlus plate reader. All measurements were performed in triplicate. The percentage of antioxidant activity of each sample was calculated using the following (Equation (2)):
% A A = 100 [ ( A s a m p l e A b l a n k ) × 100 A c o n t r o l ]
where Asample corresponds to the decay of the absorbance of the samples, Ablank is the absorbance measured in empty wells, and Acontrol is the decay of the absorbance of ethanol with the added DPPH solution. Trolox (6-Hydroxy-2,5,7,8-tetramethylchroman-2-carboxylic acid) was used as a standard to prepare the calibration curve of DPPH reduction.
Determination of total phenolic content
The total phenolic content was determined by the Singleton method [27] using Folin–Ciocalteu reagent. An amount of 0.5 mL of extract was added to 10 mL of distilled water and, after stirring, 0.5 mL of Folin–Ciocalteu reagent was added. After 5 min, 8 mL of 7.5% Na2CO3 (sodium carbonate) was added and, after 2 h, the absorbance was read at 765 nm and compared to a blank with distilled water using a BioTek Synergy spectrophotometer ™ HT. The total phenolic content was calculated through a calibration curve using gallic acid as a standard. The results were given as mg of gallic acid equivalent/mg of extract.
In Vitro Permeation Studies
An ex vivo study of permeation through full thickness pig skin and cellulose acetate membrane was performed using a horizontal Franz diffusion cell with a 9 mm orifice diameter (V-Series Stirrers for Franz Cells) (PermeGear, Hellertown, PA, USA). The subcutaneous fat of pig skin was fully removed, cut to an appropriate size, and immediately mounted in the Franz diffusion cell, with the stratum corneum (SC) side facing the donor compartment. The receptor compartment was filled with 5 mL of distilled water, which was continuously stirred with a small magnetic bar, and a thermostat maintained the temperature at 37 ± 1 °C throughout the experiments to reach the physiological skin temperature (i.e., 32 ± 1 °C). The amount of extract applied to the skin surface was approximately 500 mg. At regular intervals of 1, 2, 4, 8, and 24 h, samples of the receiving solution were collected. Each sample removed was replaced with fresh water. To evaluate the transdermal permeation, a trace spectrum of the samples collected in the receptor compartment was measured between 250 nm and 750 nm, with points taken every 5 nm, on a BioTek Synergy™ HT microplate reader at room temperature. By observing the spectra obtained, it was concluded that the λmax of absorption was 365 nm. The absorbance values taken at this wavelength were used to calculate the samples’ concentration in the receptor compartment. The extracts’ permeation (%) was calculated using the following Equation (3):
% p e r m e a t i o n = C f e C e
where Cfe is the concentration of extract at the receptor and Ce is the initial concentration of extract at the donor (0.1 g/g).
Cytotoxicity assay
The cytotoxic potential of the extracts was evaluated using a human cell line NCTC2544 (skin keratinocytes). The viability of cells incubated with the extracts was assessed using the colorimetric MTT assay (3-(4,5-dimethyl-2-thiazolyl)-2,5-diphenyl-2H-tetrazolium bromide). The keratinocytes were plated at a cell density of 7500 cells/well in 96-well plates the day before assays. Cells were exposed to different concentrations of extracts (200, 100, 50, 10, and 5 mg/mL) and the viability was evaluated after 24 and 48 h of exposure.

2.5. Incorporation of the Extracts into Commercial Cosmetic Formulations

Extracts obtained from cork powder were manually mixed in two commercial cosmetic formulations, Formulation A and Formulation B, using a glass rod.
The composition of the commercial formulations used is described in Table 2. Their selection was based on the fact that both formulations have a similar composition with high hydration capacities. They are cheap and commonly used commercial formulations with high solubility in the extracts tested.
The nomenclature of the samples produced is presented in Table 3 for better clarification. The formulation without extract served as the control.

Characterization and Stability of Formulations

Organoleptic properties
The organoleptic properties (pH, odor, appearance, and color) of the cosmetic formulations were assessed at different temperatures (4 °C, 25 °C, and 37 °C) for 90 days. The properties were evaluated by visual inspection over time and compared with the control samples.
Particle size and surface charge
The hydrodynamic size and the surface charge, expressed as zeta potential, and the polydispersity of the formulation particles were evaluated in a Malvern Zetasizer NS (Malvern Instruments) at room temperature.
Creaming index
The ability of a cosmetic product to withstand physical alterations, preferably until its expiration date, determines its stability. Gravitational centrifugation was used to evaluate the samples and determine how well the formulations held up under physical stress. This allowed for the prediction of potential changes in stability, such as phase separation and sediment formation. The centrifugation test was performed with 5× g of each sample at 3000 rpm for 4 h at room temperature. At the end of the centrifugation, the cosmetic formulations were examined for phase separation, pH value, particle size, and surface charge. The physical stress index (CI) was calculated using Equation (4):
C I = H s H e × 100    
where Hs is the height of the sediment and He is the height of the sample before centrifugation.
Rheologic studies
Rheological evaluation was performed in a rheometer (Discovery HR1, TA Instruments). The formulations were analyzed at 25 °C with a conical geometry suitable for cosmetic formulations, with an angle of 2006° and a diameter of 60 mm. In rotational mode, the flow curves were obtained by applying increasing shear stresses ranging from 0.1 s−1 to 300 s−1, followed by a stress from 300 s−1 to 0.1 s−1 and again 0.1 s−1 to 300 s−1 (linear scale) for 120 s in each cycle. Five measurement points were collected in the first cycle and in the remaining cycles points were obtained every 10 s. The samples’ initial viscosity was discarded after the first cycle of applied stress.
In Vitro Permeation Studies
In vitro permeation studies of cosmetic formulations containing cork extracts were also conducted. The procedure followed is described in Section 2.4 and the percentage of permeation of the extracts contained on the formulations was evaluated by the following Equation (5):
%   P e r m e a t i o n = C f e C e
where Cfe is the concentration of extract contained in the formulations at the receptor and Ce is the initial concentration of extract in the formulations at the donor (0.1 g/g).
Antioxidant activity
The antioxidant activity of cosmetic formulations containing cork extracts was also evaluated. The procedure used is previously described at Section 2.4.

2.6. Dyeing/Coloration of Cotton Fabrics with the NADES-Based Cork Extracts

Cotton fabrics were pre-treated as follows: the fabrics were immersed in water at 60 °C for 5 h with and without tannic acid (4% owf). Afterwards, the fabrics were washed with running water and left to air-dry overnight. Mordanting of pre-treated fabrics (with and without tannic acid) was performed at 50 °C for 1h with aluminum (4% owf). Afterwards, the fabrics were washed with running water and left to air-dry. The cotton fabric was cut into squares (2 × 2 cm) and weighed. The dyeing procedure was performed under pressure using a sealed system in a thermostatic bath in vials closed with a metallic capsule. Dyeing was carried out on the cotton squares using 2 mL of the extract, for 6 h at 90 °C with stirring. After dyeing, the fabrics were washed with running water and left to air-dry overnight.
Determination of color strength (K/S) of the dyed cotton was performed using a Data color apparatus, Spectraflash 600 Plus, from Datacolor International, at standard illuminant, D65. Kubelka–Munk theory gives the following relation between reflectance and absorbance: K/S = (1 − R) × 2R−1, where K is the absorbance, S is the scattering, and R is the reflectance.

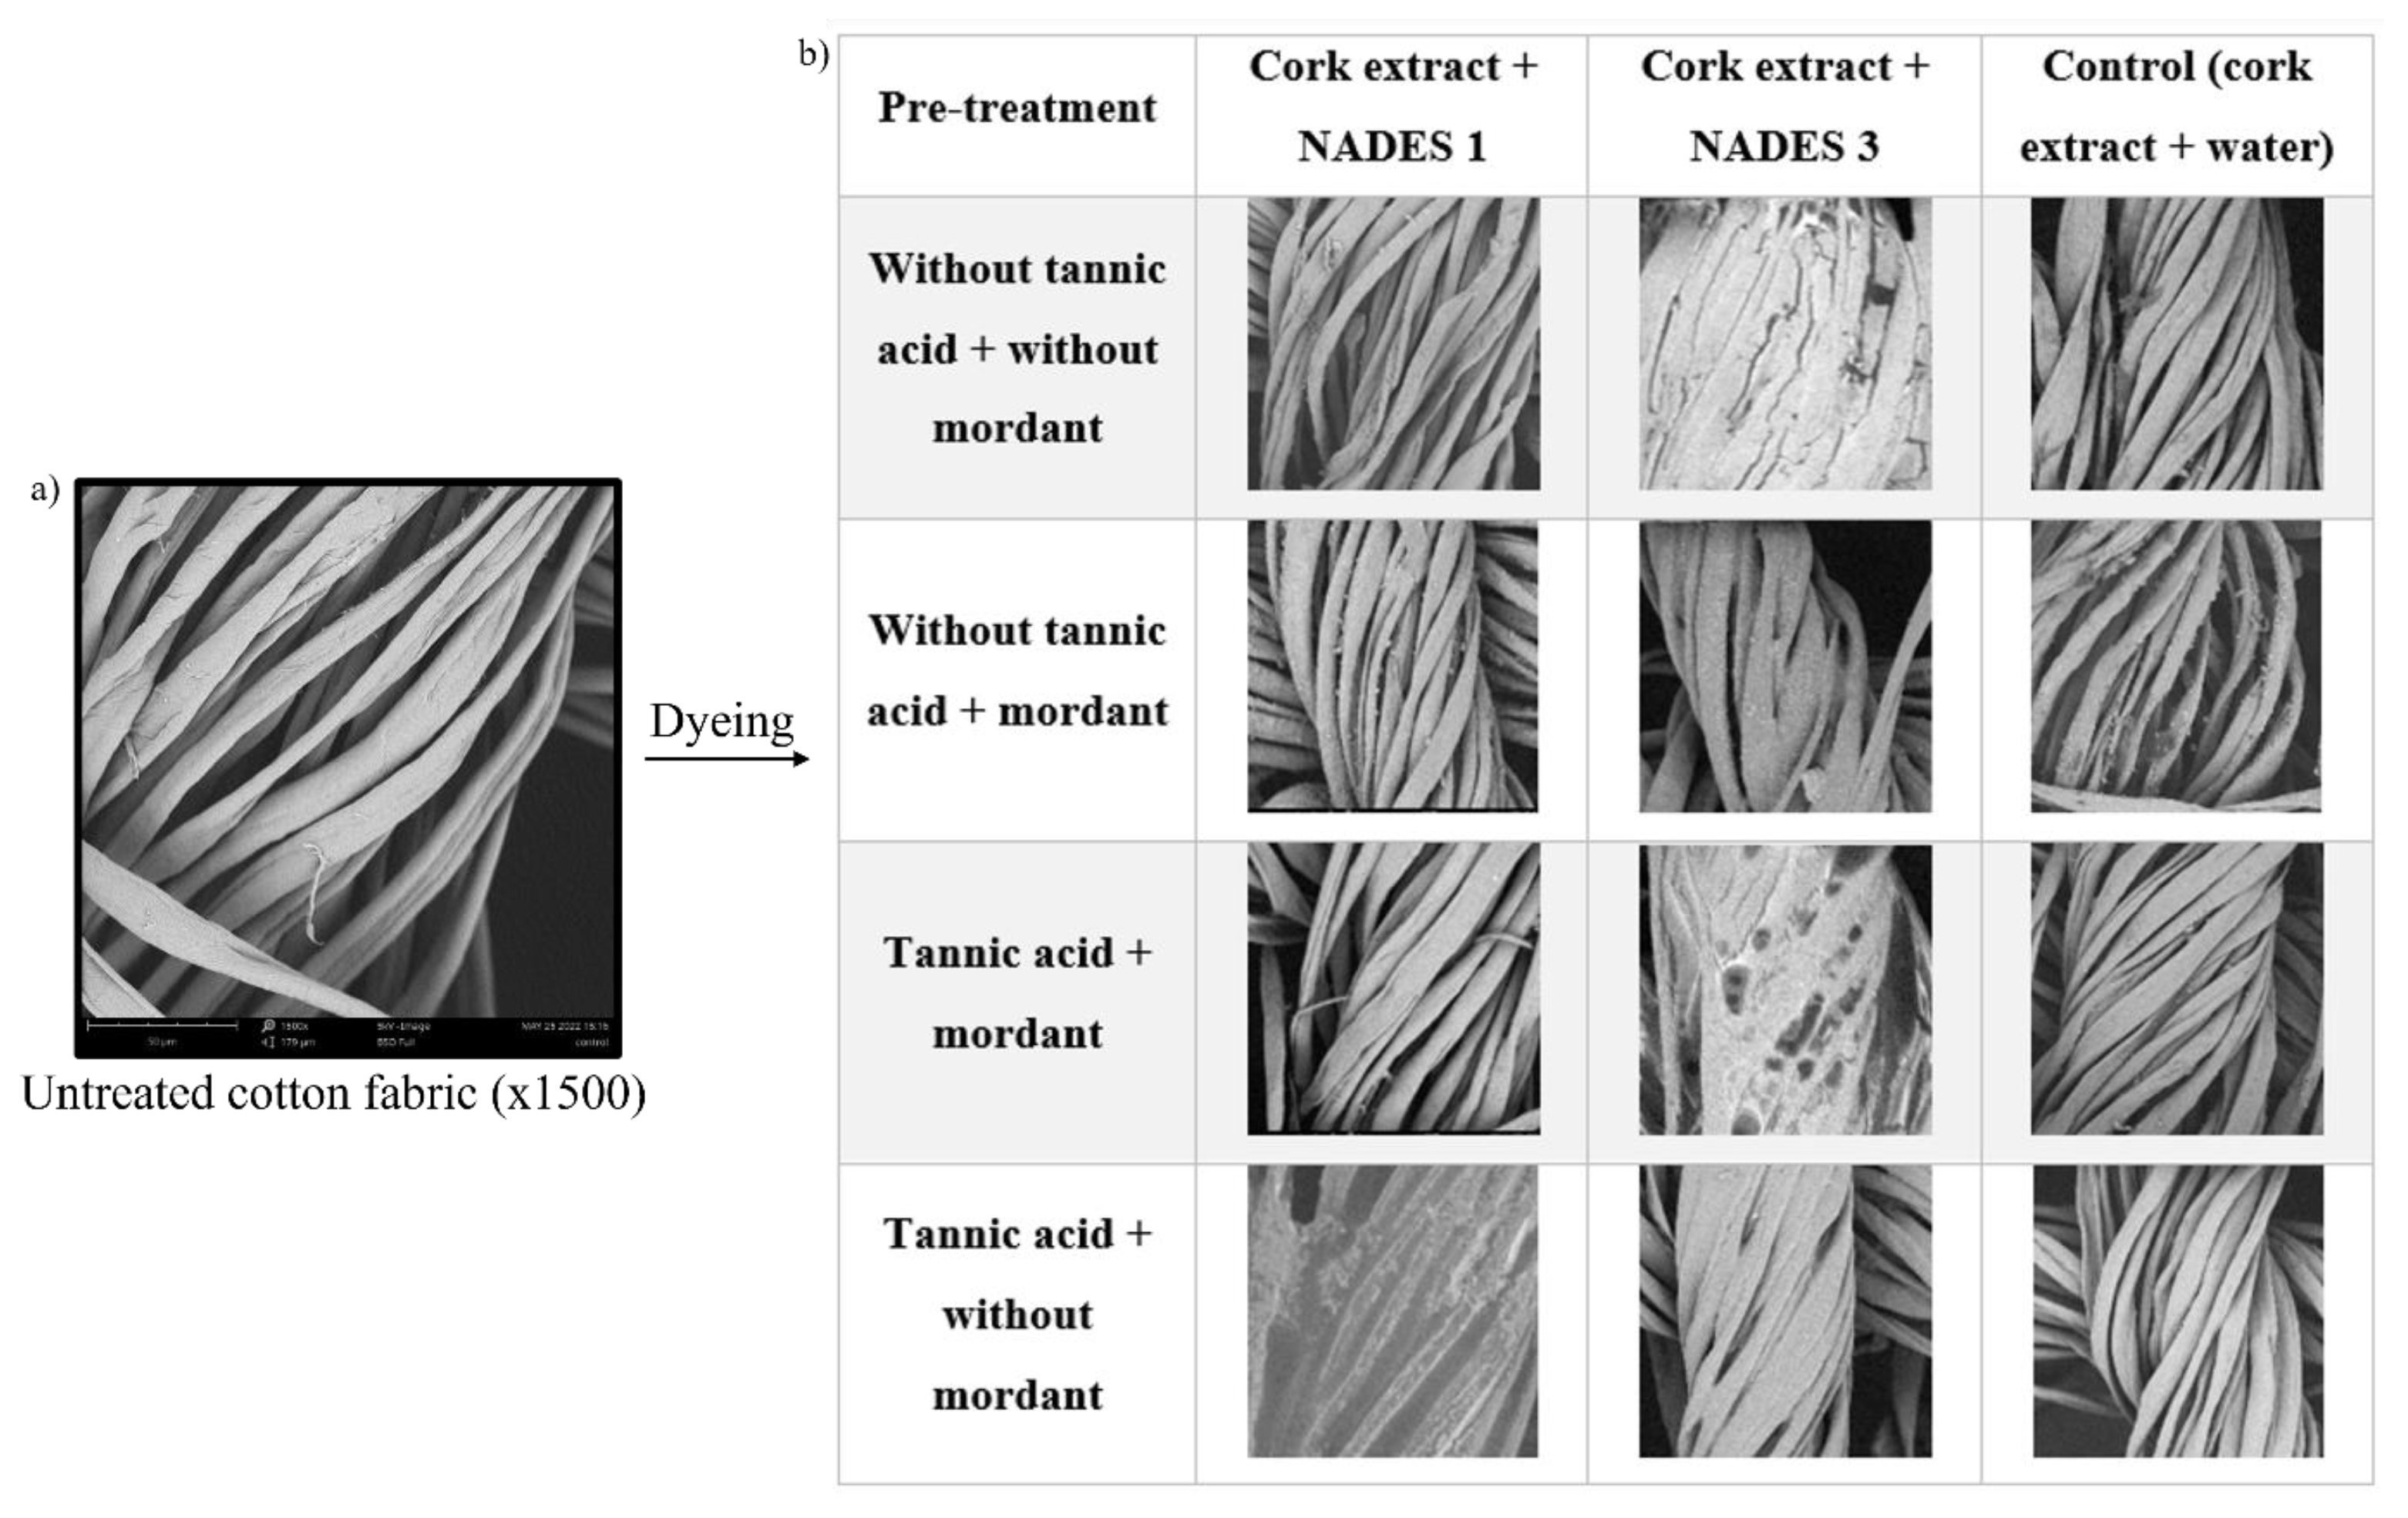
2.7. Surface Characterization of Dyed Cotton Fabrics by Scanning Electron Microscopy (SEM)

The morphology of cotton fabrics after dyeing with NADES-based cork extracts was assessed by SEM. The cotton samples were added to aluminum pin stubs with electrically conductive carbon adhesive tape (PELCO Tabs™) and coated with 25 angstrom Au. The coated samples were then placed on a Phenom standard sample holder and characterized using a desktop scanning electron microscope (SEM) (Phenom ProX, Eindhoven, The Netherlands) at 10 Kv with a spot size of 3.3. All resulting images were acquired using the ProSuite software v.3.0.

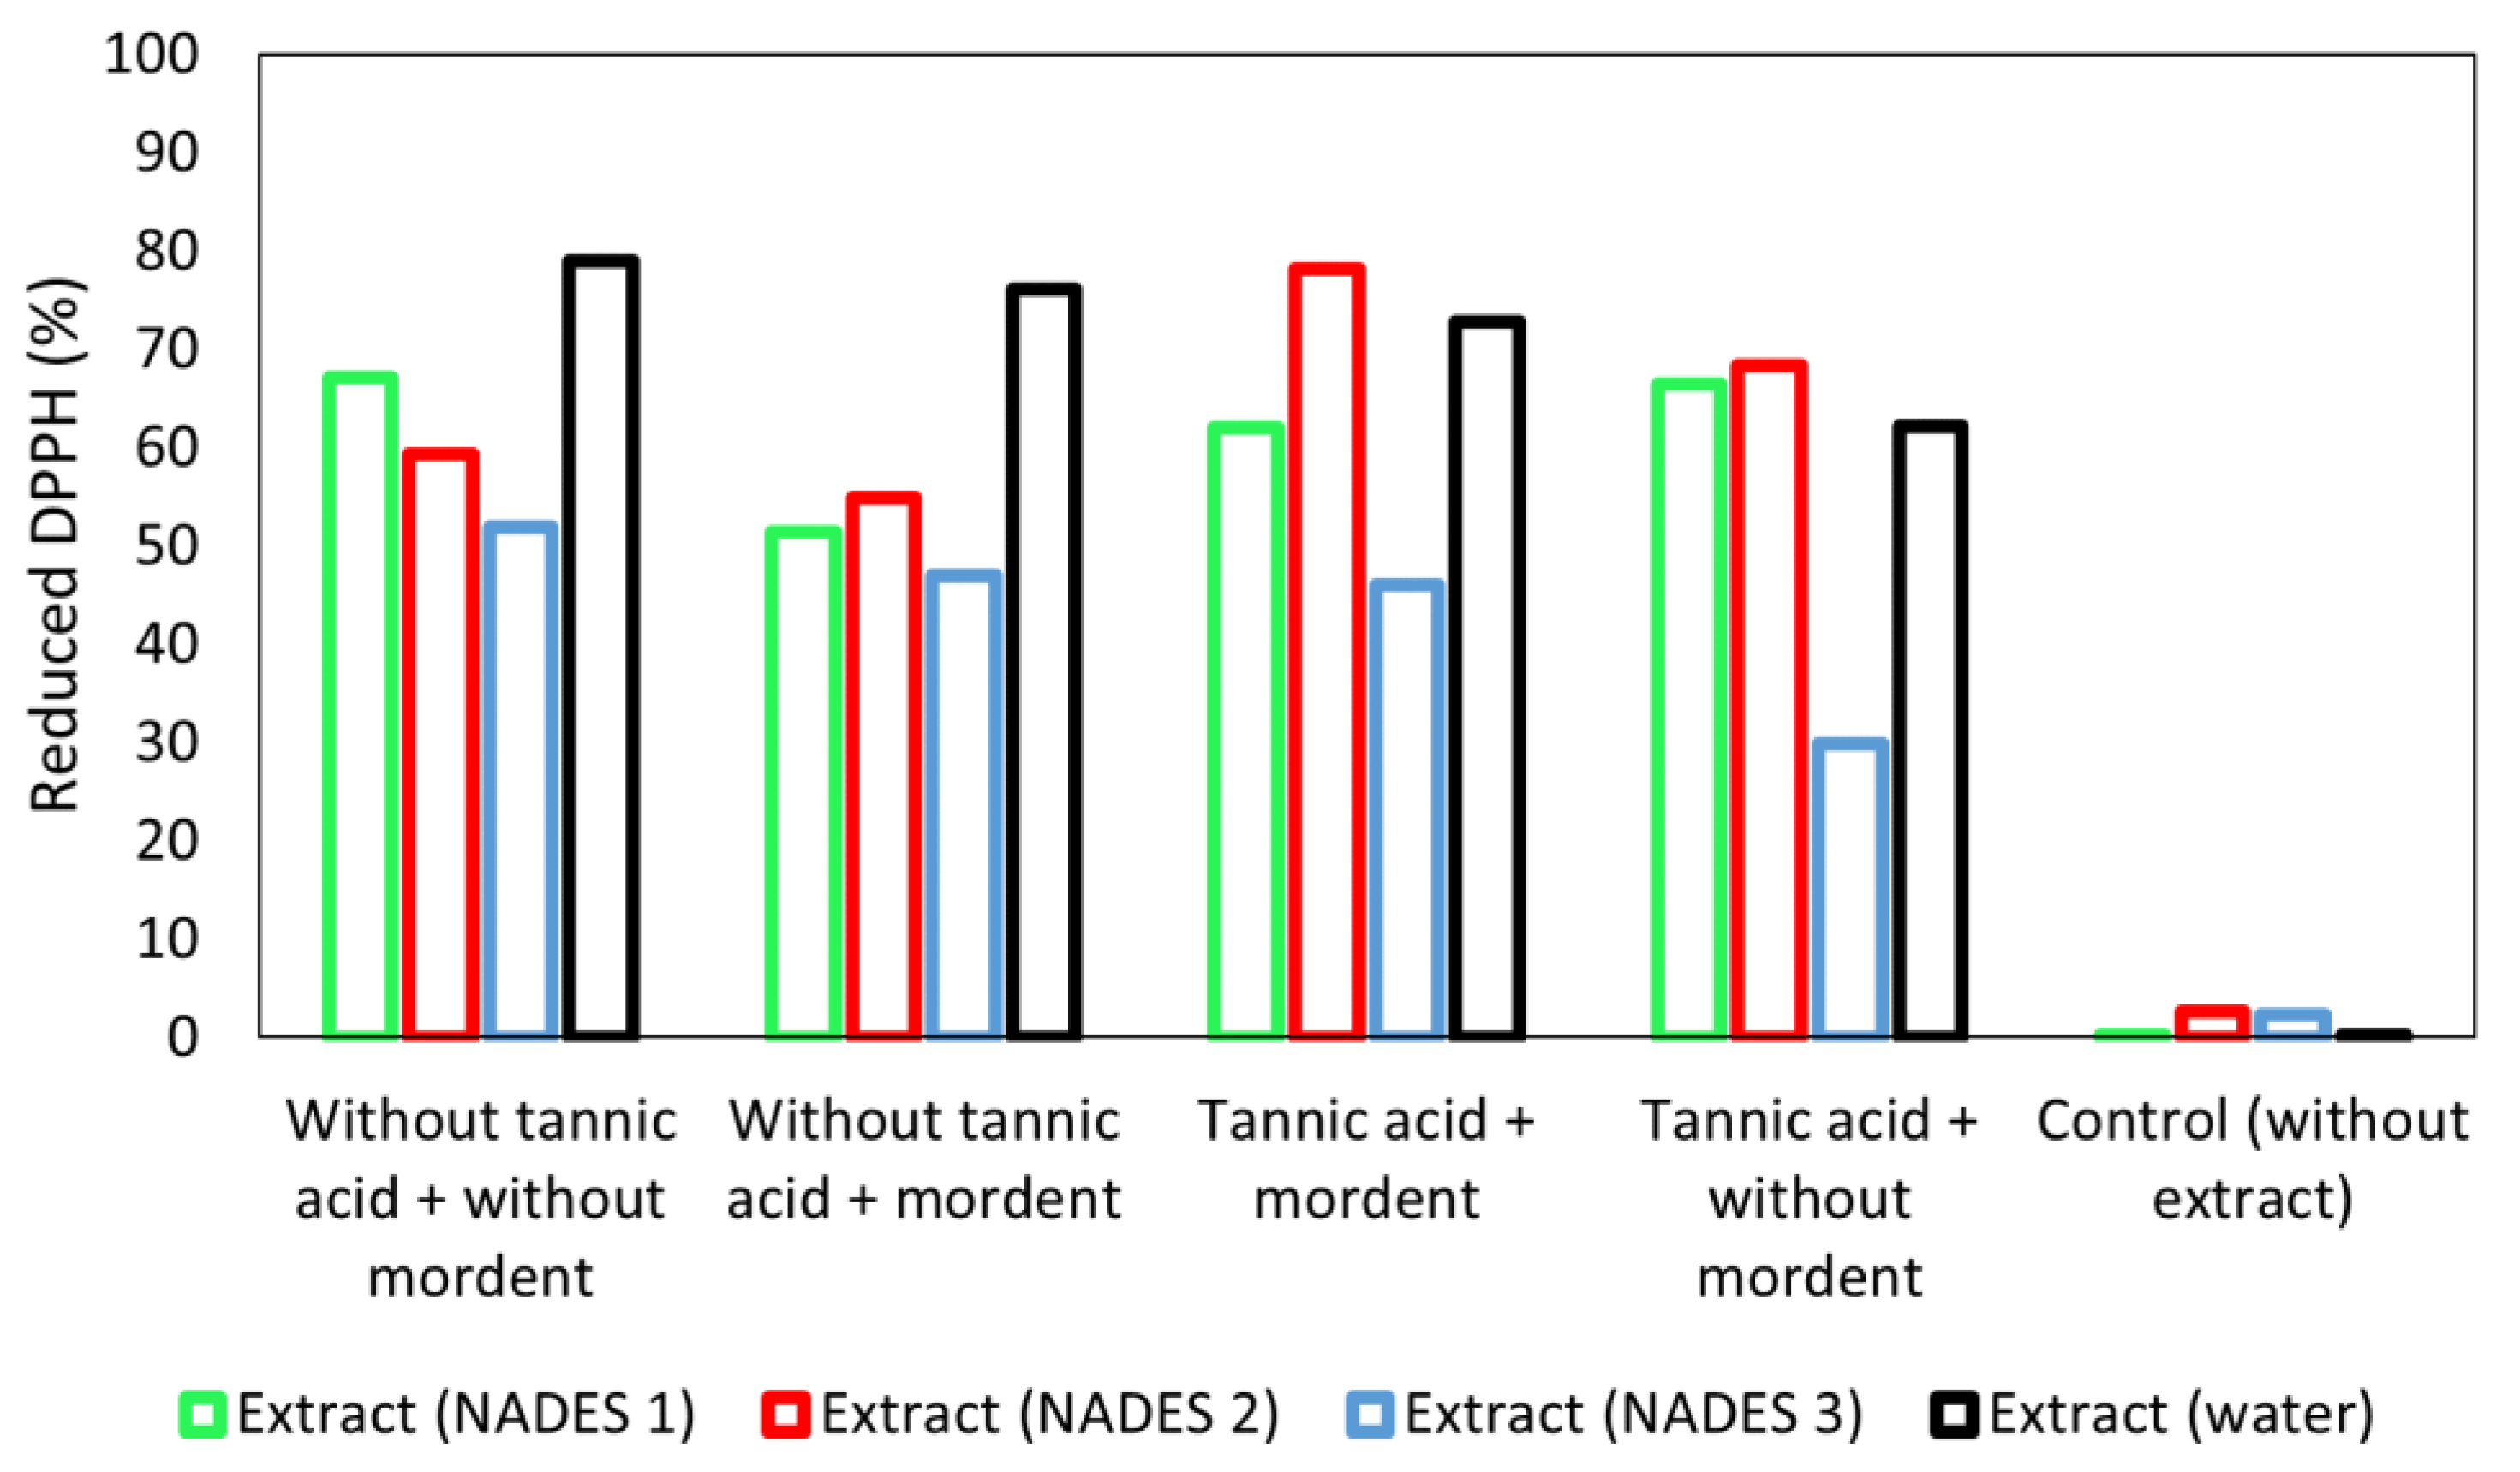
2.8. DPPH Radical-Scavenging Activity of Dyed Fabrics

The antiradical activity of the coated cotton fabrics extracts was evaluated using the assay of 2,2-diphenyl-1-picrylhydrazyl (DPPH) radical scavenging activity, according to a previously reported method [28]. For this, 140 μL of the DPPH solution (200 μM, in ethanol) was added to each cotton sample. The decrease in absorbance was measured continuously for 60 min at 515 nm using a microplate reader (Synergy Mx, BioTek). Each sample was tested in triplicate. Trolox (6-hydroxy-2,5,7,8-tetramethylchroman-2-carboxylic acid) was used as the standard to prepare the calibration curve of DPPH reduction. The DPPH radical scavenging activity of each sample was calculated as the percentage of reduced DPPH (Equation (6)). The radical scavenging activity of each sample was expressed as the IC50 value, defined as the concentration that reduces DPPH by 50%, and was calculated from the concentration effect linear regression curves.
% D P P H r = ( A 0 A 1 ) / A 0
where A0 is the initial absorbance and A1 is the absorbance in the steady state.

2.9. Antimicrobial Activity of Coated Cotton Fabrics

The antimicrobial activity of functionalized cotton textiles was evaluated against Gram-positive, Staphylococcus aureus strain (S. aureus; ATCC 6538), and Gram-negative, Escherichia coli strain (E. coli; CECT 434), bacteria. The samples were previously sterilized under UV for 30 min., and zone of inhibition (ZoI) tests, adapted from the Kirby–Bauer test [29], were carried out to determine the antimicrobial activity of each sample. The size of the halo was used as a qualitative measure of sample activity. Each strain was incubated with TSB inoculum (triptych broth of soybean) for 24 h at 37 °C. Afterwards, the resultant cell suspension was adjusted to an optical density (OD) of 1.0 at 620 nm, and properly diluted in TSB to 1 × 10⁷ CFU mL−1. To the incubation of the microorganisms in agar, an aliquot of the cell suspension (100 µL) was dispersed in TSA Petri dishes. Then, the samples were placed separately on the top of an agar plate and incubated for an additional 24 h at 37 °C. Following the incubation period, the halo (zone of transparent medium indicating no microorganism growth) formed around the sample was photographed to document the results (pictures acquired using Image LabTM software). All experiments were performed in triplicate for each sample and were repeated at least three times.

3. Results and Discussion

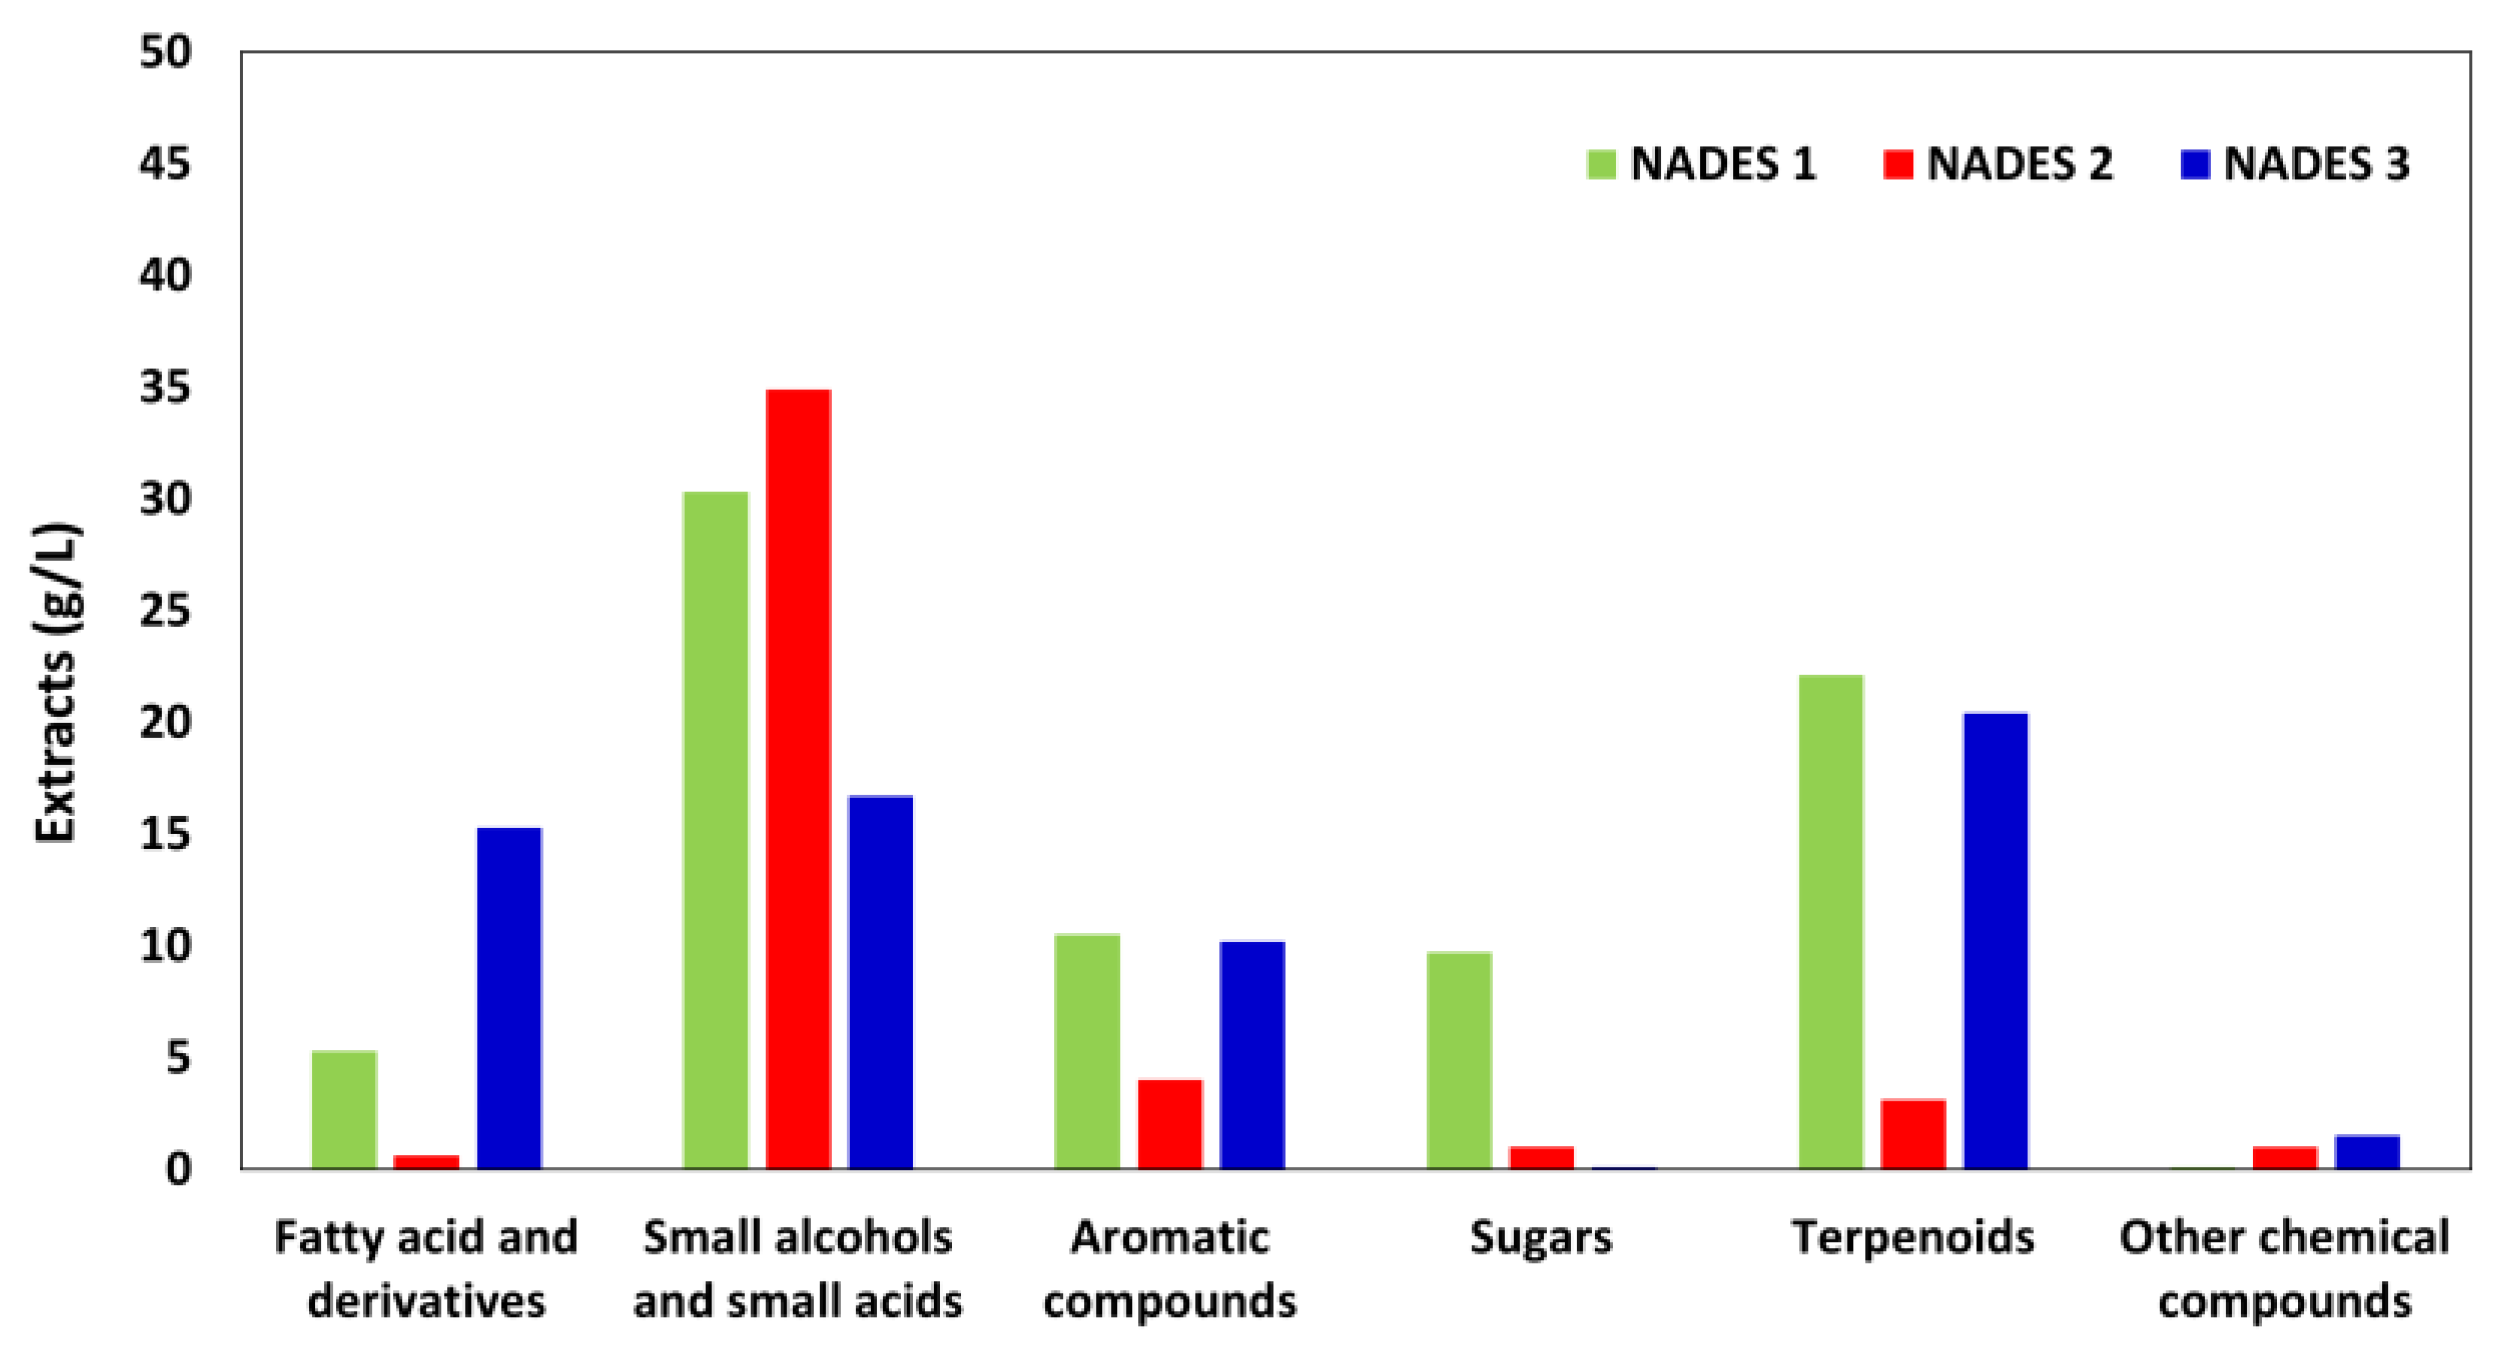
3.1. Physical and Chemical Characterization of Cork Extracts

The physical and chemical properties of NADES have been evaluated in a previous study [14], including the melting point (m.p.), pH, density (ρ), viscosity (η), conductivity (σ), index of refraction (nD), polarity (ENR), and surface tension (mN/m) (Table 4). The pH values of the novel NADES agree with the predicted values, as eutectic mixtures produced by lactic acid are more acidic in character. All the isolated components have a higher melting point (m.p.) than the NADES produced, indicating formation of eutectic mixtures. All the NADES examined had density values higher than water (1 g/mL) [30], as shown in Table 4. NADES 3 is the densest and NADES 2 is the least dense. All the NADES displayed a refractive index greater than water (nD = 1.333) [30], and they all have polarity values between those of ethanol (51.2384 kcal·mol−1) and water (48.2142 kcal·mol−1). NADES 2 is the most polar (48.500 kcal·mol−1), followed by NADES 1 with a polarity of 48.542 kcal·mol−1 and NADES 3 (50.612 kcal·mol−1). NADES 1 has a very low conductivity compared with the other two and all have similar surface tension values (44-45 mN/m). The uniformity of the findings among the NADES suggests that the extraction of bioactives from cork may not be entirely dependent on these physicochemical parameters.
The high viscosity of the NADES may limit their practical applications in various industrial processes; however, changing the water content can significantly overcome this issue without compromising their molecular structure or causing NADES dissociation [21,23]. The addition of water is crucial to improve extraction ability by regulating parameters such as polarity, viscosity, and hydrogen bonding [14,31].
The GC-MS technique was applied to quantify the chemical compounds in cork extracts (Figure 1), as previously implemented by Freitas et al., 2022 [14]. Since these structures are members of the same family as the components of the eutectic mixtures, all NADES, as predicted, removed a substantial quantity of low molecular weight alcohols and acids. NADES 1 extracted considerable amounts of all types of chemicals from cork, including terpenoids and aromatic compounds, despite being the most polar mixture. This may be because the components work together synergistically to extract both polar and non-polar molecules [6]. Small alcohols and acids were more abundant in NADES 2 extracts than in NADES 3, which also extracted more fatty acids and their derivatives (up to 15 g/L). All NADES included lactic acid; thus, they are all connected to an acid catalysis extraction process that facilitates the extraction of a large variety of bioactive chemicals with added value (fatty acids and derivatives, aromatic compounds, and terpenoids).

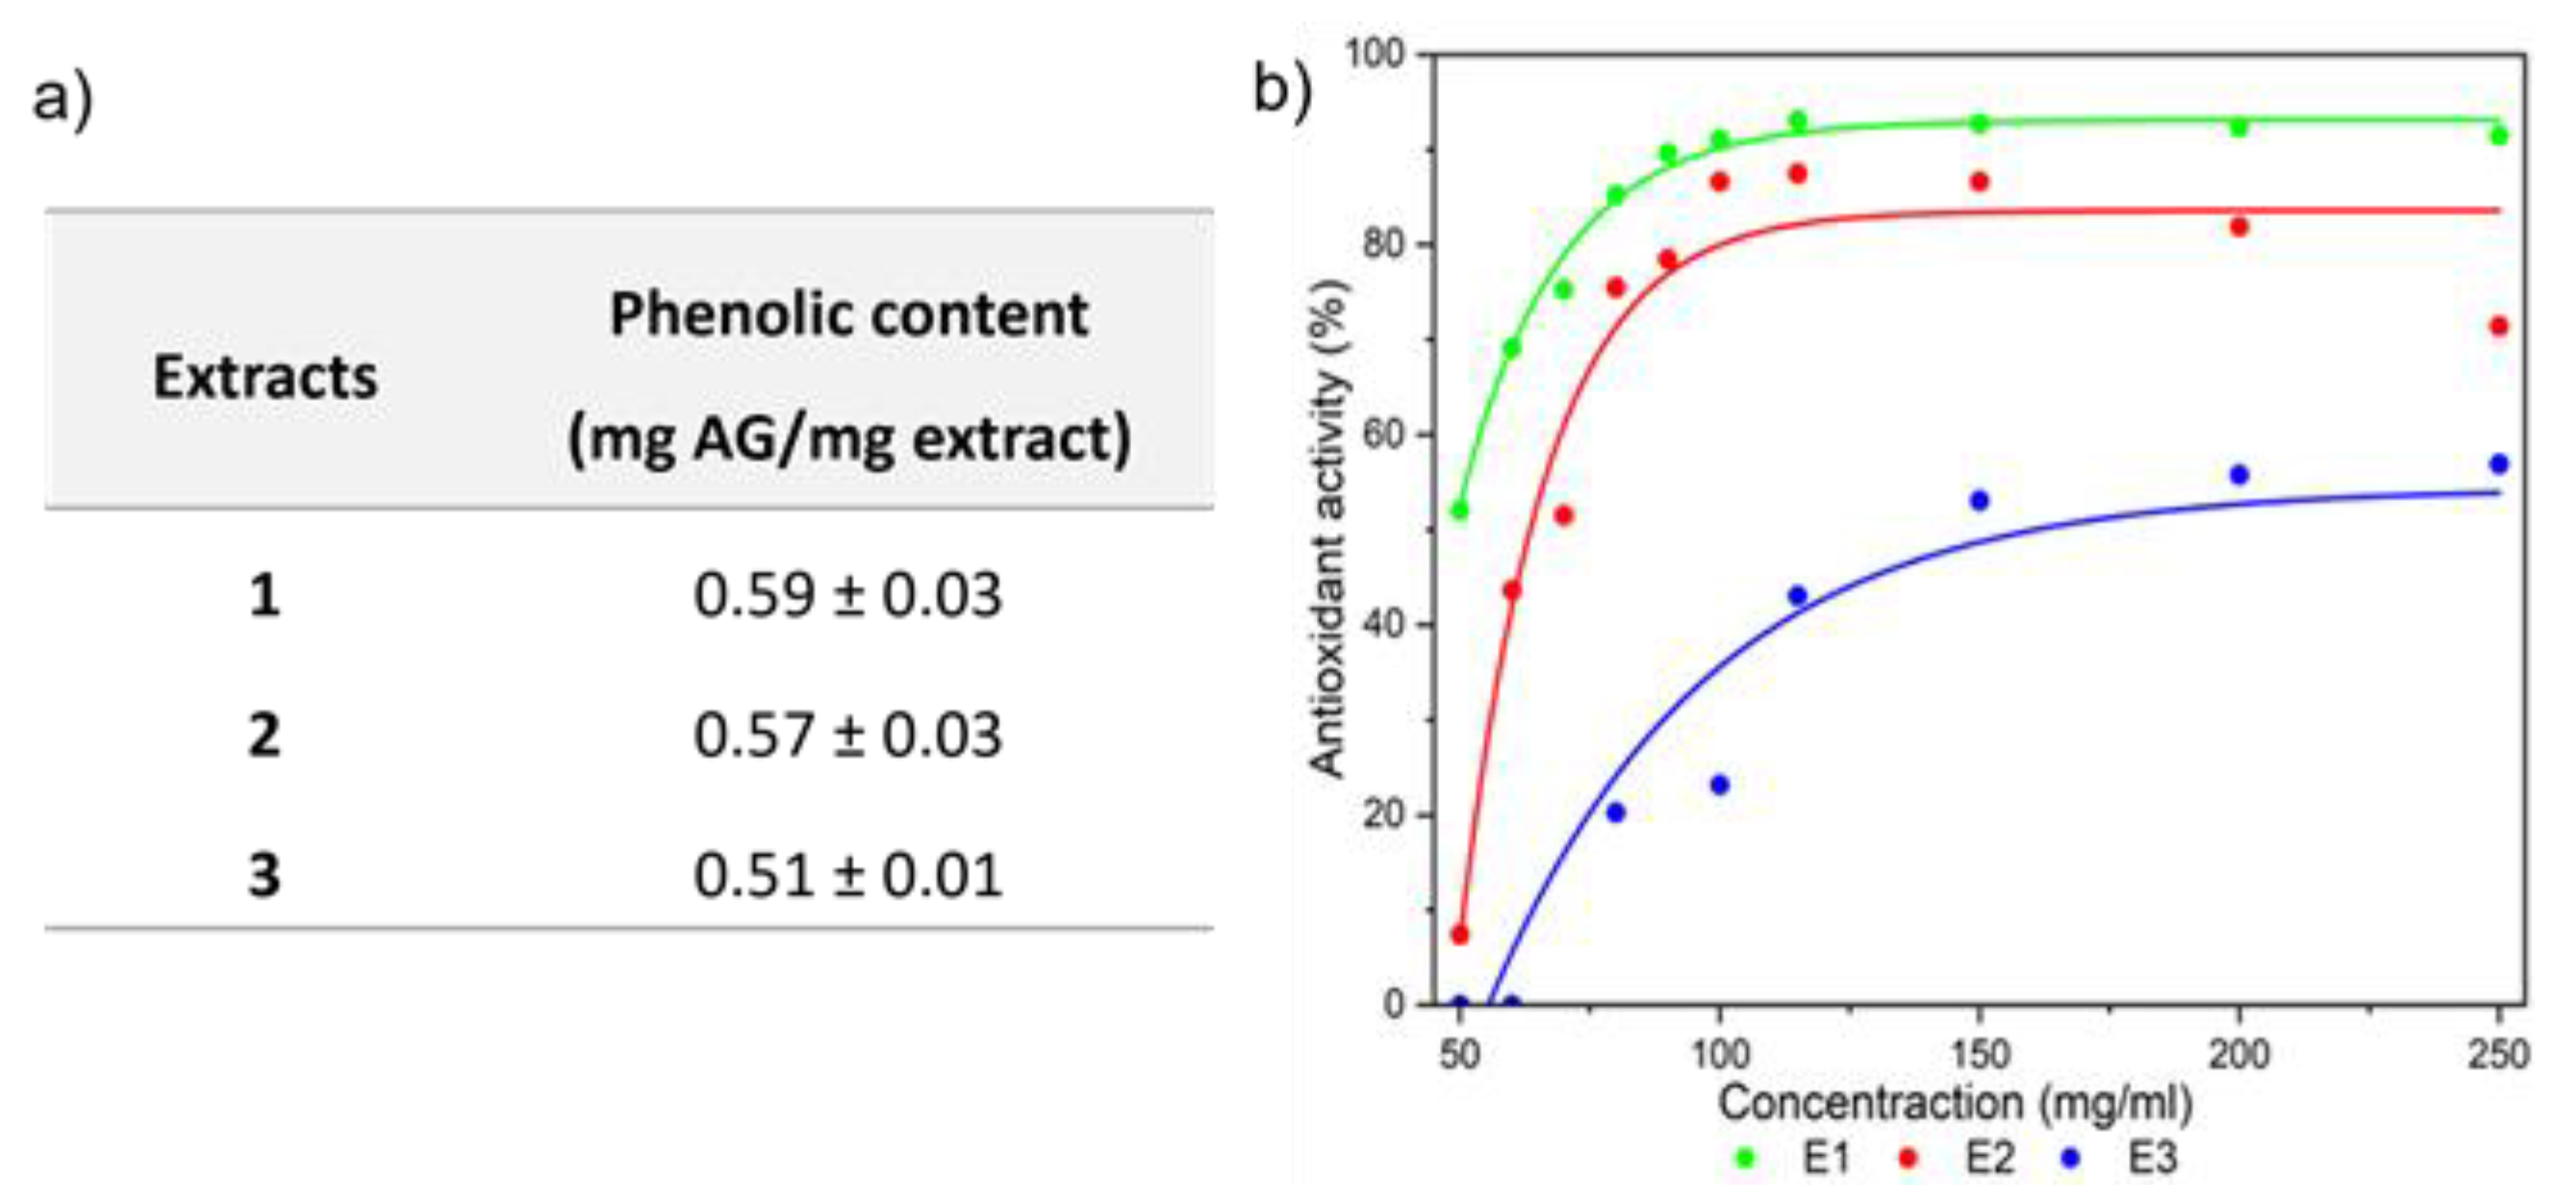
3.2. Phenolic Content and Antioxidant Activity of Cork Extracts

A material’s antioxidant capacity is closely associated with the amount of phenolic acids and flavonoids it contains. As stated by Paixão et al. [27], the higher the phenolic content in a sample, the higher the antioxidant capacity. Figure 2a shows that the total content of phenolics measured in extracts E1 and E2 are very similar, and within the range of cork-specific values that have been established in the literature [5,11,12]. Despite the similar levels observed (Figure 2a), the antioxidant activity values are relatively different (Figure 2b), as there are other compounds in the extracted mixture that may interfere with both the phenolic quantification method and with the antioxidant activity method. The Folin–Ciocalteu technique quantifies phenolics, but other compounds, such as flavonoids, gallic acid, caffeic acid, and anacardic acid, can influence the antioxidant activity when present in the mixture [32]. As depicted in Figure 2b, at a final concentration of 250 mg/mL, the antioxidant activity of extract E1 (obtained by extraction with lactic acid:glycerol) and of extract E2 (obtained by extraction with lactic acid:glycine) was 91.52% and 84.29%, respectively. Extract E3 (obtained by extraction with lactic acid:sodium citrate) had the lowest antioxidant capacity (at a concentration of 250 mg/mL it demonstrates 56.94% activity). These findings agree with Balboa et al., who found that extracts of natural origin with high phenolic content had high antioxidant activity than their synthetic counterparts [33].

3.3. Transdermal Permeation of Cork Extract

Transdermal permeation tests were performed to mimic the diffusion through the pores of human skin, as well as to evaluate other parameters that control diffusion selectivity, such as molecular weight, molecule shape, and electrostatic interactions.

3.3.1. Through Cellulose Acetate Membranes

The permeation of the extracts through the cellulose acetate membrane is shown in Table 5. The extracts E1 and E2 presented the highest overall penetration (66.36% and 67.60%, respectively) after 24 h. The difference between the level of penetration of extracts E1 and E2 was insignificant; however, E1 started to penetrate after one hour of exposition, while E2 only penetrated the membrane after 8 h. The consumer expects a cream to penetrate/absorb into the skin as rapidly as possible upon application; hence, this might be detrimental when utilizing this extract in a cosmetic composition. E1 would be the best option to incorporate into a cosmetic formulation, since it has the highest antioxidant activity and also the highest permeation. Extract 3 (E3) has the greatest permeation values in the first hours (17.21%) compared with the other extracts.

3.3.2. Through Pig Skin

A transdermal test on pig skin was also performed for a better understanding of the extract behavior when in contact with human skin. When compared with the results of permeation through cellulose acetate membranes, the extracts showed relatively lower percentages of permeation of pig skin (Table 5). Given the hydrophilic character of the extracts and the inherent difficulty to cross the skin layers, this behavior was somewhat expected. The transdermal permeability was increased by the presence of hydrophobic compounds such as fatty acids, alcohols, and aromatic compounds. According to Table 5, extract E1 presented the highest permeability, which is in accordance with the total content of phenolics observed. This extract has also the largest concentration of phenolic chemicals (Figure 2), which can favor the permeation of the formulation.

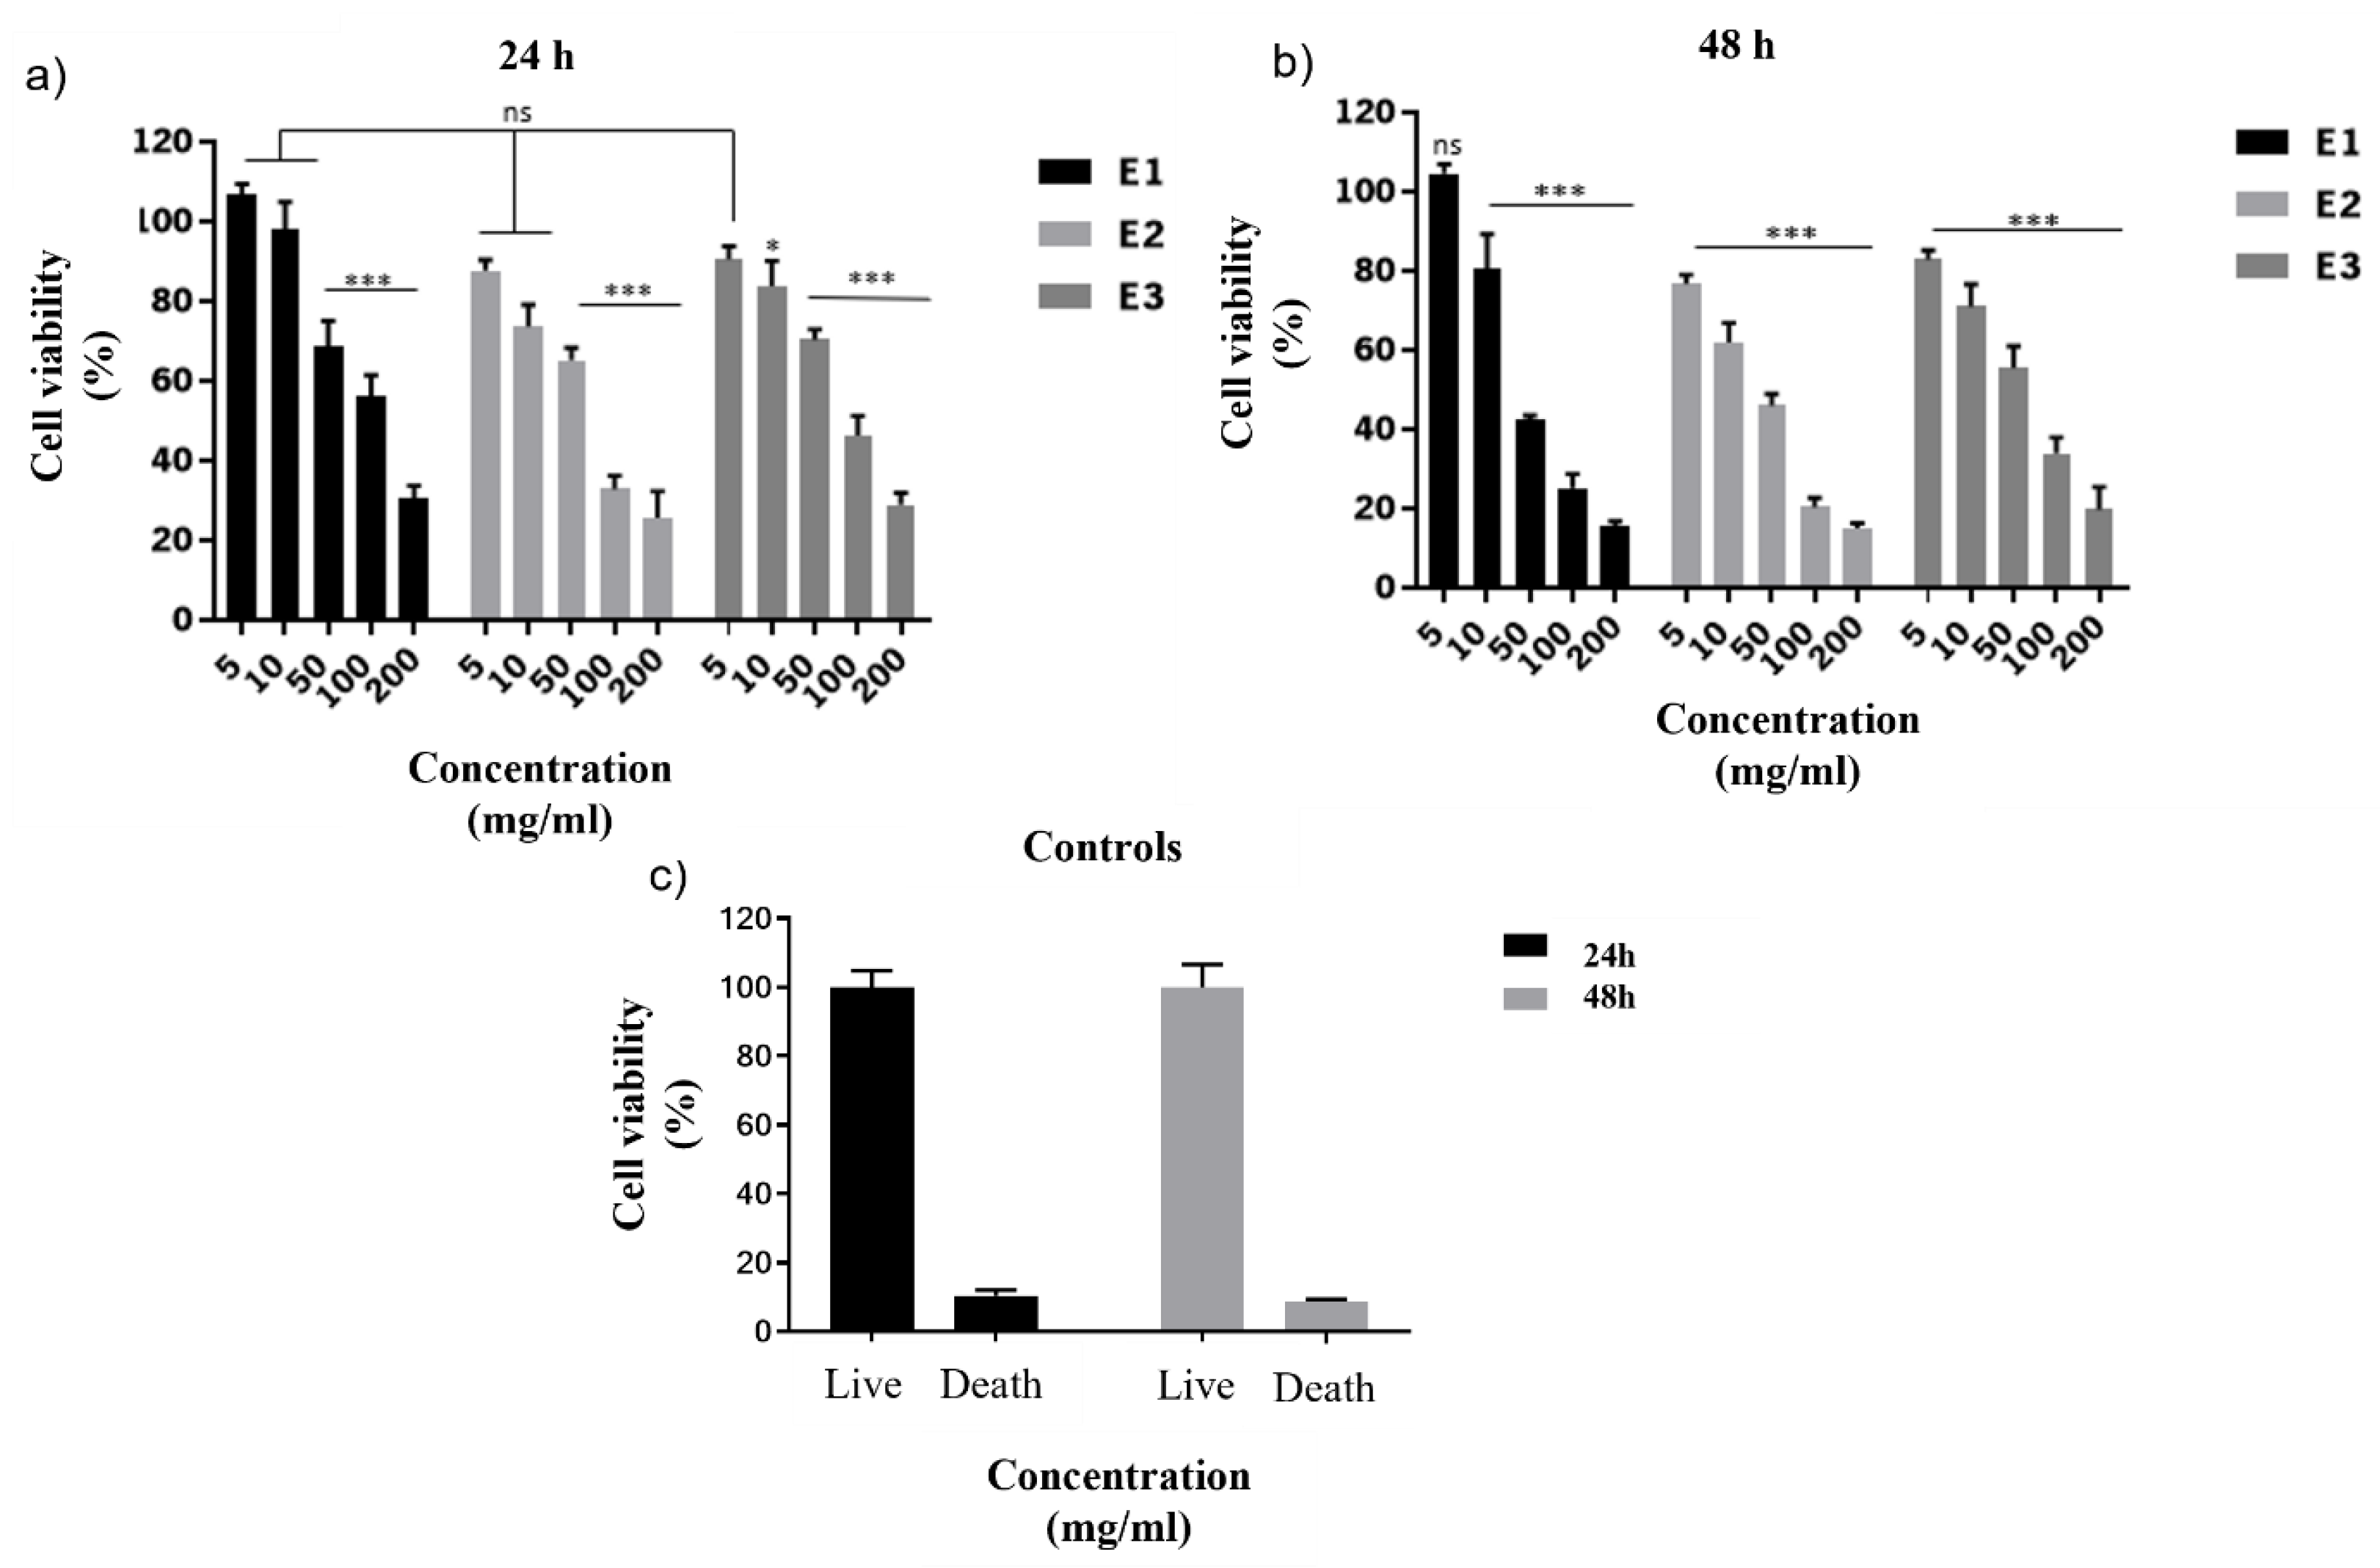
3.4. Cytotoxicity of Cork Extracts

Cosmetic product safety is influenced by the quality of the ingredients that make up its formulation. Therefore, it is essential to control the toxicity of the product and its components in order to assure its safety and effectiveness [34]. The cytotoxic potential of the three extracts employed in this study was therefore determined. Regarding the extracts’ cytotoxicity (Figure 3a,b), there is a direct correlation between extract concentration and cell viability. According to the OECD guidelines (OECD. Test No. 439: In Vitro Skin Irritation Reconstructed Human Epidermis Test Method; OECD Publishing: Paris, France, 2010), a substance is considered irritating if its medium relative viability is less than 50% of the mean viability of the negative controls during an exposure time of 15–60 min [13]. After 24 h, the cell viability values for the extract E1 (lactic acid:glycerol) was around 100% and 98% for concentrations of 5 mg/mL and 10 mg/mL, respectively, indicating no toxicity at the concentrations studied (Figure 3a)). After 24 h of incubation, the viability values of extract E2 (lactic acid:glycine eutectic) and extract E3 (lactic acid:sodium citrate eutectic) ranged between 87% and 90% for the lowest concentration (5 mg/mL). The cell viability levels slightly decreased after 48 h of incubation for all the concentrations and extracts tested (Figure 3b); however, they were equal or greater than 80% for the lowest extract concentration (5 mg/mL).
The extracts had a notable cytotoxic impact during 48 h of incubation at the highest concentrations (50, 100, and 200 mg/mL). When comparing the three extracts, extract E1 revealed to be the safest against keratinocytes, followed by extract E3 and extract E2. When comparing extracts E2 and E3 with extract E1, we observed statistically significant differences at 5mg/mL (E1 vs. E2 P ≤ 0.005; E1 vs. E3 P ≤ 0.05). However, for low concentrations (5 mg/mL and 10 mg/mL), all extracts were shown to be extremely promising for inclusion into cosmetic formulations due to the absence of cytotoxicity in keratinocytes. When present in amounts equal to or less than 10 mg/mL, Quercus suber L. extracts were not cytotoxic.

3.5. Characterization and Stability of Cosmetic Formulations Containing Cork Extracts

3.5.1. Organoleptic Properties

Cork extracts have been used as “green” components in cosmetic compositions to boost antioxidant activity or provide additional benefits. Following the inclusion of Quercus suber L. extracts, the cosmetic compositions’ organoleptic qualities were tested macroscopically (time 0). The color of all cosmetic formulations darkened once the extracts were added, as expected given the color of the extracts. A pleasant aroma and a uniform appearance persisted, indicating that the cork extracts had no effect on these characteristics at time 0. The organoleptic analysis of the formulations conditioned at room temperature, 4 °C, and 37 °C was also performed after 24 h, 72 h, 8 days, 30 days, 60 days, and 90 days. The data obtained until 60 days is similar and remarkably consistent with the results seen at time zero; thus, they are not reported here. After 90 days, the preparations’ pH and organoleptic properties were assessed at three different temperatures: 4 °C, 22 °C, and 37 °C (Table 6). At all storage temperatures, formulations A1 and B3 showed outstanding stability as they were the most homogenous of all the tested formulations, with a pleasant smell and coloration identical to the control sample. All samples’ pH levels remained constant over time.

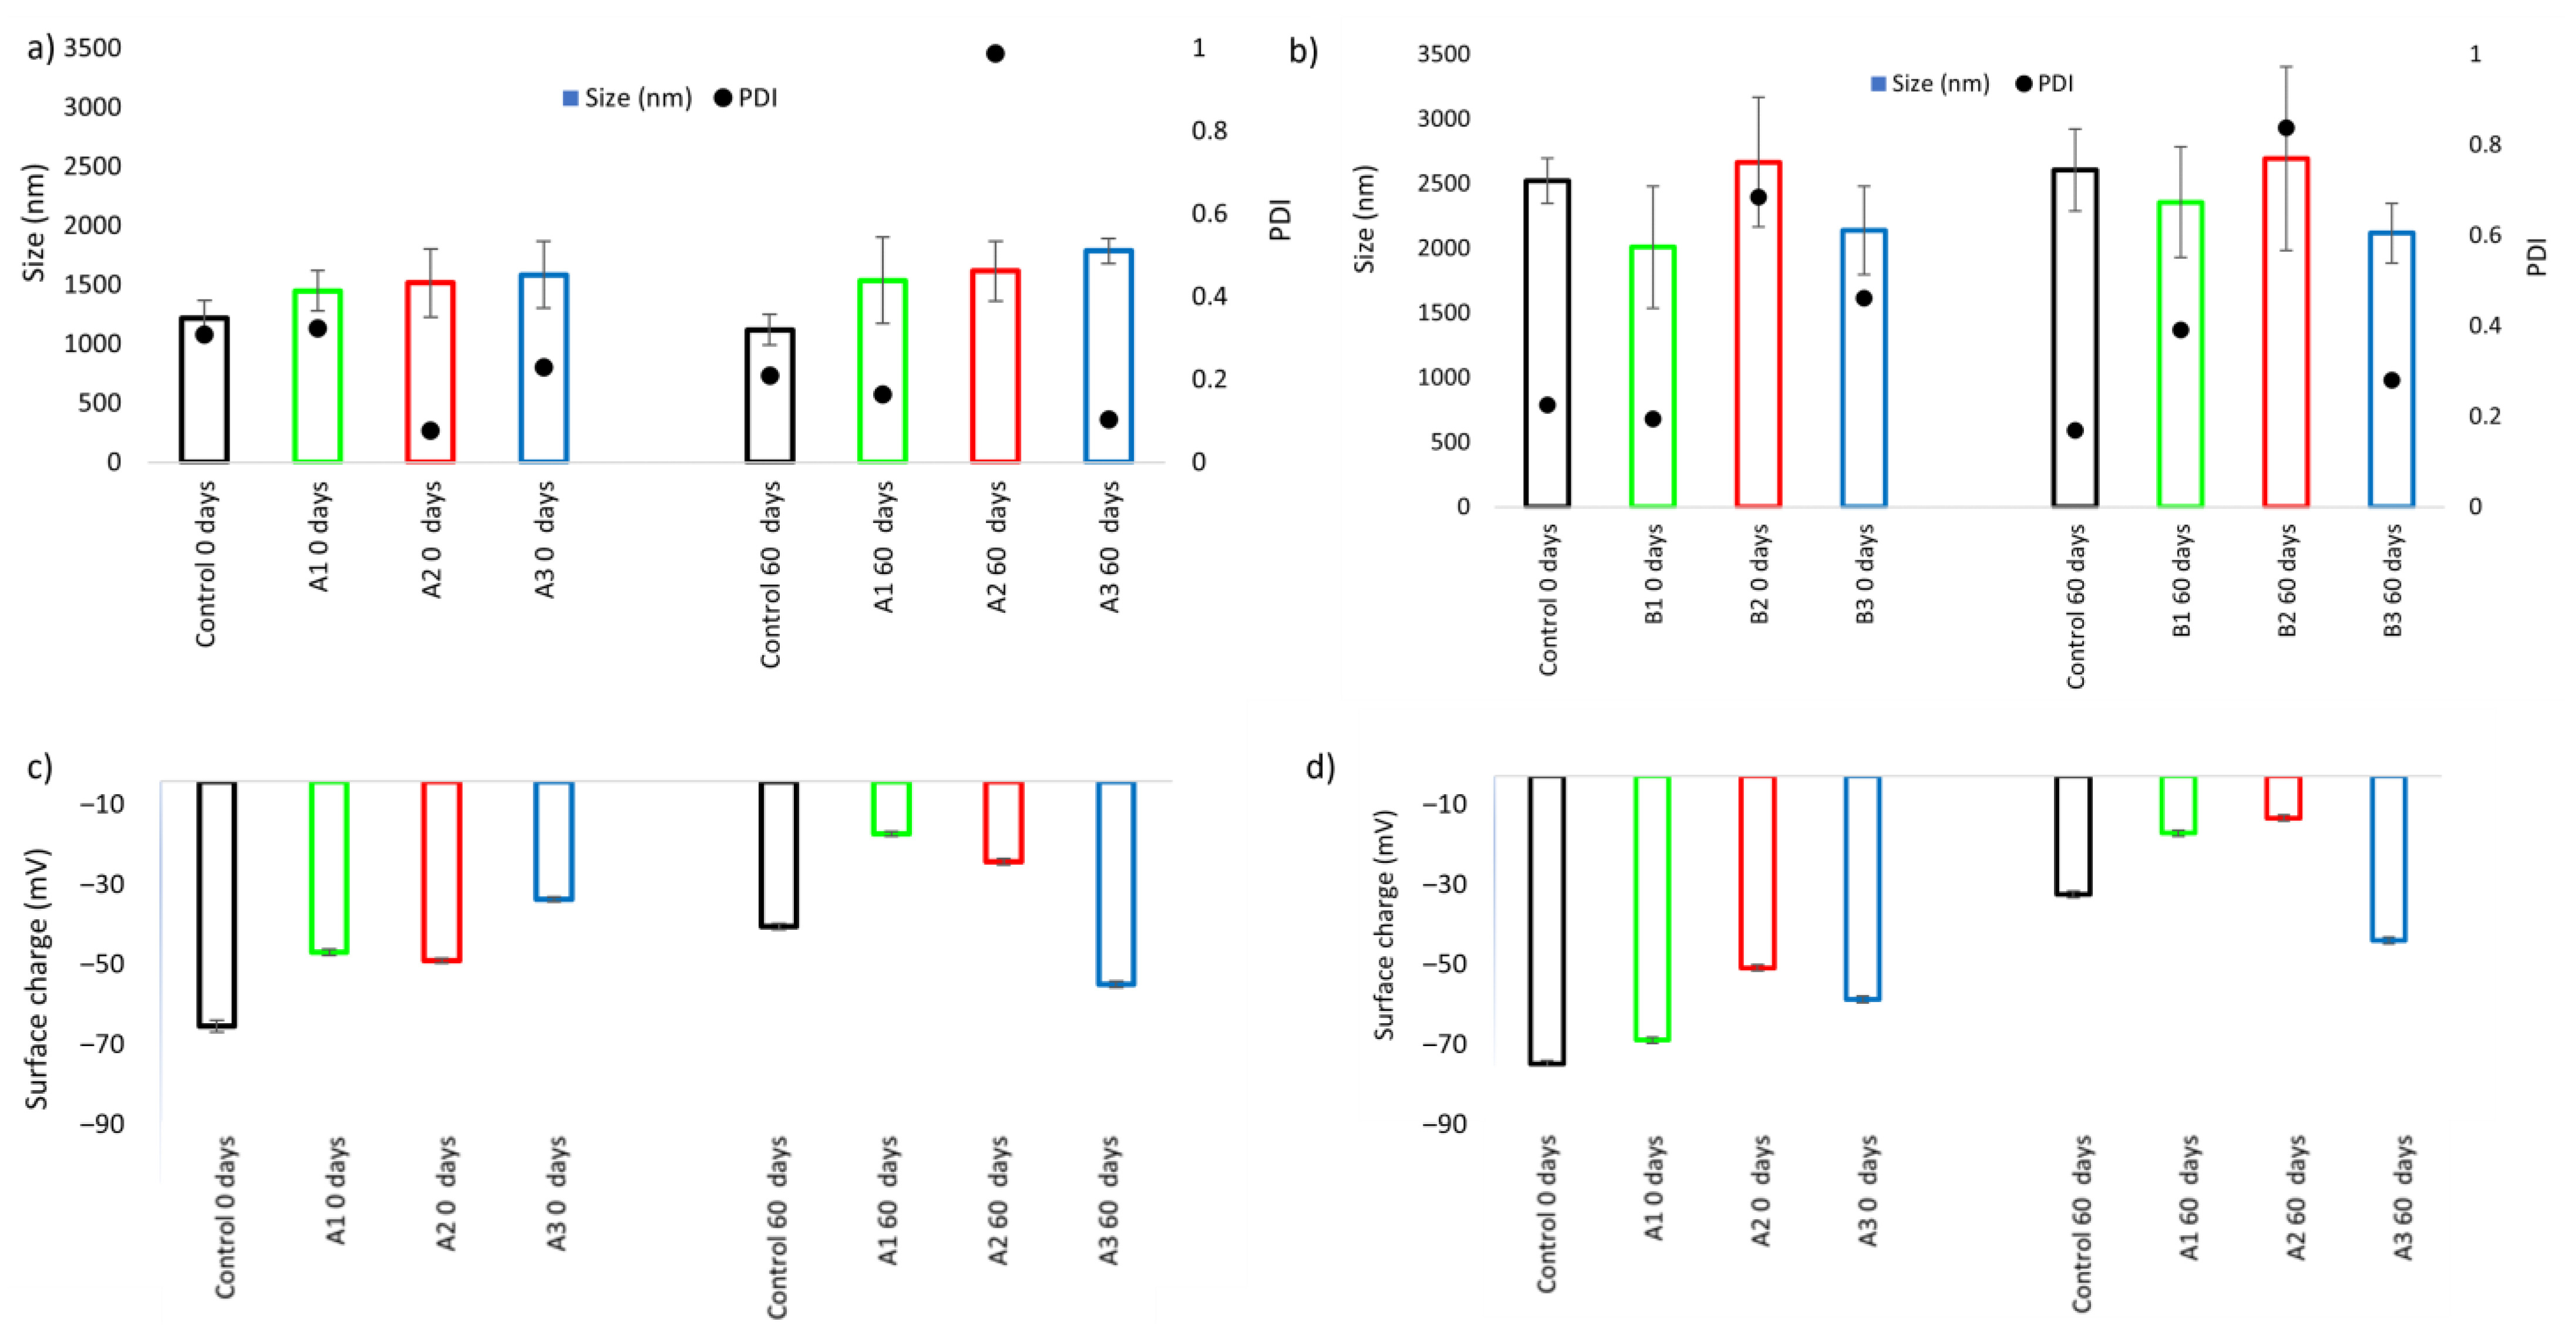
3.5.2. Particle Size and Surface Charge

Figure 4 shows the particle size, polydispersity (Figure 4a,b), and surface charge (Figure 4c,d) of formulations after preparation and after 60 days of storage. The particle sizes of formulations A1, A2, and A3, containing extracts, were very similar at time zero (1449 nm, 1516 nm, and 1586 nm, respectively) and after 60 days (1539 nm, 1617 nm, and 1787 nm, respectively). With a particle size of 1200 nm, the control sample (without extract) has a substantially lower potential for aggregation than the other samples, showing insignificant variation after 60 days (1121 nm). This is because there is no extract present in the formulation. The control of formulation B has a particle size (2522 nm) similar to that of samples B1, B2, and B3 (2009 nm, 2667 nm, and 2138 nm, respectively) at time zero, in contrast to what was observed for formulation A. The hydrodynamic size of all the solutions did not change significantly over 60 days. The polydispersity index (PDI) values of the cosmetic formulations were obtained alongside determining the particle size. The particle size distribution in emulsions is defined by the PDI value. The system reports a PDI value between 0 and 1, with values of 0.2 to 0.3 indicating moderately homogenous solutions, 0 indicating extremely homogeneous solutions, and 1.0 indicating extremely heterogeneous solutions [35]. The analyzed samples’ PDIs ranged from 0.1 to 0.5, indicating a modest and acceptable degree of homogeneity for these kind of topical application samples.
The particle surface charge, expressed as zeta potential, is an important stability parameter that indicates dispersion stability against aggregation or deposition. The higher the modulus load, the higher the physical stability. As a result of charge stabilization, zeta potential values above ±30 mV are considered moderately stable against aggregation, because electrostatic repulsive forces are strong enough to prevent particles from aggregating [36,37].
In this study, the zeta potential value of the formulations remained relatively constant between −20 mV to −90 mV. The formulations including extract exhibited a higher surface charge when compared to the controls (formulations without extract), but the values were still far from zero, demonstrating the formulations’ stability throughout the study.

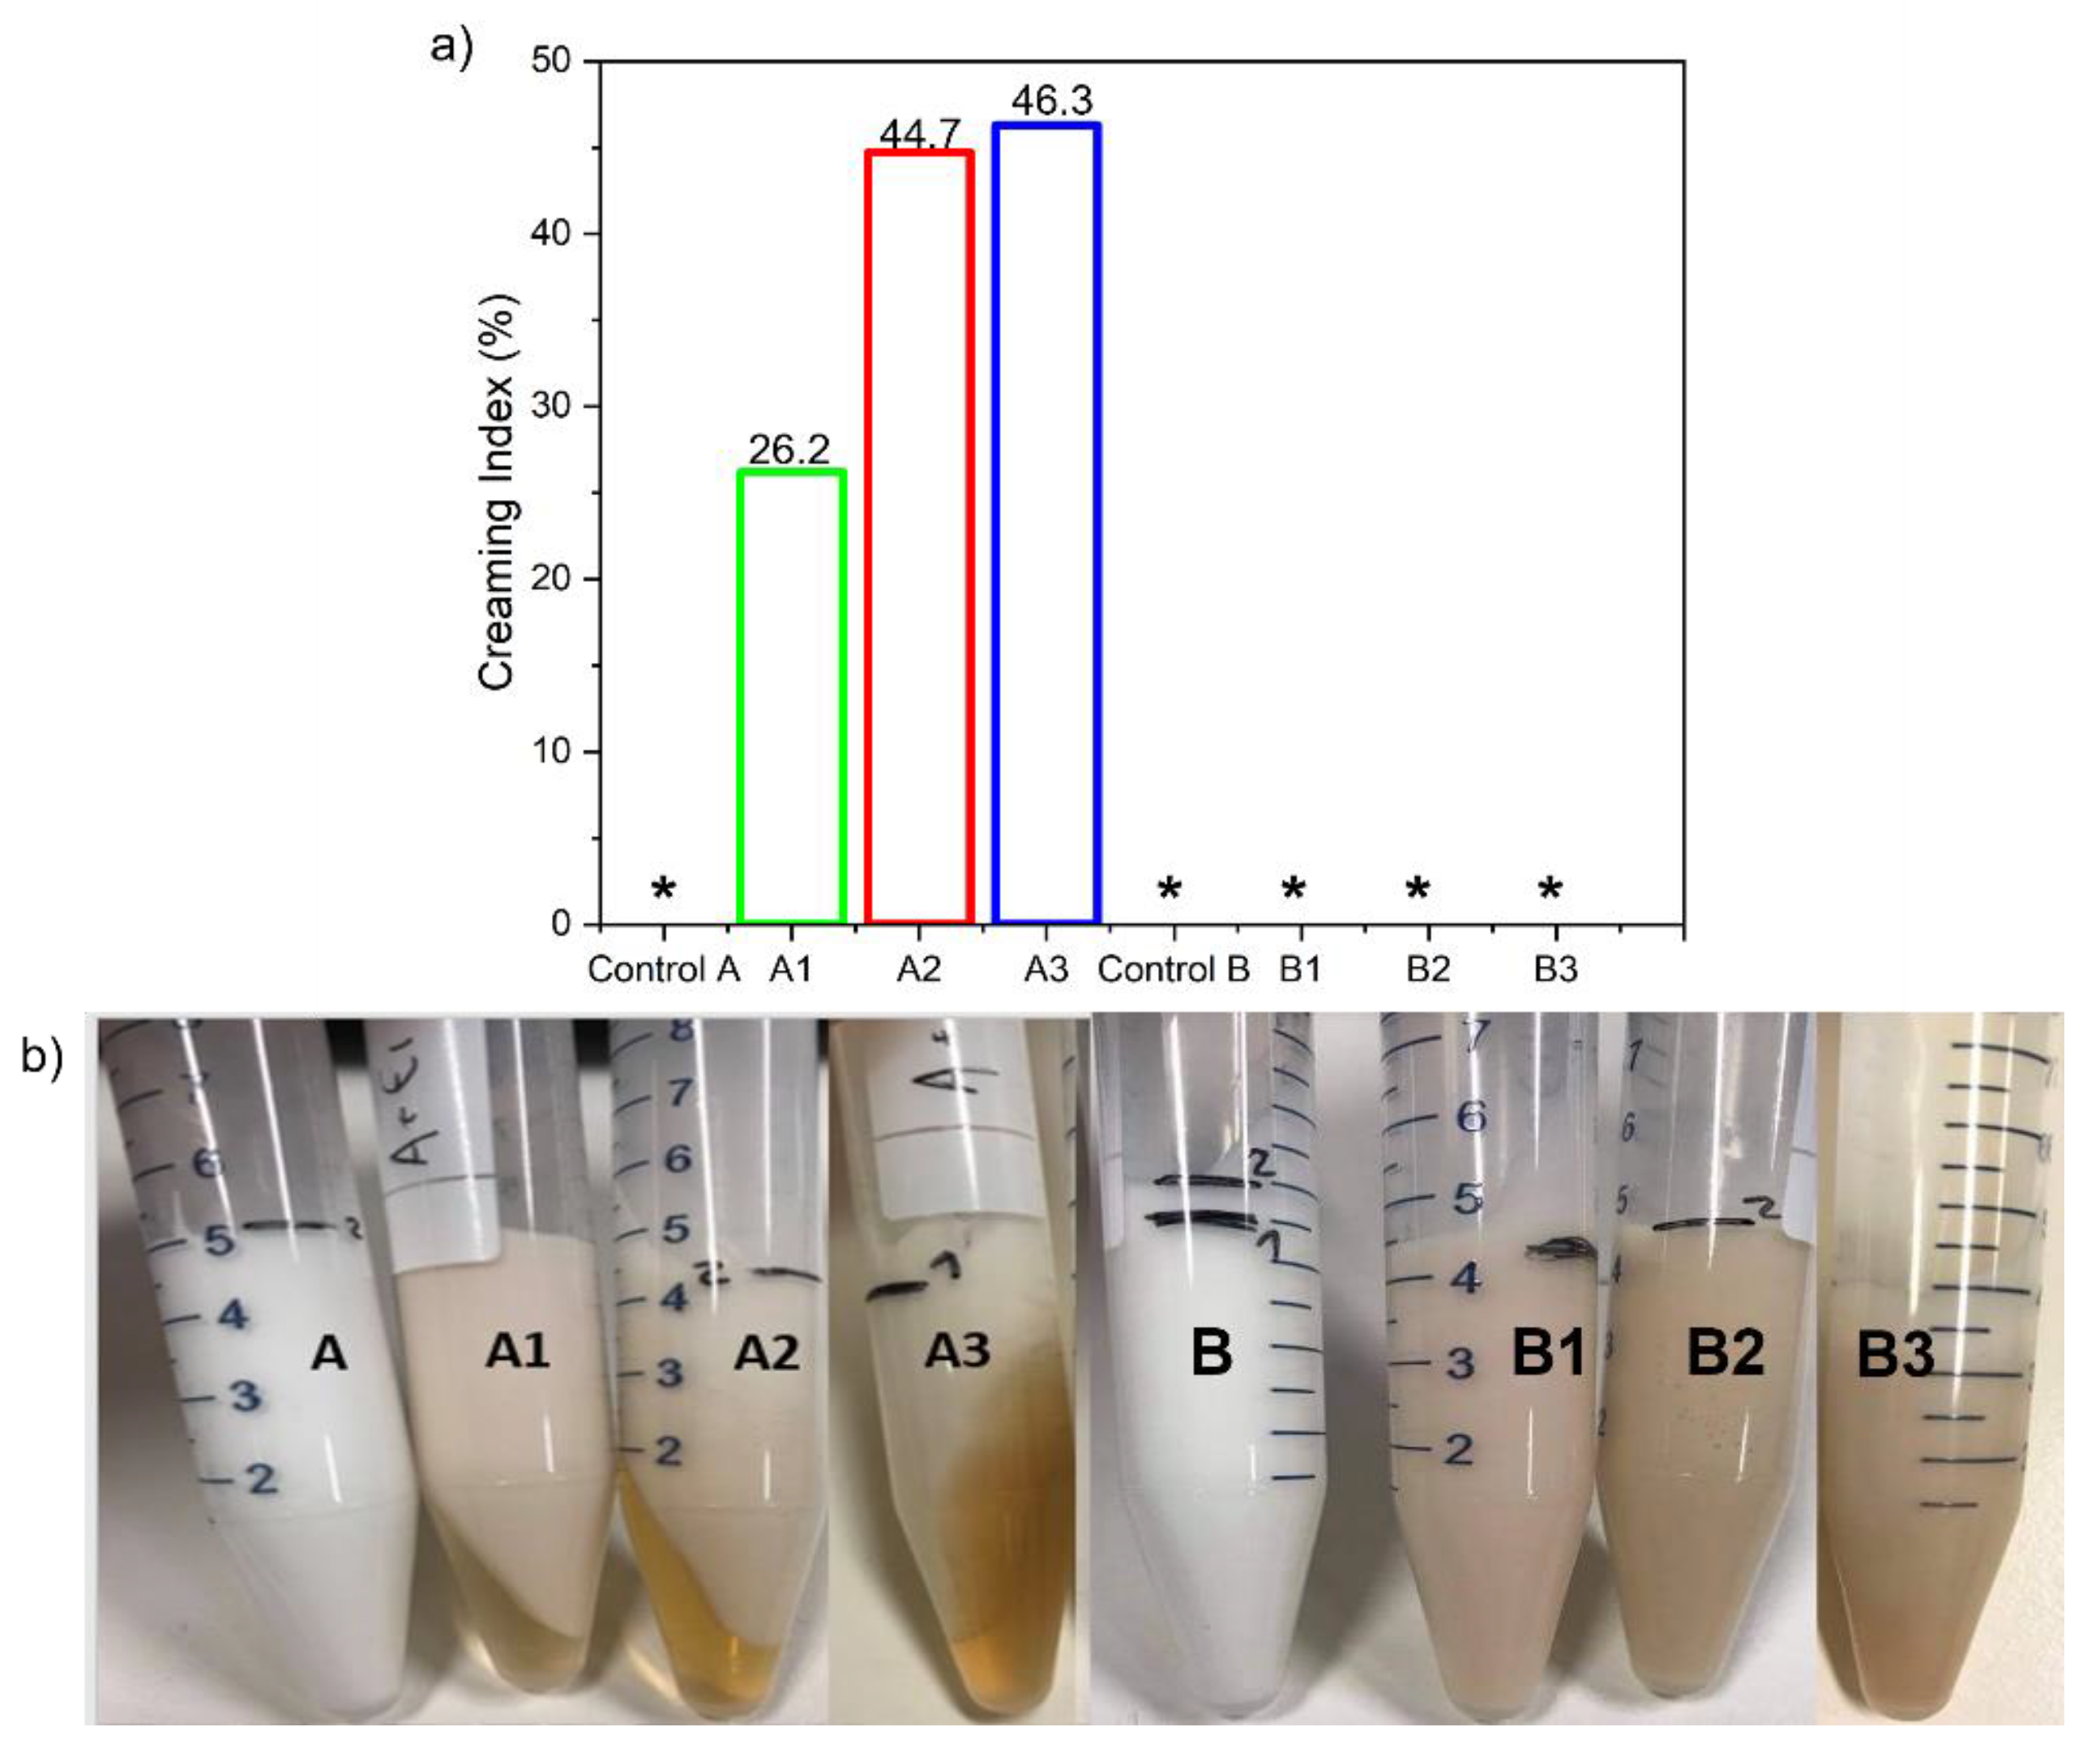
3.5.3. Creaming Index

Figure 5 shows the results of the accelerated stability testing. The results and images show phase separation for the preparations containing formulation A and the extracts studied, with creaming indices ranging from 26-46%. The lower number of emulsifiers in formulation A (Table 2), which are expected to decrease the surface tension, hindering the extracts’ ability to dissolve, can explain this behavior. With no separation seen in any of the cases, cosmetic formulation B is more receptive to extract inclusion.

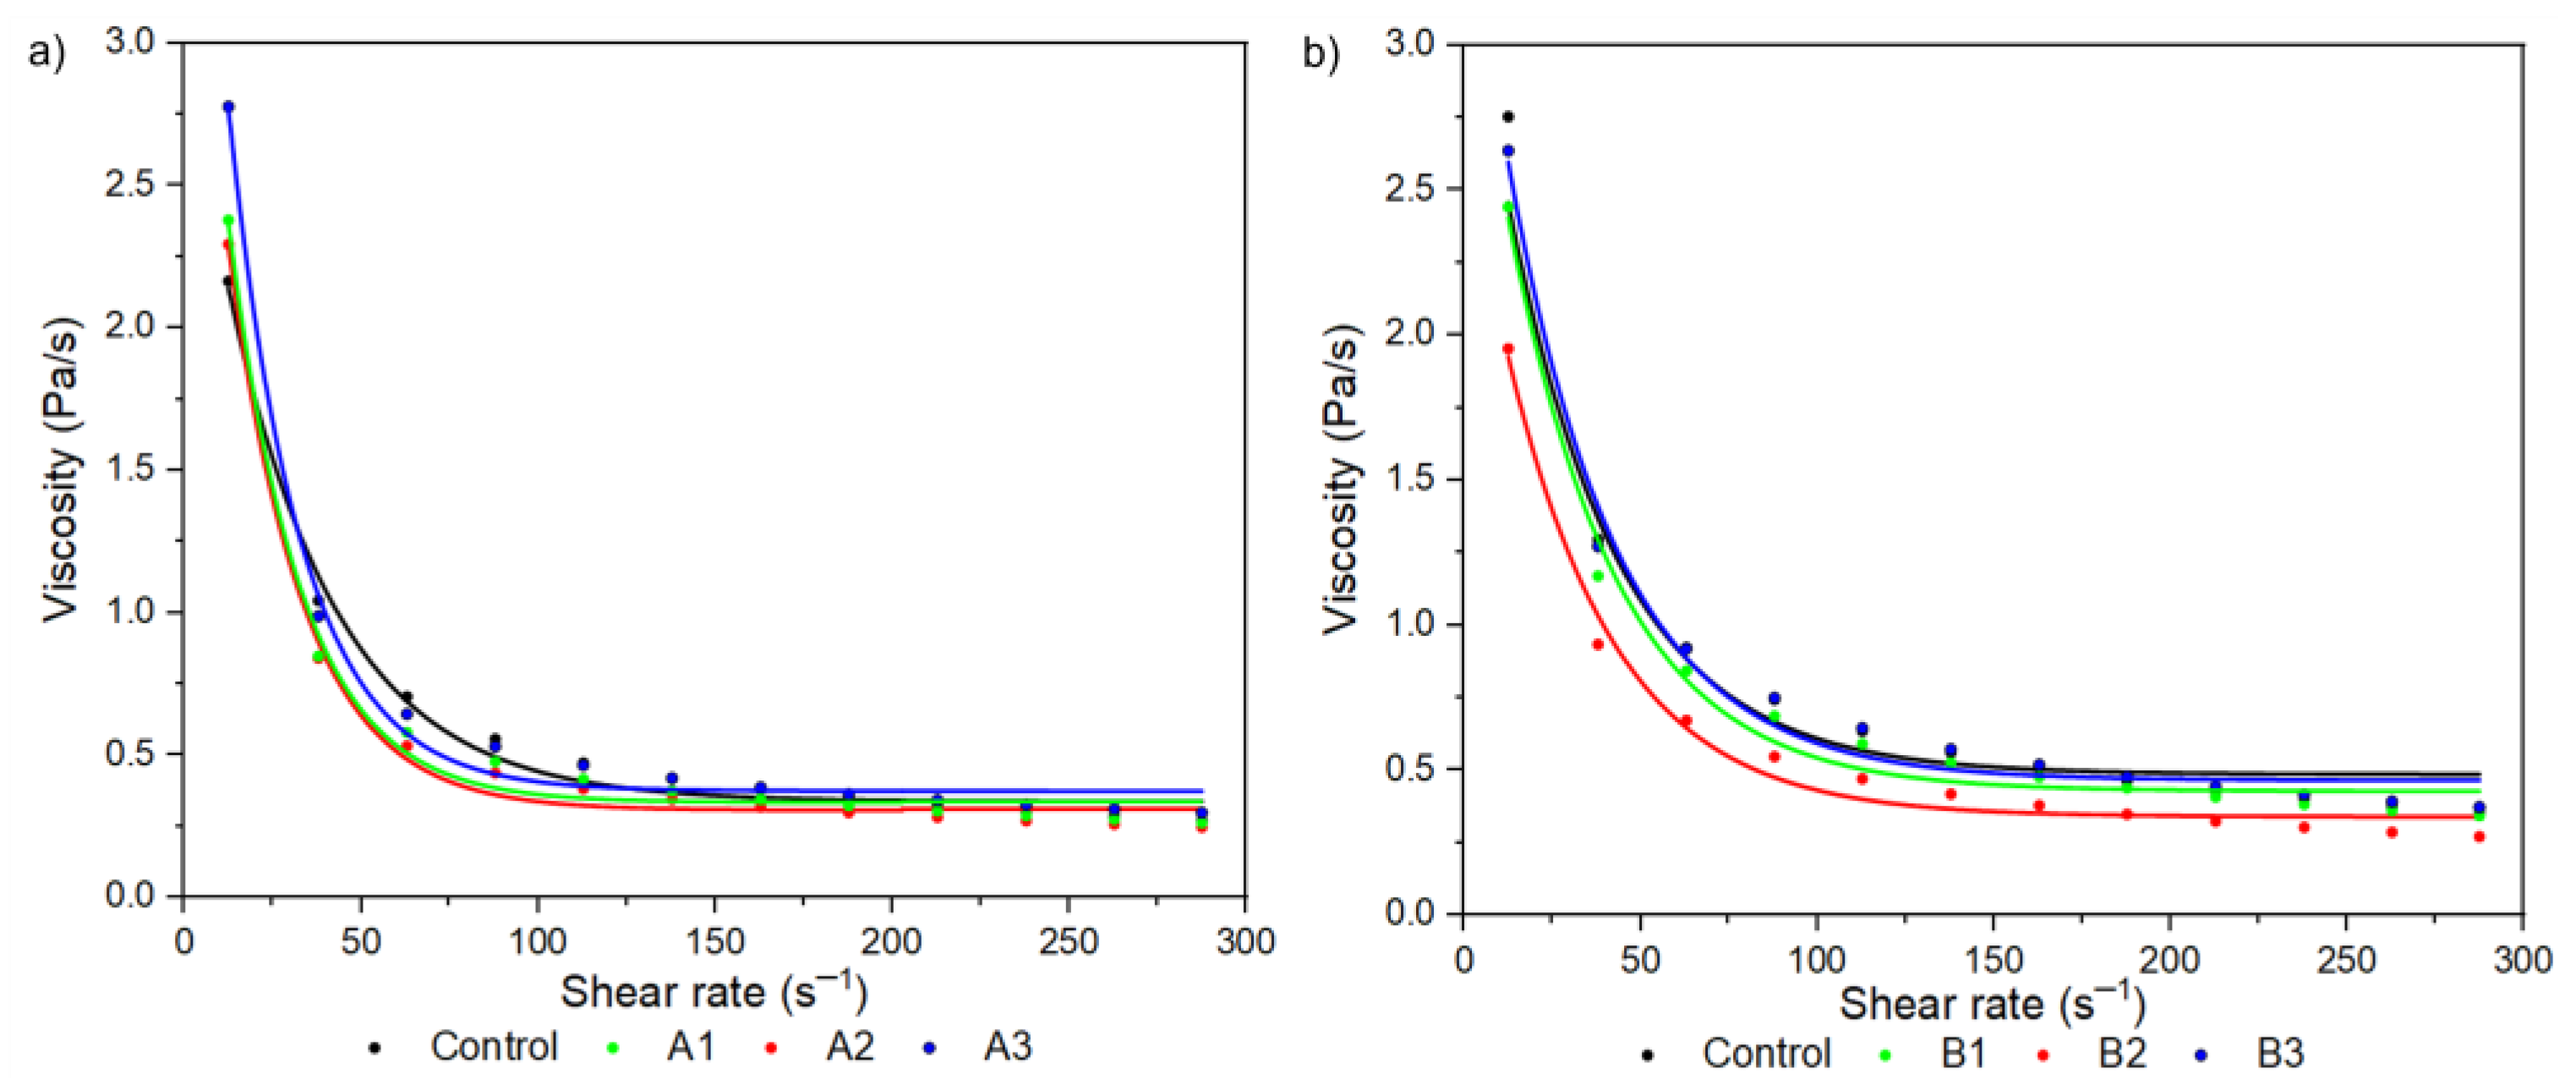
3.5.4. Rheologic Behavior

The consistency and behavior of formulations when exposed to deformation or flow forces brought on by shear stress may be investigated using rheology testing. Figure 6 illustrates how all the formulations under study showed a decrease in viscosity as the shear rate increased, demonstrating a pseudo-plastic behavior. When a particular force is applied to the cream on the skin, this action is frequently observed in cosmetic compositions when considering a good spread/ease of application (lowering viscosity). It is also noteworthy that the Aformulations, that revealed higher creaming index after centrifugation, also presented a higher decrease in viscosity, despite the similar rheological behavior when compared to B formulations. It seems that more fluidic formulations perform worst when subjected to higher shear forces.

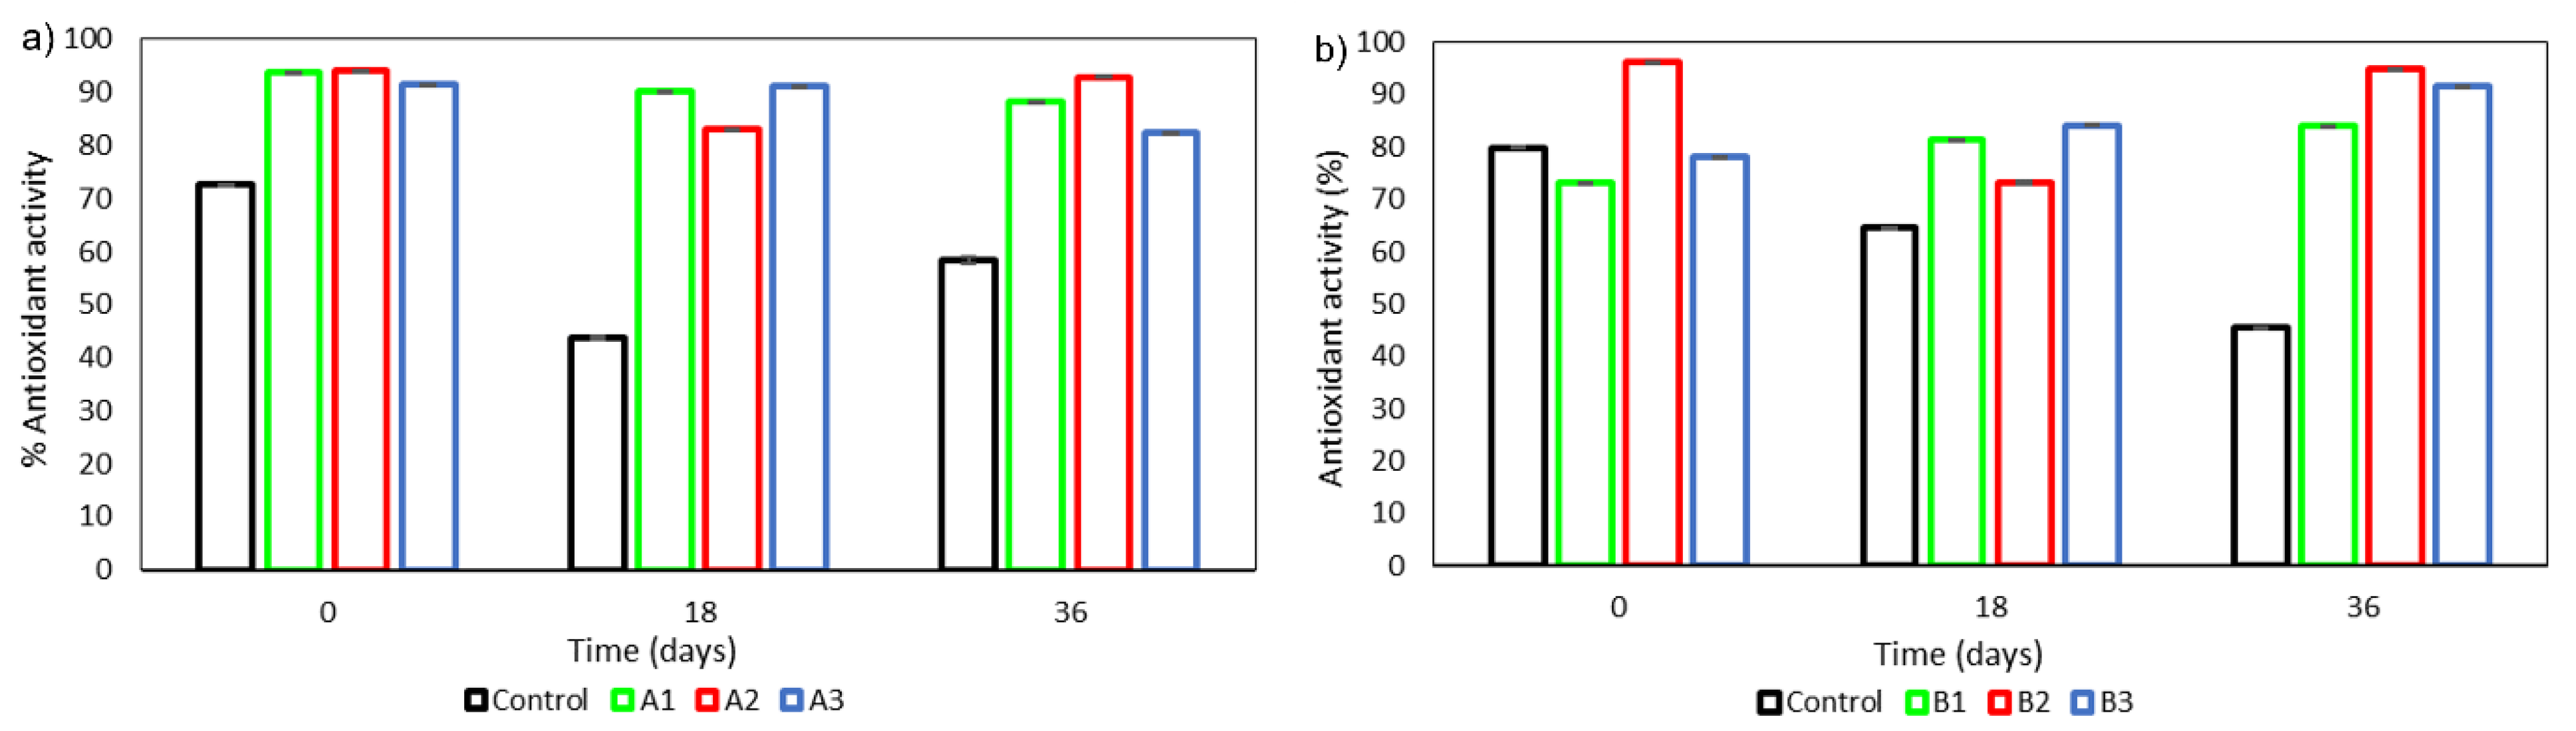
3.5.5. Determination of Antioxidant Activity of Formulations Containing the Extracts

The cosmetic formulations containing extracts had a strong antioxidant action, reducing the DPPH by 70% to 90% (Figure 7). When compared to their relative formulations containing extracts, the controls (A and B) showed a decrease in antioxidant activity over time. This loss of antioxidant activity was predictable, as when molecular oxygen and unsaturated fatty acids are combined in the presence of temperature variations, hydroperoxides or catalysts are formed. These compounds are reactive and form new oxidant products or secondary oxidation products (aldehydes, ketones, hydrocarbons, and alcohols) which easily lead to a decrease in the antioxidant capacity of the cosmetic emulsions [33]. In the formulations containing the extracts, only small variations were observed over time, since the presence of the extracts increased the antioxidant ability of the formulations. The antioxidant behavior of the formulations comprising the extracts can be explained by the presence of certain Quercus suber L. components, such as phenolic compounds. Several studies have confirmed that the presence of phenolic acids, together with the primary constituent of Quercus suber L., suberin, provides a wide range of capabilities, including antioxidant and free radical scavenging properties [5,13,38,39].

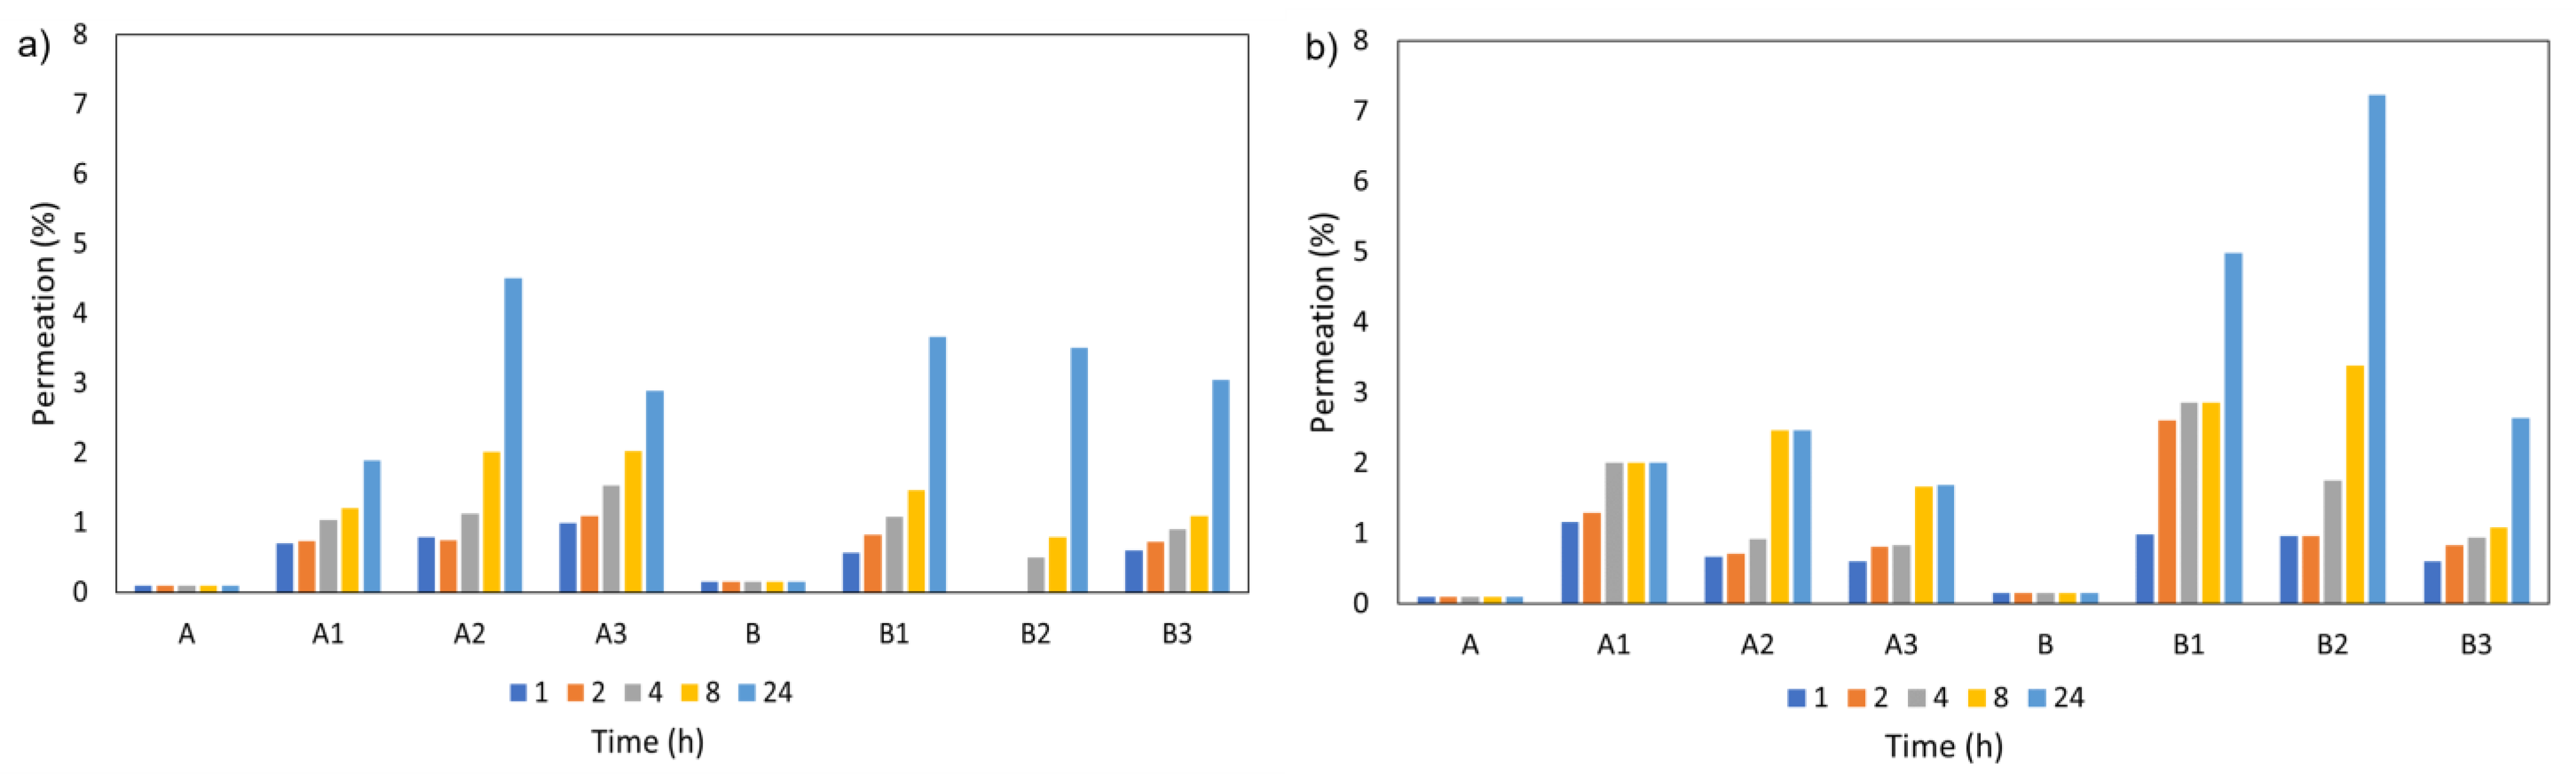
3.5.6. Transdermal Permeation of Formulations Containing Cork Extracts

Through Cellulose Acetate Membranes

The percentage of each cosmetic formulation’s cross-cellulose acetate membrane penetration is shown in Figure 8a. Both of the examined samples had an active action on the membranes, indicating that the formulations permeated the membranes. The 24 h experiment involved continual interaction between the tested formulations and the membranes, which increased the levels of penetration and subsequent permeation with time. However, for A1 and A3, the permeability appeared to stabilize over time. Cellulose acetate membrane is hydrophilic; therefore, hydrophilic cork extracts are more likely to penetrate it than extracts from formulations that are hydrophobic (Figure 8a). Lower penetration levels are the result of the extract’s passage being blocked by the hydrophobic base formulation. Although a cream is used at least once a day and the amount of extract that penetrates the skin would be enough to provide the intended impact, these findings would not hamper its use.

Through Pig Skin

Figure 8b shows the results of the permeation of formulations through pig skin. The greatest transdermal permeation values were found for both formulations incorporating extract E2 (with a lactic acid:glycine eutectic combination), at 2.47% (A2) and 7.23% (B2) (Figure 8b). The permeability decreases with the following sequence: E2 > E1 > E3 for both formulations (A and B).
The cosmetic formulations are hydrophobic with a strong affinity for the skin, and can assist the transport of the extracts to the receptor region, increasing permeation. The skin’s complex chemical composition and its high concentration of substances that can permeate to the receptor could enhance the skin’s read absorbance value and lead to inaccurate permeation readings. This might explain the disparity between the outcomes seen for extracts and formulations containing extracts.
The formulations containing extracts had higher permeation values with time, and after 24 h they tended to stabilize. The trends shown in the permeation data for the cellulose acetate membrane corroborate this phenomenon.
The stratum corneum is the rate-limiting barrier in the skin, which is made up of several layers. The primary goal of the formulations is to provide a protective layer/barrier against potentially harmful external factors, such as ultraviolet radiation, oxidative stress, and air pollutants, and the permeation results obtained here are sufficient to obtain these effects.

3.6. Dyeing/Coloration of Cotton Fabrics with the NADES-Based Cork-Colored Extracts

NADES-based cork extracts were used to dye fabrics and impart new properties to these substrates. Hydroxyl groups present in cellulosic fibers are naturally oxidized to form carboxylic groups, resulting in a slight negative charge of the fibers. Hence, natural dyeing of cotton is difficult because of the electrostatic repulsion between anionic moieties present in the cellulose structure and in natural dyes, which results in a low dye uptake and poor color strength [40,41]. Pre-treatment with cationic agents or mordanting techniques have been used, utilizing metallic salts as mordants, to increase the affinity of textile fibers and natural colors. Nowadays, the most popular mordants are aluminum, zinc, and copper sulphates [42]. Aluminum was employed as the mordant in this study, and its impact on the dyeing/coloring process was evaluated using a pre-mordanting procedure. Dyeing/coloration of cotton fabrics was performed with cork extracts obtained by extraction with three different NADES: lactic acid:glycerol (NADES 1), lactic acid:glycerine (NADES 2), and lactic acid:sodium citrate (NADES 3). Dyeing/coloration was performed on fabrics pre-treated by two different ways: with and without tannic acid. Tannic acid was used to increase the affinity of the substrate through the creation of van der Waals forces and hydrogen bonds resulting from the large molecular size and good availability of hydroxyl groups [43]. The obtained results are represented in Table 7.
Only extract E3, extracted with NADES 3 (lactic acid:sodium citrate), was capable of dyeing cotton with a greater K/S ratio than the control without any prior treatment (Table 7). Even for the remaining treatments, when NADES 3 is used, the K/S values are significantly higher than when the other natural eutectics are used. The sodium citrate (organic salt) present in NADES 3 operates as an exhausting and fixing agent, thus improving the dyeing yield. This organic salt contains more cations per mole than an inorganic salt, so the cork extract is more attracted to the cotton fabrics [44].
Natural dyeing usually implies the use of one or more mordants, which are typically metallic salts of aluminum, iron, chromium, copper, and other elements, to ensure color fastness to sunlight and washing [45]. However, as shown in Table 7, even without mordant and tannic acid, the K/S values are high. The NADES used in this study successfully dyed the fibers regardless the use of mordants. The presence of NADES made of lactic acid in the extracts and their relatively low pH (Table 4) may help the dyeing process.

3.7. Surface Characterization of Dyed Cotton Fabrics by Scanning Electron Microscopy (SEM)

The surface characteristics of undyed and dyed cotton fabrics with extract E1, extract E3, and control were examined by scanning electron microscopy, and the images obtained are shown in Figure 9. Fabrics dyed with extract 2 were not evaluated by SEM since only light coloration intensities were observed visually. In Figure 9a, the untreated cotton fabric reveals a smooth surface, while for the cotton fabrics dyed with extract 1 and extract 3 (Figure 9b), the deposition of the cork extract onto the surface of the fibers, regardless of the treatment performed, was visible, indicating the successful dyeing/coloration of the fabric.

3.8. DPPH Radical-Scavenging Activity of Coated Fabrics

Highly reactive and harmful species, such as active oxygen radicals, can be deactivated by bioactive fabrics with high antioxidant activities [46]. Textile fabrics come into direct contact with the body; therefore, antioxidant activity is critical for developing healthy and hygienic textiles [47]. The capacity of the antioxidant compounds to absorb free radicals of DPPH was used to assess the antioxidant activity of the textiles dyed with the extracts (1,1-diphenyl-2-picryl-hydrazyl) (Figure 10). Except for the non-pre-treated samples, the fabrics dyed with cork extract E2 exhibited the best antioxidant activity assessed in terms of %DPPH reduction (from 54% to 78%). Cotton textiles dyed with extract 3 had the lowest antioxidant activity (from 29% to 51%). When compared to extract 3, the fabrics dyed with extracts from water-only extraction showed greater antioxidant activities (from 62% to 79%), demonstrating that the cork extract’s antioxidant impact is independent of the type of solvent used.

3.9. Antimicrobial Activity of Coated Cotton Fabrics

The antibacterial capacity of the dyed samples was tested using two different bacteria species: Escherichia coli (Gram-negative) and Staphylococcus aureus (Gram-positive). Only fabrics dyed with cork extract E1, NADES 1 (lactic acid:glycerol), and cork extract E3, NADES 3 (lactic acid:sodium citrate), showed antimicrobial activity (Table 8). This may indicate that NADES 2 was unable to extract substances with antibacterial activity or that they are present in very small amounts in the extract composition. This was also confirmed by the lower coloration of the fabric obtained (Table 8).
Even though both samples (extracted with NADES 1 and extracted with NADES 3) demonstrated activity against both Gram-negative and Gram-positive bacteria, extract E3, obtained with NADES 3 (lactic acid:sodium citrate), demonstrated larger halos (12–15 mm) than E1 (10–13 mm). E3 had a greater antimicrobial capacity than E1 for both bacteria studied. Additionally, it appears that the antibacterial activity of the extracts was influenced by the type of treatment given to the materials. No matter the type of bacteria or the extract utilized, the treatment with tannic acid and mordant yielded better results, demonstrating activity in all textiles. Tannic acid and aluminum (mordant) have inherent antibacterial action [48,49], and they may have an additional impact when coupled with cork extracts and NADES.

4. Conclusions

In this work, the ability of natural deep eutectic solvents to extract bioactive compounds from cork is demonstrated. These extracts can be used to produce stable cosmetic formulations with improved antioxidant activities and no toxic effect against keratinocytes. The extracts can also be applied as dyeing agents to dye/colorize cotton fabrics.

4.1. Cork Extracts

Cork extracts were efficiently obtained from cork powder using green solvents (NADES). Solvent characterization revealed that different parameters such as polarity, density, and viscosity influenced the amount and quality of extracted compounds. The extracts obtained contain different components with antioxidant and antimicrobial activities, including fatty acids and their derivatives, small alcohols and acids, aromatic compounds, sugars, terpenoids, and others. The data obtained also confirmed that low doses of extracts (10 mg/mL) had no harmful effect against keratinocytes.

4.2. Cosmetic Formulations Incorporating NADES-Based Cork Extracts

Results of extract incorporation into commercial formulations showed that formulation B is physicochemical stable, with no phase separation following centrifugation and no reduction in its organoleptic properties after storage for 60 days at 37 °C.
Despite the different behavior observed after centrifugation between both formulations, the data revealed that particle sizes and surface charges are maintained after 60 days of storage at room temperature.
The antioxidant activity of formulations containing extracts (E1, E2, and E3) is similar, ranging from 80 to 90%. Certain chemicals found in Quercus suber L. bark, such as phenolic acids, suberin, and terpenes, inhibit oxidation and increase antioxidant capacity.
When included in the formulations, extract E2 performs better in both permeability tests. Considering all the data obtained, extract E2 would be the ideal choice to include in cosmetic formulations, ensuring an increase in the antioxidant activity without compromising the organoleptic properties or the stability at high temperatures. Moreover, the safety of the final formulations is ensured for concentrations of extract below 10mg/mL.

4.3. Textiles Dyeing/Coloration of Cotton Fabrics with NADES-Based Cork Extracts

With encouraging outcomes, another distinct use for the extracts produced was also developed. The NADES-based cork extracts were used as dyeing agents to successfully dye/colorize cotton fabrics. The highest K/S values and the most intense color were observed for samples dyed with extract E3 (lactic acid:sodium citrate) because sodium citrate functions as an exhausting and fixing agent. SEM images confirm that the cork extract was retained on the surface of the fibers, conferring high coloration. The dyed substrates also showed additional properties such as antibacterial and antioxidant properties.
The results demonstrate that the use of extracts from powdered cork is a potential environmentally friendly alternative to synthetic chemicals that are applied in the commercial dyeing process.

Author Contributions

Conceptualization, D.R., A.C.-P., C.S. and M.M.; methodology, D.R., D.S.F., J.M., M.F., S.S., J.N. and A.R.; data curation, D.R. and C.S.; writing—original draft, D.R.; writing—review and editing, D.R. and C.S.; supervision, C.S. and M.M.; funding acquisition, D.S.F., A.C.-P. and A.R. All authors have read and agreed to the published version of the manuscript.

Funding

This study was supported by the Portuguese Foundation for Science and Technology (FCT) under the scope of the strategic funding of UIDB/04469/2020 unit. D.S.F. also thanks the Portuguese Foundation for Science and Technology (FCT) for funding (SFRH/BD/147190/2019). A.R. thanks to Portuguese Foundation for Science and Technology (FCT) for is contract under the CEEC-Individual—4th Edition with the reference 2021.02803.CEECIND.

Data Availability Statement

Not applicable.

Acknowledgments

The authors would like to acknowledge Cork Supply Portugal, S.A for the cork powder.

Conflicts of Interest

There are no conflict to declare.

References

  1. Mota, S.; Pinto, C.; Cravo, S.; Rocha e Silva, J.; Afonso, C.; Sousa Lobo, J.M.; Tiritan, M.E.; Cidade, H.; Almeida, I.F. Quercus suber: A Promising Sustainable Raw Material for Cosmetic Application. Appl. Sci. 2022, 12, 4604. [Google Scholar] [CrossRef]
  2. Branco, D.G.; Santiago, C.; Lourenço, A.; Cabrita, L.; Evtuguin, D.V. Structural Features of Cork Dioxane Lignin from Quercus suber L. J. Agric. Food Chem. 2021, 69, 8555–8564. [Google Scholar] [CrossRef]
  3. Aroso, I.M.; Araújo, A.R.; Pires, R.A.; Reis, R.L. Cork: Current Technological Developments and Future Perspectives for this Natural, Renewable, and Sustainable Material. ACS Sustain. Chem. Eng. 2017, 5, 11130–11146. [Google Scholar] [CrossRef]
  4. Gandini, A.; Pascoal Neto, C.; Silvestre, A.J.D. Suberin: A promising renewable resource for novel macromolecular materials. Prog. Polym. Sci. 2006, 31, 878–892. [Google Scholar] [CrossRef]
  5. Santos, S.A.O.; Pinto, P.C.R.O.; Silvestre, A.J.D.; Neto, C.P. Chemical composition and antioxidant activity of phenolic extracts of cork from Quercus suber L. Ind. Crops Prod. 2010, 31, 521–526. [Google Scholar] [CrossRef]
  6. Carriço, C.; Ribeiro, H.M.; Marto, J. Converting cork by-products to ecofriendly cork bioactive ingredients: Novel pharmaceutical and cosmetics applications. Ind. Crops Prod. 2018, 125, 72–84. [Google Scholar] [CrossRef]
  7. Şöhretoğlu, D.; Renda, G. The polyphenolic profile of Oak (Quercus) species: A phytochemical and pharmacological overview. Phytochem. Rev. 2020, 19, 1379–1426. [Google Scholar] [CrossRef]
  8. Mislata, A.M.; Puxeu, M.; Ferrer-Gallego, R. Aromatic Potential and Bioactivity of Cork Stoppers and Cork By-Products. Foods 2020, 9, 133. [Google Scholar] [CrossRef] [Green Version]
  9. Lopes, M.H.; Gil, A.M.; Silvestre, A.J.D.; Neto, C.P. Composition of Suberin Extracted upon Gradual Alkaline Methanolysis of Quercus suber L. Cork. J. Agric. Food Chem. 2000, 48, 383–391. [Google Scholar] [CrossRef]
  10. Sousa, A.F.; Gandini, A.; Silvestre, A.J.; Pascoal Neto, C.J.C.C. Synthesis and characterization of novel biopolyesters from suberin and model comonomers. ChemSusChem 2008, 1, 1020–1025. [Google Scholar] [CrossRef]
  11. Pereira, H. Chemical composition and variability of cork from Quercus suber L. Wood Sci. Technol. 1988, 22, 211–218. [Google Scholar] [CrossRef]
  12. Sousa, A.F.; Pinto, P.C.R.O.; Silvestre, A.J.D.; Pascoal Neto, C. Triterpenic and Other Lipophilic Components from Industrial Cork Byproducts. J. Agric. Food Chem. 2006, 54, 6888–6893. [Google Scholar] [CrossRef] [PubMed]
  13. Carriço, C.; Pinto, P.; Graça, A.; Gonçalves, L.M.; Ribeiro, H.M.; Marto, J. Design and Characterization of a New Quercus Suber-Based Pickering Emulsion for Topical Application. Pharmaceutics 2019, 11, 131. [Google Scholar] [CrossRef] [PubMed] [Green Version]
  14. Freitas, D.S.; Rocha, D.; Castro, T.G.; Noro, J.; Castro, V.I.B.; Teixeira, M.A.; Reis, R.L.; Cavaco-Paulo, A.; Silva, C. Green Extraction of Cork Bioactive Compounds Using Natural Deep Eutectic Mixtures. ACS Sustain. Chem. Eng. 2022, 10, 7974–7989. [Google Scholar] [CrossRef]
  15. Pintor, A.M.A.; Ferreira, C.I.A.; Pereira, J.C.; Correia, P.; Silva, S.P.; Vilar, V.J.P.; Botelho, C.M.S.; Boaventura, R.A.R. Use of cork powder and granules for the adsorption of pollutants: A review. Water Res. 2012, 46, 3152–3166. [Google Scholar] [CrossRef]
  16. Kant, R. Textile dyeing industry an environmental hazard. Nat. Sci. 2012, 4, 5. [Google Scholar] [CrossRef] [Green Version]
  17. Karabulut, K.; Atav, R. Dyeing of Cotton Fabric with Natural Dyes without Mordant Usage Part I: Determining the Most Suitable Dye Plants for Dyeing and UV Protective Functionalization. Fibers Polym. 2020, 21, 1773–1782. [Google Scholar] [CrossRef]
  18. Arora, J.; Agarwal, P.; Gupta, G. Rainbow of Natural Dyes on Textiles Using Plants Extracts: Sustainable and Eco-Friendly Processes. Green Sustain. Chem. 2017, 7, 13. [Google Scholar] [CrossRef] [Green Version]
  19. Ayele, M.; Tesfaye, T.; Alemu, D.; Limeneh, M.; Sithole, B. Natural dyeing of cotton fabric with extracts from mango tree: A step towards sustainable dyeing. Sustain. Chem. Pharm. 2020, 17, 100293. [Google Scholar] [CrossRef]
  20. Paiva, A.; Craveiro, R.; Aroso, I.; Martins, M.; Reis, R.L.; Duarte, A.R.C. Natural Deep Eutectic Solvents–Solvents for the 21st Century. ACS Sustain. Chem. Eng. 2014, 2, 1063–1071. [Google Scholar] [CrossRef]
  21. Choi, Y.H.; van Spronsen, J.; Dai, Y.; Verberne, M.; Hollmann, F.; Arends, I.W.C.E.; Witkamp, G.-J.; Verpoorte, R. Are Natural Deep Eutectic Solvents the Missing Link in Understanding Cellular Metabolism and Physiology? Plant Physiol. 2011, 156, 1701–1705. [Google Scholar] [CrossRef] [PubMed] [Green Version]
  22. Satlewal, A.; Agrawal, R.; Bhagia, S.; Sangoro, J.; Ragauskas, A.J. Natural deep eutectic solvents for lignocellulosic biomass pretreatment: Recent developments, challenges and novel opportunities. Biotechnol. Adv. 2018, 36, 2032–2050. [Google Scholar] [CrossRef] [PubMed]
  23. Dai, Y.; Witkamp, G.-J.; Verpoorte, R.; Choi, Y.H. Tailoring properties of natural deep eutectic solvents with water to facilitate their applications. Food Chem. 2015, 187, 14–19. [Google Scholar] [CrossRef]
  24. Yablon, D.; Schilowitz, A. Solvatochromism of Nile Red in Nonpolar Solvents. Appl. Spectrosc. 2004, 58, 843–847. [Google Scholar] [CrossRef]
  25. Ogihara, W.; Aoyama, T.; Ohno, H. Polarity Measurement for Ionic Liquids Containing Dissociable Protons. Chem. Lett. 2004, 33, 1414–1415. [Google Scholar] [CrossRef]
  26. Yeo, Y.-H.; Hsu, F.-L.; Chen, Y.-L.; Chang, T.-C. Evaluation of the extracts from the renewable parts in Garcinia subelliptica as natural sunscreen additives. Ind. Crops Prod. 2022, 186, 115214. [Google Scholar] [CrossRef]
  27. Paixão, N.; Perestrelo, R.; Marques, J.C.; Câmara, J.S. Relationship between antioxidant capacity and total phenolic content of red, rosé and white wines. Food Chem. 2007, 105, 204–214. [Google Scholar] [CrossRef] [Green Version]
  28. Rahman, M.M.; Koh, J.; Hong, K.H. Coloration and multi-functionalization of cotton fabrics using different combinations of aqueous natural plant extracts of onion peel, turmeric root, and pomegranate rind. Ind. Crops Prod. 2022, 188, 115562. [Google Scholar] [CrossRef]
  29. Bayer, A.W.; Kirby WM, M.; Sherris, J.C.; Turck, M. Antibiotic susceptibility testing by a standardized single disk method. Am. J. Clin. Pathol. 1966, 45, 493–496. [Google Scholar] [CrossRef]
  30. Haynes, W.M. CRC Handbook of Chemistry and Physics; CRC Press: Boca Raton, FL, USA, 2016. [Google Scholar] [CrossRef]
  31. Dugoni, G.C.; Di Pietro, M.E.; Ferro, M.; Castiglione, F.; Ruellan, S.; Moufawad, T.; Moura, L.; Costa Gomes, M.F.; Fourmentin, S.; Mele, A. Effect of Water on Deep Eutectic Solvent/β-Cyclodextrin Systems. ACS Sustain. Chem. Eng. 2019, 7, 7277–7285. [Google Scholar] [CrossRef]
  32. Masuoka, N.; Matsuda, M.; Kubo, I. Characterisation of the antioxidant activity of flavonoids. Food Chem. 2012, 131, 541–545. [Google Scholar] [CrossRef]
  33. Balboa, E.M.; Soto, M.L.; Nogueira, D.R.; González-López, N.; Conde, E.; Moure, A.; Vinardell, M.P.; Mitjans, M.; Domínguez, H. Potential of antioxidant extracts produced by aqueous processing of renewable resources for the formulation of cosmetics. Ind. Crops Prod. 2014, 58, 104–110. [Google Scholar] [CrossRef] [Green Version]
  34. Masson, P. The Contribution of the European Cosmetics Directive Towards International Harmonization: Impact on the Evaluation of Safety and Efficacy. In Cosmetics: Controlled Efficacy Studies and Regulation; Elsner, P., Maibach, H.I., Merk, H.F., Eds.; Springer: Berlin/Heidelberg, Germany, 1999; pp. 20–35. [Google Scholar] [CrossRef]
  35. Tantra, R.; Schulze, P.; Quincey, P. Effect of nanoparticle concentration on zeta-potential measurement results and reproducibility. Particuology 2010, 8, 279–285. [Google Scholar] [CrossRef]
  36. Al Shaal, L.; Shegokar, R.; Müller, R.H. Production and characterization of antioxidant apigenin nanocrystals as a novel UV skin protective formulation. Int. J. Pharm. 2011, 420, 133–140. [Google Scholar] [CrossRef] [PubMed]
  37. Lowry, G.V.; Hill, R.J.; Harper, S.; Rawle, A.F.; Hendren, C.O.; Klaessig, F.; Nobbmann, U.; Sayre, P.; Rumble, J. Guidance to improve the scientific value of zeta-potential measurements in nanoEHS. Environ. Sci. Nano 2016, 3, 953–965. [Google Scholar] [CrossRef]
  38. Lee, J.-Y.; Yoon, J.-W.; Kim, C.-T.; Lim, S.-T. Antioxidant activity of phenylpropanoid esters isolated and identified from Platycodon grandiflorum A. DC. Phytochemistry 2004, 65, 3033–3039. [Google Scholar] [CrossRef]
  39. Dönmez, İ.E.; Hemming, J.; Willför, S. Bark Extractives and Suberin Monomers from Arbutus andrachne and Platanus orientalis. BioResources 2016, 11, 2809–2819. [Google Scholar] [CrossRef] [Green Version]
  40. Pisitsak, P.; Hutakamol, J.; Thongcharoen, R.; Phokaew, P.; Kanjanawan, K.; Saksaeng, N. Improving the dyeability of cotton with tannin-rich natural dye through pretreatment with whey protein isolate. Ind. Crops Prod. 2016, 79, 47–56. [Google Scholar] [CrossRef]
  41. Rattanaphani, S.; Chairat, M.; Bremner, J.B.; Rattanaphani, V. An adsorption and thermodynamic study of lac dyeing on cotton pretreated with chitosan. Dye. Pigment. 2007, 72, 88–96. [Google Scholar] [CrossRef]
  42. Souissi, M.; Guesmi, A.; Moussa, A. Valorization of natural dye extracted from date palm pits (Phoenix dactylifera) for dyeing of cotton fabric. Part 2: Optimization of dyeing process and improvement of colorfastness with biological mordants. J. Clean. Prod. 2018, 204, 1143–1153. [Google Scholar] [CrossRef]
  43. Phan, K.; Van Den Broeck, E.; Van Speybroeck, V.; De Clerck, K.; Raes, K.; De Meester, S. The potential of anthocyanins from blueberries as a natural dye for cotton: A combined experimental and theoretical study. Dye. Pigment. 2020, 176, 108180. [Google Scholar] [CrossRef]
  44. Farha, S.; Gamal, M.; Sallam, H.; Mahmoud, G.; Ismail, L.F.M. Sodium Edate and Sodium Citrate as an Exhausting and Fixing Agents for Dyeing Cotton Fabric with Reactive Dyes and Reuse of Dyeing Effluent. J. Am. Sci. 2010, 6, 109–127. [Google Scholar] [CrossRef]
  45. Zerin, I.; Foisal, A. Effect of Mordanting Process on Cotton Dyeing with Acacia catechu. In Proceedings of the 3rd Textile Research Conference (TRC), Dhaka, Bangladesh, 29 October 2016. [Google Scholar]
  46. Sun, S.-S.; Xing, T.; Tang, R.-C. Simultaneous Coloration and Functionalization of Wool, Silk, and Nylon with the Tyrosinase-Catalyzed Oxidation Products of Caffeic Acid. Ind. Eng. Chem. Res. 2013, 52, 8953–8961. [Google Scholar] [CrossRef]
  47. Baaka, N.; El Ksibi, I.; Mhenni, M.F. Optimisation of the recovery of carotenoids from tomato processing wastes: Application on textile dyeing and assessment of its antioxidant activity. Nat. Prod. Res. 2017, 31, 196–203. [Google Scholar] [CrossRef]
  48. Ghaheh, F.S.; Nateri, A.S.; Mortazavi, S.M.; Abedi, D.; Mokhtari, J. The effect of mordant salts on antibacterial activity of wool fabric dyed with pomegranate and walnut shell extracts. Color. Technol. 2012, 128, 473–478. [Google Scholar] [CrossRef]
  49. Dong, G.; Liu, H.; Yu, X.; Zhang, X.; Lu, H.; Zhou, T.; Cao, J. Antimicrobial and anti-biofilm activity of tannic acid against Staphylococcus aureus. Nat. Prod. Res. 2018, 32, 2225–2228. [Google Scholar] [CrossRef]
Figure 1. Extract concentrations (g/L) obtained from cork after extraction with NADES using a sealed system (0.7 g cork; 5 mL solvent; 100 °C; 6 h; three cycles using the sealed system).
Processes 11 00309 g001
Figure 2. (a) Total phenolic content in mg GA (gallic acid)/mg extract present in the extracts; (b) antioxidant activity, expressed by the percentage of DPPH radical capture, of the three extracts tested in a concentration range of between 50 mg/mL and 250 mg/mL.
Processes 11 00309 g002
Figure 3. Cell viability measured by MTT assay at 24 h (a) and 48 h (b) of culture. Cell viability (%) is shown for each condition and each time point. Data represent the mean value of three independent experiments, each in triplicate. (c) Death control refers to the control of minimal cell survival; the results were compared with the living control. The statistically significant differences were indicated: * significantly different from the living control (p ≤ 0.05); *** significantly different from lifetime control (p ≤ 0.0001); ns = no statistically significant differences with lifetime control.
Processes 11 00309 g003
Figure 4. Variation in particle size and PDI (a,b) and surface charge (c,d) over 60 days of cosmetic formulations: (a,c) formulation A with the three incorporated extracts (A1, A2, and A3); (b,d) formulation B with the three incorporated extracts (B1, B2, and B3).
Processes 11 00309 g004
Figure 5. (a) Creaming index (%), where * means no phase separation occurred (no creaming occurred) and (b) physical appearance of cosmetic formulations: formulation A with the three incorporated extracts (A1, A2, and A3) and formulation B with the three incorporated extracts (B1, B2, and B3).
Processes 11 00309 g005
Figure 6. Viscosity of the cosmetic formulations under study, evaluated through rheological studies: (a) formulation A with the three incorporated extracts (A1, A2, and A3) and (b) formulation B with the three extracts incorporated (B1, B2, and B3).
Processes 11 00309 g006
Figure 7. Antioxidant activity of cosmetic formulations after zero, 18, and 36 days: (a) formulation A with the three incorporated extracts (A1, A2, and A3) and (b) formulation B with the three extracts incorporated (B1, B2, and B3).
Processes 11 00309 g007
Figure 8. Transdermal permeation values (%) of the extracts through the cellulose acetate membrane and pig skin after 24 h when included into the cosmetic formulations under study: (a) Cellulose membrane (formulation A—control andwith the three incorporated extracts (A1, A2, and A3) and formulation B—control and with the three extracts incorporated (B1, B2, and B3)) and (b) pig skin (formulation A—control and with the three incorporated extracts (A1, A2, and A3) and formulation B—control and with the three extracts incorporated (B1, B2, and B3)).
Processes 11 00309 g008
Figure 9. (a) SEM of untreated cotton fabrics and (b) SEM of pre-treated fabrics with tannic acid and/or aluminum (mordant) and dyed with cork extracts E1 and E3 and control (extract obtained by extraction with water) (Images ×1500).
Processes 11 00309 g009
Figure 10. %DPPH reduced by fabrics dyed with cork extracts extracted with NADES 1, 2, 3, and water. Controls are fabrics pre-treated only with the NADES and water.
Processes 11 00309 g010
Table 1. NADES composition, molar ratio used for synthesis, water percentage, and abbreviation used for each eutectic mixture.
NADESComponents (HBD:HBA)Molar RatioWater (%)
1Processes 11 00309 i001
DL-Lactic Acid (LA)
Processes 11 00309 i002
Glycerol (GLY)
1:1≈11%
2Processes 11 00309 i003
DL-Lactic Acid (LA)
Processes 11 00309 i004
Glycine (GLYC)
5:1≈13%
3Processes 11 00309 i005
DL-Lactic Acid (LA)
Processes 11 00309 i006
Sodium Citrate (tribasic) (SC)
4:1≈31%
Table 2. Composition of commercial formulations used in the study.
Formulation AFormulation B
WaterWater
GlycerolGlycerol
Cetearyl alcoholCetearyl alcohol
Panthenol (B vitamin)Panthenol (vitamin B)
DimethiconeDimethicone
LanolinPhenoxyethanol
Glyceryl stearateGlyceryl stearate
Polyglyceryl-3 methyglucose distearateBenzyl alcohol
Decyl oleateLanolin
Lactic acidUrea
CoumarinEthylhexyl stearate
CitronellolCitronellol
ParfumCaprylic/Capric triglyceride
LinaloolCitric acid
Alpha-isomethyl iononeNiacinamide
Butylphenyl methylpropionalXanthan gum
GeraniolGeraniol
Hexyl cinnamalIsopropyl palmitate
Caprylyl glycol, decylene glycolParfum
Limonene
Sodium stearoyl glutamate
Caprylyl glycol, decylene glycol
Table 3. Nomenclature of developed cosmetic formulations.
ControlExtract 1Extract 2Extract 3
Formulation A: Moisturizer ATLAA1A2A3
Formulation B: Cien Urea 10%BB1B2B3
Table 4. Physicochemical properties of the NADES: molar ratio, melting point (m.p.), pH, density (ρ), viscosity (η), conductivity (σ), refraction index (nD), and polarity (ENR). Experimental and computational measurements were performed at 25 °C.
NADESRatiom.p.
(°C)
pHρ (g/mL)
(MD)
η (Pa.s)
(MD)
σ (μS.cm−1)nDENR (kcal/mol)
(λ nm)
Surface Tension
(mN/m)
11:1<−500.91.24
(1.19)
1.0
(0.295)
0.91.45748.542
(589)
44.210
25:1522.3 (a)1.23 (a)0.081 (a)1548 (a)1.438 (a)48.500 (a)44.003 (a)
34:1−124.01.3910.1 (b)346.8 (b)1.43850.612
(565)
45.877 (c)
pH, ρ, η, σ, and nD were evaluated at 25 °C. MD corresponds to the molecular dynamic simulation results. (a) Addition of water (to allow liquid handling): NADES 2 ≈ 13%. (b) Addition of water (to allow liquid handling): NADES 3 = 12.6%. (c) Addition of 20% of water in NADES 3.
Table 5. Transdermal permeation values (%) through cellulose acetate membrane and pig skin for E1, E2, and E3 extracts over 24 h.
%Permeation
Cellulose Acetate MembranePig Skin
1 h2 h4 h8 h24 h1 h2 h4 h8 h24 h
Extract E10.440.3133.3465.3066.364.145.975.976.016.09
Extract E200067.6067.600.250.881.552.593.63
Extract E317.2122.8341.3041.3041.302.193.373.803.984.66
Table 6. Organoleptic properties of the formulations containing the cork extracts after 90 days of storage at different temperatures: 4, 22 and 37 °C. H: homogeneous solution; S-: some surface separation (a small amount of transparent liquid forms on the surface); S: evident phase separation; N: normal, similar to the control; M: total modification of samples compared to control. Control: creams without addition of extracts; A1, B1: creams with extracts obtained with lactic acid:glycerol; A2, B2: creams with extracts obtained with lactic acid:glycine; A3, B3: creams with extracts obtained with lactic acid:sodium citrate.
ColorOdorAppearancepH
4 °C22 °C37 °C4 °C22 °C37 °C4 °C22 °C37 °C
Control ANormalNormalHomogeneous6–7
A1NNNNNNHHH6–7
A2NNNNNMS-S-S-5
A3NNMNMMSSM4–5
Control BNormalNormalHomogeneous7
B1NNMNNMHHM7
B2NNMNNMHHM5
B3NNNNNNHHH5–6
Table 7. Images and K/S of fabrics dyed with cork extracts obtained by extraction with the three extracts, E1 (extracted with NADES 1), E2 (extracted with NADES 2), and E3 (extracted with NADES 3), and with water (control), using four different pre-treatment methods (with and without tannic acid and with and without mordant).
E1K/SE2K/SE3K/SControlK/S
Without tannic acid + without mordantProcesses 11 00309 i0070.56Processes 11 00309 i0080.85Processes 11 00309 i0092.43Processes 11 00309 i0101.60
Without tannic acid + mordantProcesses 11 00309 i0110.55Processes 11 00309 i0120.73Processes 11 00309 i0131.21Processes 11 00309 i0141.68
Tannic acid + mordantProcesses 11 00309 i0152.56Processes 11 00309 i0160.92Processes 11 00309 i0171.92Processes 11 00309 i0181.50
Tannic acid + without mordantProcesses 11 00309 i0191.38Processes 11 00309 i0200.74Processes 11 00309 i0211.26Processes 11 00309 i0221.17
Table 8. Antimicrobial activity, expressed as inhibition zone (mm), of the cotton fabrics dyed with extract E1 and E3. Controls are raw cotton samples without dyeing with extracts.
E1 (Cork Extract + NADES 1)E3 (Cork Extract + NADES 3)
E. coliS. aureusE. coliS. aureus
Without tannic acid + without mordantProcesses 11 00309 i023Processes 11 00309 i024Processes 11 00309 i025Processes 11 00309 i026
Inhibition zone0 mm0 mm14 mm12 mm
Tannic acid + mordantProcesses 11 00309 i027Processes 11 00309 i028Processes 11 00309 i029Processes 11 00309 i030
Inhibition zone12 mm11 mm15 mm15 mm
Tannic acid + without mordantProcesses 11 00309 i031Processes 11 00309 i032Processes 11 00309 i033Processes 11 00309 i034
Inhibition zone10 mm13 mm0 mm0 mm
ControlsProcesses 11 00309 i035Processes 11 00309 i036Processes 11 00309 i037Processes 11 00309 i038
Inhibition zone0 mm0 mm0 mm0 mm
Disclaimer/Publisher’s Note: The statements, opinions and data contained in all publications are solely those of the individual author(s) and contributor(s) and not of MDPI and/or the editor(s). MDPI and/or the editor(s) disclaim responsibility for any injury to people or property resulting from any ideas, methods, instructions or products referred to in the content.

