Article

Simulation and Experiment on Elimination for the Bottom-Sitting Adsorption Effect of a Submersible Based on a Submerged Jet

1
China Ship Scientific Research Center, Wuxi 214082, China
2
Taihu Laboratory of Deepsea Technological Science, Wuxi 214082, China
3
Qingdao Ship Researching Deep Sea Technology Co., Ltd., Qingdao 266520, China
*
Author to whom correspondence should be addressed.
Processes 2023, 11(12), 3452; https://doi.org/10.3390/pr11123452
Submission received: 24 October 2023 / Revised: 13 December 2023 / Accepted: 16 December 2023 / Published: 18 December 2023
(This article belongs to the Special Issue Risk Assessment and Reliability Engineering of Process Operations)

Abstract

:
When a submersible is sitting on a seabed, it could lose buoyancy because of the bottom-sitting adsorption effect. In this article, a numerical calculation model and experimental scheme for eliminating the bottom-sitting adsorption effect of under-sea equipment were established. An analysis of the hydrostatic pressure variation on a submersible’s bottom was carried out, and a submerged water jet which was based on the method of soil liquefaction was proposed to solve the problem of reducing hydrostatic pressure. It was shown that a water jet could liquefy soil to restore hydrostatic pressure on the submersible’s bottom, and there was an optimal jet velocity to form the largest liquefied soil thickness. A rectangular pulsed jet was the best way to liquefy soil in terms of efficiency and the liquefaction degree, which can be seen from the calculation of the two-dimensional two-phase flow. Through the calculation of the three-dimensional two-phase flow, it was found that the soil liquefaction developed from the periphery to the center, and a variation in jet liquefaction with the top wall constraint was obtained. Finally, an experiment was carried out to prove that a submerged water jet could eliminate the bottom-sitting adsorption effect of a submersible. The results showed that the submerged jet was an efficient way to liquefy soil, and a submersible could quickly recover hydrostatic pressure on the bottom and refloat up independently.

1. Introduction

With the significant investment of manned submersibles in various countries, the technology of manned deep diving has been greatly developed. The deep-sea manned submersible often needs to be manually operated to sit on the seabed after entering the deep-sea operation area to facilitate the manipulator using relevant tools for subsea operations. However, the bottom-sitting operation of a manned submersible also brings great risks. When a manned submersible has sat on a soft seabed, the impact force and top hydraulic head of the water may cause the submersible to sink into the soft sediment and lose buoyancy [1]. Therefore, the bottom operation of manned submersibles has great risk. According to this problem, special technology should be developed. At present, a water jet is a relatively potential technological approach. A high-pressure water jet is usually used to spray down the pipe, during the process of offshore oil exploitation. When the jack-up platform needs to pull up the pile shoe to leave the operation area after the drilling operation, the pressure alternating water jet will be used to assist the pile pulling operation.
At present, the research contents of domestic and foreign scholars in related fields mainly focus on the mechanism study of the influence of hydraulic jetting technology on soil, as well as the analysis of the influence effect of hydraulic jetting technology in the process of pulling piles of jack-up platforms. Momber [2] used SEM to describe the erosion of a high-speed water jet to soil and the destruction of soil. Yahiro [3] studied the potential flow theory of water jets and gave the radial pressure distribution relationship of water jets. Zhang [4] proposed a numerical model considering the soil rheological properties to investigate the mixing process of high-pressure jet-cutting clay, based on the Herschel–Bulkley and soil logarithmic models. Shen [5] proposed a cavitation phenomenon, the hydrodynamic pressure impact effect, the water jet pulse effect and the water wedge effect in the study of a soil-breaking mechanism with a high-pressure water jet. Britta Bienen et al. [6] conducted relevant experimental studies on the pile pulling efficiency of a jack-up platform based on hydraulic injection technology, and the analysis results showed that hydraulic injection technology could effectively reduce the adsorption force and pulling resistance of pile boots. Maliheh Karamigolbaghi et al. [7] conducted experimental and analytical studies on the erosion effect of hydraulic jet technology on cohesive soil and verified the rationality of the three calculation theories proposed based on the experimental results. Larissa de Brum Passini et al. [8] studied the soil breaking mechanism of a water jet based on the pipe under the jet and found that the liquefaction range of soil in the jet process was not affected by the initial density of the soil. Mazurek and Clark et al. [9,10,11] analyzed the empirical relationship of the clay surface erosion of a water jet due to the aspects of the flow rate, spray distance and critical shear stress of clay. Raie et al. [12] equalized the liquefied clay to a fluid model and verified the feasibility of this analytical method.
Wang et al. [13] encountered a problem in lifting jack-up platform pile boots due to the adsorption effect and excessive upward resistance in the Gulf of Guinea in West Africa. They solved the problem by using high-and-low-alternating-pressure water jet technology to liquefy the sediment. This engineering experience also provides a technical reference for the elimination of the bottom-sitting adsorption effect. Wang et al. [14,15] simulated the clay as viscous fluid and analyzed the effects of the jet velocity, spray distance and soil undrained shear strength on the actual jetting. Chen et al. [16] also proposed the idea of using a high-pressure water jet to remove the adsorption effect of pile boots for a jack-up platform. M. M. L. Chee [17] studied the cleaning evolution of a thick viscoplastic soil layer by water jets, which is similar to the process of soil liquefaction. Xu et al. [18] conducted an experimental study on the liquefaction of seabed sediment. The liquefaction of soil is related to the pore pressure. When the pore pressure of soil increased to a critical value because of water disturbance, the soil liquefied and lost effective stress. The conclusion has reference value for how to estimate soil liquefaction. Ahmed Ibrahim [19] studied a continuum-based approach to model particulate soil–water interactions and gave a model of the internal fluidization of a sand bed due to an upward water jet. Zhang et al. [20] studied the effect of soil liquefaction on the bearing capacity of suction anchors and found that when the soil liquefied, the suction anchors would fail completely. The adsorption effect of the suction anchor is similar to the bottom-sitting adsorption effect of a manned submersible. This experimental conclusion can confirm that the adsorption effect can be destroyed after the soil is liquefied and reconstruct positive buoyancy.
Due to the poor stability of undersea seabed sediment, the buoyancy of a manned submersible was reduced, which was caused by the bottom-sitting adsorption effect during the bottom operation. For this engineering demand, a study on the elimination of the bottom-sitting adsorption effect of a submersible based on a water jet was carried out. This paper proposed the hypothesis of eliminating the adsorption effect of a submersible that was sitting on sediment based on the water jet technology and analyzed the causes of the bottom-sitting adsorption effect. A two-phase fluid calculation domain model was constructed using the Herschel–Bulkley model, the effect of the water jet on soil liquefaction was calculated and analyzed and a similar experiment was made to further verify the analysis conclusions. The results of the simulations and experiment showed that this hypothesis was reasonable and feasible, and a rectangular pulsed jet may be the best way to liquefy soil to eliminate the adsorption effect. This conclusion is also applicable to other deep-sea bottom-sitting equipment regarding how to efficiently eliminate the bottom-sitting adsorption effect when moving underwater equipment. In addition, if the resistivity measurement method could be used to further upgrade the experiment, the real-time monitoring of the change in the water content in the bottom soil would be carried out to clearly express the law of soil liquefaction.
The rest of the paper is organized as follows: the analysis and calculation theory of the bottom-sitting adsorption effect is developed in Section 2. Section 3 presents the computational analysis of two-dimensional water jets to eliminate the bottom-sitting adsorption effect of a submersible. Section 4 introduces the calculation and analysis of a three-dimensional water jet to eliminate the bottom-sitting adsorption effect of a submersible. The experimental verification of a submerged water jet to eliminate the adsorption effect of a submersible and the conclusions are given in Section 5 and Section 6, respectively.

2. Methods

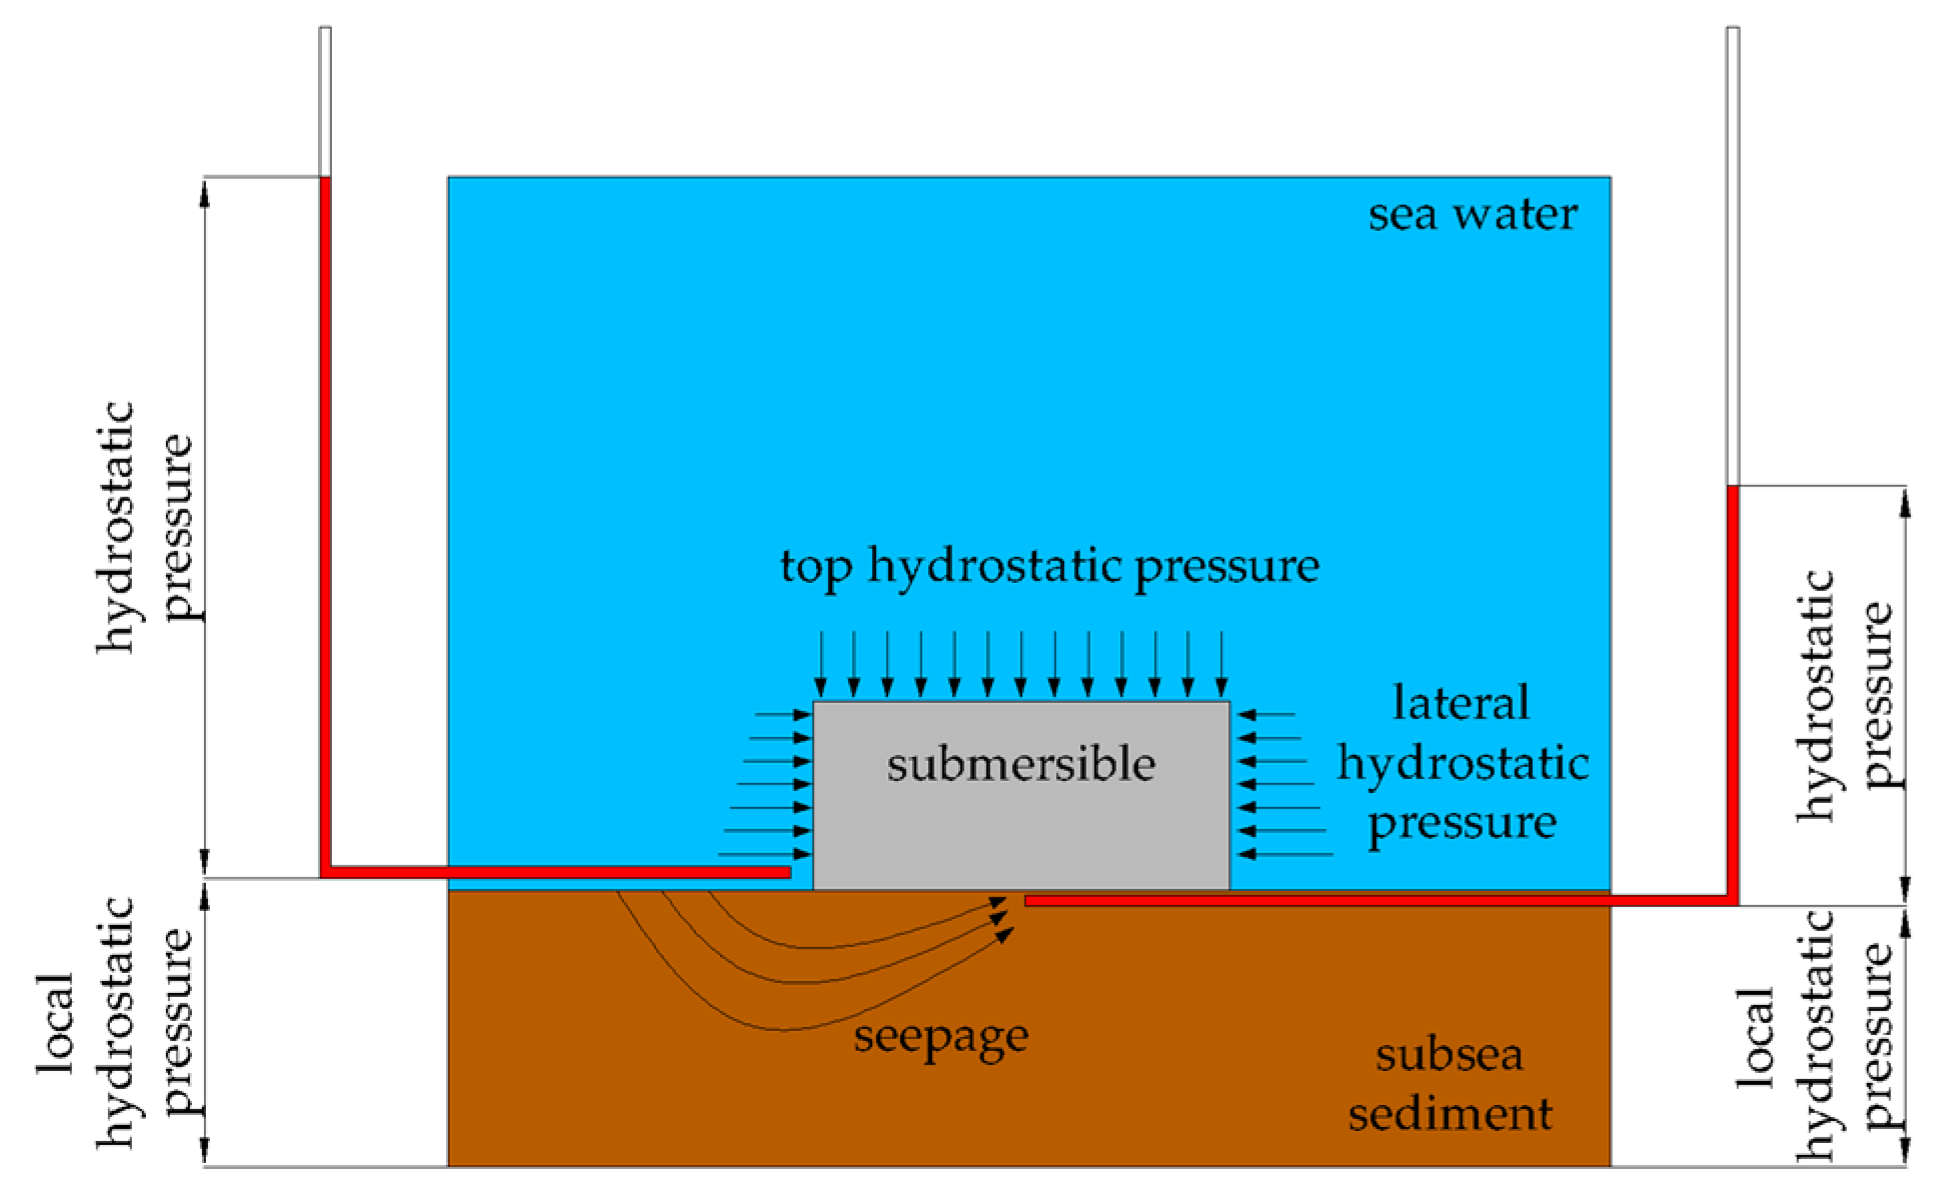
2.1. Analysis of the Bottom-Sitting Adsorption Effect

The reason for the physical phenomenon of the bottom-sitting adsorption effect is a key issue in eliminating the bottom-sitting adsorption effect. Water would lose mobility and some of the hydraulic head because of osmotic resistance and bound water when water infiltrates the subsea sediment. The main causes include the coefficient of viscosity of the water and the physical parameters of the soil such as the particle size, pore ratio and mineral composition.
A model of a submersible sitting on a seabed is shown in Figure 1. When the submersible sat on the seabed, it was surrounded by hydrostatic pressure. The hydrostatic pressure difference between the top and bottom is an important factor of the bottom-sitting adsorption effect. Normally, the hydrostatic pressure on the bottom is higher than that on the top; this is the reason why the buoyancy of a submersible could occur. However, the hydrostatic pressure on the bottom would reduce due to the seepage effect of the seabed soil, when a submersible is sitting on the seabed. It is possible that the hydrostatic pressure on the bottom is lower than that on the top. Therefore, the buoyancy of the submersible would disappear, and the bottom-sitting adsorption effect would occur.
The main cause of the bottom-sitting adsorption effect is a decline in hydrostatic pressure on the bottom. A water jet can change the soil structure and pore pressure and then accelerate soil liquefaction to restore hydrostatic pressure on the bottom of the submersible. In addition, the accumulation of a water jet near the bottom will increase the pressure in the cavity under the bottom of the submersible, which will intensify the instability of the bottom-sitting adsorption effect. In order to prove this analysis, the development process of the water jet and the soil liquefaction law should be analyzed.

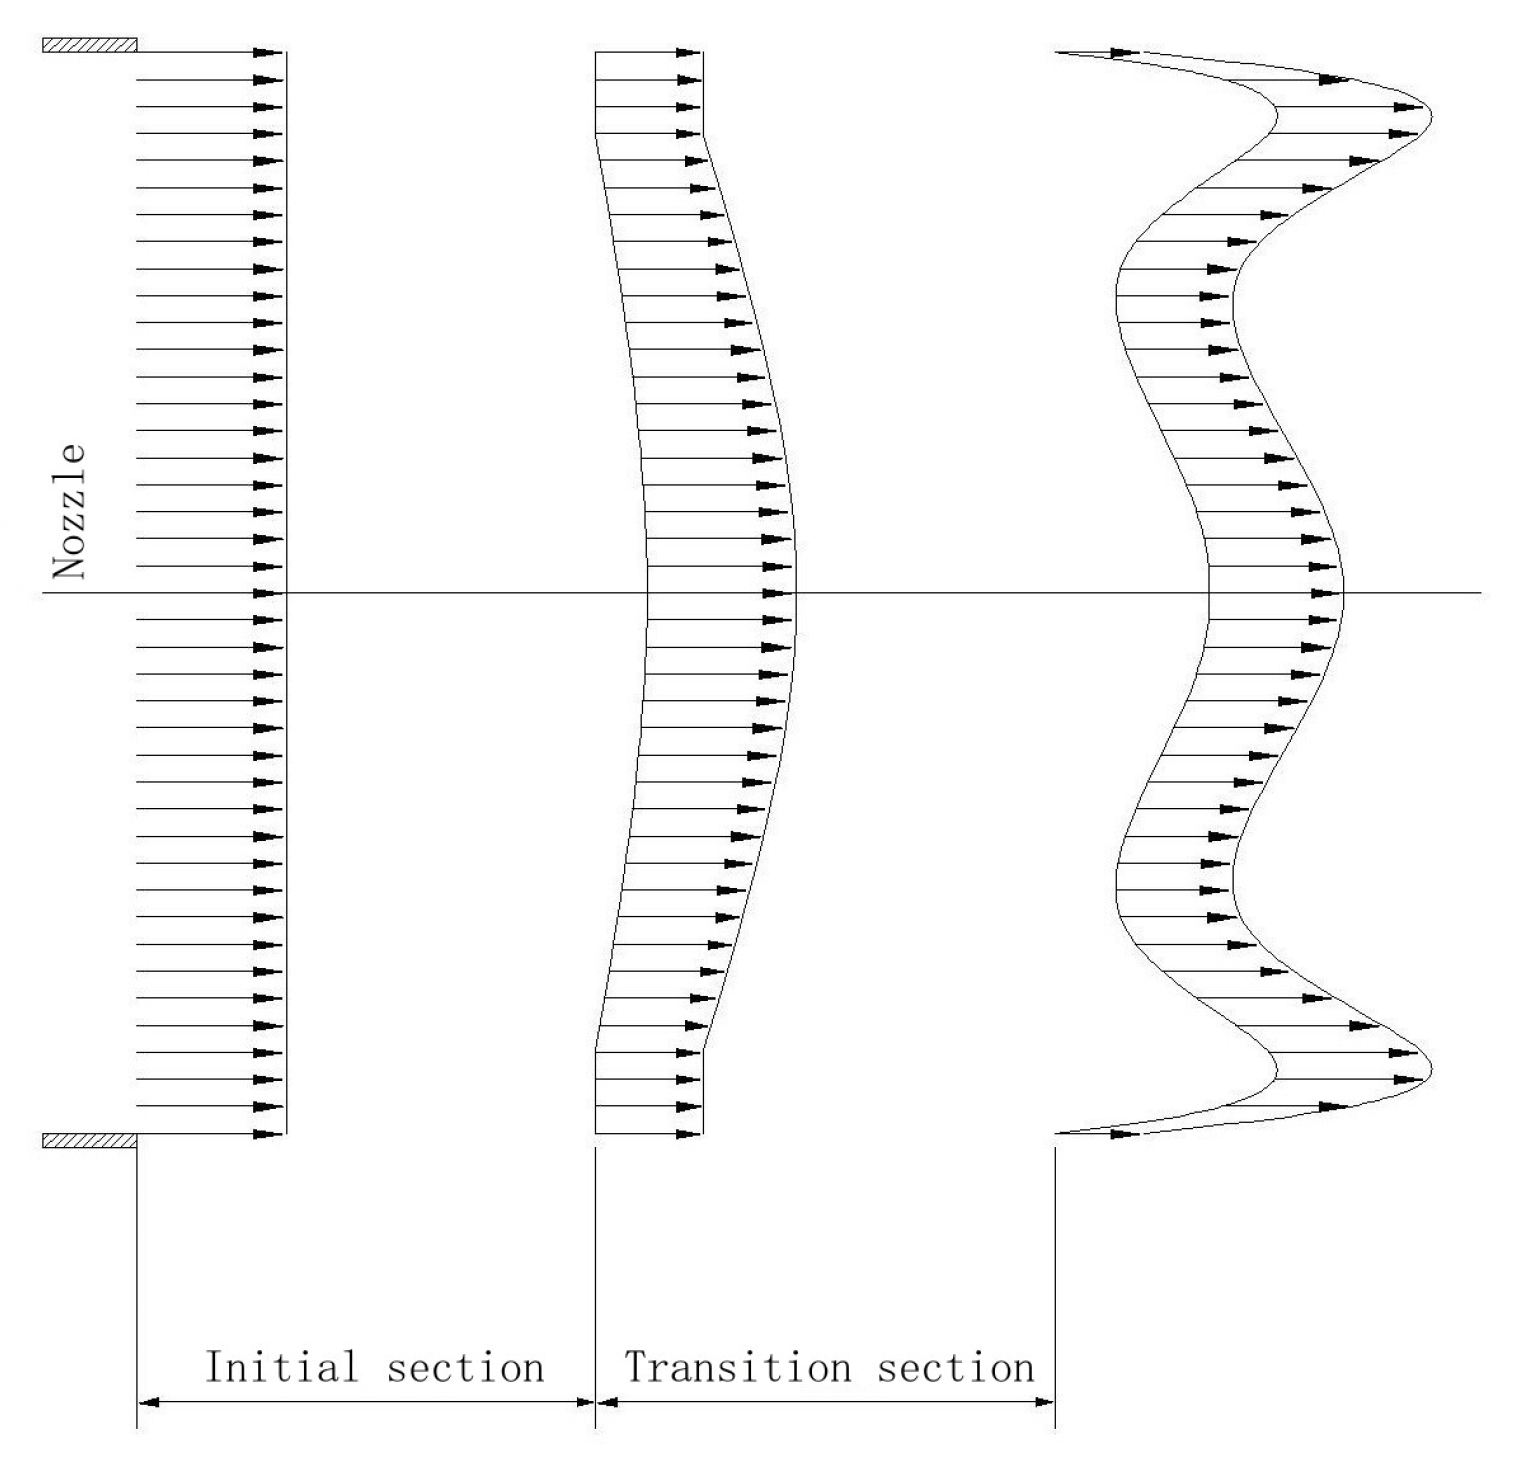
2.2. Turbulent Flow Calculation Model and Jet Pattern

The water jet is a typical turbulent flow model which is controlled by a mass conservation equation, a momentum equation and an energy conservation equation. That caused by water can be assumed to be an incompressible fluid, and the mass conservation equation can be simplified as:
u i = 0
where u i is the velocity component in one direction.
The conservation of momentum is usually modelled using the equations of motion; it is called the Navier–Stokes equation. Without accounting for mass forces, the Reynolds equation is established by introducing time-averaged and instantaneous velocity terms based on the tensor expression form.
1 ρ p ¯ x i + ν 2 u ¯ i x j u i u j ¯ = x j u ¯ i u ¯ j
where u i is the velocity component in one direction, u n w a l l = 0 , ρ is the density, p is the pressure and ν is the kinematic viscosity coefficient.
Based on the Reynolds equation, the instantaneous energy equation of turbulent flow can be simplified, without accounting for mass forces and compressibility.
t u i u i 2 = x j u j p ρ + u i u j 2 + ν x j u i u i x j + u j x i ν u i x j + u j x i u i x j
The main control parameters of a water jet include the driving pressure, jet velocity, jet type, etc. In order to eliminate the bottom-sitting adsorption effect of a submersible, the jet parameters need to be controlled to accelerate the liquefaction of soil and then to restore the buoyancy of a submersible. According to the existing analysis, the jet velocity and jet type are considered to be the main control parameters. The water jet type can be classified as continuous, pulsed or mixed which were shown in Figure 2 [5].

2.3. Soil Liquefaction Law and Soil Rheology Calculation Model

According to a previous analysis, the main characteristics of sea floor sediment are being particulate, being viscous and having a high content of pore water; this kind of sediment was usually in the saturated state and could be easily liquefied by an external disturbance within a short time. If the sediment under a submersible bottom was liquefied in a specific way, the adsorption effect of a submersible could be eliminated.
When the saturated sediment was disturbed by vibration or another interference factor, the internal pore water could not be removed in time, and the pore water pressure increased continuously; then, the sediment would lose the effective stress and shear strength, and liquefaction would occur. The important factors for estimating sediment liquefaction are the pore pressure and water content [21,22,23]. A higher pore water pressure between sediment particles is an important factor and an indicator of soil liquefaction [24]. But the pore pressure between soil particles was difficult to obtain in the numerical calculation process; however, there is a certain positive correlation between the pore pressure and water content of the soil medium. When the water content reached a certain level, it could be assumed that the shear strength of the soil had disappeared, and liquefaction occurred.
Besses et al. showed that the hydrodynamic properties of clay can be represented by the Herschel–Bulkley model [25]. Wang et al. treated clay as a viscous fluid in the course of their research on the break-up mechanism of clay jets [12]. The computational ideas for carrying out soil rheological analysis provided a theory of reference. The Herschel–Bulkley model in computational fluid dynamics is shown in Figure 3 and can be represented as [14]:
τ = τ 0 + k γ n γ > γ 0 τ = τ 0 2 γ γ 0 γ 0 + k 2 n + n 1 γ γ 0 γ γ < γ 0
where τ 0 is the yield stress; γ 0 is the yield shear strain rate corresponding to the yield stress τ 0 ; τ is the shear strength; γ is the shear strain rate; k is the consistency factor and n is the power exponent.

3. Calculation and Analysis

By analyzing the causes of the bottom sitting adsorption effect, it was considered that buoyancy could be restored by liquefying the soil under the bottom of the submersible. A series of calculations had been carried out to further illustrate the accuracy of this assumption.

3.1. Two-Dimensional Water Jet Calculation Model

In order to reveal the mechanics of whether water jets can eliminate the bottom-sitting adsorption effect of a submersible, a two-dimensional calculation was first carried out. Through computational iterations, the final design of the 2D computational model was determined, as shown in Figure 4. A square wall condition was established to simulate the submersible’s boundary, while a two-phase medium model of water and soil was constructed to simulate the physical state of the seabed sediment. There were four horizontal nozzles under the bottom of the submersible, The nozzles at different positions were used to analyze the specific jet characteristic, which would be used to guide the three-dimensional calculation and test design. The local area meshing at the nozzles is shown in Figure 5.
CFD software (Fluent 2022) was used to build a fluid calculation model, and appropriate models and parameters were selected to verify the correctness of the simulation method. Considering that the sediment is viscous fluid [26], the Navier–Stokes equation is solved by the VOF method, and the k-ε RNG equation is applied. The parameters used in the calculation are shown in Table 1 [14].

3.2. Continuous Jet Calculation of a Two-Dimensional Water Jet

The calculation of a continuous jet was carried out to clarify the law of a horizontal jet in liquefied soil. As can be seen from Figure 6, the water jet was an effective method for liquefying soil, and soil liquefaction is distributed in layers. The flow channel was first connected near the submersible’s bottom; then, hydrostatic pressure was restored fully because of the wall boundary effect. Water jets that were near the submersible’s side diffused upward along the wall, and other ones located in the center diffused horizontally. Combined with Figure 7 and Figure 8, it can be seen that during the continuous development of the water jet, some of the jet provided a rotating vector which could disturb the sediment, causing liquefaction. Because of the concentration of the jet energy, most of the jet vector still had a steady velocity potential and developed along the submersible’s bottom. This part of the energy promoted the forward development of the jet, and then the water jet would enter into open waters by breaking through the submersible’s bottom constraint. The hydrostatic pressure under the submersible’s bottom would be restored eventually.
To further compare the liquefaction capacity of different jet velocities, different jet velocities were calculated, and the results are shown in Figure 9. The results showed that the thickness of the water film under the bottom of the submersible tended to decrease in relation as the jet velocity increased. The liquefied soil thickness reached the maximum when the jet velocity was 8 m/s. As the jet velocity increased, the crossflow along the bottom of the submersible became more obvious to reduce the water film thickness. The rotating vector was variable as the jet velocity increased, and when the jet velocity reached an optimum value, the disturbance ability of the jet was the strongest and the liquefied soil thickness was the largest.

3.3. Pulsed Jet Calculation of a Two-Dimensional Water Jet

According to the above analysis, it was found that the continuous jet could liquefy soil, but its disturbance capacity was limited. In order to increase the disturbance ability of the jet and improve the liquefaction efficiency, the pulsed jet calculation was carried out on the basis of the original two-dimensional calculation model. Through analysis, it is concluded that the sinusoidal pulsed jet and the rectangular pulsed jet can not only show the stability in a short time, which was beneficial in forming water film under the submersible’s bottom, but also had a certain pulse energy, which improved the disturbance ability. Therefore, the two types of jets were analyzed, and the jet types are shown in Figure 10 and Figure 11.
The velocity of the pulse jet was controlled from 1.97 m/s to 3.94 m/s, and the maximum velocity was consistent with that of the continuous jet. Figure 12 and Figure 13 show the two-phase distribution caused by the two pulse jets with a circulation period of 4 s, and Figure 14 shows the thickness of the water film and liquefied soil of different jet types. It can be seen that the rectangular pulsed jet produced a max thickness of the water film and liquefied soil because it has a stable jet energy and disturbance ability, which is beneficial for liquefying soil under the submersible’s bottom.

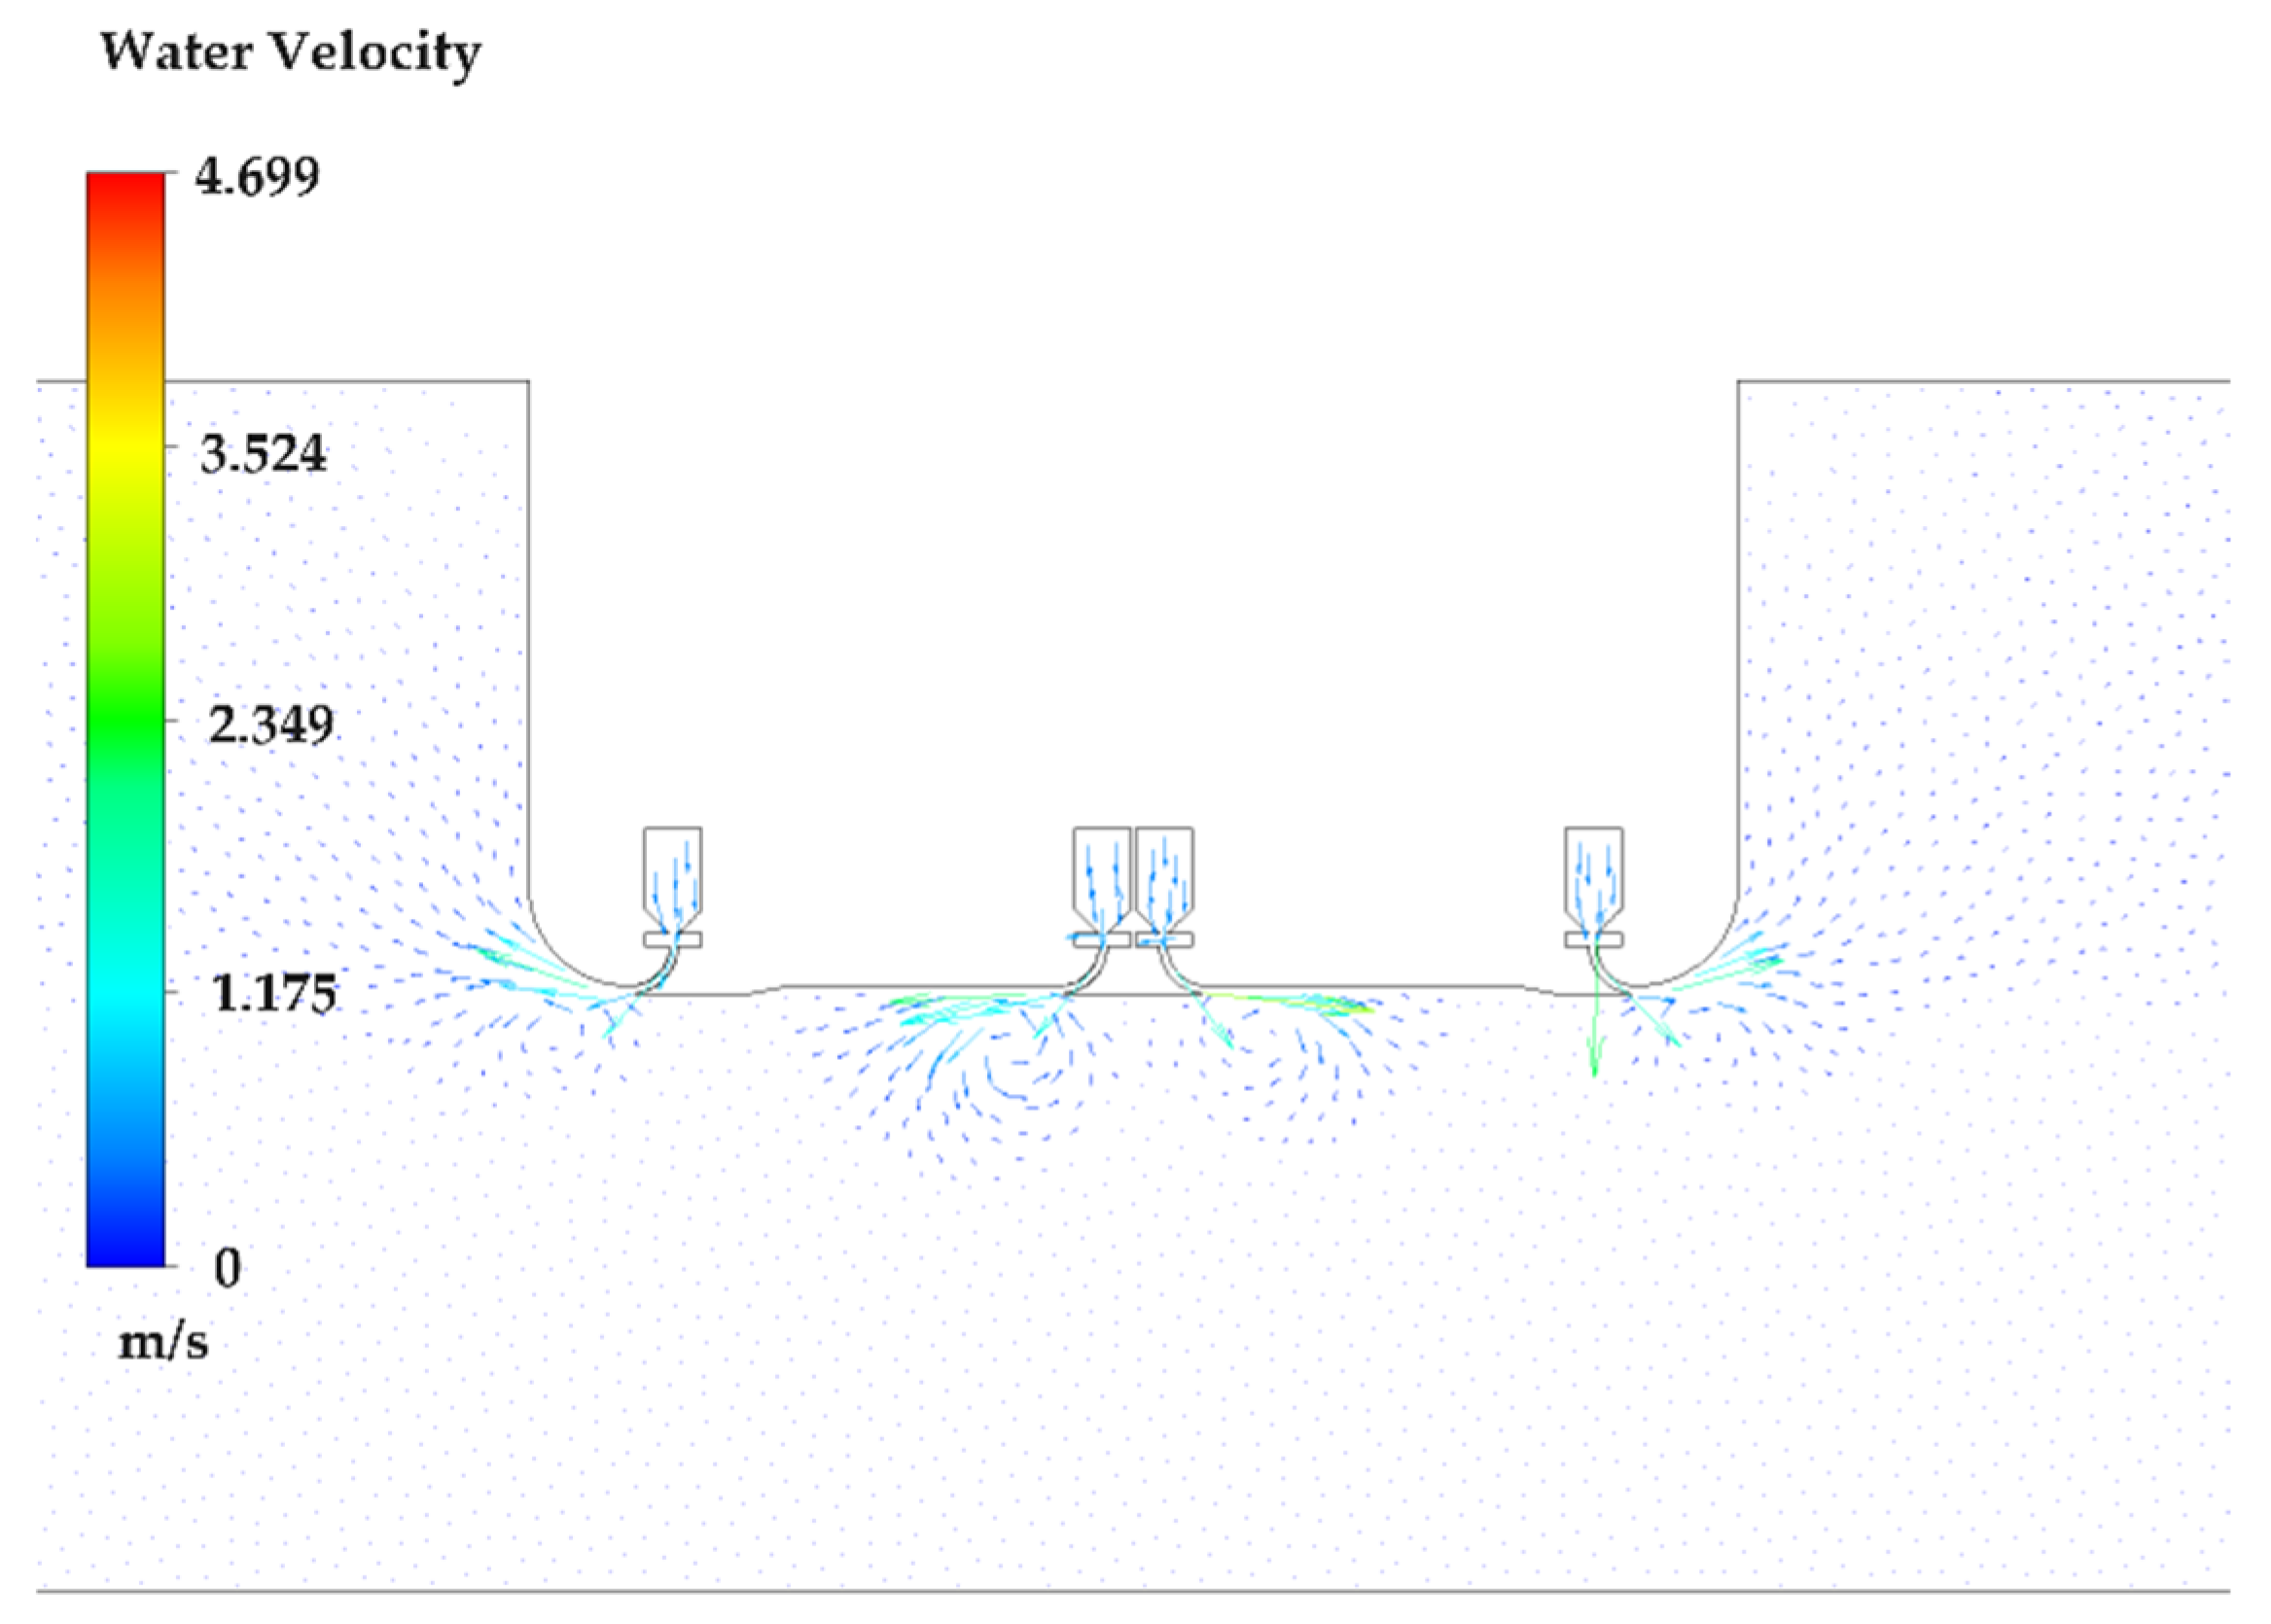
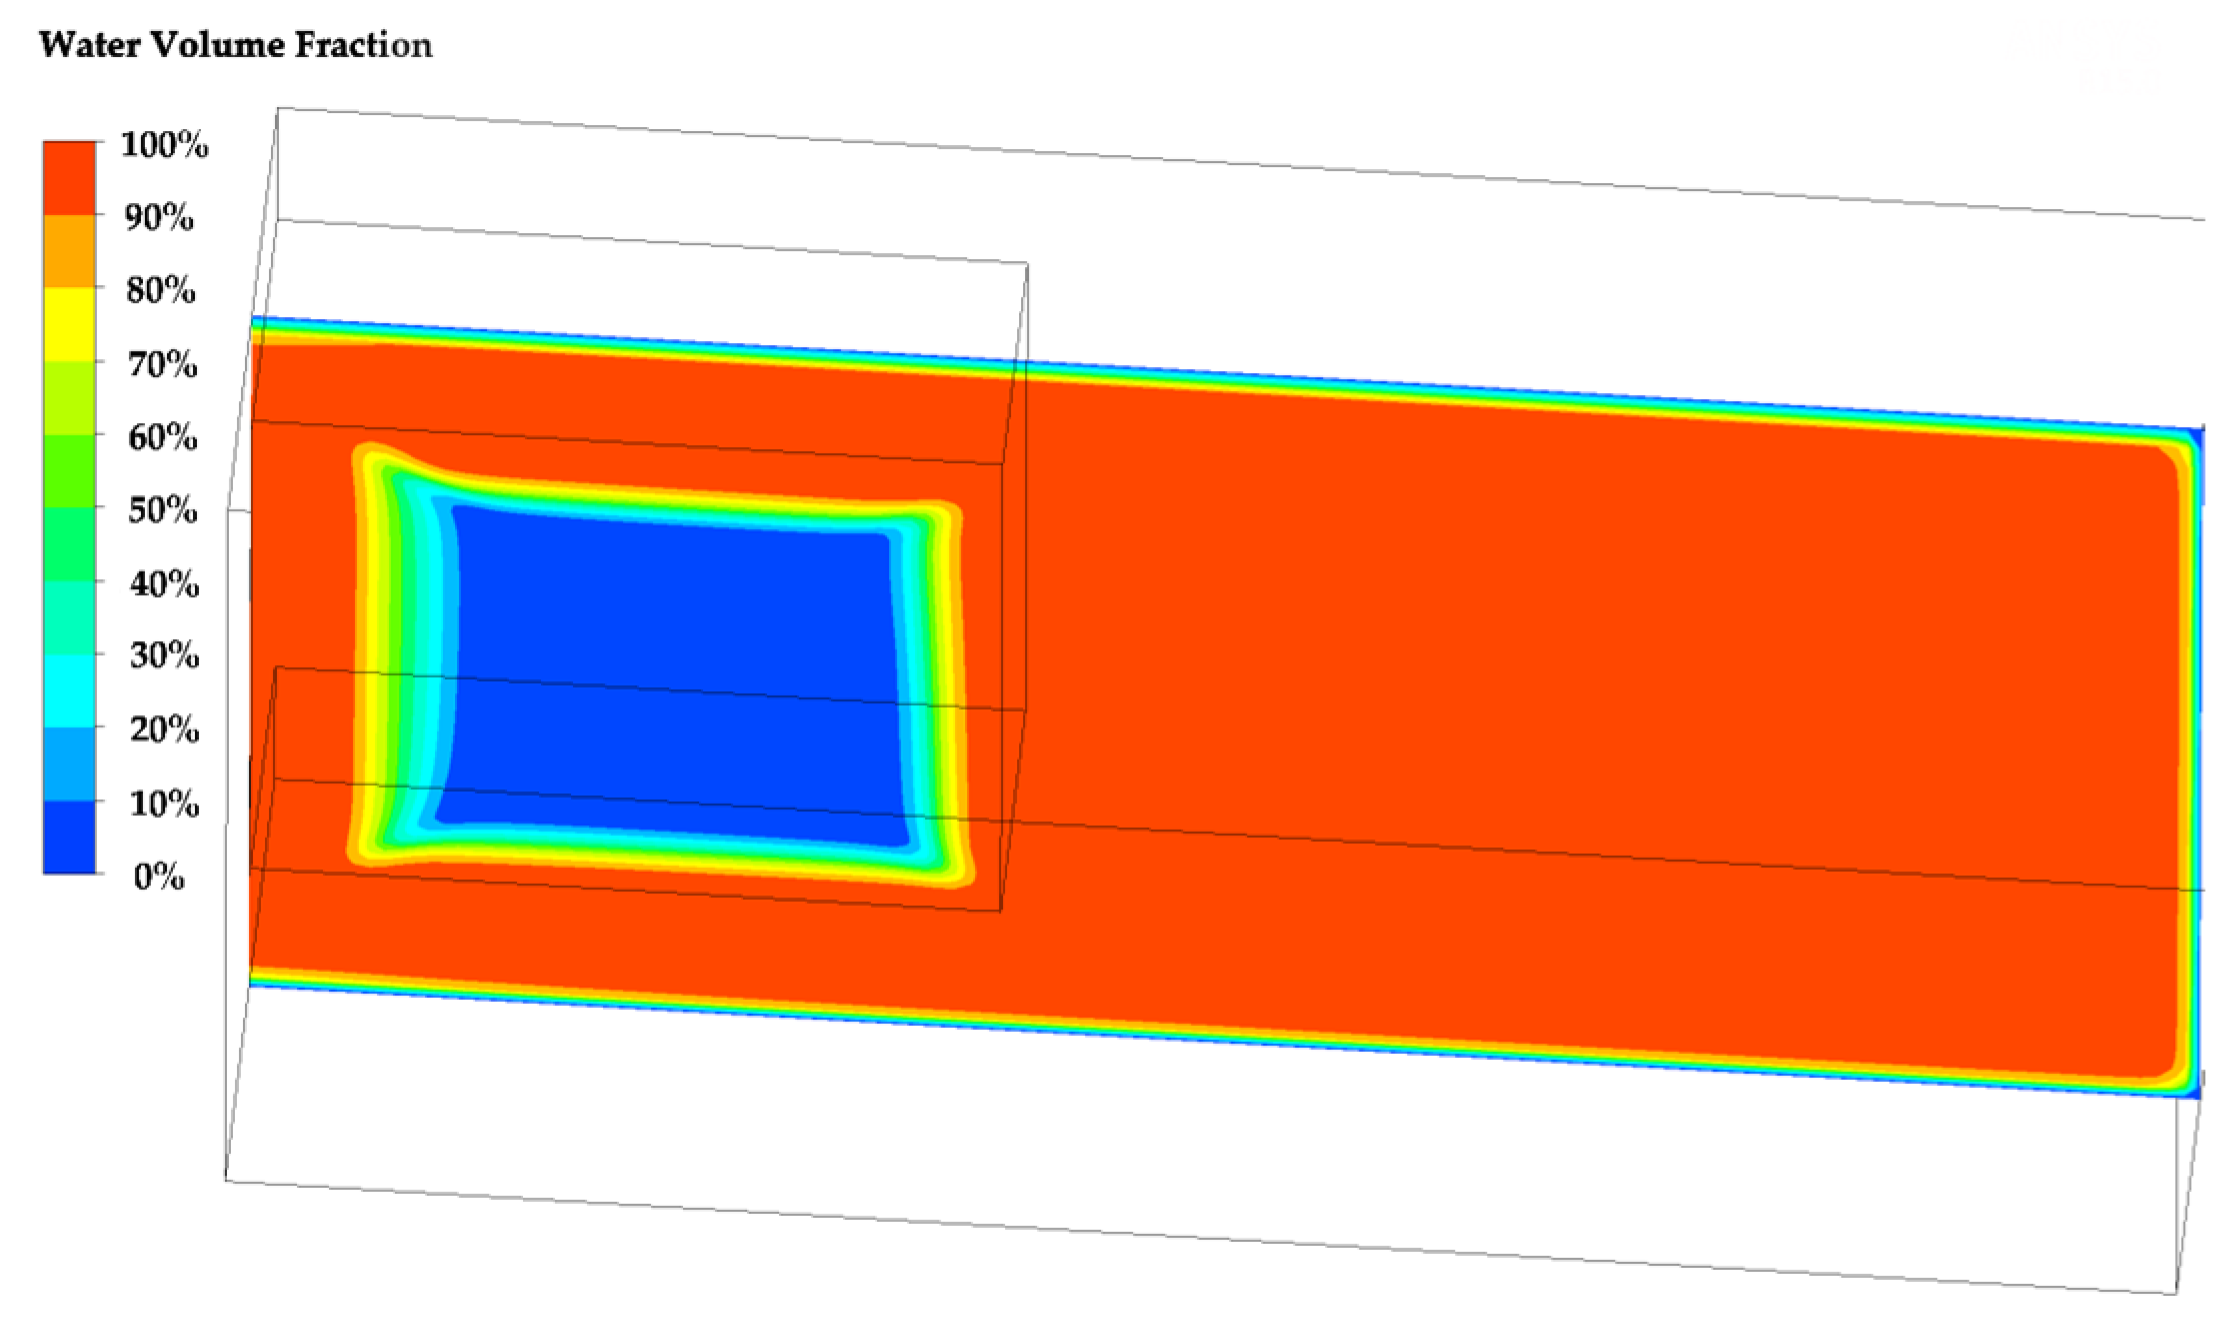
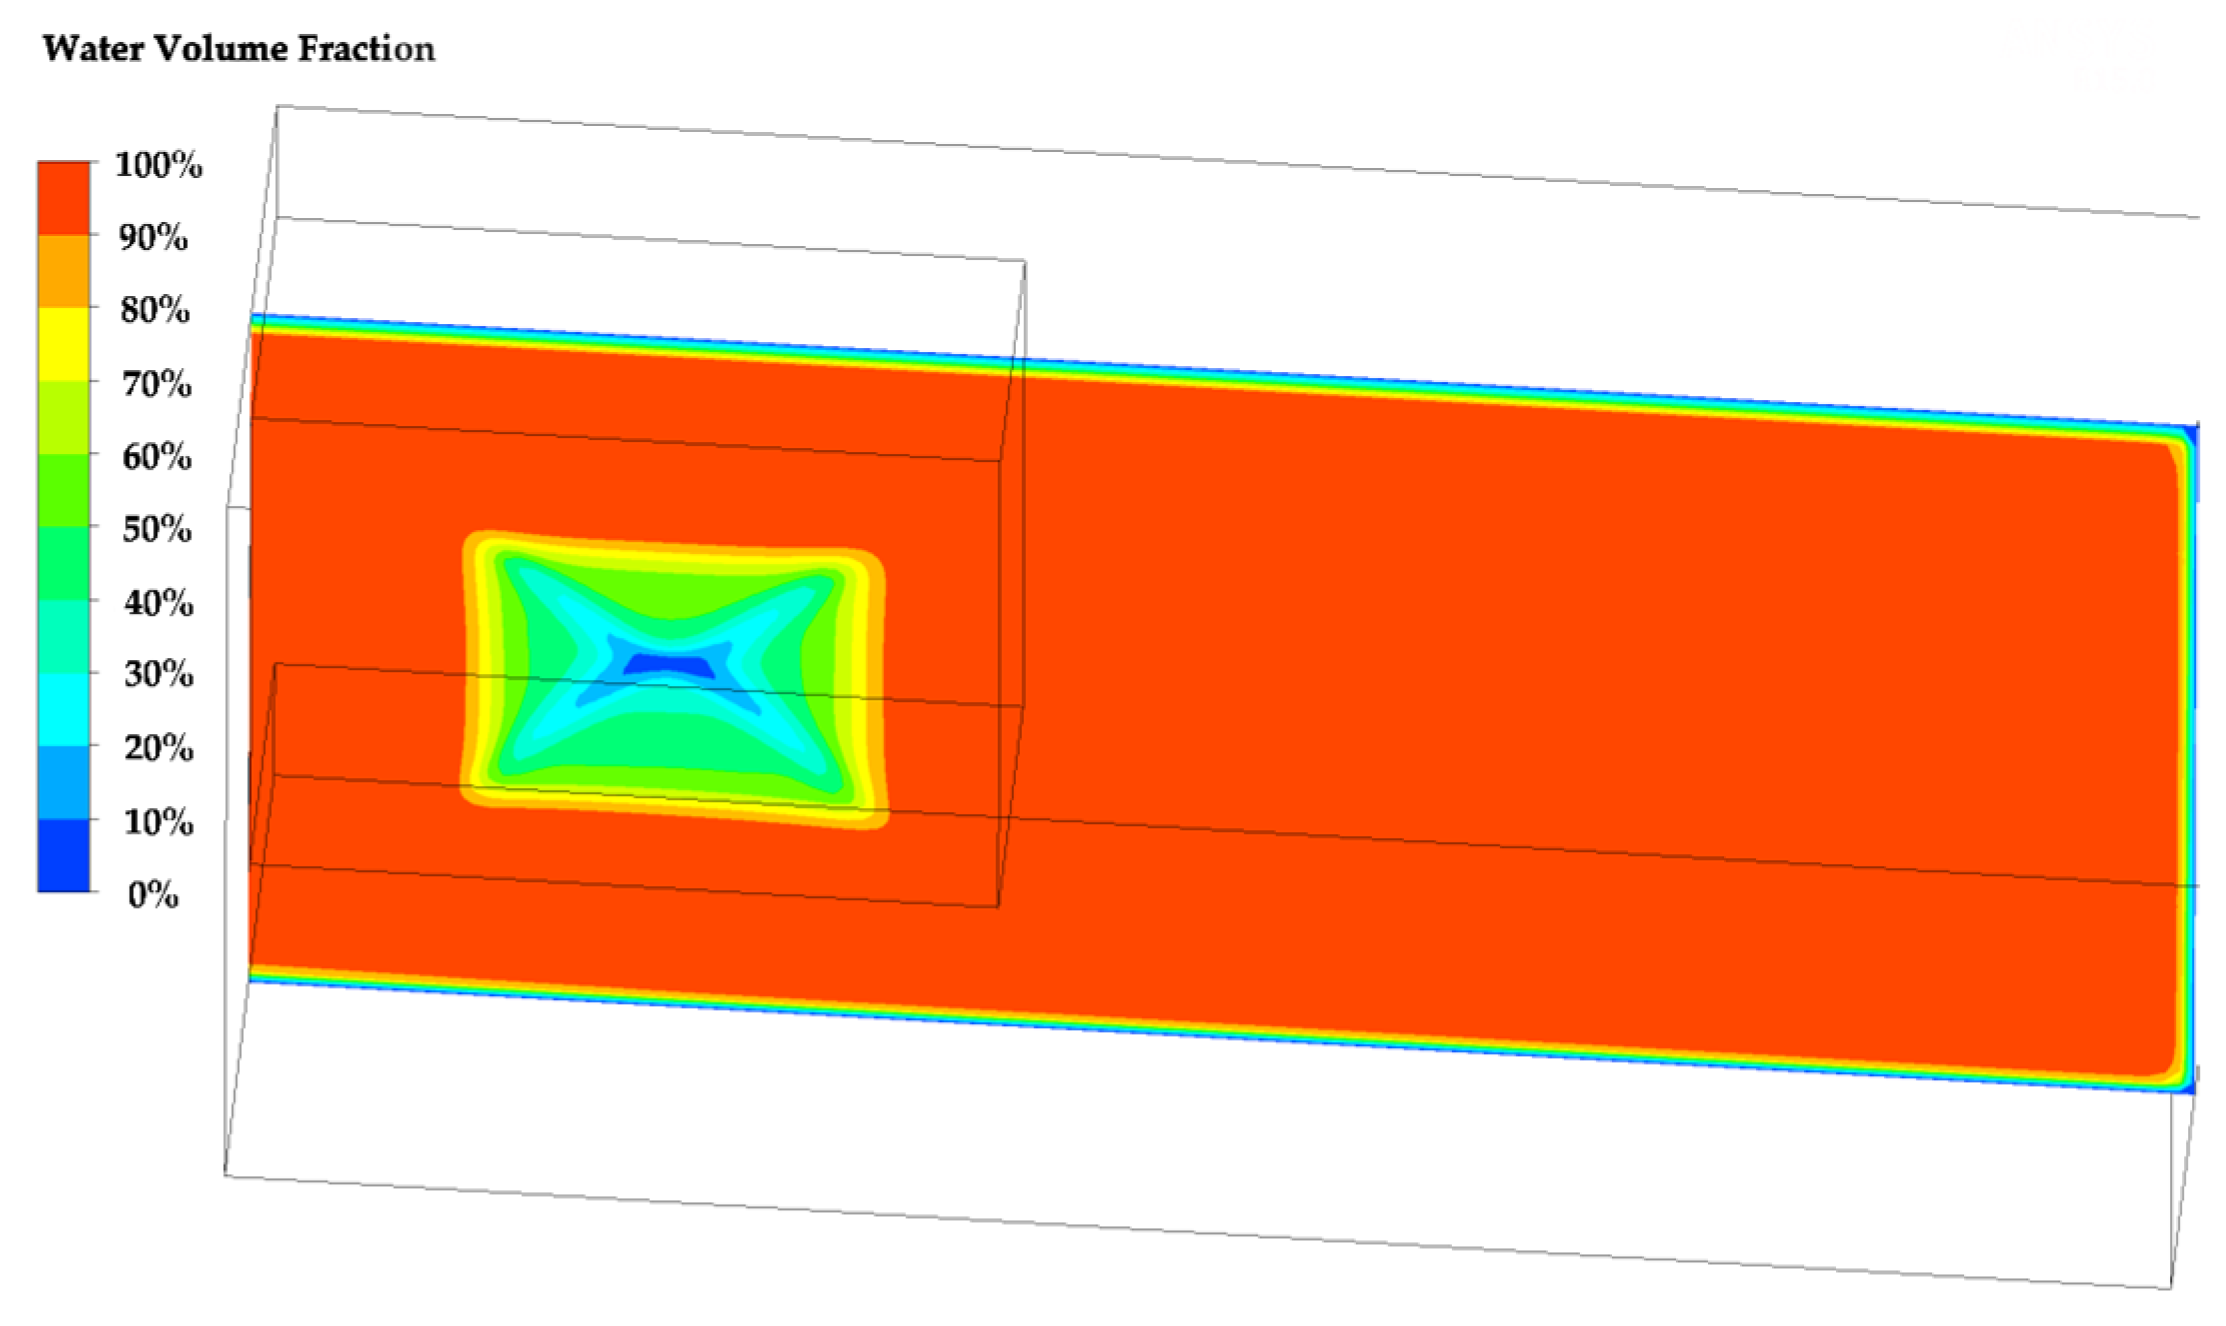
3.4. Calculation and Analysis of a Three-Dimensional Water Jet

In order to guide experimental research design, a three-dimensional soil liquefaction calculation by a water jet was carried out by establishing a model including a rectangular body, a flat jet nozzle and a two-phase calculation domain, as shown in Figure 15. In order to improve the accuracy of the solid–liquid two-phase flow calculation, the mesh was encrypted at the phase interface.
To obtain the evolution of the horizontal line jet under the submersible’s bottom in a three-dimensional computational domain, the calculation was carried out by using a continuous jet with 60 cm/s. The liquefaction state of the soil under the submersible box’s bottom was obtained by calculation, as shown in Figure 16, Figure 17, Figure 18 and Figure 19. The results showed that the water jet developed to two sides of the submersible box and then gradually converged to the center because of the minimum energy principle. Therefore, the process of soil liquefaction was not parallel to the direction of the jet but gradually converged to the middle. In order to represent the evolution of the jet accurately, the development of the line jet was drawn in Figure 20. This figure showed that the water jet that was under the bottom of the submersible box developed to the transition section, which was consistent with the liquefaction pattern shown in Figure 16, Figure 17, Figure 18 and Figure 19. The line jet liquefied all soil under the submersible box’s bottom and finally formed a complete flow channel with jet development, as shown in Figure 21. Adequately, soil liquefaction is an important means of restoring the hydrostatic pressure on the bottom of a submersible box, which is from Figure 1. As shown in Figure 19, the soil under the submersible box’s bottom can be completely liquefied through a horizontal line jet flow. In summary, it was considered that the horizontal line jet could liquefy soil, and the buoyancy of the submersible box was recovered.

4. Experiment

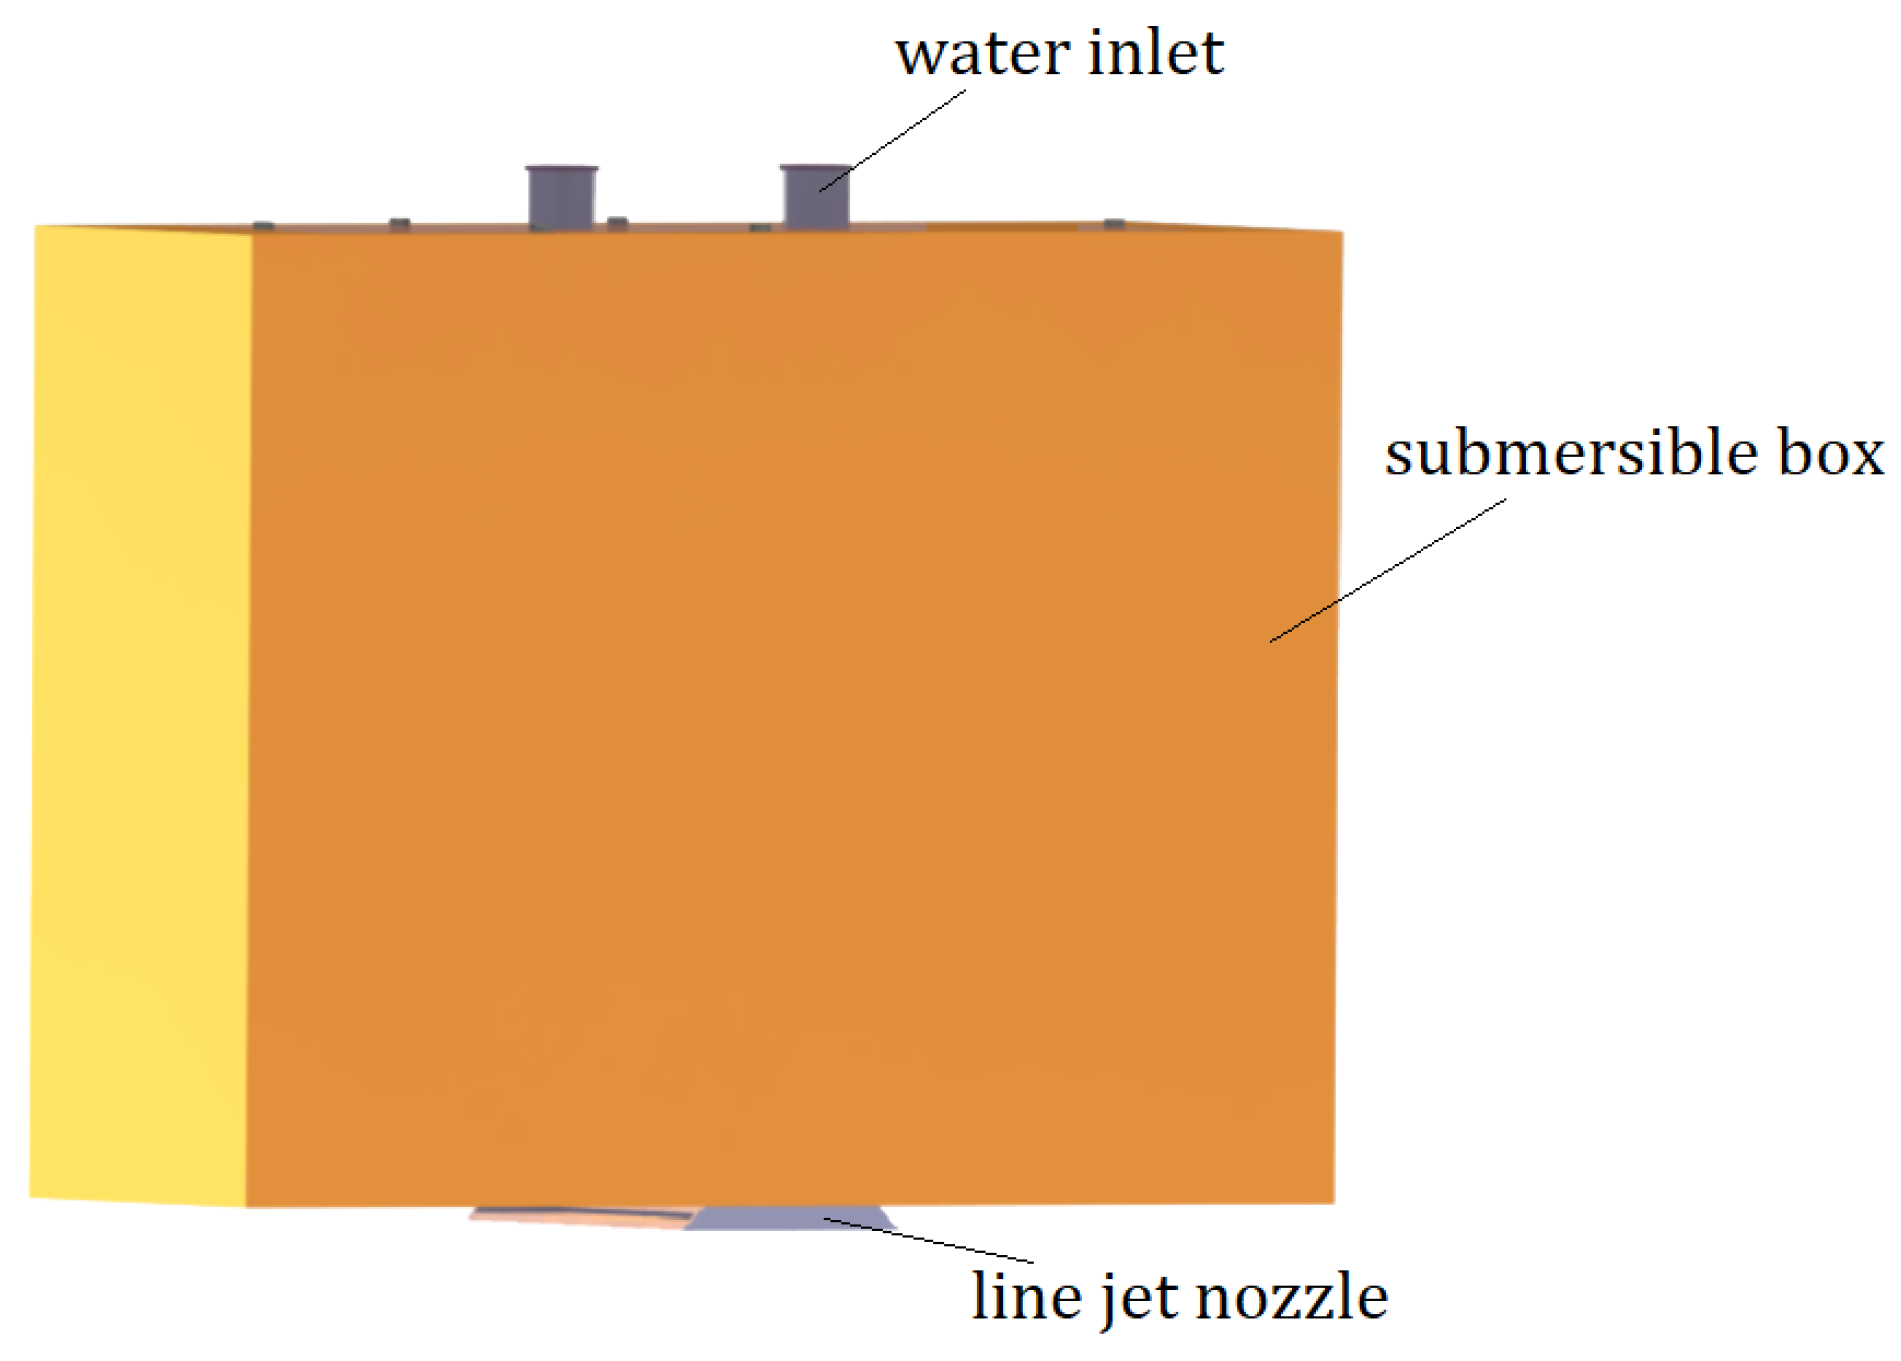
4.1. Experiment Design and Test Preparation

The experiment was designed and carried out to prove that the water jet could eliminate the bottom sitting adsorption effect. Figure 22 and Figure 23 showed that the experimental facility consisted of a water tank, clay, a submersible box, a line jet nozzle and a sensor. Soft clay was used to simulate subsea sediment by putting it on the tank’s bottom. A submersible box which was shown in Figure 24 was plunged into sediment artificially to form a bottom sitting adsorption effect in order to simulate the physical phenomenon of a manned submersible sitting on a seabed.
The buoyancy–weight ratio was adjusted by placing quartz sand in a submersible box to simulate the floating process under different reserve buoyancies. The submersible box was pressed into the sediment to a certain depth and was adsorbed.

4.2. Experimental Results

As shown in Figure 25, a submersible box was adsorbed into the sediment at the initial state (t = 0 s). The water jet was started, and some of the bubbles appeared after 6 s. As the water jet continued to gather energy, it eroded the soil under the bottom of the submersible box and formed a liquefaction layer. The box started to float up at last because of the reserve buoyancy. It was found that the buoyancy of the submersible box was restored by applying a horizontal line jet to the bottom. The result showed that the water jet could liquefy sediment to eliminate the bottom sitting adsorption effect.
A dynamometer and press block were put on top of the submersible box to obtain the reaction force when the submersible box floated up. The reaction force was recorded for nine models which consisted of different weight–floating ratio and jet velocities. The results was shown in Table 2. Figure 26 shows that the maximum reaction force increased with the increase in the jet velocity and the decrease in the weight–floating ratio. The jet velocity and weight–floating ratio actually affect the starting acceleration, and the weight–floating ratio is the principal factor.
The increase in jet velocity can not only accelerate the sediment liquefaction but also increase the hydrostatic pressure on the bottom; therefore, the start-up acceleration was increased. When the buoyancy was restored, a higher buoyancy was generated because of the lower weight–floating ratio; then, a higher upward impulse was generated. Therefore, the jet velocity and weight–floating ratio were key control parameters to achieving the safe floating of the manned submersible when it was adsorbed by subsea sediment.

5. Result and Discussion

According to Hu’s paper [1], when a manned submersible sat on a soft seabed, the submersible would sink into the soft sediment and lose buoyancy. We numerically and experimentally studied the bottom-sitting adsorption effect of a submersible and the liquefaction of sediment for this problem. We used a fluid model to simulate soil–liquid two-phase flow, as proposed by Raie [12] and Wang [14,15]. Soil liquefaction was key to eliminating the adsorption effect, according to Larissa [8] and Zhang [20]. And Xu [18] gave us the criterion for judging soil liquefaction.
Through the two-dimensional water jet calculation, we found that three different phase structures will be formed under the bottom of the submersible. They are the water layer, liquefied soil layer and solid soil layer. The water layer and the liquefied soil layer are the key to transferring the hydrostatic pressure to the bottom of the submersible to eliminate bottom sitting absorption. According to the calculation, the water film thickness is small, which is mainly caused by the wall flow effect. So, liquefied soil thickness is an important criterion for evaluating water jets.
From Figure 9, it was found that the liquefied soil thickness had a maximum value with the increase in the jet velocity. It showed that the increase in the jet velocity did not necessarily accelerate the sediment liquefaction. When the jet velocity was too high, the jet energy was more concentrated; it would not continue to liquefy the nearby sediment after opening the bottom channel. The result was different from that of overcoming the adsorption force of pile pulling by a high-pressure water jet [16]. According to the calculation results of this paper, the optimal jet velocity of a continuous jet was 8 m/s, based on approximately saturated sediment.
In addition to the jet velocity, the jet type was also a key factor affecting the effect of soil liquefaction. From Figure 14, three jet types were calculated and analyzed, among which the rectangular pulse jet had the best effect. The details were as follows:
(1)
The water film thickness was 5 cm, and the liquefied soil thickness was 12 cm, which was based on the continuous jet.
(2)
The water film thickness was 6.5 cm, and the liquefied soil thickness was 7 cm, which was based on the sinusoidal pulsed jet.
(3)
The water film thickness was 9 cm, and the liquefied soil thickness was 13.6 cm, which was based on the rectangular pulsed jet.
By comparison, it could be seen that the rectangular pulse jet had a very good effect on soil liquefaction, which had both pulsation and stability. This conclusion was similar to the high–low-pressure alternating jet used in jack-up platform pile pulling [16], but the jet velocity was greatly different.
The three-dimensional calculation and experimental study of the water jet were carried out, and the evolution law of the water jet under the bottom of the submersible was obtained. The process of soil liquefaction was not parallel to the direction of the jet but gradually converged to the middle. According to the experiment, it was found that the weight–buoyancy ratio was still the most important factor in recovering the buoyancy of the submersible. When the bottom sitting adsorption effect of a submersible occurs, all the ballast water should be drained first to obtain the minimum weight–floating ratio, and the soil liquefaction was completed through the optimal velocity to achieve buoyancy. But it was found that the monitoring reaction force was not comprehensive, and more parameters could be considered for further experiments, such as the water saturation and soil liquefaction index.

6. Conclusions

The adsorption effect came from the decrease in hydrostatic pressure on the bottom of the submersible. In this study, we presented a model as well as a series of numerical simulations to analyze how to eliminate the adsorption by a water jet. The conclusions were as follows:
(1)
The analysis method and experimental scheme for eliminating the bottom-sitting adsorption effect of under-sea equipment were established.
(2)
The calculation shows that the pulsed jet had a stronger ability to liquefy soil to eliminate the adsorption effect than the continuous jet. And a rectangular pulsed jet may be the best way.
(3)
By carrying out the water jet experiment of the bottom sitting adsorption effect of the submersible box, it was verified that the horizontal line jet could restore the buoyancy of the submersible box. And the jet velocity and weight–floating ratio were key control parameters. This physical phenomenon could further guide future research work on the self-rescue of under-sea equipment.

Author Contributions

Conceptualization, H.Z. and F.X.; methodology, H.Z. and C.Y.; software, D.Z. and P.G.; validation, S.C., S.L. and F.X.; formal analysis, H.Z.; investigation, S.L. and D.Z.; resources, H.Z. and S.L.; data curation, D.Z. and F.X.; writing—original draft preparation, H.Z. and F.X.; writing—review and editing, P.G. and H.Z.; visualization, P.G. and S.C.; supervision, H.Z. and P.G.; project administration, F.X.; funding acquisition, H.Z. All authors have read and agreed to the published version of the manuscript.

Funding

This work was supported by the National Key Research and Development Program of China (No. 2021YFC2801600 and No. 2021YFB3401400).

Data Availability Statement

The data that support the findings of this study are available on request from the corresponding author.

Acknowledgments

We wish to acknowledge the support of the research fund from CSSRC. We gratefully acknowledge Wang Yongjun, who gave us a lot of guidance and help during this research.

Conflicts of Interest

Qingdao Ship Researching Deep Sea Technology Company Limited is the wholly owned subsidiary and experiment base of CSSRC, and Shuai Liu is the test engineer of this research work. The remaining authors declare no conflict of interest.

References

  1. Hu, Y.; Shen, Y.; Xie, J.; Cui, W. Landing research on deep-sea human occupied vehicle. J. Ship Mech. 2008, 12, 642–648. [Google Scholar]
  2. Momber, A.W. An SEM-study of high-speed hydrodynamic erosion of cementitious composites. Compos. Part B-Eng. 2003, 34, 135–142. [Google Scholar] [CrossRef]
  3. Yahiro, T.; Yoshida, H. On the characteristics of high speed water jet in the liquid and its utilization on induction grouting method. In Proceedings of the Second International Symposium on Jet Cutting Technology, Cambridge, UK, 2–4 April 1974; pp. G4/41–G4/63. [Google Scholar]
  4. Zhang, F.; Li, J.; Deng, Y.; Xu, C. Numerical investigation of mixing process of high-pressure jet-cutting clay by water-air coaxial nozzle considering soil rheological properties. Comput. Geotech. 2023, 165, 105878. [Google Scholar] [CrossRef]
  5. Shen, Z. Water Jet Theory and Technology; China University of Petroleum Press: Dongying, China, 1988. [Google Scholar]
  6. Bienen, B.; Gaudin, C.; Cassidy, M. The influence of pull-out load on the efficiency of jetting during spudcan extraction. Appl. Ocean. Res. 2009, 31, 202–211. [Google Scholar] [CrossRef]
  7. Karamigolbaghi, M.; Ghaneeizad, S.; Atkinson, J.; Bennett, S.; Wells, R. Critical assessment of jet erosion test methodologies for cohesive soil and sediment. Geomorphology 2017, 295, 529–536. [Google Scholar] [CrossRef]
  8. Passini, L.; Schnaid, F.; Rocha, M.; Moller, S. Mechanism of model pile installation by water jet fluidization in sand. Ocean. Eng. 2018, 170, 160–170. [Google Scholar] [CrossRef]
  9. Mazurek, K.; Rajaratnam, N.; Sego, D. Scour of cohesive soil by submerged circular turbulent impinging jets. J. Hydraul. Eng. 2001, 127, 598–606. [Google Scholar] [CrossRef]
  10. Rajaratnam, N.; Mazurek, K. An experimental study of sand deposition from sediment laden water jets. J. Hydraul. Res. 2006, 44, 560–566. [Google Scholar] [CrossRef]
  11. Clark, L.; Wynn, T. Methods for determining streambank critical shear stress and soil erodibility: Implications for erosion rate predictions. Am. Soc. Agric. Biol. Eng. 2007, 50, 95–106. [Google Scholar]
  12. Raie, M.; Tassoulas, J. Installation of Torpedo Anchors: Numerical Modeling. J. Geotech. Geoenviron. Eng. 2009, 135, 1805–1813. [Google Scholar] [CrossRef]
  13. Wang, J.; Zhang, L.; Zhang, Z. Measures for improving the leg-pull-out efficiency of offshore jack-up drilling platforms in West Africa. China Offshore Oil Gas 2016, 28, 132–137. [Google Scholar]
  14. Wang, T.; Song, B. Study on jet excavation mechanism in cohesive soil. Chin. J. Hydrodyn. 2018, 33, 337–343. [Google Scholar]
  15. Wang, T.; Song, B. Study on deepwater conductor jet excavation mechanism in cohesive soil. Appl. Ocean. Res. 2019, 82, 225–235. [Google Scholar] [CrossRef]
  16. Chen, Q.; Tan, B. Study on problems in pulling up legs of offshore jack-up drilling platform-shengli NO.6. Ocean. Eng. 1993, 11, 84–92. [Google Scholar]
  17. Chee, M.W.L.; Ghasemi, G.; Rashid, M.A.; Fernandes, R.R.; Wilson, D.I. Cleaning of thick viscoplastic soil layer by impinging water jets. J. Food Eng. 2023, 340, 111290. [Google Scholar] [CrossRef]
  18. Xu, Z.; Xu, G.; Chen, C. The rate characteristics of the wave-induced liquefaction process of the silty soil in the seabed. Period. Ocean. Univ. China 2018, 48, 115–122. [Google Scholar]
  19. Ibrahim, A.; Meguid, M. Continuum-Based Approach to Model Particulate Soil-Water Interaction: Model Validation and Insight into Internal Erosion. Processes 2021, 9, 785. [Google Scholar] [CrossRef]
  20. Zhang, P.; Wang, Q.; Liu, H.; Yang, Q.; Zhang, H. Experimental study umbrella suction anchor in seabed soil bearing characteristics of wave-induced liquefaction. Period. Ocean. Univ. China 2018, 48, 131–136. [Google Scholar]
  21. Zen, K.; Yamazaki, H. Mechanism of wave-induced liquefaction and densification in seabed. Soils Found. 1990, 30, 90–104. [Google Scholar] [CrossRef]
  22. Zen, K.; Yamazaki, H. Field observation and analysis of wave-induced liquefaction in seabed. Soils Found. 1991, 31, 161–179. [Google Scholar] [CrossRef]
  23. Sassa, S.; Yakayama, T.; Mizutani, M.; Tsujio, D. Field observations of the build-up and dissipation of residual pore pressures in seabed sands under the passage of storm waves. J. Geotech. Geoenviron. Eng. 2006, 39, 410–414. [Google Scholar]
  24. Chang, W.; Rathje, E.; Stokoe, K.; Hazirbaba, K. In situ pore-pressure generation behavior of liquefiable sand. J. Geotech. Geoenviron. Eng. 2007, 133, 921–931. [Google Scholar] [CrossRef]
  25. Besses, B.; Magnin, A.; Jay, P. Viscoplastic flow around a cylinder in an infinite medium. J. Non-Newton. Fluid Mech. 2003, 115, 27–49. [Google Scholar] [CrossRef]
  26. Zhu, H.; Randolph, M.F. Numerical analysis of a cylinder moving through rate-dependent undrained soil. Ocean Eng. 2011, 38, 943–953. [Google Scholar] [CrossRef]
Figure 1. Bottom-sitting adsorption effect of a submersible.
Processes 11 03452 g001
Figure 2. Modes of water jet: (a) Continuous jet; (b) Pulsed jet; (c) Mixed jet.
Processes 11 03452 g002
Figure 3. Herschel–Bulkley model.
Processes 11 03452 g003
Figure 4. Two-dimensional water jet calculation model.
Processes 11 03452 g004
Figure 5. Meshing of the model.
Processes 11 03452 g005
Figure 6. Two-phase distribution caused by a permanent water jet.
Processes 11 03452 g006
Figure 7. Vector distribution of the early water jet (vjet = 3.94 m/s).
Processes 11 03452 g007
Figure 8. Vector distribution of the later water jet (vjet = 3.94 m/s).
Processes 11 03452 g008
Figure 9. Thickness of the water film and liquefied soil in different jet velocities.
Processes 11 03452 g009
Figure 10. Sinusoidal pulse jet.
Processes 11 03452 g010
Figure 11. Rectangular pulse jet.
Processes 11 03452 g011
Figure 12. Two-phase distribution caused by a sine pulse jet.
Processes 11 03452 g012
Figure 13. Two-phase distribution caused by a rectangular pulse jet.
Processes 11 03452 g013
Figure 14. Thickness of the water film and liquefied soil of different jet types (vmax = 3.94 m/s).
Processes 11 03452 g014
Figure 15. Streamline caused by the rectangular pulse jet.
Processes 11 03452 g015
Figure 16. Two-phase distribution in the median longitudinal section.
Processes 11 03452 g016
Figure 17. Two-phase distribution in the edge of the box.
Processes 11 03452 g017
Figure 18. Two-phase distribution in the early box bottom.
Processes 11 03452 g018
Figure 19. Two-phase distribution in the later box bottom.
Processes 11 03452 g019
Figure 20. Structure development of the line jet caused by the limited constraint on the top.
Processes 11 03452 g020
Figure 21. Streamline of the water jet after liquefying the soil.
Processes 11 03452 g021
Figure 22. Process scheme of the experiment.
Processes 11 03452 g022
Figure 23. Testing equipment of the water jet.
Processes 11 03452 g023
Figure 24. Structure composition of the submersible box.
Processes 11 03452 g024
Figure 25. Elimination for the resting adsorption effect of a submersible: (a) Initial state t = 0   s ; (b) Start of the jet stream t = 6   s ; (c) Start of the jet stream t = 13   s ; (d) Start of the jet stream t = 18   s .
Processes 11 03452 g025
Figure 26. Variation in the maximum reaction force relative to the jet velocity and weight–floating ratio.
Processes 11 03452 g026
Table 1. Parameters used in the calculation.
k (Pa·s)n τ 0 (Pa) γ 0 (s−1)
6120.113000.001
Table 2. Typical test data.
Weight–Floating RatioJet Velocity (m/s)Average Maximum Reaction Force (N)Standard Deviation
0.3750.65355.07±23.94
0.3750.67318.02±25.44
0.3750.82433.35±23.87
0.6250.65135.73±7.73
0.6250.67154.75±10.59
0.6250.82153.53±8.89
0.8750.6548.02±1.61
0.8750.6743.84±2.31
0.8750.8243.27±1.38
Disclaimer/Publisher’s Note: The statements, opinions and data contained in all publications are solely those of the individual author(s) and contributor(s) and not of MDPI and/or the editor(s). MDPI and/or the editor(s) disclaim responsibility for any injury to people or property resulting from any ideas, methods, instructions or products referred to in the content.

