1. Introduction
In the past two years, countries around the world have outlined blueprints for achieving carbon neutrality by 2050 or 2060 [
1,
2]. To effectively promote the low-carbon transformation of the energy system, there is a need to vigorously develop new energy sources to gradually replace traditional fossil-based generators [
3,
4]. It is anticipated that by 2050, renewable energy, especially solar and wind power, will take up the largest part of the energy supply both in China and worldwide. However, as the scale and penetration rate of new energy continue to increase, more upcoming issues such as power system fluctuations and instability become more prominent, posing significant challenges to the secure operation of the grid and the integration of new energy [
5]. Compared to the conventional controllable fossil-based generators, the power outputs of renewables mainly rely on the corresponding weather conditions, with solar radiation for solar power and wind speed for wind power, which feature high uncertainty and variability. And the output may not satisfy the demand side. The supply–demand mode will change from the conventional “generation follow load” to a new pattern “load follow generation” or “generation follow load with storage”. The new pattern relies on energy storage as the enabler to achieve the balance between energy supply and demand, which is the one of the keys for a future sustainable-energy society.
So, energy storage, due to its advantages of flexibility, rapid response, and clean and non-polluting nature, is expected to play a crucial role in the future energy system [
6]. Moreover, its dual identity as both a power source and energy storage makes it an important approach to address the stochastic, intermittent, and fluctuating characteristics of renewable energy, facilitating the concentrated integration of new energy sources [
5], reducing the difficulty of peak shaving in the system, increasing the utilization of cross-regional transmission channels [
7,
8,
9], and enhancing the security and reliability of the power grid operation.
Most scholars have historically utilized historical annual wind and solar power outputs as input for forecasting models, which increases the complexity of the models. However, in actual grid planning, the uncertainty of new energy outputs significantly impacts capacity configuration decisions [
10,
11,
12], making it a critical issue to effectively characterize uncertainty in the optimization of hybrid energy systems. Currently, common methods for dealing with uncertainty in optimization models include stochastic optimization and robust optimization [
13,
14,
15,
16]. Stochastic optimization uses scenario sets to represent the uncertainty of new energy outputs, aiming to simulate various operational scenarios based on typical scenarios derived from historical data. On the other hand, robust optimization employs parameter intervals to characterize the uncertainty of new energy outputs, encompassing all possible operational scenarios within the interval, ensuring that the optimization results satisfy operational constraints, even in the worst-case scenario [
17,
18].
Based on the above, considering the counter-distributed characteristics of domestic wind and solar resources and power load centers, large-scale cross-regional transmission of renewable energy is necessary [
19]. However, the direct transmission of bundled renewable energy will lead to pressure on the receiving side and transmission line capacity enhancement, due to its variability and uncertainty. We study a hybrid energy system, composed of wind power, solar power, and energy storage, denoted by the wind–solar–energy storage hybrid energy systems. To address the above problems, it is essential to study wind–solar—storage resource configuration strategies that consider constraints on the renewable energy external transmission and match them with storage.
Using energy storage as an example, this study first conducts clustering analysis based on the actual wind and solar outputs and load data of a certain region in the northeast over one year to obtain typical scenarios of solar, wind, and load curve for the northeast region. The typical scenario can help analyze the complementary features of solar and wind power output. Then, based on the typical scenario, a wind–solar–storage ratio planning strategy that considers the value of storage support for new energy external transmission capacity is proposed, and the impacts of different photovoltaic ratios, allowable fluctuation rates, and transmission channel capacities on the optimization results are analyzed. To summarize, the key innovation of this paper lies in two aspects: (1) the total planning strategy with the clustering analysis and optimization analysis; (2) the comprehensive analysis of the value of energy storage under various scenarios.
The rest of this paper is organized as follows.
Section 2 leverages the KMEANS++ clustering algorithm to conduct the scenario analysis on the solar–wind–load for obtaining the typical scenarios for later planning analysis.
Section 3 proposes the wind–solar–storage ratio planning strategy that considers the value of storage support for the renewable energy external transmission capacity.
Section 4 conducts comprehensive analysis to verify the effectiveness of the proposed models from the perspectives of clustering analysis, reduction analysis, sensitivity analysis, and numerical analysis.
Section 5 concludes the paper and provides several advices for the system operation.
2. Scenario Analysis
In this study, the first step involves investigating the regional resource endowment to model photovoltaic power plants and wind farms, generating one year of wind and solar output data. These data are then combined with regional load data for joint analysis. Next, the KMEANS++ algorithm [
20] is employed to conduct clustering analysis on the wind–solar–load data, extracting typical scenarios of wind–solar–load for subsequent planning research on the optimal configuration. Intuitively, the output of solar and wind power features the complementary feature. This feature means that solar power generates more in the daytime and less in the night, and, in comparison, the wind power usually generates more in the night and less in the daytime. The clustering analysis can help us to investigate this feature. During the clustering analysis, the effectiveness of clustering parameters is validated using both the average distance to cluster centers and dimensionality reduction visualization techniques.
2.1. Clustering Algorithm
In this study, the first step involves normalizing the wind–solar–load data for the entire year of 8760 time periods using the maximum value normalization method. And the multiple sources of data with different units are unified into the scale of 0–1, which can be seen as the p.u. values. After that, the KMEANS++ algorithm is applied with different numbers of clusters to perform clustering analysis. However, the number of clusters will have great impacts on the system. More clusters lead to complex computational power, and fewer clusters lead to less representative features. The effectiveness of clustering is evaluated by computing the average distance to the cluster centers and selecting the appropriate number of clusters. Additionally, dimensionality reduction visualization techniques are used to analyze the clustering results. If the clustering results do not meet the required criteria, the number of clusters is adjusted accordingly. Finally, the typical operational scenarios obtained after clustering are output and used for subsequent planning and analysis.
To enhance the computational efficiency, typical daily wind–solar–load data are extracted using clustering, as analyzing the full-year data of 8760 time periods directly would be computationally intensive. Currently, mainstream clustering algorithms include prototype-based clustering (KMEANS), hierarchical clustering, density-based clustering (DBSCAN), and graph-based clustering (AP). This study primarily adopts the KMEANS++ algorithm, a variant of the prototype-based KMEANS algorithm, due to its fast convergence and robustness, making it suitable for clustering large-scale high-dimensional real-world data.
The first step of the study involves normalizing the wind–solar–load output data for the entire year to the range of 0–1 based on their respective maximum output values. Subsequently, the KMEANS++ algorithm is applied to the normalized wind–solar–load data to extract typical operational scenarios. The core idea behind the KMEANS++ algorithm is to maximize the distance between initial cluster centers through iterative steps. The specific implementation steps are detailed in Algorithm 1:
| Algorithm 1 The KEAMS++ algorithm for the solar–wind–load typical scenario extraction. |
- 1:
Input: The number of clusters N; the processed dataset of wind–solar–load data under the 0-1 normalization; - 2:
Step 1: Randomly select one wind–solar–load scenario as the initial cluster center . - 3:
Step 2: Assign the remaining cluster centers using a distance-based approach. For each of the N cluster centers, the algorithm calculates the distance between the wind–solar–load scenario and the existing cluster centers, including . - 4:
Step 3: Continue the process of selecting cluster centers by repeating step 2 until all N cluster centers have been chosen. - 5:
Step 4: Perform the KMEANS++ clustering algorithm using the N cluster centers obtained above to cluster the wind–solar–load data into C clusters. - 6:
Output: Typical wind–solar–load data pair scenarios with different corresponding clustering number.
|
2.2. Number of Clusters Analysis
Considering the diverse operational characteristics of regional wind and solar data, it is challenging to manually determine the number of cluster centers (
C) for the KMEANS++ algorithm based on experience. Instead, this study selects the number of cluster centers using the sum of the squared error (SSE) of the clustering centroids for the wind–solar–load scenarios throughout the entire year. To determine the optimal number of clusters, the KMEANS++ algorithm is applied iteratively with different values of
C. For each value of
C, the clustering is performed, and the SSE is computed, representing the sum of the squared distances between data points and their respective cluster centroids. The value of
C that results in the lowest SSE is selected as the optimal number of cluster centers, as it indicates a more compact and well-separated clustering, capturing the distinctive patterns of wind–solar–load scenarios effectively, which is calculated in Equation (
1).
By using the SSE as a criterion for selecting the number of cluster centers, this approach avoids relying on subjective judgment and ensures a data-driven determination, better reflecting the inherent structure and characteristics of the normalized wind–solar–load data for subsequent planning and analysis.
2.3. Dimension Reduction Analysis
Given that the typical daily wind–solar–load data are of high dimensionality (96 dimensions) with weak correlations, understanding the specific distribution of the typical days can be challenging. To address this, the study employs dimensionality reduction visualization techniques to extract the main features of the wind–solar–load data and project it onto a two-dimensional space, facilitating the visualization of the typical days.
The t-SNE (t-Distributed Stochastic Neighbor Embedding) algorithm is utilized in this study for dimensionality reduction visualization of the clustering results. The core idea behind t-SNE is to transform the high-dimensional distances in the original space into probability distributions using Gaussian distributions and then map similar probability distributions to distances in a lower-dimensional space. The t-SNE core principle is to perform dimensionality reduction on high-dimensional vectors by minimizing the Kullback–Leibler (
) divergence between the probability distributions of the data points in the high-dimensional space and the low-dimensional space, as shown in Equation (
2).
By applying t-SNE, the typical daily wind–solar–load data are represented in a two-dimensional space, allowing for a more intuitive and interpretable visualization of the distinctive patterns and structures among the typical days. This visualization technique aids in better understanding the characteristics and relationships among the typical days, providing valuable insights for subsequent planning and operations analysis.
3. Ratio Planning Model
Based on the typical scenario analysis model and typical scenario, this section proposes the wind–solar–storage ratio planning strategy. It considers the value of storage to support the renewable energy transmission. Then, multiple parametric analysis is leveraged for various scenarios’ analysis. Based on multiple parametric analysis, we can obtain the relationship among the needed capacity of the energy storage, different combinations of solar and wind power, and the different limits of transmission capacity.
3.1. Ratio Planning Framework
To achieve the goals of “carbon peaking” and “carbon neutrality,” in the coming decades, the installed capacity of wind and solar power, represented by wind turbines and photovoltaics (PV) generation, will continue to increase in the power system. Regions abundant in wind and solar resources often experience wind and solar actual outputs that exceed their local demand. Therefore, it becomes essential to bundle and transmit the surplus energy to regions with higher demand.
However, due to the strong variability, intermittency, and uncertainty of wind and solar power outputs, directly bundling wind and solar energy for external transmission often results in combined output characteristics that do not align with the load patterns of the external grid, thus affecting the optimization operation of the external grid. Therefore, this study utilizes the regulation capabilities of energy storage to smooth the fluctuations in wind and solar power outputs, enabling the bundling of wind, solar, and storage energy. The bundled energy is then transmitted to the external grid via ultra-high-voltage transmission lines, ensuring efficient and optimized operation of the external grid.
3.2. Energy Storage System Formulation
Energy storage systems (ESS) usually work at the charging state when the electricity price is low and at the discharging state when the electricity price is high. The feasible region
of decision variable
is subject to the following constraints:
Equation (
3) illustrates that the operating power
of
ESS is composed of charging and discharging parts;
denotes the charging of ESS from the grid, and
denotes the discharging of ESS to the grid.
where
(kWh) refers to the stored energy in the ESS. Equation (
4) ensures that
in the ESS at time
t lies in an allowable range, and
,
refer to the minimum and maximum capacity of the battery system.
where
M is a large positive number.
and
are binary indicators of discharging and charging state, where 1 means in the state and 0 means the opposite.
and
are the maximum values of charging and discharging power. Equation (
5) prevents the simultaneous charging and discharging of ESS by utilizing the big-M relaxation method.
3.3. The Final Wind–Solar–Storage Ratio Planning Model
Based on the extracted typical scenarios, the ratio framework, and energy storage model, we formulate the wind–solar–storage ratio planning with the stochastic optimization to consider the uncertainty of the renewable power output. We note that most scenarios are similar, so we propose to leverage the KMEANS++ algorithm with SSE analysis to extract the typical scenarios for planning analysis with high efficiency. We leverage the above model to show the value of energy storage in facilitating renewables in the following (6):
where
is the cost of energy storage;
is the ratio of PV to total renewables, which is composed of solar power
and wind power
;
is the bundled transmission power of renewables;
is the transmission capacity. Equation (6e) limits the transmission capacity of solar–wind–storage.
4. Case Study
In this study, the proposed algorithm includes two main components: the typical day clustering method based on KMEANS++ using photovoltaic wind turbine output, and load data from the simulation platform of the China Electric Power Research Institute in Northeast Province. The proportional planning scheme for energy storage considers stable external power transmission capacity. Building on the clustering analysis and the planning model for external output, the focus of this study is on the installation capacity of energy storage required per unit of wind power, i.e., the planning ratio between energy storage and wind-solar energy. The research investigates the enhancing role of energy storage for new energy, analyzing the effects of different wind–solar ratios, wind–solar operational volatility, and the allowed capacity of transmission channels on the system. For the proposed planning model, the power capacity is standardized by using 1 MW as the reference value. This approach allows for a comprehensive investigation into the optimal configuration of energy storage in relation to wind and solar energy, enabling a better understanding of the impacts of various factors on the system’s performance.
All the clustering and optimization models are coded by python 3.6. The KMEANS++ algorithm and reduction analysis are based on the SKlearn package. The optimization models are based on the CVXPY package with the commercial solvers of GUROBI for effective solution analysis.
4.1. Clustering Analysis
According to the clustering analysis strategy for wind–solar–load data mentioned in the first section, this study starts by normalizing the wind–solar–load data for 365 days in a certain region of northeast province based on their respective maximum values. The wind power and solar power data are collected from the open-source website in [
21], which can generate the proper renewables and load profiles given the proper location. The normalized data are then input into the KMEANS++ clustering model, and the change in SSE for different numbers of clusters is analyzed to determine the optimal number of clusters for the system. After identifying the optimal number of clusters, the clustering results are visualized and analyzed to assess the effectiveness of the clustering algorithm. Finally, the clustering results are output for further analysis and interpretation.
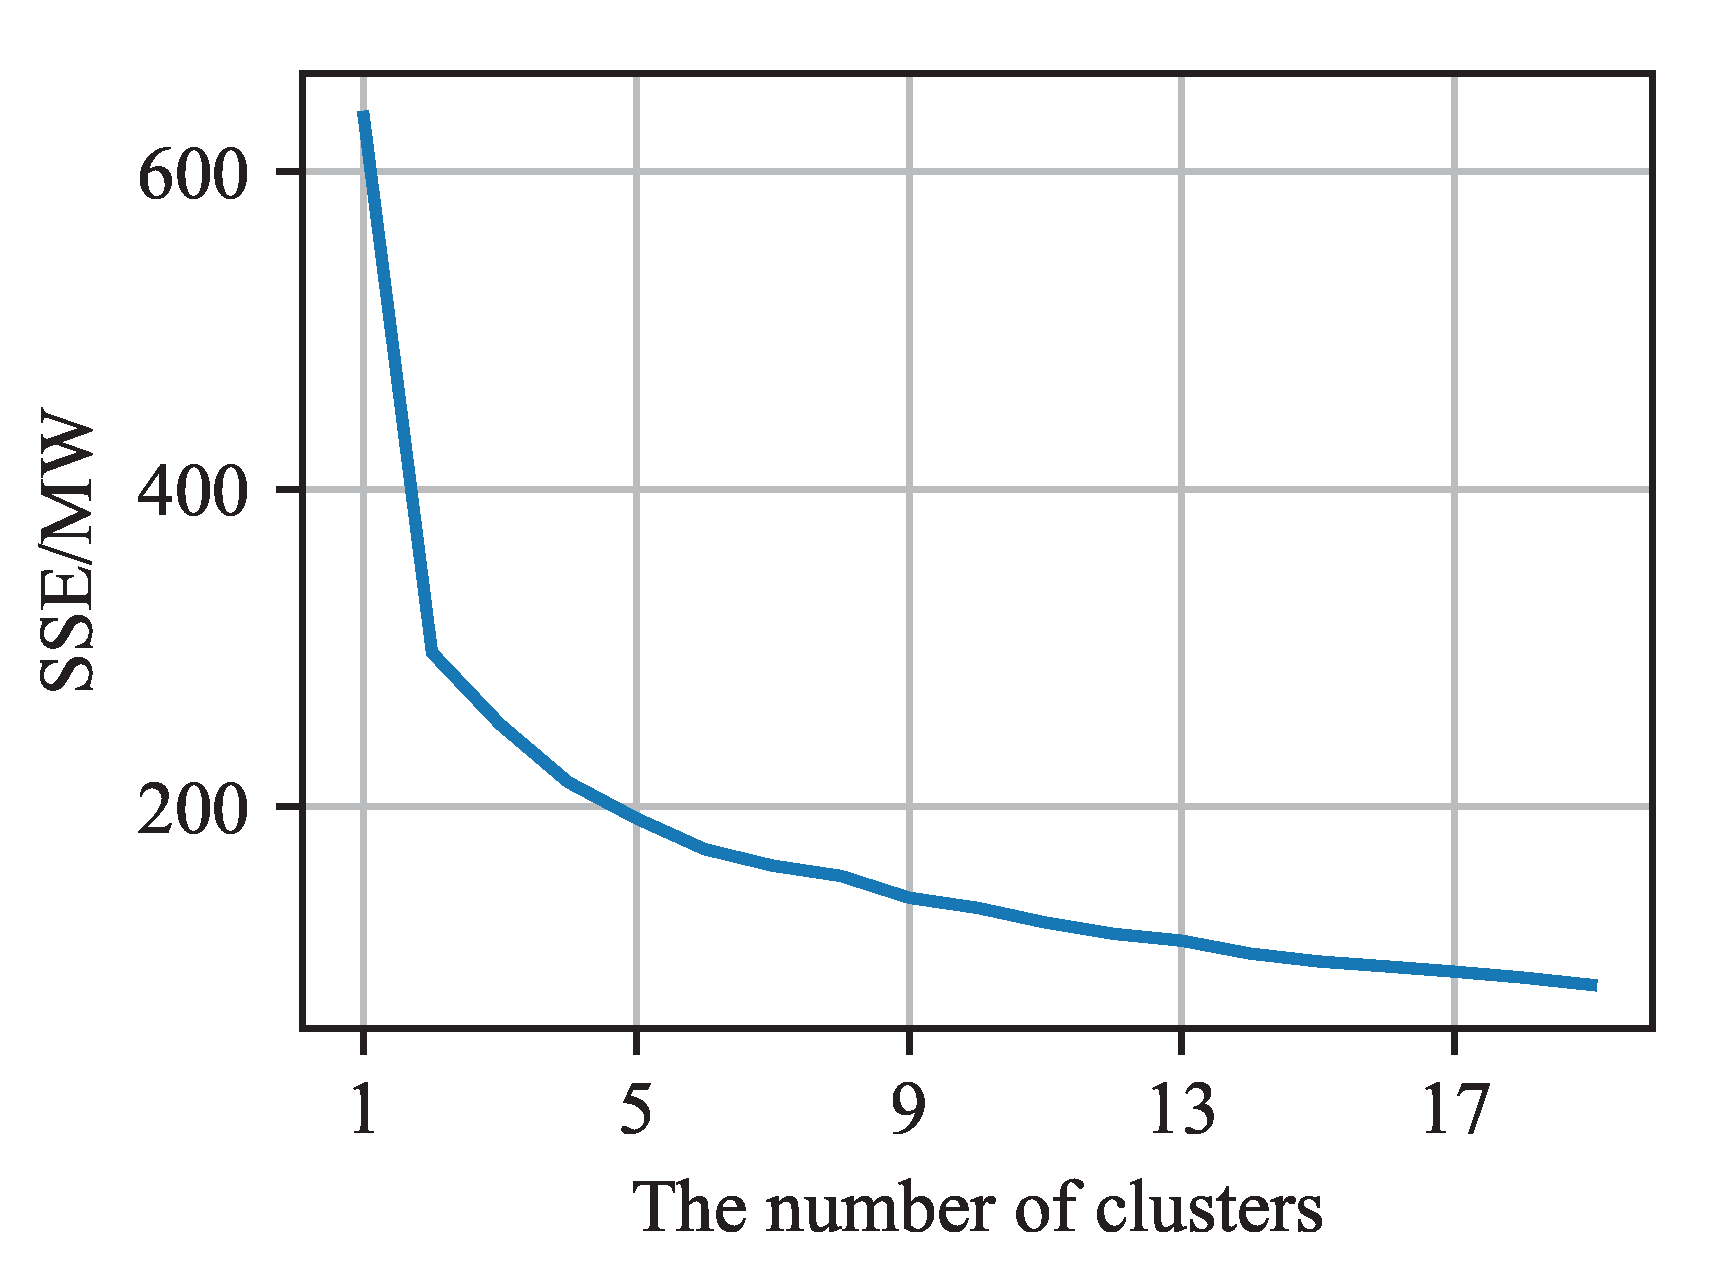
4.1.1. SSE Analysis
Figure 1 shows the change trend of SSE with the increase in the clustering number. The value of SSE decreases shapely at first and flattens latter, which means the typical scenarios can represent the features of the total scenarios. More clusters mean less SSE but a high computational requirement.
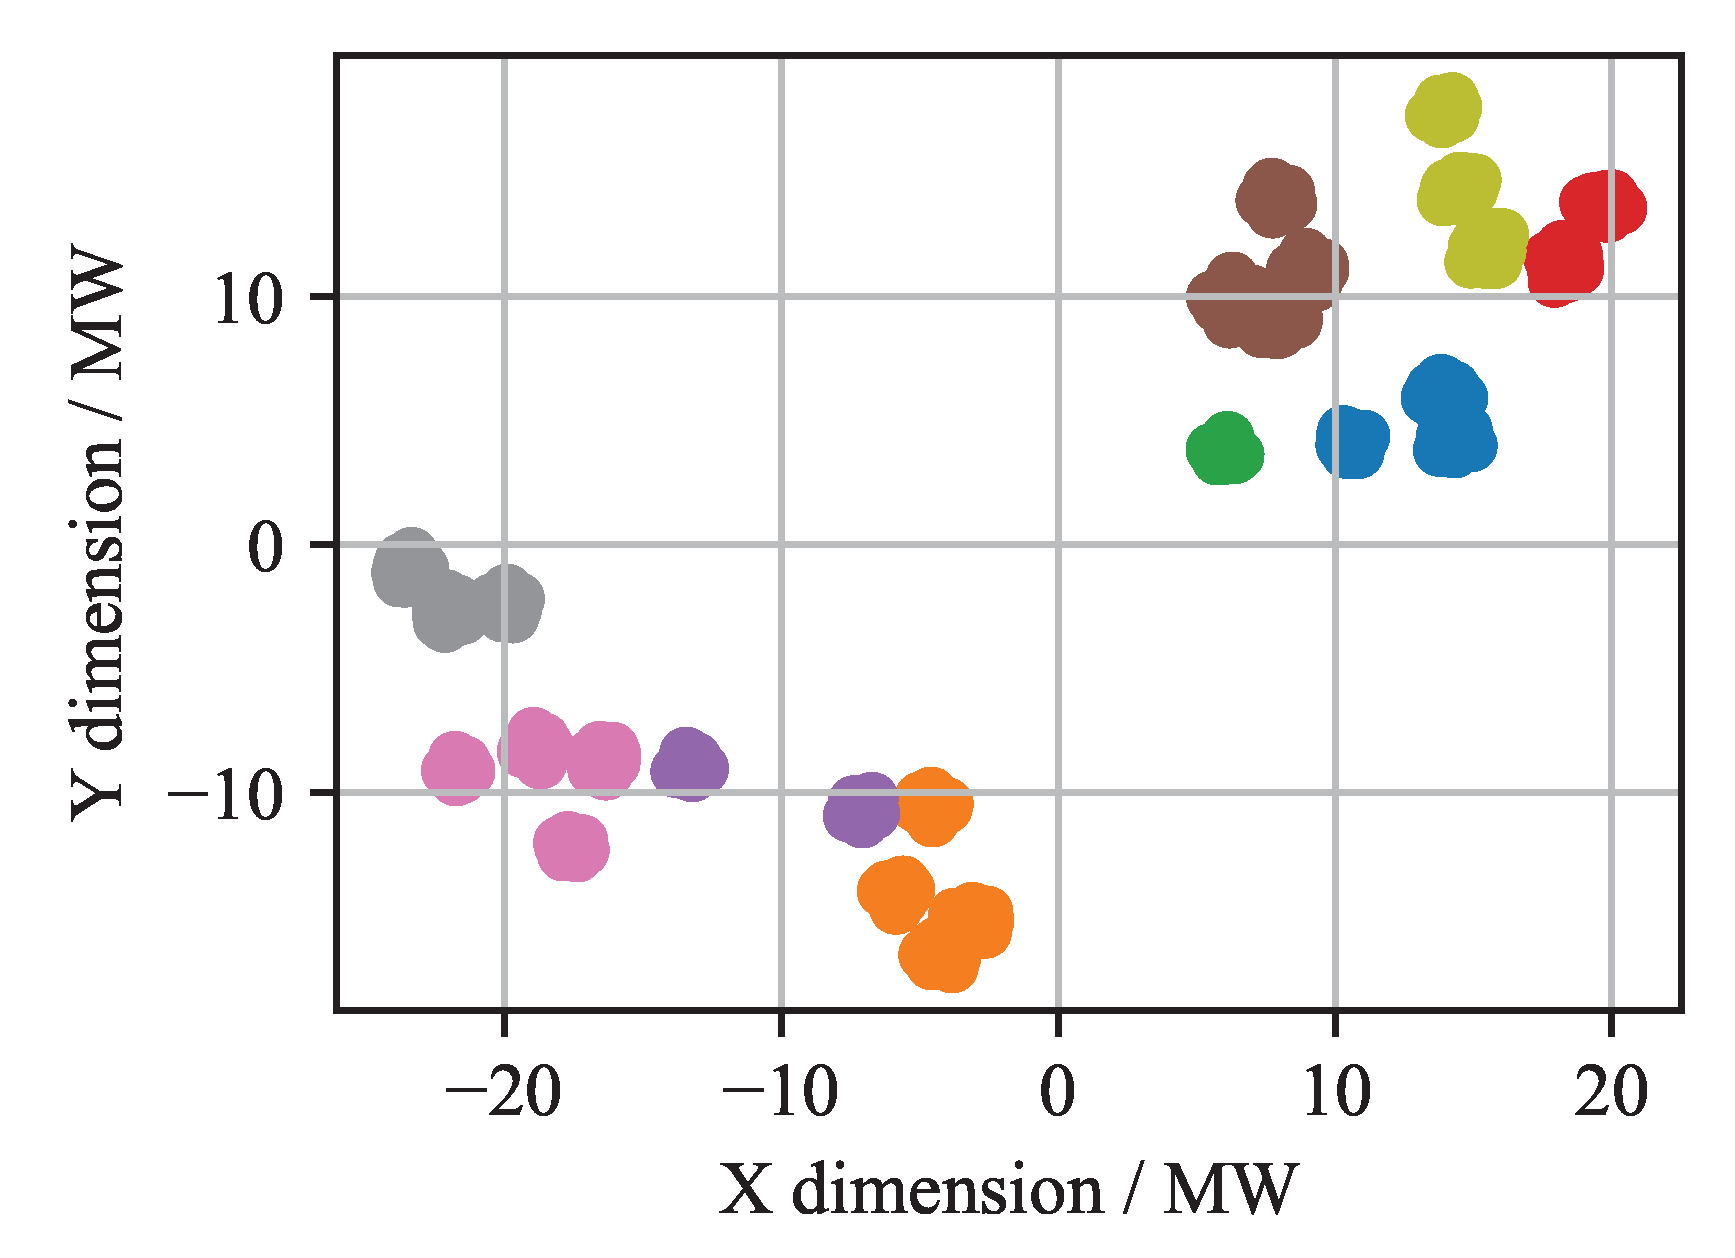
4.1.2. tSNE Analysis
After determining the number of cluster centers as 9, this study employs the t-SNE algorithm to reduce the 96-dimensional wind–solar–load data of a typical day to a two-dimensional space for visualization. The scatter plot of the reduced data is shown in
Figure 2. Different colors refer to different clusters, and different scenarios with the same color belong to the same cluster.
From the scatter plot, it is observed that the different operational scenarios are well-separated and effectively distinguished by the proposed clustering algorithm, demonstrating the effectiveness of the selection of clustering numbers. This demonstrates that the clustering algorithm can successfully identify and extract typical operational scenarios, allowing for a clear visualization of the distribution of different scenarios.
4.1.3. Clustered Results Analysis
The clustering results of typical solar–wind–load are shown in
Figure 3, demonstrating that the ESS should adapt to different scenarios of solar–wind–load.
Figure 3 shows the typical scenarios, where energy storage will have different impacts. For the row 1 and column 1 part of
Figure 3, the solar and wind power show complementary feature, and energy storage will absorb the excess power when load is low. For the row 2 and column 1 part of
Figure 3, the solar and wind power show similar features, and the energy storage will release the stored power when the load is high. The key analysis is based on the different change trends of solar, wind, and load profiles, where energy storage can bridge the gap.
The above typical scenarios imply the different operation mismatching of solar, wind, and load. Energy storage takes the role of enabler to achieve the balance between sustainable energy supply and demand.
4.2. Optimization Results Analysis
4.2.1. Deterministic Optimization
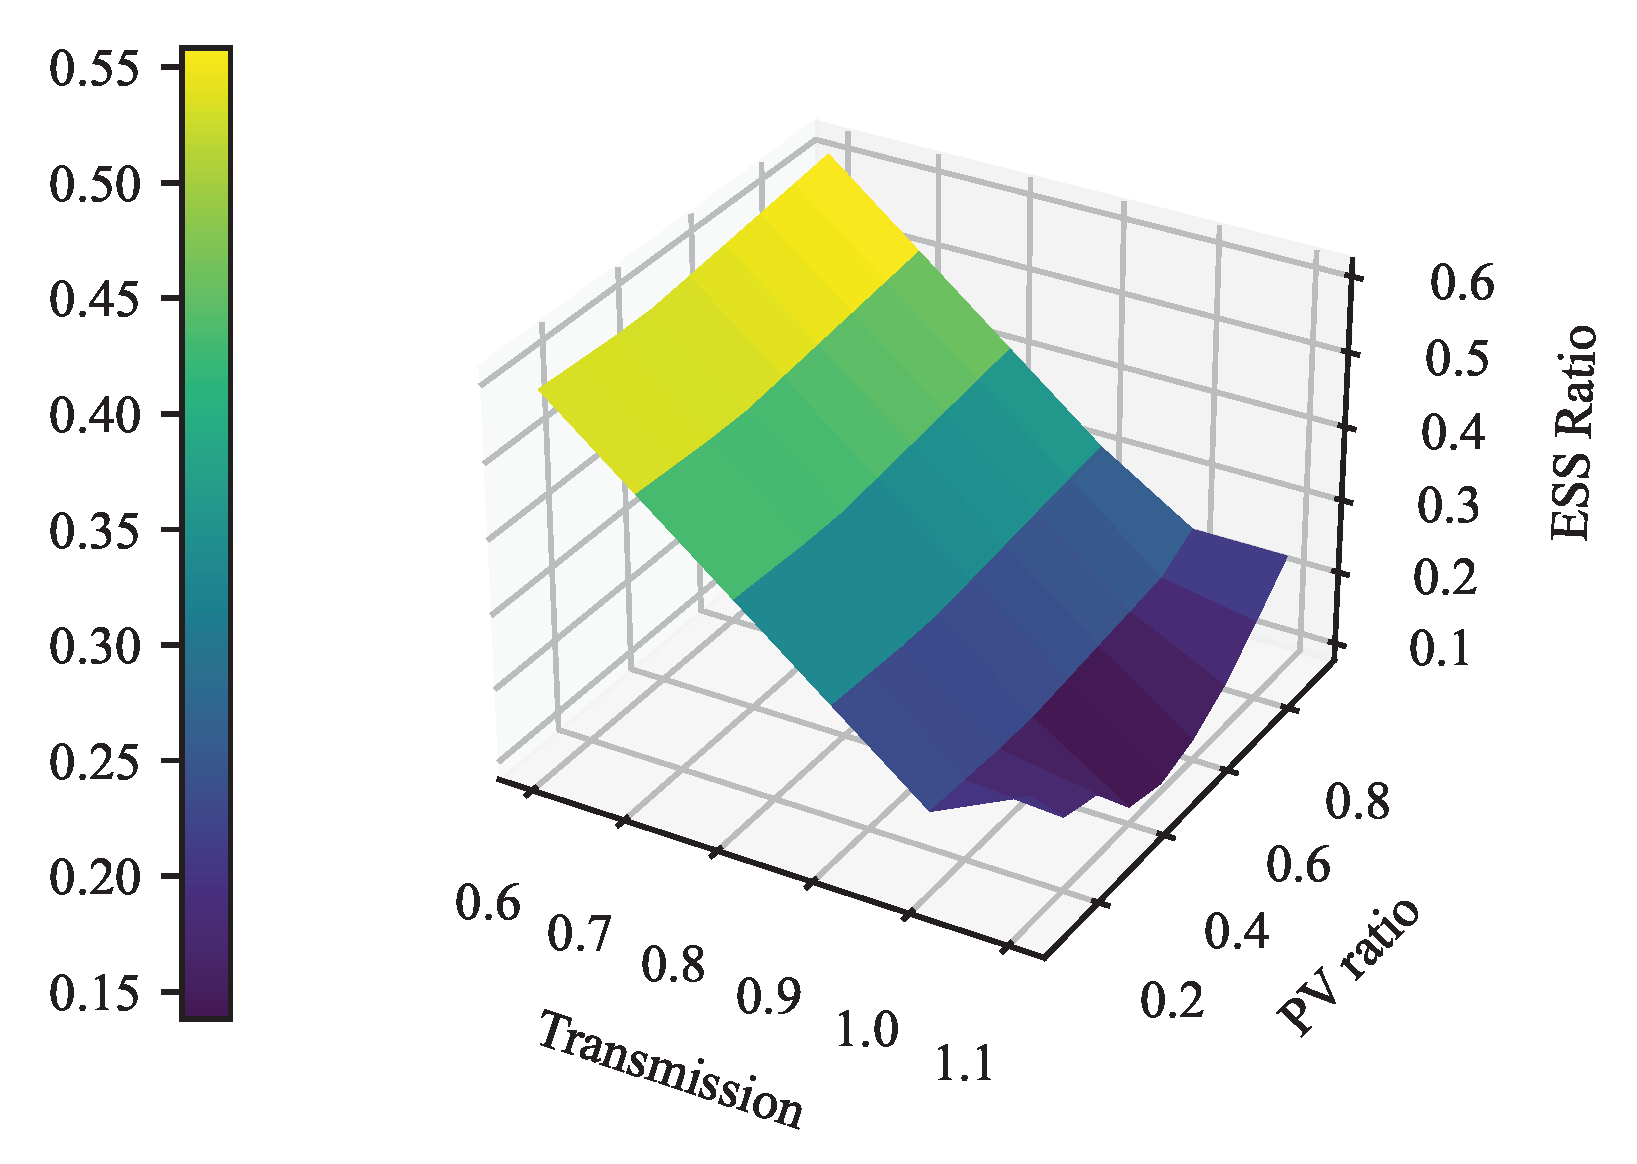
Based on the typical scenarios obtained from the clustering analysis of wind–solar–load data, this study investigates the impact of different wind–solar ratios, allowable wind–solar operational volatility, and transmission channel capacities on the installation capacity of energy storage. Specifically, the study analyzes how varying the proportion of wind and solar energy in the mix affects the required capacity of energy storage. Additionally, different levels of wind and solar operational volatility are considered to assess their influence on the energy storage capacity requirements. Moreover, the study examines the effect of different transmission channel capacities on the installation capacity of energy storage. By exploring these different factors, the research aims to optimize the configuration of energy storage in relation to wind and solar energy, taking into account various operational conditions and transmission constraints, which will ultimately contribute to enhancing the integration and utilization of renewable energy in the power system in
Figure 4.
As shown in the above
Figure 4, with the increase in the transmission capacity, the ESS requirement reduces correspondingly. Because the transmission capacity can bear more renewables’ variability. The cost of the transmission capacity expansion and energy storage installation should be a trade-off for the stakeholders and the policy makers.
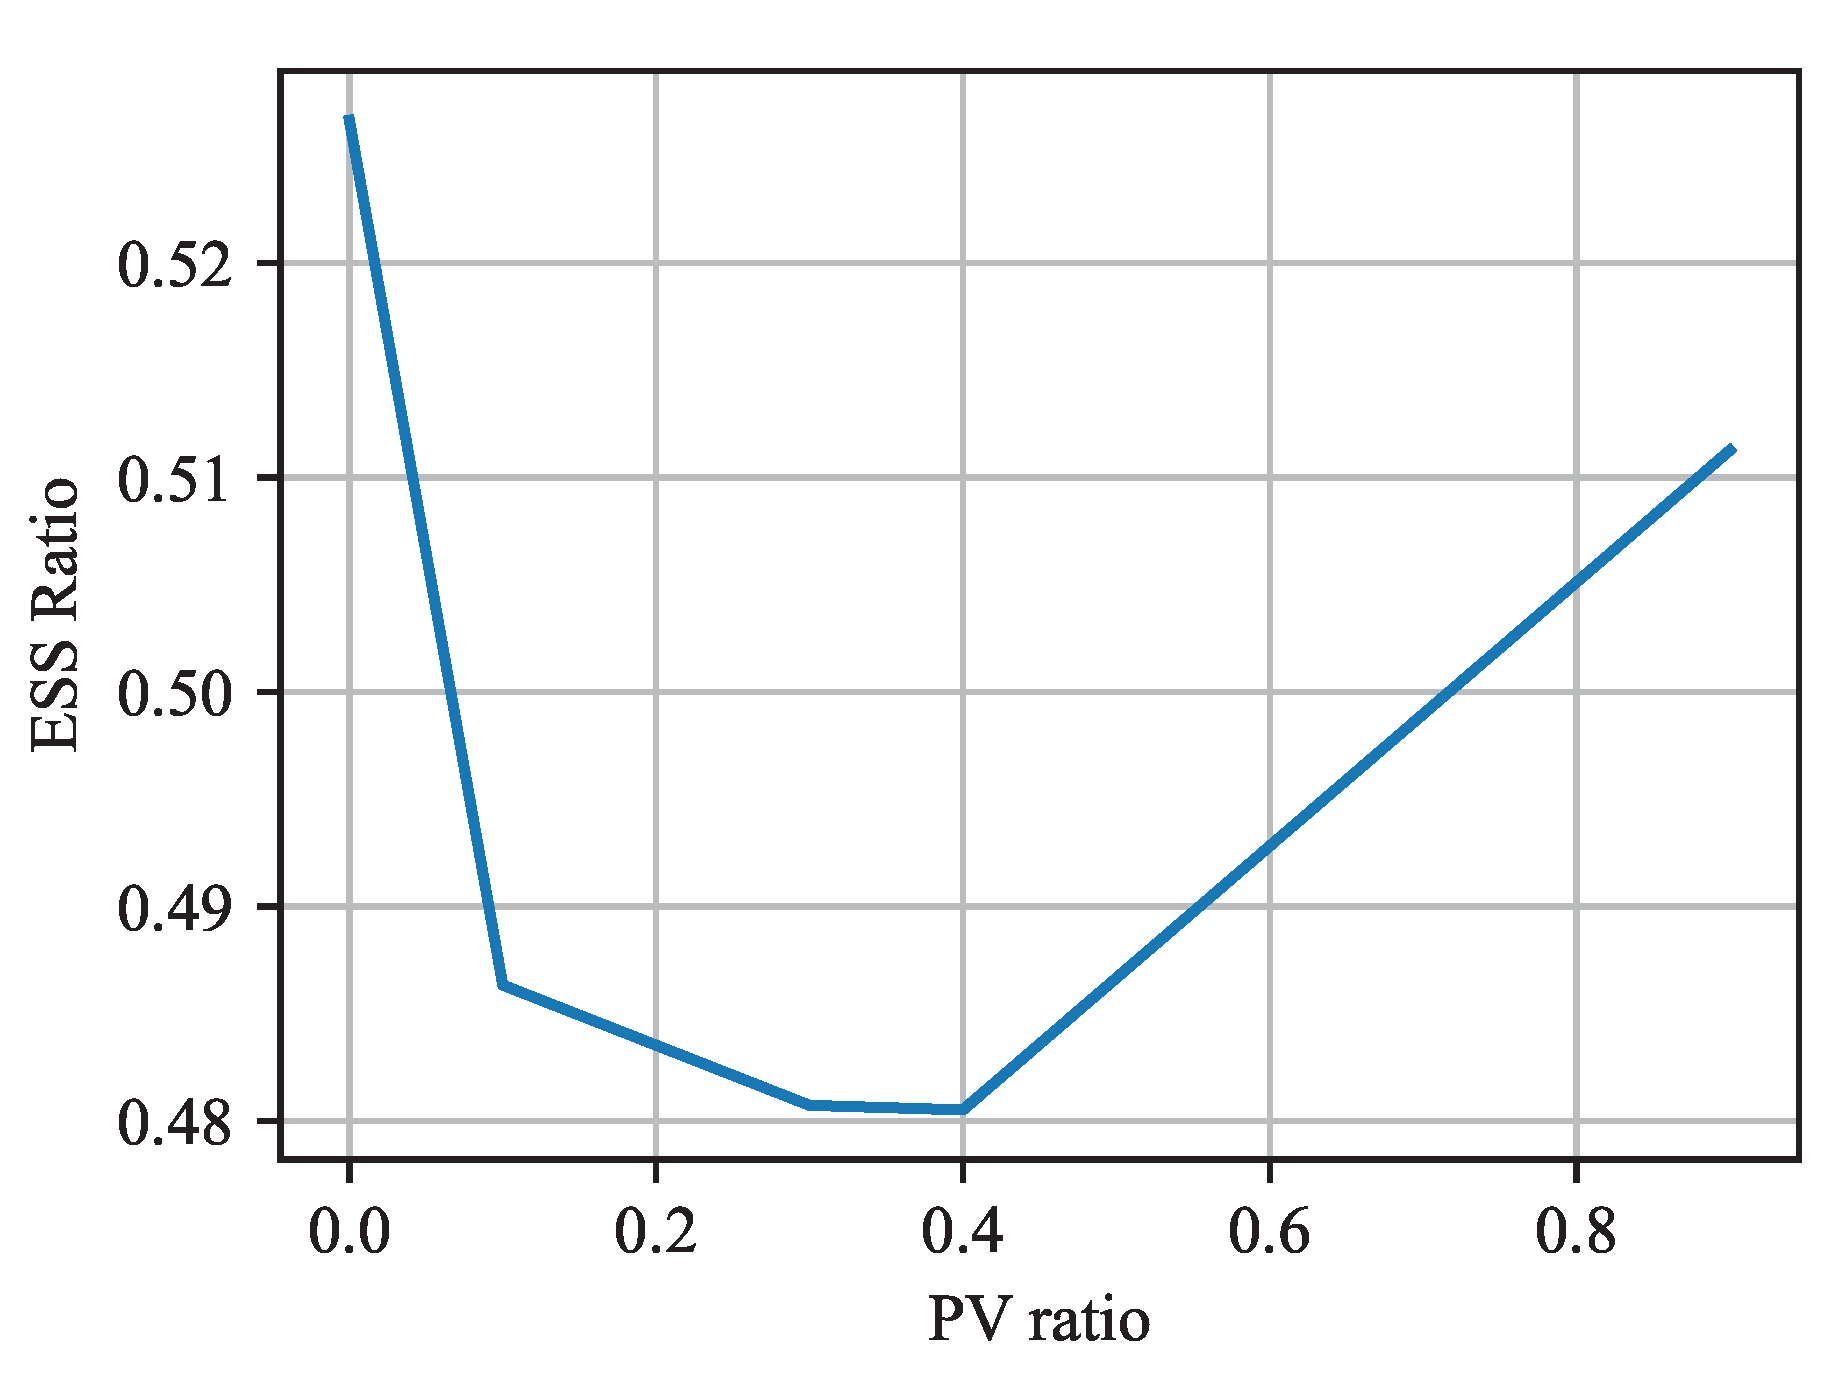
Table 1 further presents the different ESS ratios under different transmission and PV ratios for numerical analysis, where ESS ratio refers to the ratio of ESS capacity to renewable capacity. Under the same transmission capacity, with the increase in PV ratio from 0.1 to 0.9, the requirement of ESS reduces from 0.186343 to 0.180739 and then increases from 0.1807390 to 0.232541, where a lower ESS ratio implies more solar–wind–demand coordination. It demonstrates the requirement of ESS relies on the PV ratio. And with the increase in transmission capacity from 0.9 to 1.1, the ESS ratio reduces from 0.280739 to 0.160909, implying the benefits of transmission capacity expansion. It means that more installation of the energy storage will not need a high transmission capacity to reduce the corresponding construction cost.
When fixing the transmission capacity as 1.0, the change of ESS ratio with the PV ratio is shown in
Figure 5, demonstrating the complementary impact of solar and wind on the energy storage.
The key intuition behind the above analysis is as follows. Due to the fluctuation in solar and wind power, the bundled power output of solar and wind could be high at some times and low at other times, but the transmission capacity will limit the high value. Without the energy storage, the excess power is wasted. Energy can absorb the excess power when high to satisfy the transmission capacity and release the stored power when low to flatten the bundled power out, which is the key value of energy storage.
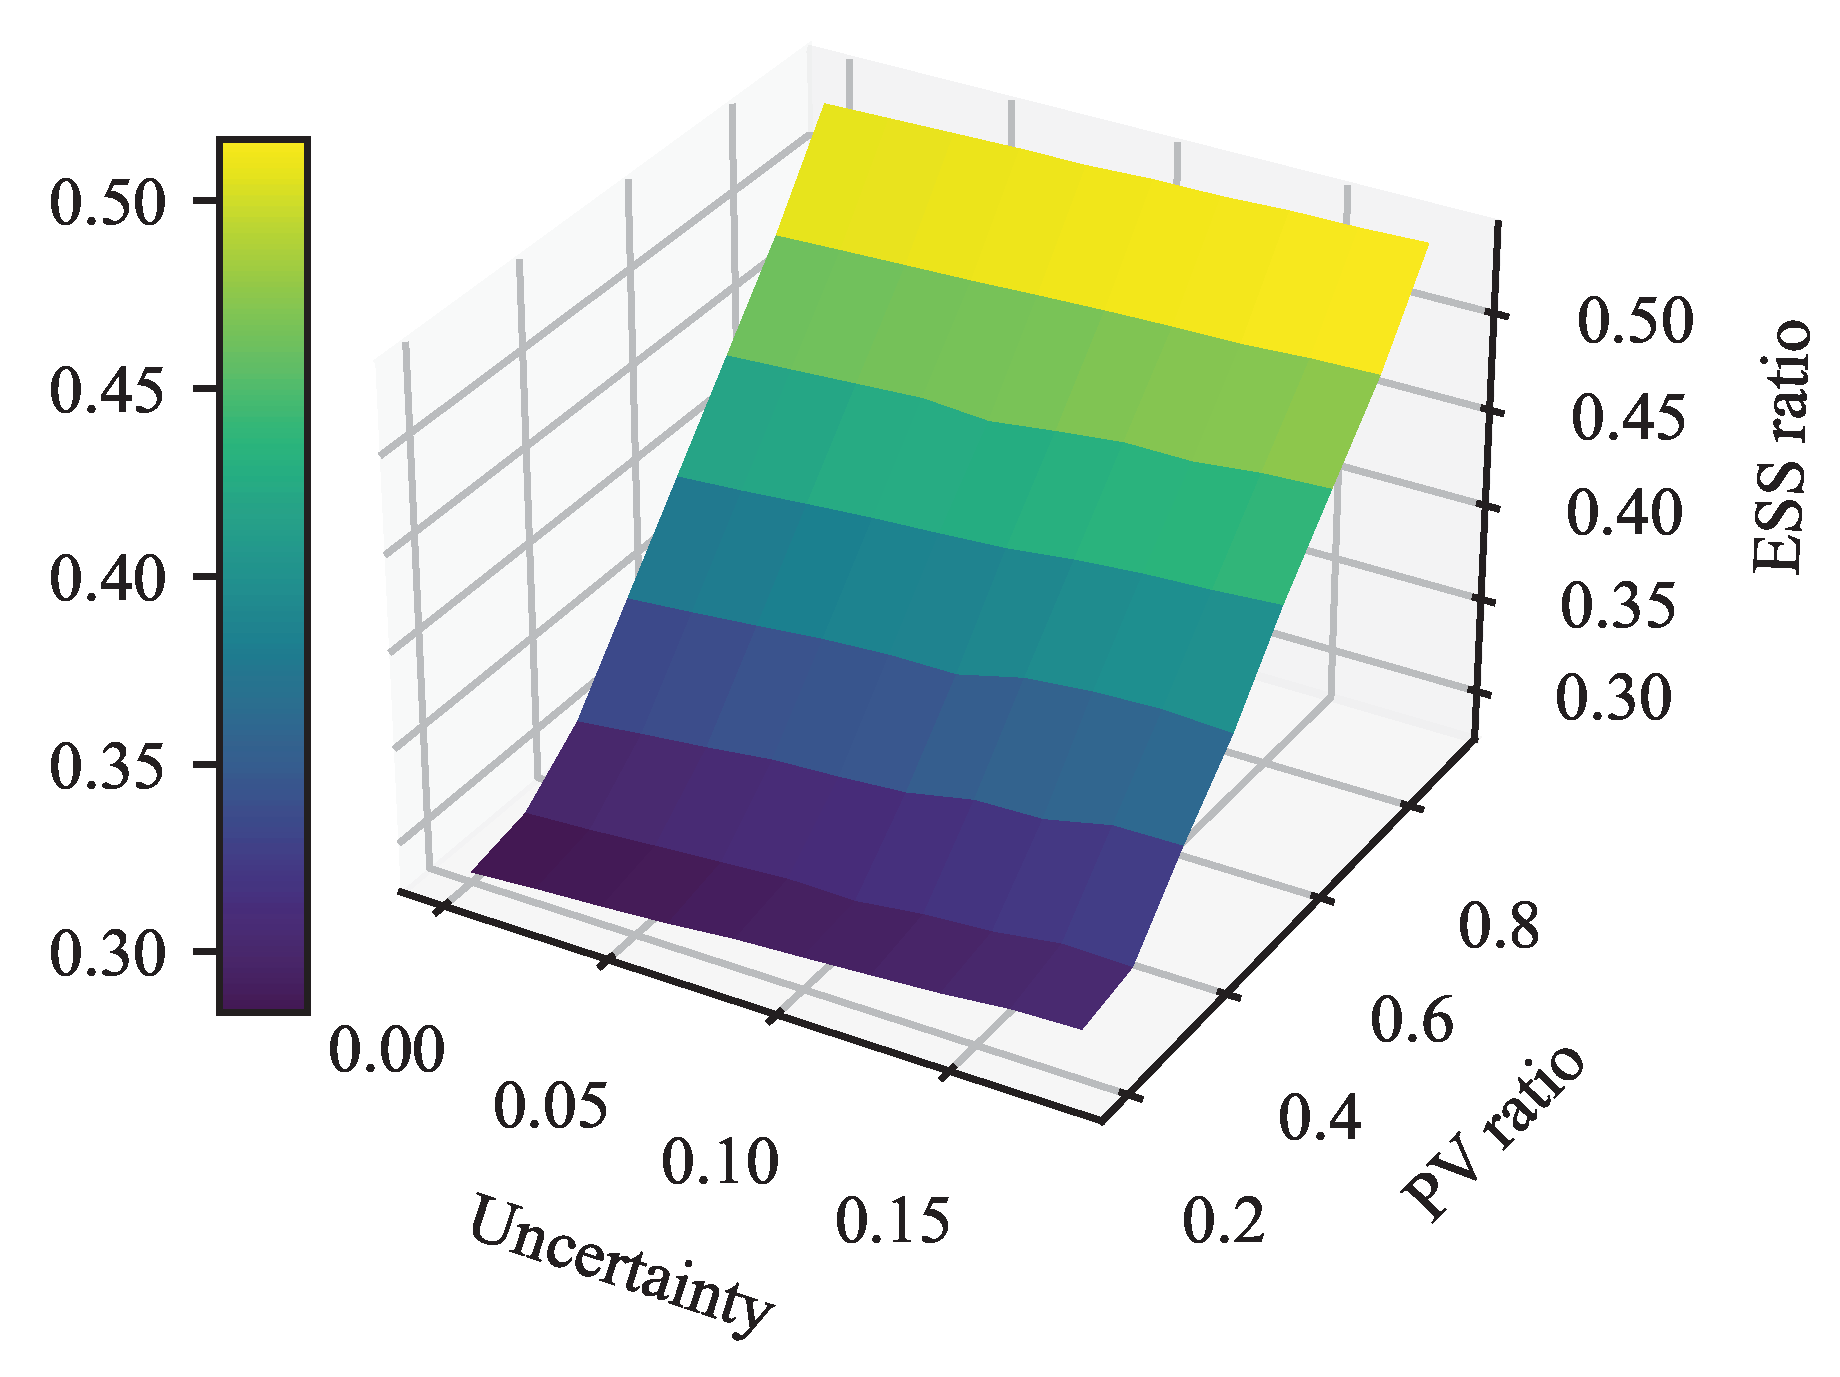
4.2.2. Stochastic Optimization
Based on the above, we further consider the uncertainty of solar–wind–load by the stochastic optimization in
Figure 6.
As shown in
Figure 6, with the increase in uncertainty, the corresponding ESS requirement increases correspondingly.
Table 2 shows the different ESS ratios under different uncertainty and PV ratios under the stochastic optimization approach. Intuitively, more uncertainty renewables will lead to more ESS requirements, which are evaluated numerically in the following
Table 2. With the increase in uncertainty from 0 to 20%, the corresponding ESS requirement increases from 0.311330 to 0.324882 under the same PV ratio.
So, the requirement of ESS for facilitating renewables mainly relies on PV ratio, transmission capacity, and renewable uncertainty, and its numerical requirements are analyzed based on the above experiments.
In summary, this section provides comprehensive analysis to verify the effectiveness of the proposed models from the perspectives of clustering analysis, reduction analysis, sensitivity analysis, and numerical analysis. These results can be leveraged by the corresponding stakeholders and policy makers to support the low-carbon energy society transformation of the northeast area by leveraging the enabler of the energy storage values.
5. Conclusions
As wind and solar power gradually take on a higher proportion in the power supply system, their strong intermittency poses challenges in directly bundling and supplying stable electricity to the external grid. Therefore, this study focuses on investigating the optimal configuration strategy of using energy storage to support the bundled output of wind and solar energy, aiming to achieve stable external supply. By leveraging the regulation capabilities of energy storage, the study aims to achieve a stable bundled output of wind, solar, and storage energy to the external grid. The study first employs the KMEANS++ algorithm to extract typical days from the wind–solar–load data. The optimal number of clusters is determined based on the SSE and t-SNE algorithms. Using the extracted typical days, the study formulates a planning model for the external output of wind, solar, and storage energy, with a focus on the energy storage capacity required per unit of wind and solar power. The research analyzes the impact of different photovoltaic ratios, allowable operational volatility, and transmission channel capacities on the required energy storage capacity. Through experimentation, the study plans the energy storage capacity for different scenarios.
The findings highlight that energy storage is a crucial means to achieve stable bundled output of wind and solar energy to the external grid, making it a vital pathway to achieving “carbon neutrality” and “carbon peaking”. By optimizing the configuration of energy storage in relation to wind and solar energy, the study aims to contribute to the effective integration and utilization of renewable energy, supporting the broader goals of carbon reduction and sustainable energy development.


