1. Introduction
As the demand for natural gas in China continues to grow, the domestic natural gas production capacity fails to meet the current needs. Therefore, identifying the primary controlling factors affecting coalbed methane (CBM) production capacity and enhancing CBM production has become increasingly crucial. In the analysis of CBM production capacity, previous research primarily considered a comprehensive range of factors, such as geological parameters, reservoir fracturing and construction parameters, and drainage and production work systems, to determine the principal factors influencing production capacity [
1,
2]. Some studies have also conducted in-depth analyses of geological parameters, including structural characteristics, stress distribution, and hydrological features, and their relationships with CBM well production to identify favorable development areas [
3,
4,
5,
6]. Furthermore, there have been investigations into the impact of drilling and completion parameters on production capacity, offering theoretical support for optimizing engineering processes [
7]. Simultaneously, long-term field drainage and production practices have analyzed the effects of drainage and production strategies, leading to further optimization in work systems [
8].
Currently, commonly employed methods for evaluating CBM production capacity include numerical simulation, grey relational analysis, production data analysis, and capacity formula approaches [
9,
10]. Numerical simulation techniques occupy a prominent position in development effectiveness assessment, with many scholars conducting diversified numerical simulation studies considering various complex factors in different regions [
11,
12,
13,
14]. However, the numerical simulation process faces challenges due to limited and low-quality well data, considerable uncertainty in reservoir parameters, significant production variations among CBM wells, and difficulties in determining relevant geological parameters for the simulation. Uncertainty analysis of geological factors influencing CBM well production is completed to determine the confidence intervals, which can reduce errors in the numerical simulation process and enhance the accuracy and credibility of development assessments.
Uncertainty analysis of production capacity refers that it generates a series of equiprobable production outcomes through simulation based on the properties and ranges of each parameter while keeping the other variables constant, considering variations in multiple influencing parameters. This process forms production capacity distribution, typically represented in cumulative probability distributions, which range from P10 to P90 (optimistic to pessimistic). The cumulative probability distribution at 50% (i.e., P50) indicates a 50% likelihood of both higher and lower scenarios, making it a situation where simulation results closely align with actual outcomes [
15,
16]. Zhang Lan applied stochastic geological modeling techniques and geological statistics to analyze the patterns and ranges of uncertainty parameters in reservoirs. This research included the statistical analysis of geological reserve distribution and the study of reservoir model uncertainties. Mukerji and his team combined traditional rock physics and geological statistics theories to predict reservoir properties and assessed the uncertainties through multiple outcomes. Han Xueting and colleagues employed a Monte Carlo random sampling method, conducting random sampling within specified parameter ranges and using numerical simulation to analyze the primary controlling factors affecting production capacity. Therefore, it is imperative to quantitatively characterize geological uncertainties in coal reservoirs.
In the study of coal reservoir uncertainties, determining the ranges of relevant geological parameters is a crucial step. Geological modeling techniques are instrumental in this process. The application of three-dimensional geological modeling technology effectively simulates the spatial distribution of geological characteristics in coal reservoirs, thereby yielding insights into the variability of geological parameters. Che et al. were the first to apply the weighted Kriging method to coal seam surface modeling and were able to interpolate data with different uncertainties collected from multiple sources, establishing corresponding coal seam models [
17]. Mark et al., explored the uncertainty modeling problem in integrated geographic information systems (GIS), with a particular focus on the integration activities between GIS and remote sensing, in order to establish more accurate 3D geological models [
18]. Three-dimensional geological modeling can accurately provide the geological model and relatively precise estimations of the distribution ranges of geological parameters, serving as a foundation for subsequent assessment activities. Wu et al. used numerical simulation and economic evaluation methods to evaluate the gas production capacity of multiple coal seams [
19]. When the geological factors of the main coal seams change in the case of multiple coal seam mining, the impact on the gas production and economic benefits of a single well is considered. They believe that gas content and permeability have a significant impact on the production and economic benefits of multiple coal seam mining; Han et al. used numerical simulation methods to simulate and analyze the sensitive factors affecting gas production in the Gujiao block and concluded that gas content, permeability, and Lambert volume have a significant impact on coalbed methane production [
20]. Sujoy et al. investigated six exploration boreholes drilled in the Raniganj Coalfield and used reservoir characterization methods to predict the possible range of changes in factors such as gas content, permeability, and porosity. Three possibilities, high, medium, and low were selected. Based on numerical simulation, factors affecting productivity were analyzed, and it was believed that gas content and permeability were two key factors controlling the production of coalbed methane in the Raniganj Coalfield [
5]. In summary, in previous studies on coalbed methane production capacity, there have been few numerical simulation models, and several numerical data within the selected range have been used for simulation. The trend of each factor on coalbed methane production capacity is not clear. This article aims to use the Monte Carlo module in Comet3 to conduct a large number of continuous simulations of coalbed methane production capacity, clarify the trend of each factor on coalbed methane production capacity, and provide a basis for subsequent research.
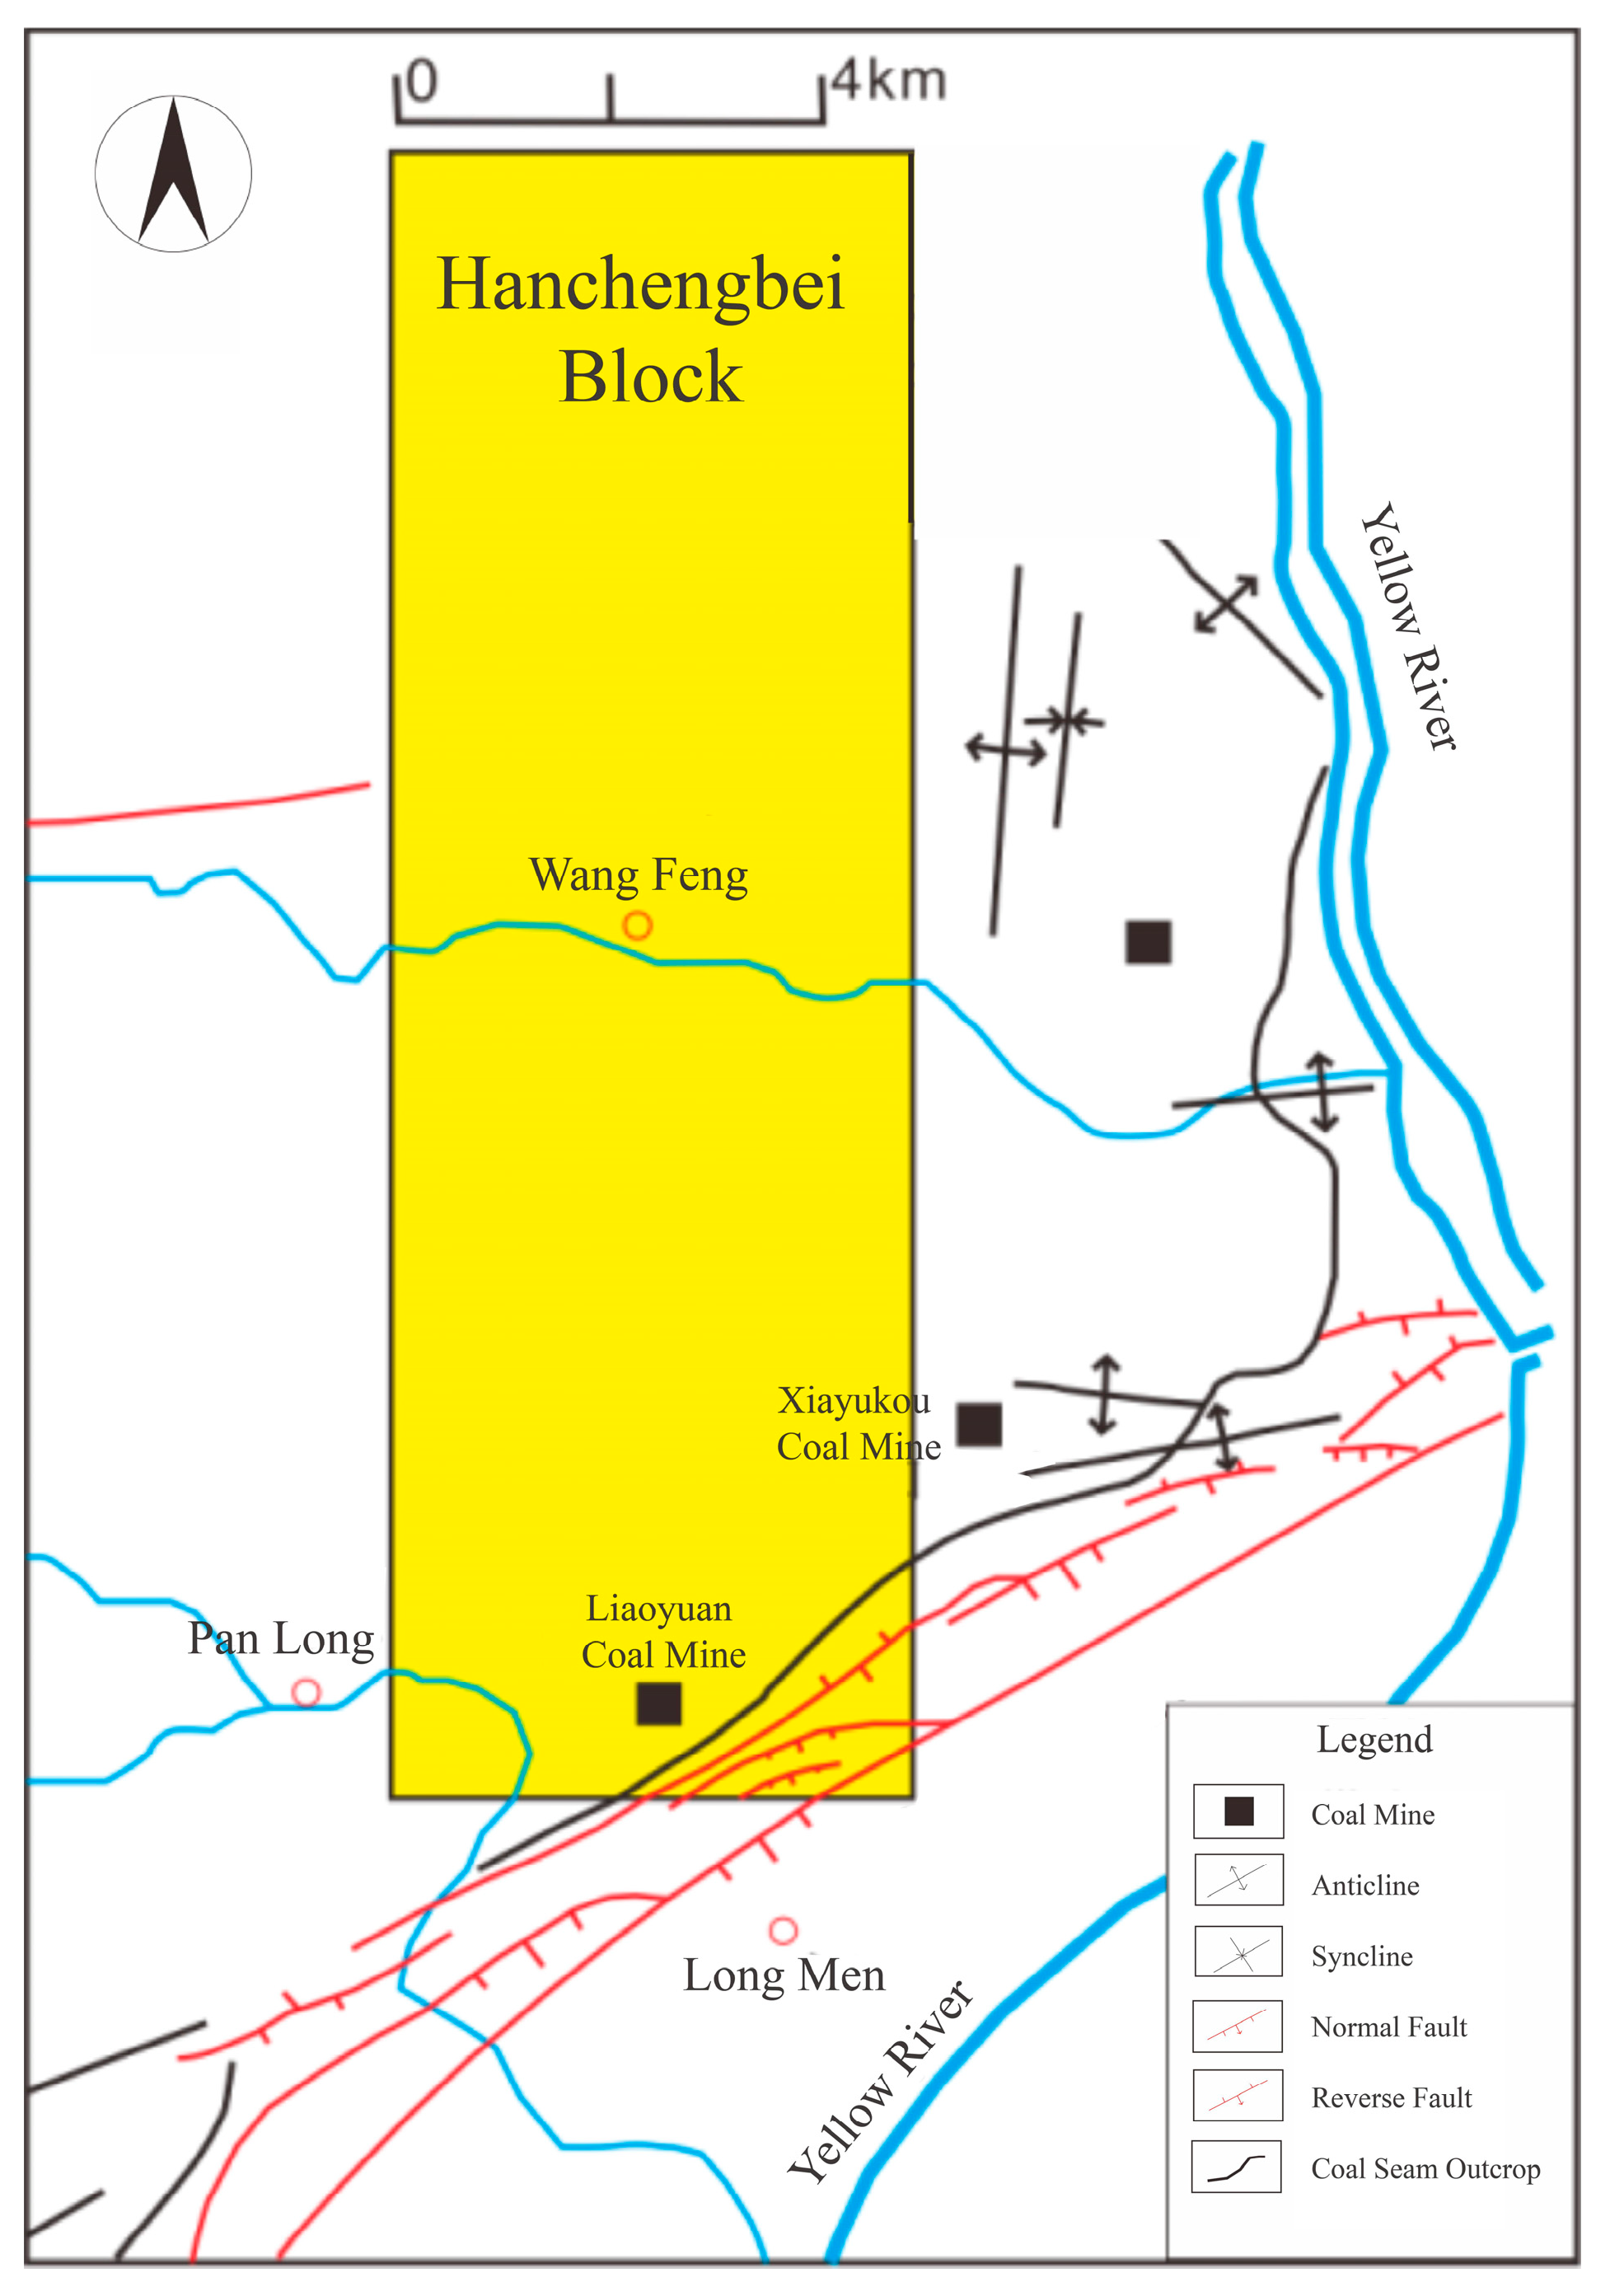
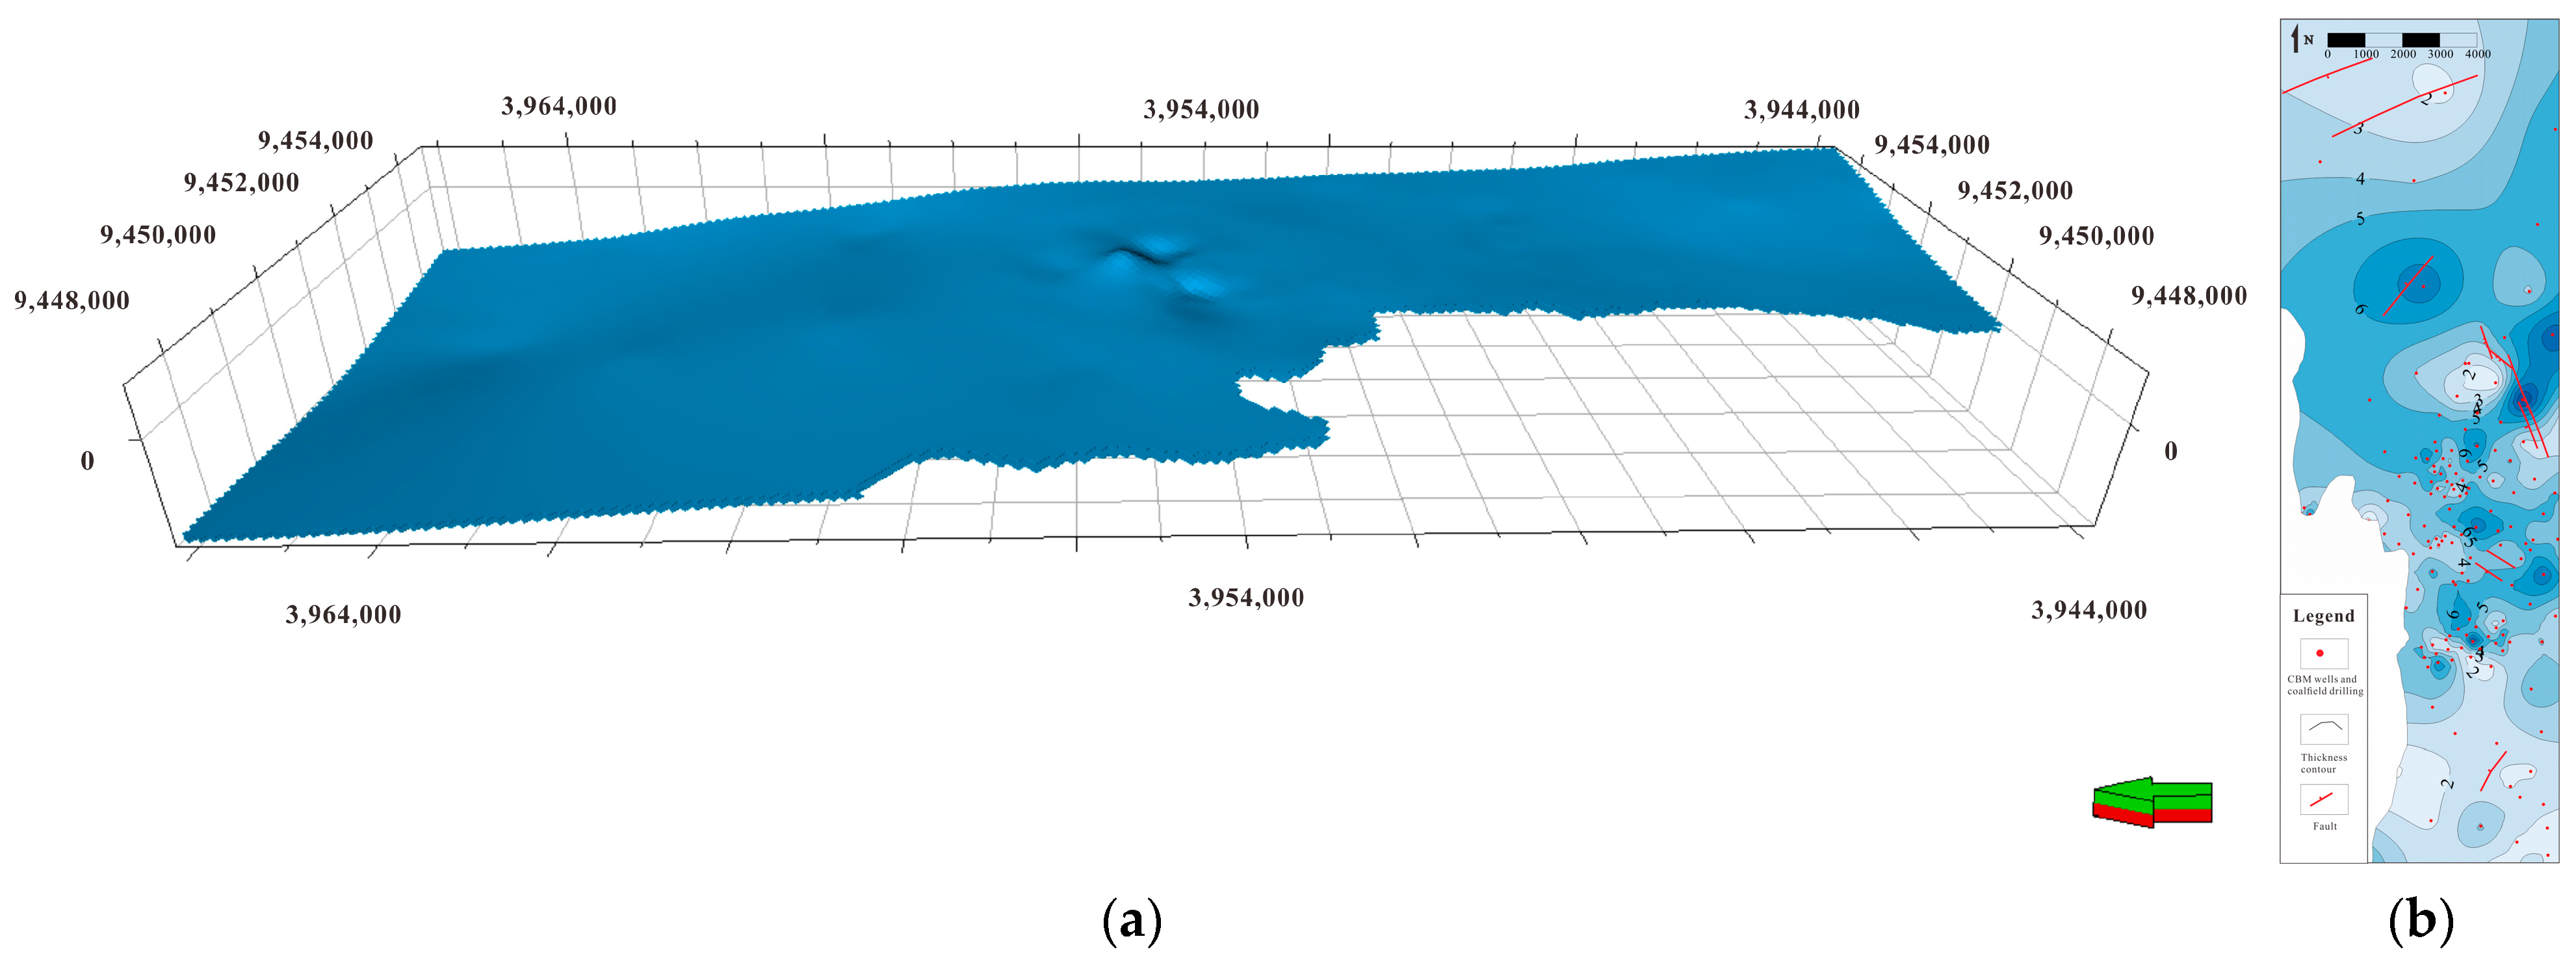
The Hanchengbei lock is situated on the eastern margin of the Ordos Basin and is minimally affected by shallow uplift fault structures, primarily in the southeastern part of the block (
Figure 1). The research area is adjacent to the Yellow River, with rivers passing through the middle. Affected by multiple faults in the southeast, some coal seams are exposed. While there are few fault occurrences, their impact on coal seam distribution and vertical development is limited. The geological structure is relatively straightforward, with the strata sloping higher to the southeast and lower to the northwest, presenting an overall monocline structure. The Hancheng North block primarily consists of coal-bearing strata from the Shanxi Formation and Taiyuan Formation. Among these, the No. 5 coal seam in the Shanxi Formation and the No. 11 coal seam in the Taiyuan Formation, due to their stable development and considerable thickness across the entire region, are the main exploration and development horizons within the study area.
The Hanchengbei Block is currently in its initial development stage, having completed preliminary exploration and some trial production activities. At present, the block comprises 30 trial production wells, during which certain issues have been identified. These include lower single-well production rates and significant variations in production rates among wells within the same well group. Additionally, the limited number of trial parameter wells are mostly concentrated in the central part of the block, resulting in greater uncertainty in reservoir parameters. Furthermore, significant disparities exist in the quantity of different geological data, such as coal seam thickness data being more abundant than gas content test data. Hence, our proposed study focuses on quantitatively characterizing the uncertainty of geological parameters in the study area’s coal reservoirs and addresses the two key issues: assessing the uncertainty of geological parameters and evaluating the impact of geological uncertainties on coalbed methane production capacity.
To address the critical challenges faced in the study area’s development, and based on existing exploration and testing results, the research is conducted on reservoir heterogeneity and selected as the primary sources of uncertainty in geological modeling. The research carries out three-dimensional geological modeling using stochastic modeling techniques, establishing corresponding attribute models. Based on the modeling results, probability distribution graphs are created, and a quantitative characterization method for the geological uncertainty of coal reservoir parameters is proposed. The research analyzes the effective value ranges for various factors within the study area, specifically their impact on coalbed methane production capacity. Through numerical simulation methods, the influence of coal seam thickness, gas content, and permeability on coalbed methane production are assessed. Subsequently, the study developes a quantitative evaluation model for coalbed methane production capacity under conditions of uncertainty. Normalization is employed to investigate the impact of the parameters within their varying ranges on coalbed methane production capacity, thereby providing valuable insights for future development activities.
2. Research Content and Methodology
2.1. 3D Geological Modeling
Three-dimensional geological modeling involves using computer technology and modeling software to construct reservoir models with specific accuracy [
21,
22]. The analysis of the internal structure of the reservoir reveals the three-dimensional distribution characteristics and patterns of attributes such as lithology and physical properties, providing the foundation for subsequent numerical simulations of production capacity. Structural modeling serves as the basis for three-dimensional geological modeling, primarily reflecting the spatial morphology and structure of coal reservoirs. Its establishment relies on well logging stratigraphic data and uses an isochronous stratigraphic framework as a macro constraint. Fault models, on the other hand, are based on fault point data and are constructed incrementally through the step-by-step delineation and building of points, lines, and surfaces, forming a graded structural model [
23]. To obtain precise attribute models for the study area, it is necessary to consider a variety of factors, including the area and coal seam distribution characteristics within the study area. For reservoir modeling in this study, we primarily utilized Petrel software.
Structural modeling serves as a vital foundation for three-dimensional geological modeling, with its core objective being the representation of the spatial distribution of coal reservoirs, while also reflecting the internal reservoir morphology [
24]. The process of establishing a structural model comprises three key components: the fault model, the stratigraphic model, and data gridding. In the Hanchengbei Block, the degree of fault development is not substantial and is mostly limited to small faults, resulting in a relatively minimal impact on the coal seams. Therefore, for this context, we primarily utilize stratigraphic modeling. Leveraging seismic interpretation results and stratigraphic data identified and divided through well logging, we employ Kriging interpolation to obtain stratigraphic data. This method allows us to successfully construct stratigraphic models for the No. 5 and No. 11 coal seams within the Hanchengbei Block [
17].
The primary process of constructing attribute models involves inputting interpreted physical property data, conducting data coarsening, performing variogram analysis on the data, and establishing a three-dimensional physical property model with the structural model framework and coal body structure as constraint conditions. In this paper, we used physical property data that corresponded one-to-one with well data as a foundation. This data was input into Petrel software, where we carried out coarsening and variogram analysis of the physical property curves, eliminated outliers and built the coal seam physical property model within the study area.
Upon completing the three-dimensional geological modeling, it is essential to validate the geological model to assess its consistency with traditional geological understanding. In this paper, the resource quantity comparison method was employed, where the resource estimates obtained from the three-dimensional geological model were compared with those derived from the traditional volumetric method. If the discrepancies fall within an acceptable range, it is considered that the geological model is scientifically valid.
2.2. Reservoir Parameter Uncertainty Intervals
At present, various common solutions for handling uncertain parameters include Monte Carlo simulation, Box–Behnken experimental design, the central composite design, and various other methods. Monte Carlo simulation, as a stochastic sampling technique, involves random selection within defined parameter ranges. Monte Carlo simulation has found widespread application in estimating coalbed methane reserves. In this study, we used the Monte Carlo method to simulate values for reservoir parameters and conducted an in-depth analysis of the influence of these parameters on coalbed methane production capacity [
25].
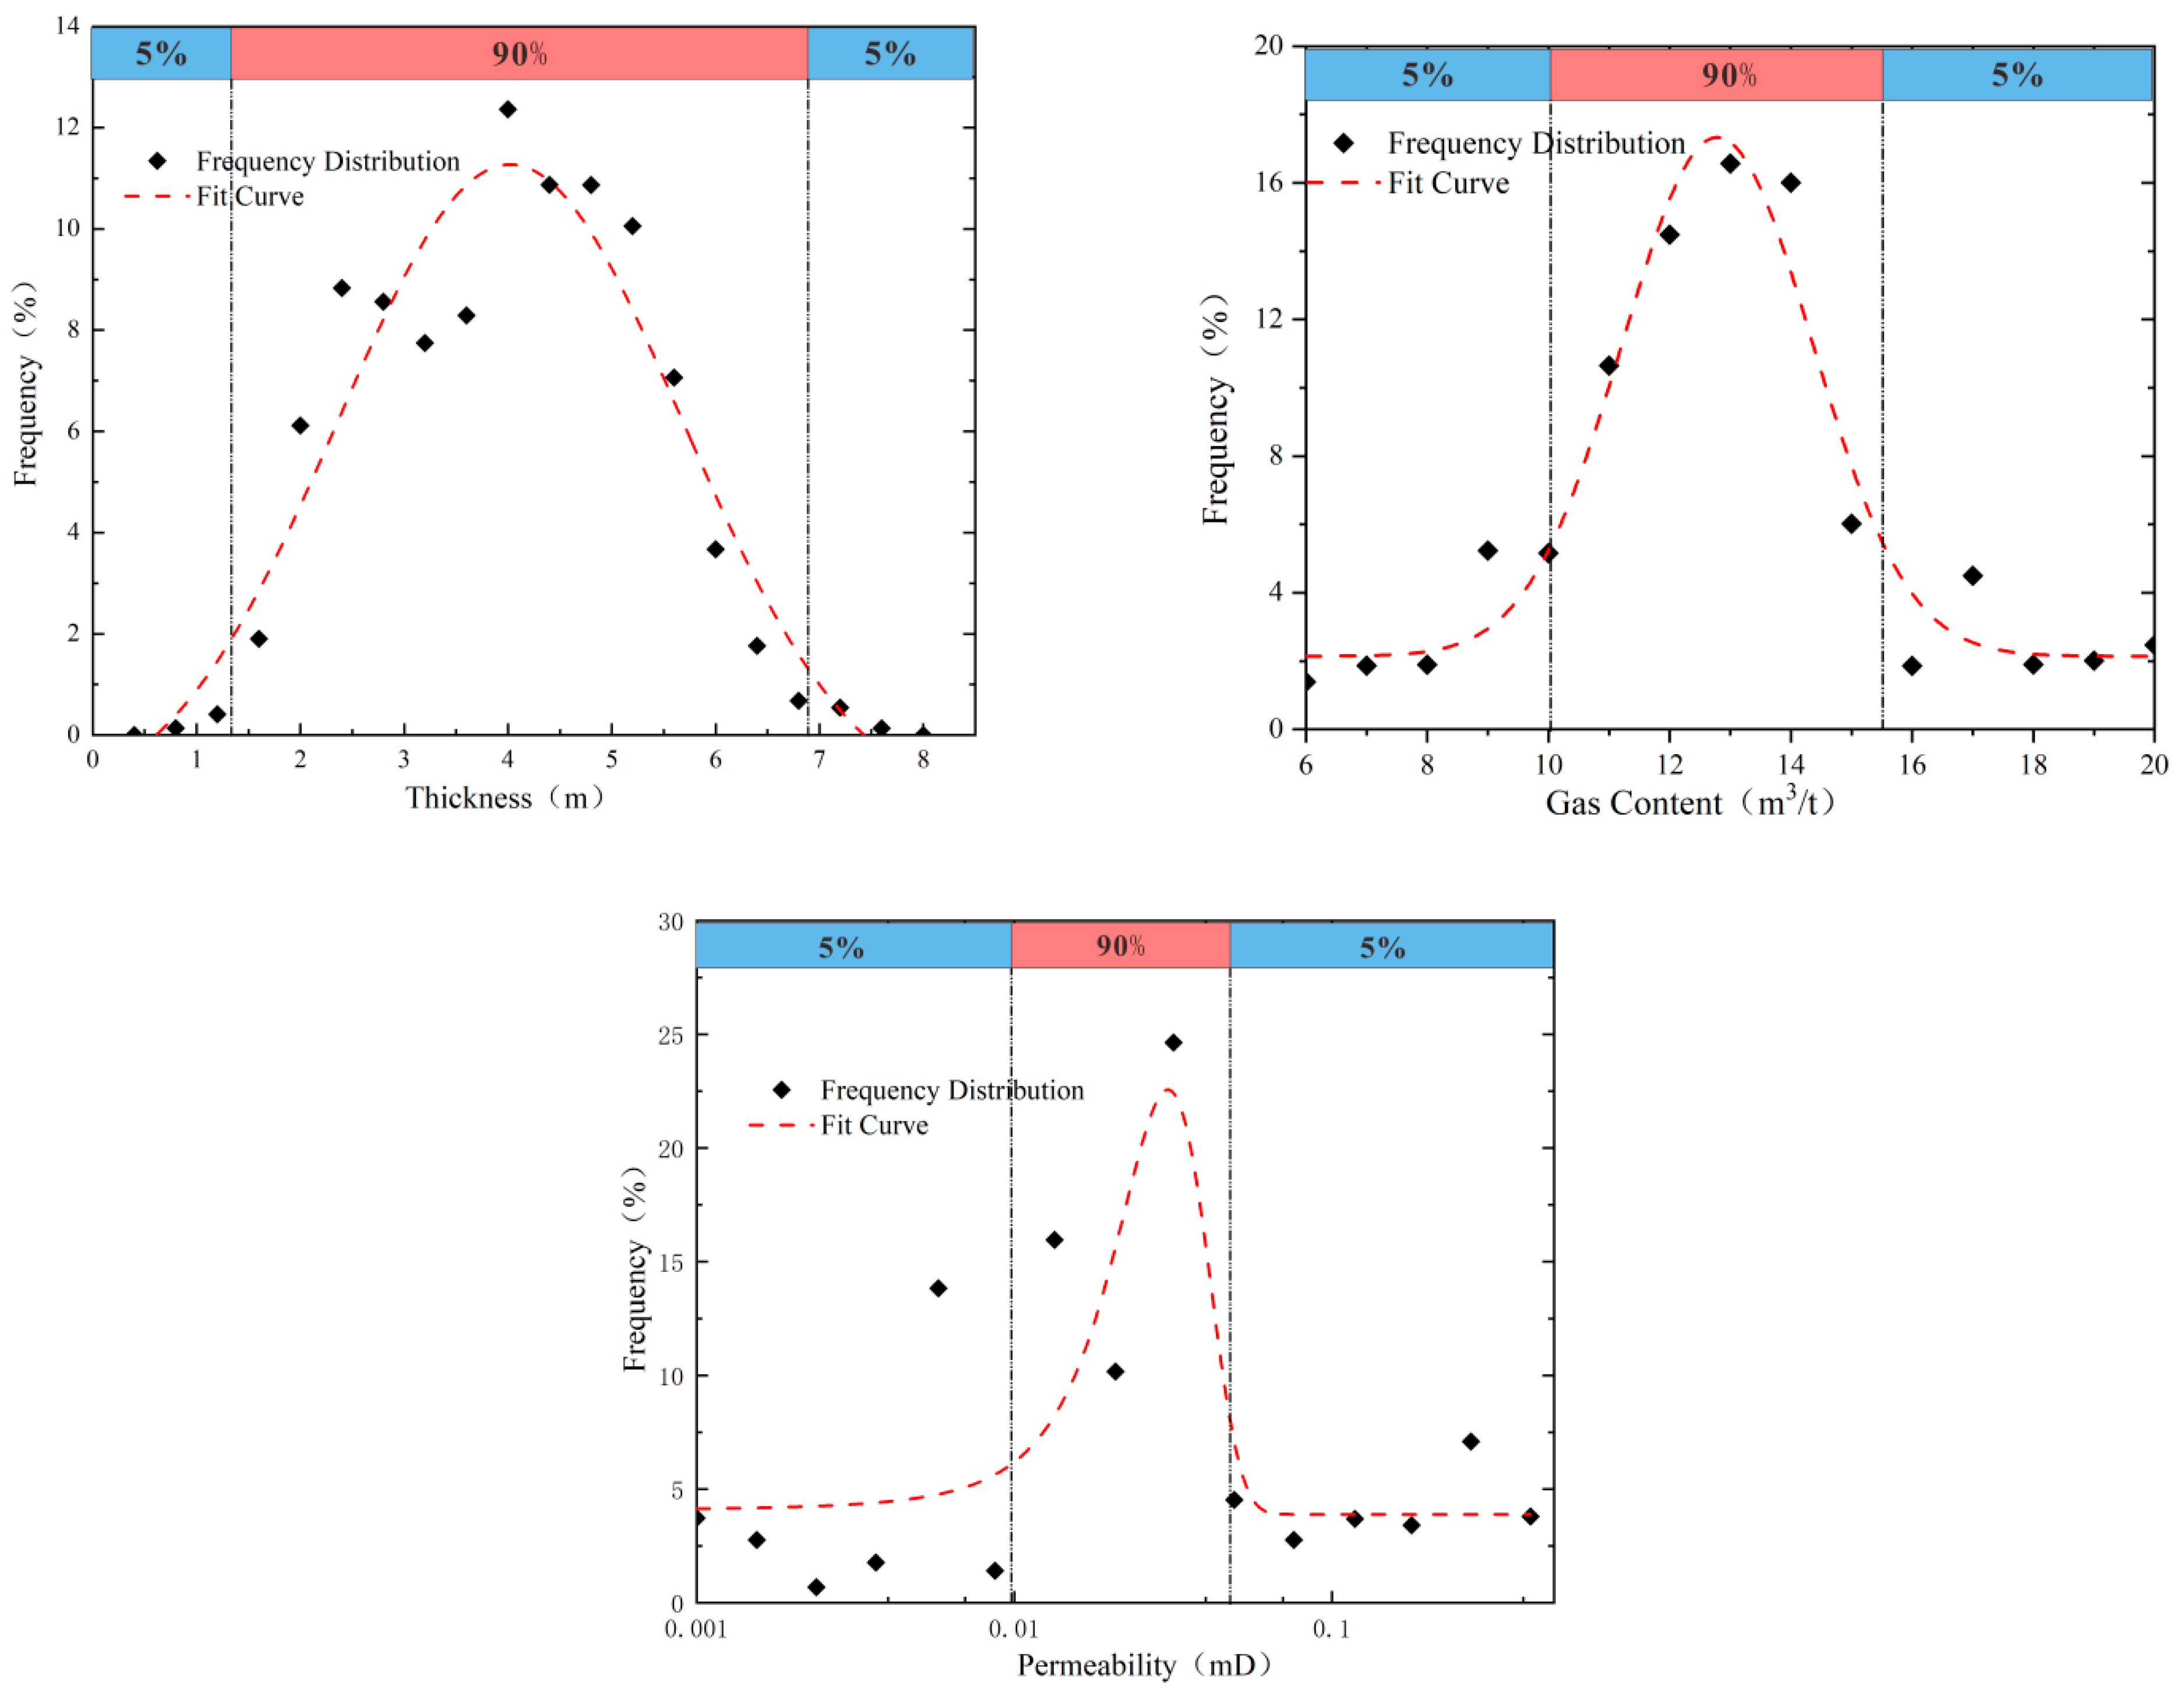
Based on the results of three-dimensional geological modeling, the distribution ranges of reservoir parameters within the block are determined. By employing principles of geological statistics, probability distribution graphs are constructed. Subsequently, through curve fitting, the variation range of coal reservoir parameters is obtained. This process helps establish the uncertainty intervals for coal reservoir parameters. The specific workflow is as follows:
Based on the three-dimensional modeling results, the parameter distribution ranges are extracted. Scatterplots are constructed, and using the extracted data, frequency distribution scatterplots are generated. Curve fitting is then applied. Given that sequential Gaussian simulation was used in the modeling, the distribution of reservoir parameters in the study area follows a normal distribution. Hence, Gaussian fitting is used for curve fitting. The uncertainty intervals are derived by selecting the range between P5 and P95 within the parameter range, as determined by the fitting equation. These intervals are considered the uncertainty intervals for reservoir parameters and are used in subsequent simulation work.
Based on existing data in the study area and prior research findings, this study will simulate the resource status, development conditions, and the sensitivity of coalbed methane production capacity to coal seam gas content factors. Subsequently, three parameters will be selected for in-depth investigation: coal seam thickness, permeability, and gas content.
2.3. Numerical Simulation of Coalbed Methane
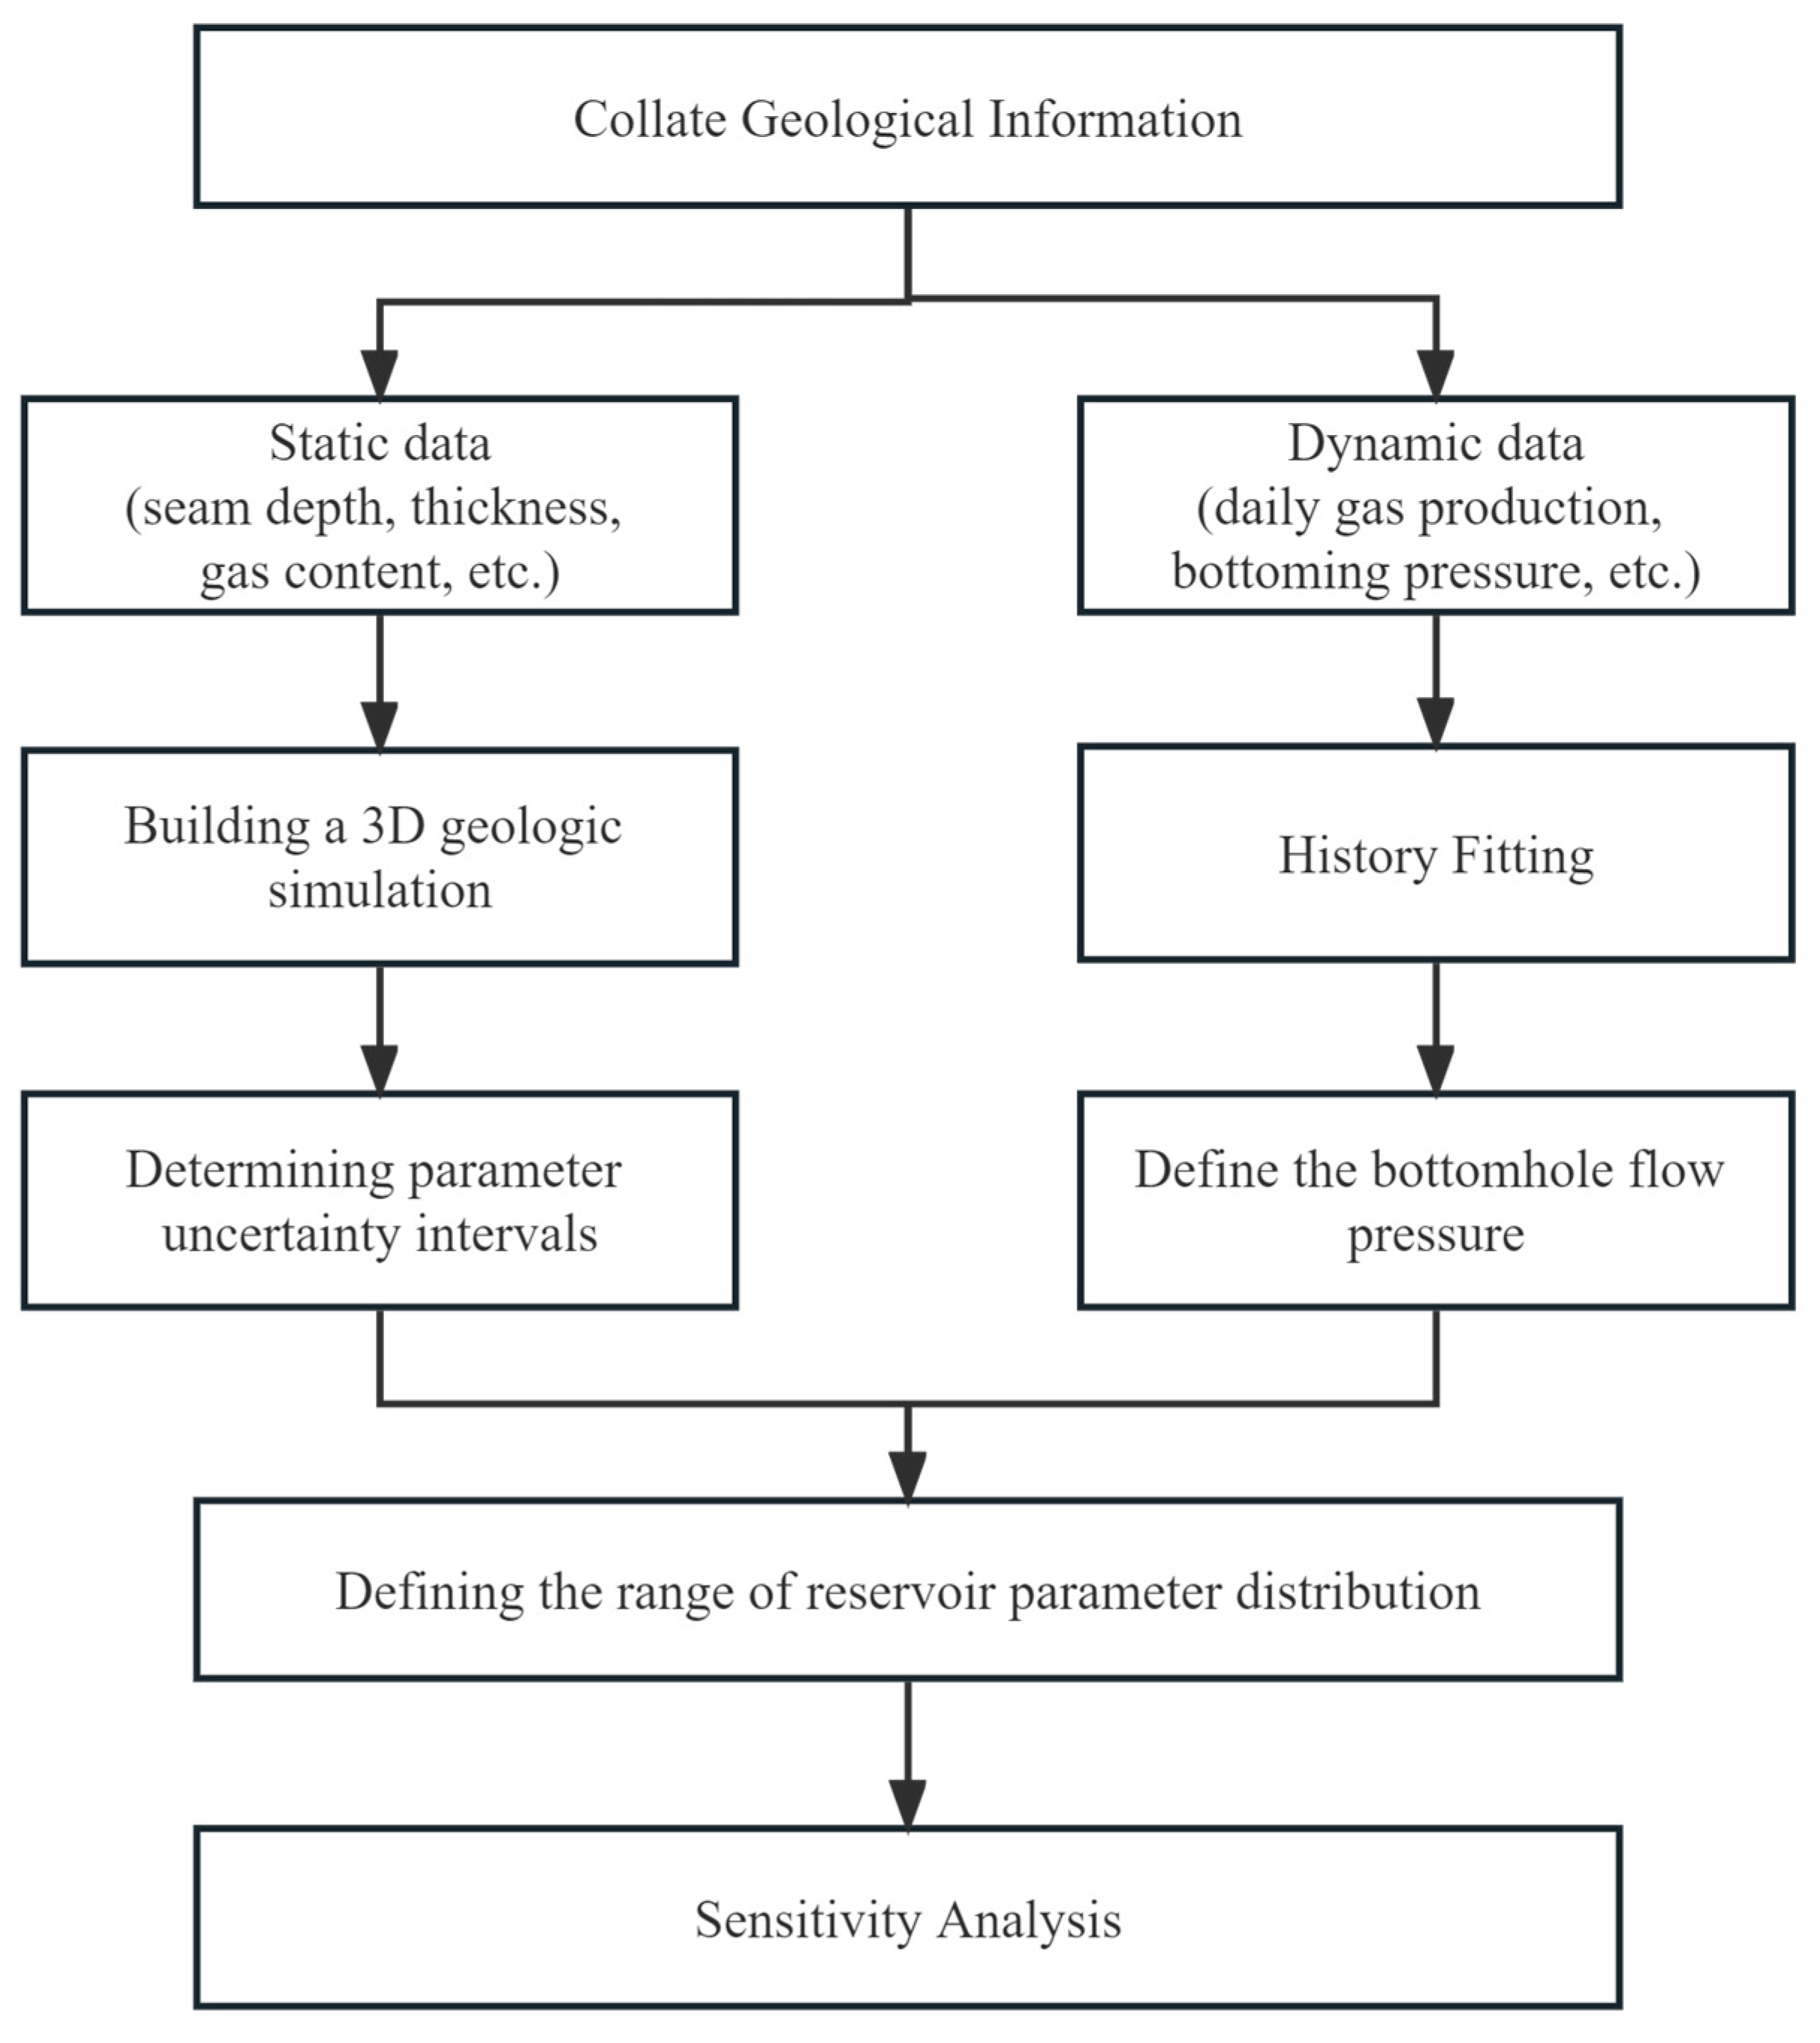
Coalbed methane production capacity simulation is a vital method for evaluating the effectiveness of coalbed methane development and analyzing the factors that impact coalbed methane production. In this simulation, we employed the coalbed methane numerical simulation software Comet3 [
26,
27]. We used a coal reservoir model with dual porosity, single permeability, two-phase, and single-component adsorption. The software’s internal Monte Carlo simulation module was used to analyze the primary controlling factors influencing coalbed methane production. The workflow is as follows (
Figure 2):
Model Construction: Based on the available data from the test production wells within the study area, a grid is created, defining the control area for individual wells. Using coalbed methane exploration data, the necessary parameters for the simulation are obtained and imported as geological parameters.
Historical Fitting: In this simulation, the method employed involves fitting gas production to bottomhole pressure at specific wells. Historical drainage data is used for simulation. By fitting it to the gas production curve, adjustments are made to match the simulated curve with the actual production curve.
Production Capacity Prediction: Building on the fitted parameters, production capacity is simulated and predicted by extending the drainage time.
Parameter Configuration: Based on the reservoir parameter distribution functions obtained from the previous fitting, parameter distribution ranges are established, simulation frequencies are set, and the simulation results are generated.
3. Results and Discussion
3.1. 3D Geological Modeling of Coal Reservoirs
For reservoir modeling in this study, we primarily utilized Petrel software. Taking into account the test production data within the study area, geological, drilling, well logging, and sample testing data were input and transformed into data formats compatible with the software. The 3D geological modeling results mainly include structural models and attribute models. According to the layer model obtained in the early stage, with the well layered data as the constraint, select the grid with appropriate size and orientation, and establish the structural model. On this basis, according to the logging interpretation data, the coal reservoir attribute model is established. Specific data statistics are outlined in the table. We established structural and attribute models for the No. 5 and No. 11 coal seams within the study area, of which the attribute model includes gas content model and permeability model, totaling four models.
3.1.1. Constructive Modeling
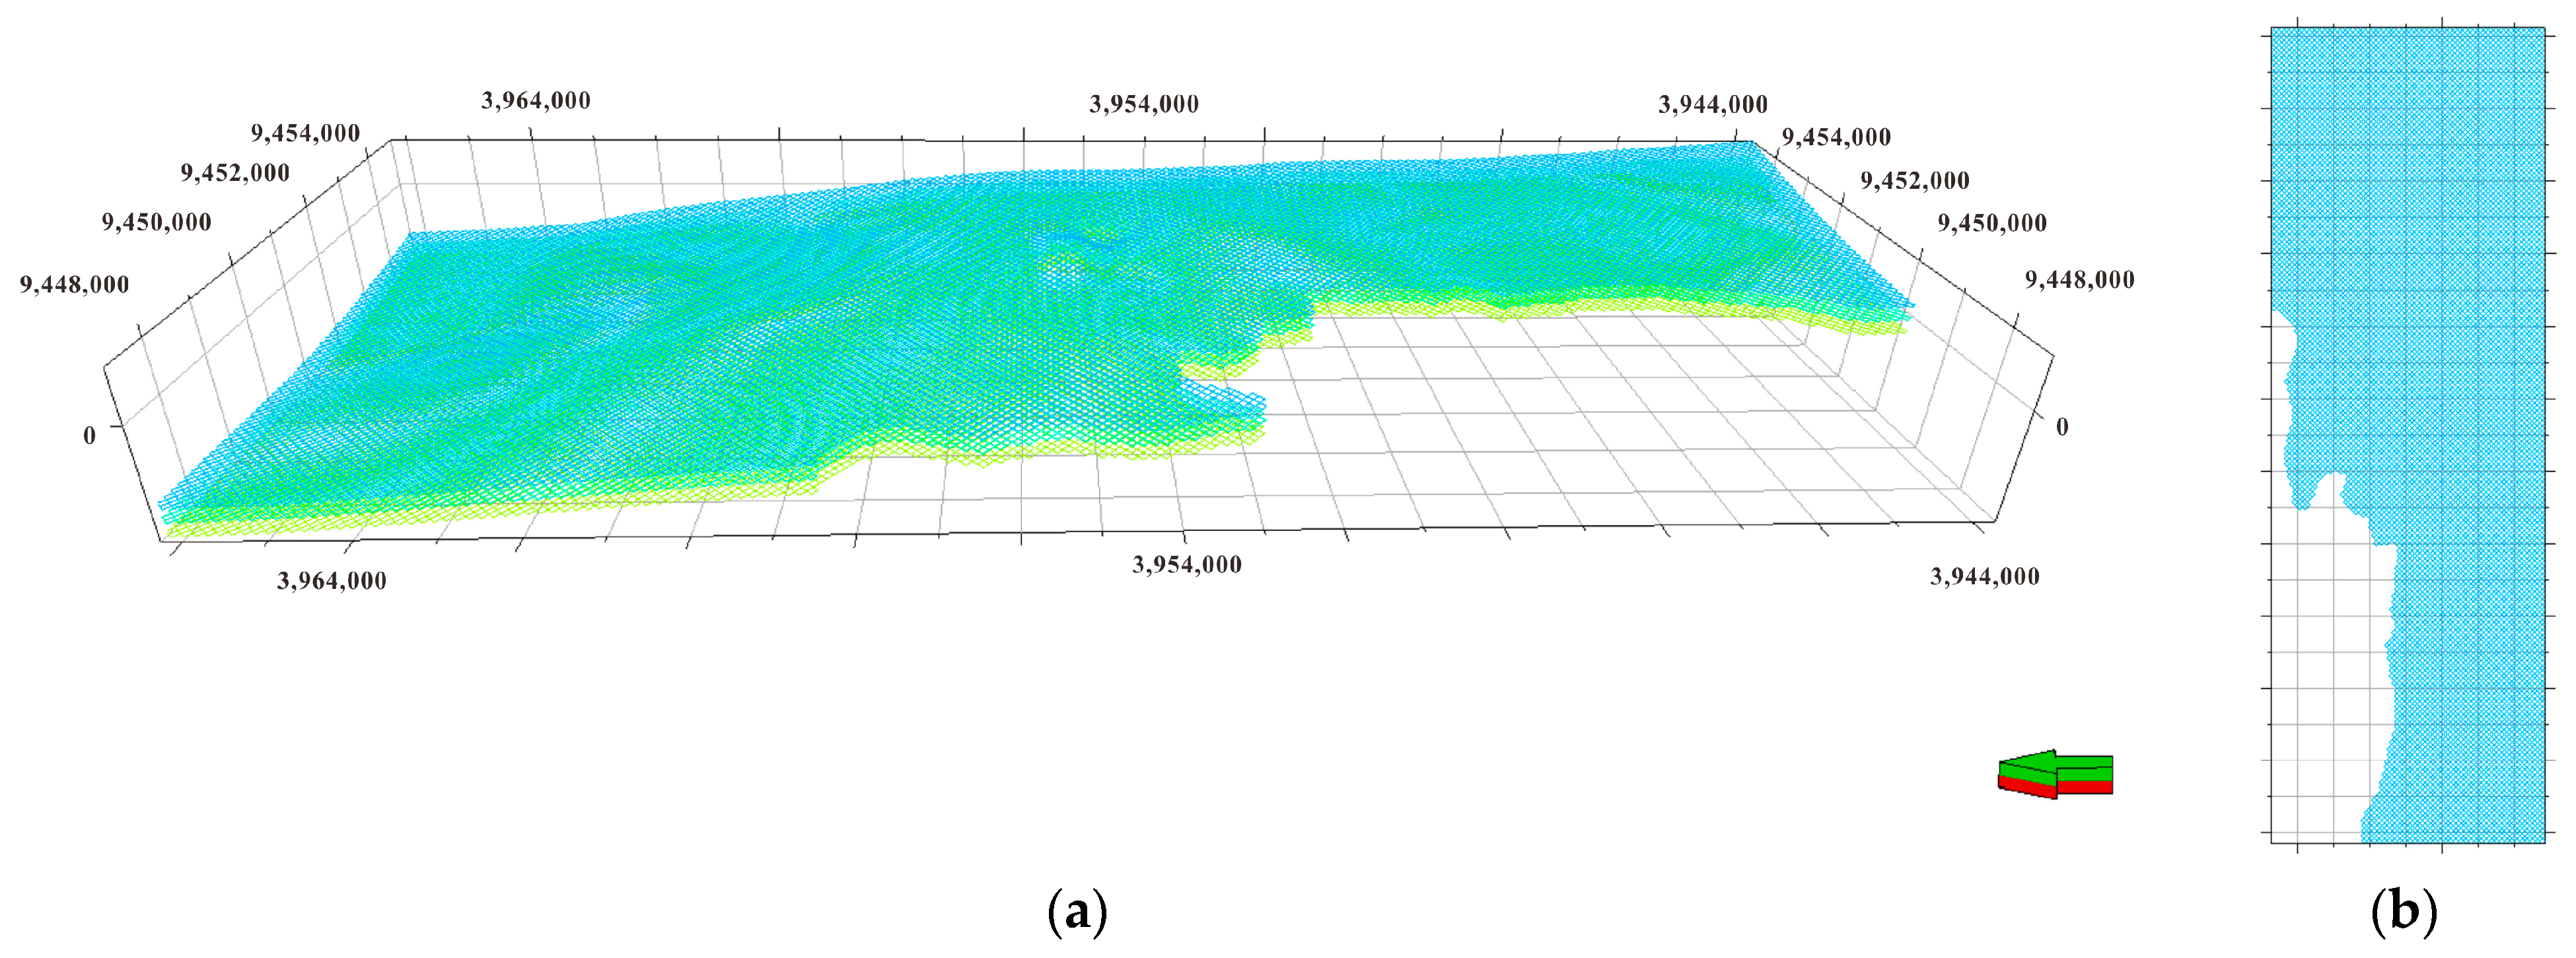
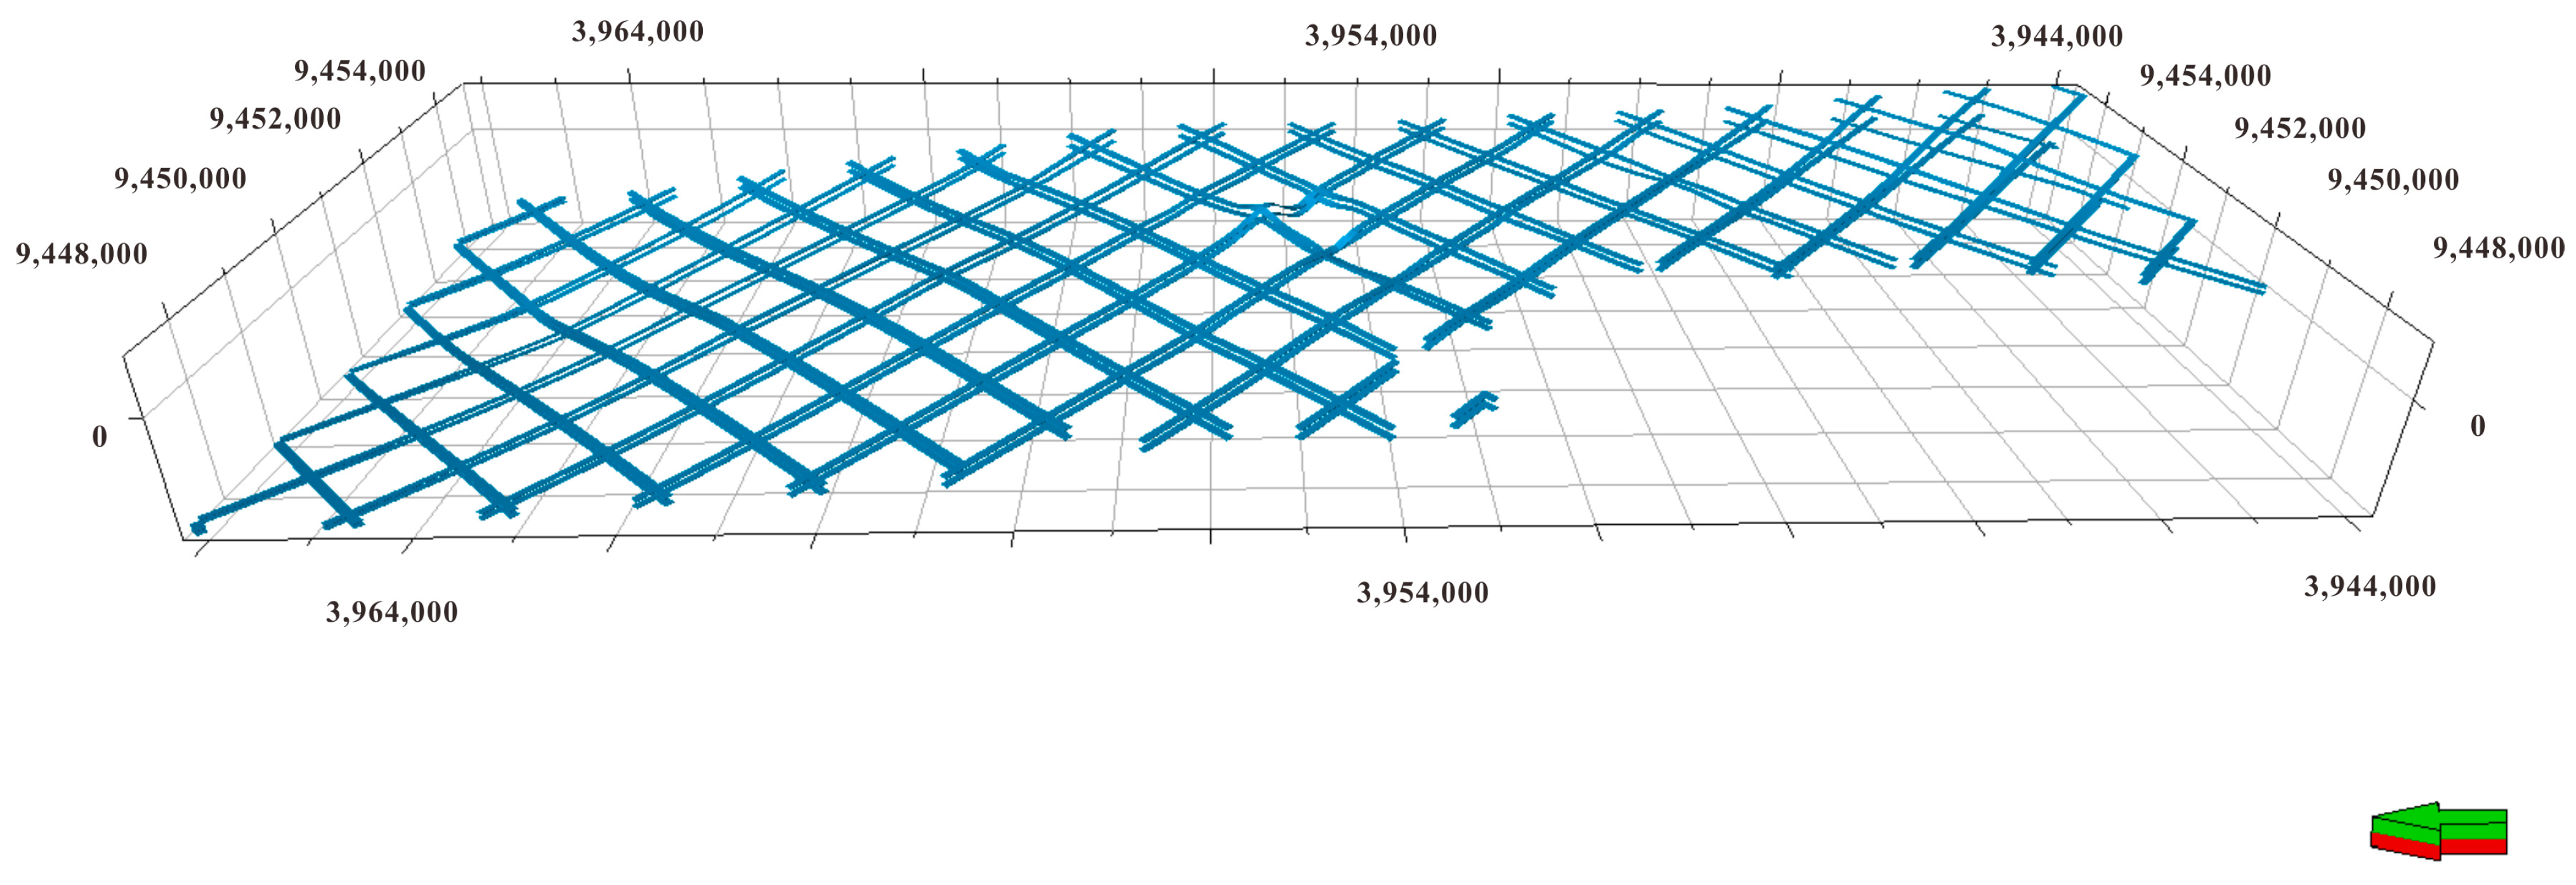
After loading the structural surfaces and stratigraphic data, structural surfaces were established (
Figure 3). Following this, each category of data was examined, and corrections and adjustments were made as needed. This included checking the consistency between well log stratigraphy and structural surfaces and making adjustments where necessary. To ensure precise construction of attribute models for subsequent steps, grid generation had to balance computer performance with the required modeling accuracy. The study area measures approximately 22.7 km in the north-south direction and approximately 7.5 km at its widest point in the east-west direction. In the plan view, the grid cell size was set at 100 m, oriented at 49° NE, consistent with the minimum principal stress direction. Vertically, it was set at 0.5 m, resulting in a total of 826,800 grid cells (
Figure 4).
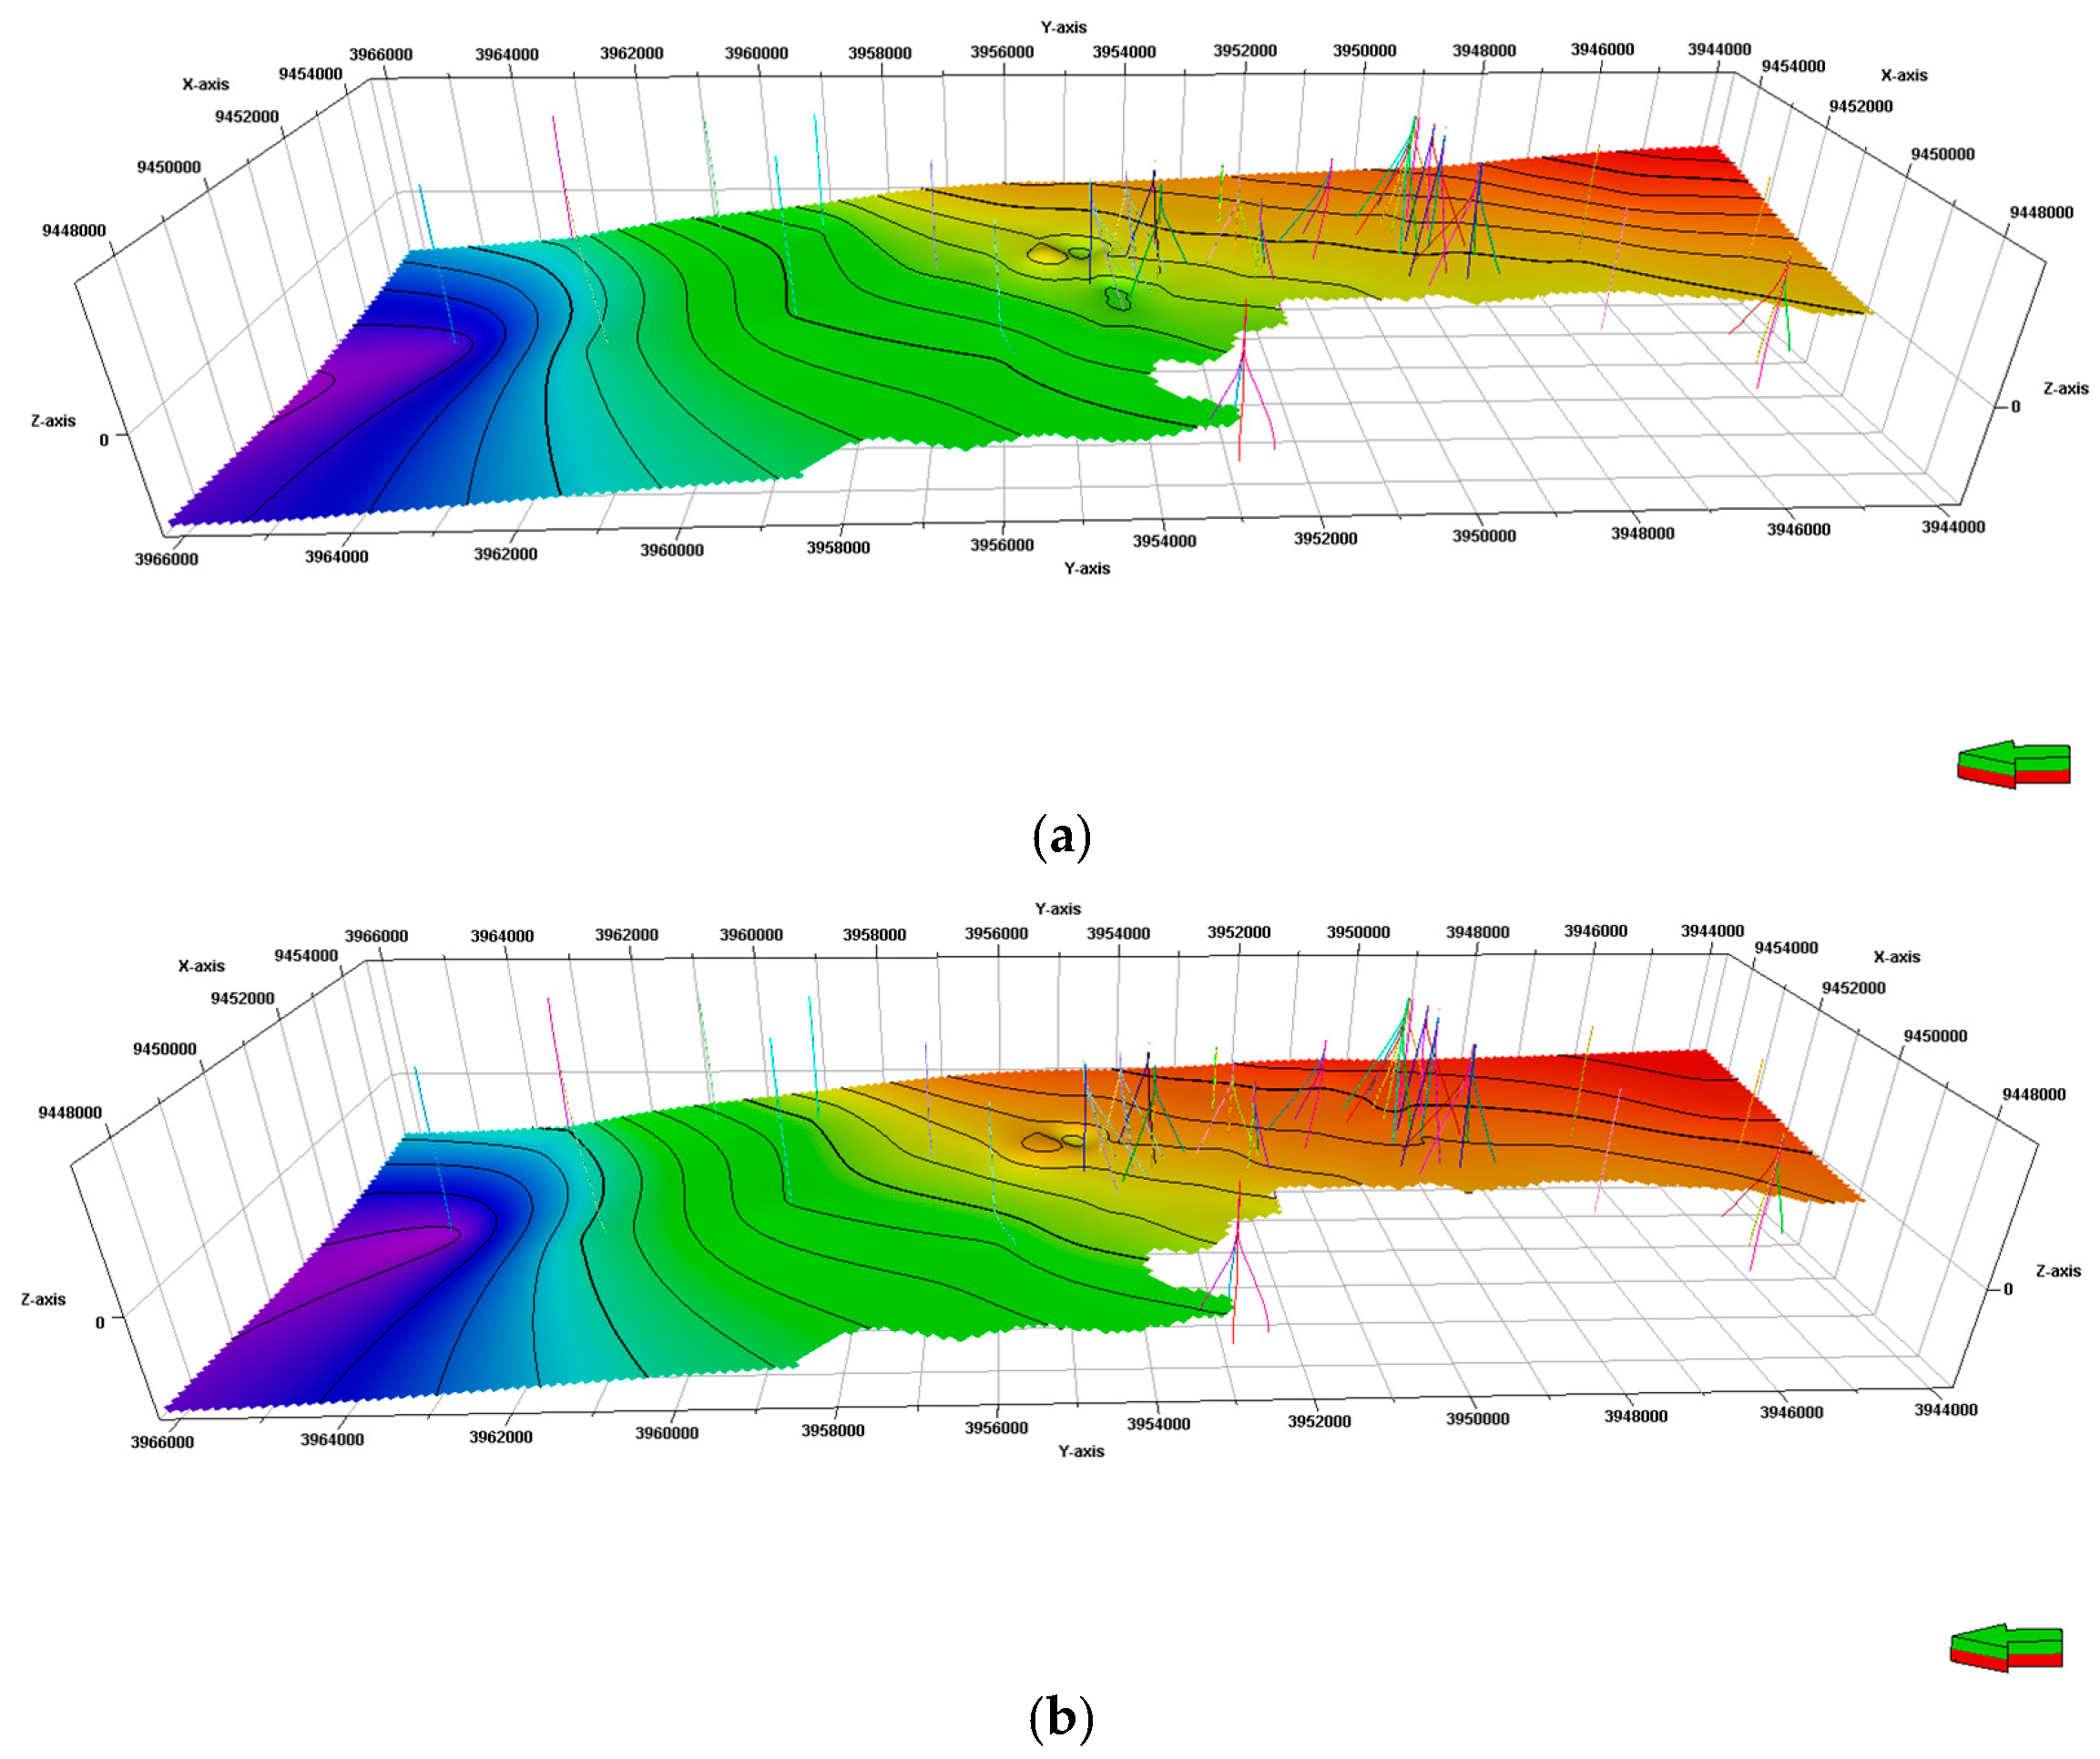
According to the established model, the geological structure in the study area is relatively simple, with the coal seams primarily exhibiting monocline structures. The overall inclination is from the southeast to the northwest, and the depth of coal seam structures ranges from −708 to 343 m. The total cumulative elevation difference across the region is 1052 m(
Figure 5). The thickness of the No. 5 coal seam ranges from 1.7 to 7.2 m, with an average thickness of 3.7 m. The thickness of the No. 11 coal seam varies from 1.2 to 3.9 m, with an average thickness of 2.15 m. There are a few folds developed in the central part of the study area, consistent with the actual geological conditions (
Figure 6).
3.1.2. Attribute Modeling
Attribute modeling involves creating a reservoir subdivision grid on the basis of structural modeling, followed by coarsening interpolation of well log curve data to form attribute models. These models are constructed using well data, allowing for the prediction of reservoir properties between coalbed methane wells, thus elucidating the three-dimensional spatial distribution patterns of reservoir properties. In the case of the Hanchengbei Block, the main attributes modeled were gas content and permeability. Attribute models reflect the three-dimensional spatial distribution of coal seam attribute characteristics, providing a more intuitive representation of the distribution and variation of coal seam properties in three-dimensional space [
28,
29,
30].
Coalbed gas content is the volume of gas contained in a unit mass of coal under standard conditions. It to a certain extent determines the abundance of coalbed gas resources and is an important data point for evaluating sweet spots in coalbed gas areas. Based on the established gas content inversion model, gas content calculations were performed for 77 coalbed methane wells with complete data. A gas content model for the study area was simulated using a stochastic modeling algorithm.
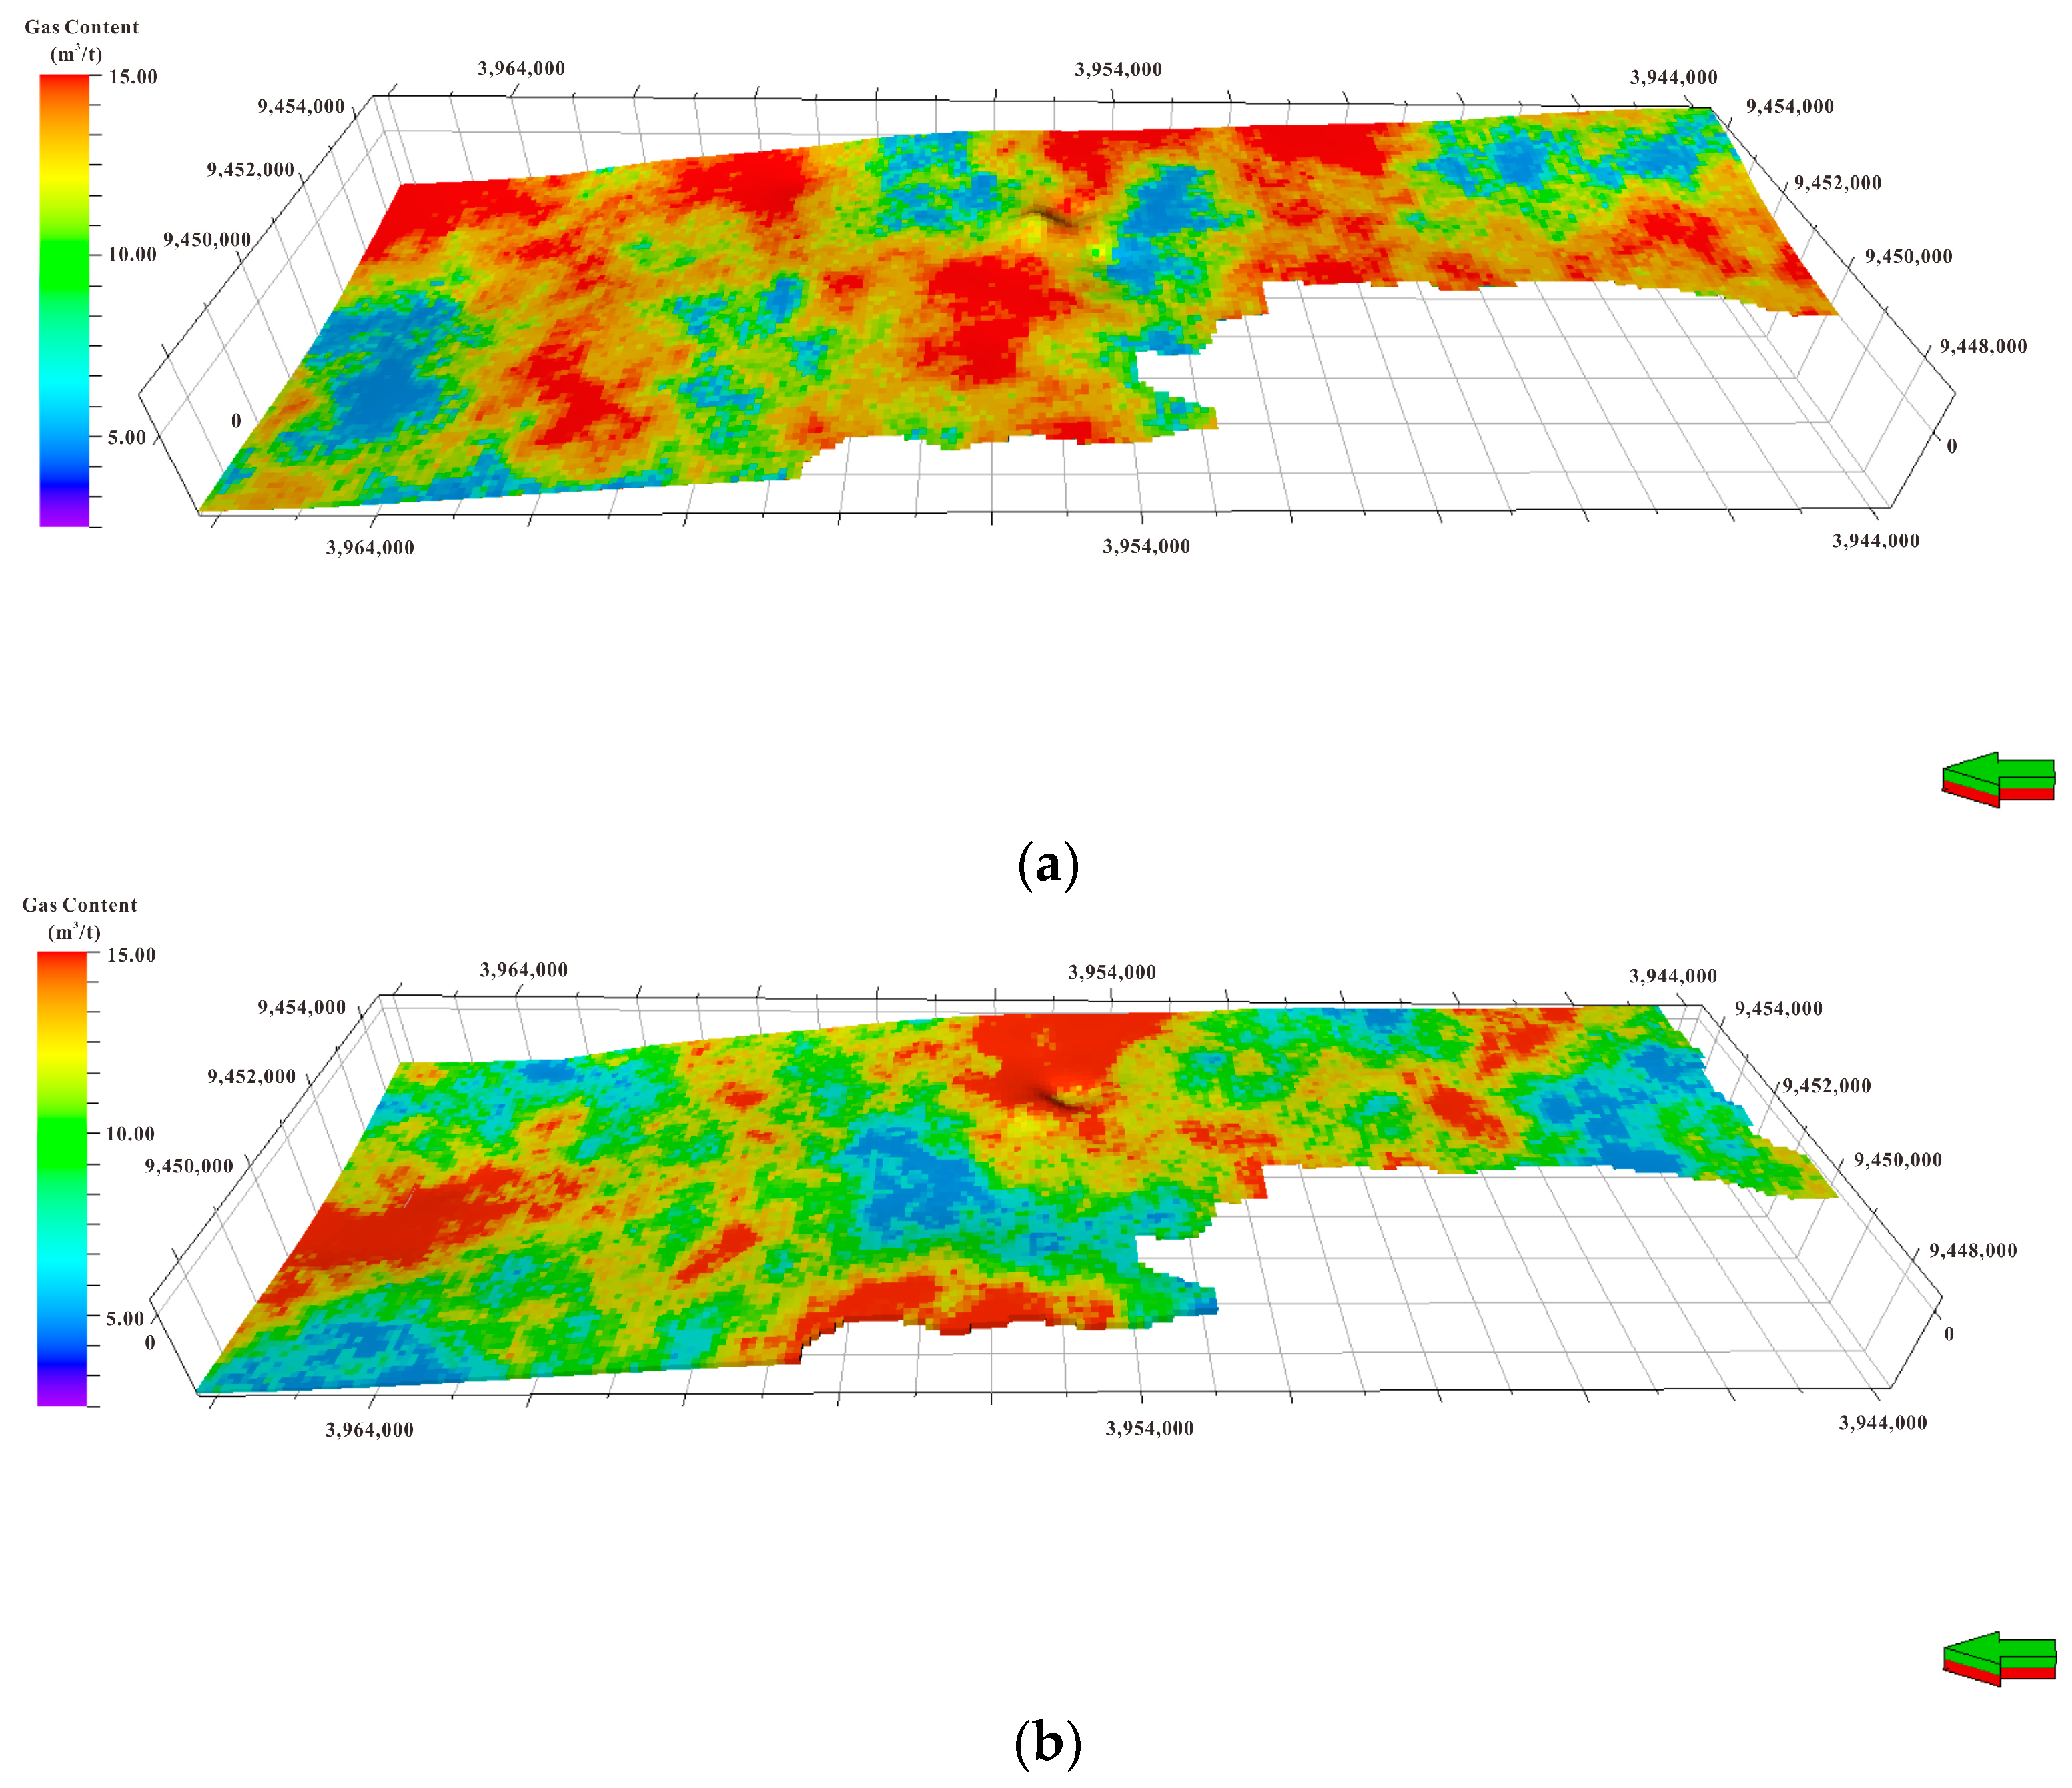
According to the gas content model developed (
Figure 7), the gas content for the No. 5 coal seam in the study area ranges from 5 to 16 m
3/t, with the majority falling between 10 to 15 m
3/t. For the No. 11 coal seam, the gas content ranges from 4 to 15 m
3/t, with most values between 4 to 12 m
3/t. Both coal seams exhibit relatively high gas contents, with strong heterogeneity. The high gas content areas are predominantly located in the central region, and the No. 5 coal seam generally has higher gas content compared to the No. 11 coal seam. From the cross-sectional view (
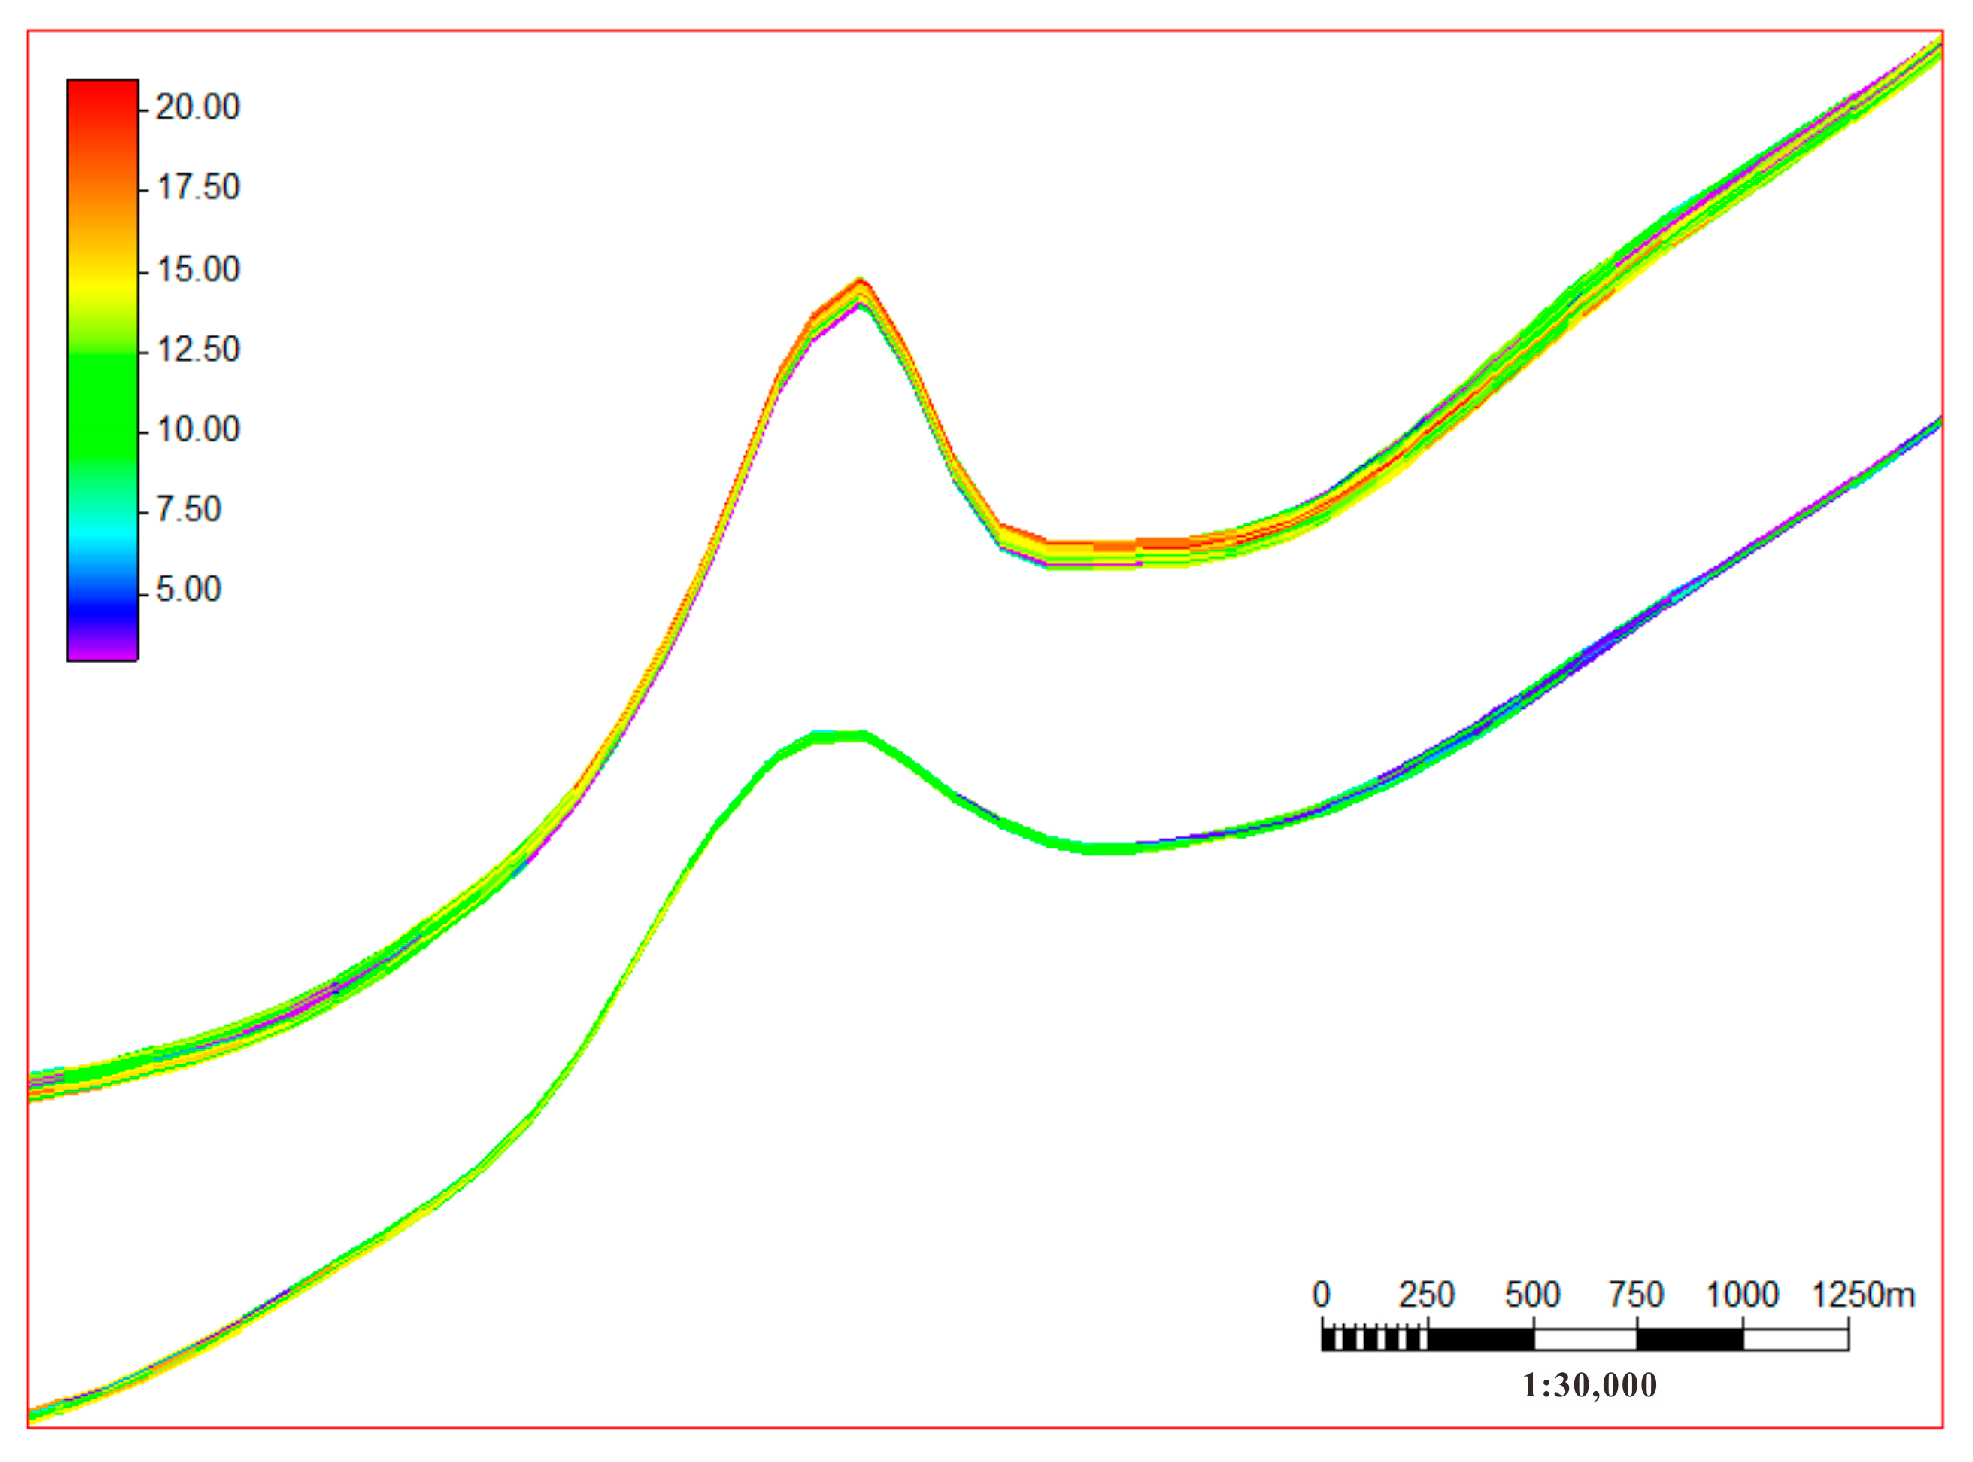
Figure 8), on the plane, the enrichment of coalbed methane at structural highs in the central part of the study area. And the burial depth in the east is relatively shallow. The loss of coalbed methane leads to a lower gas content in the coal seam. In the vertical direction, the gas content in the middle of the coal seams is generally higher than at the upper and lower ends of the coal seams, suggesting that this might be due to the fact that the upper and lower ends of the coal seams are closely adjacent to the roof and floor, resulting in denser coal and fewer developed fractures and fissures, leading to lower gas content. Overall, both coal seams in the study area are rich in resources, which is of significant importance for coalbed gas production capacity.
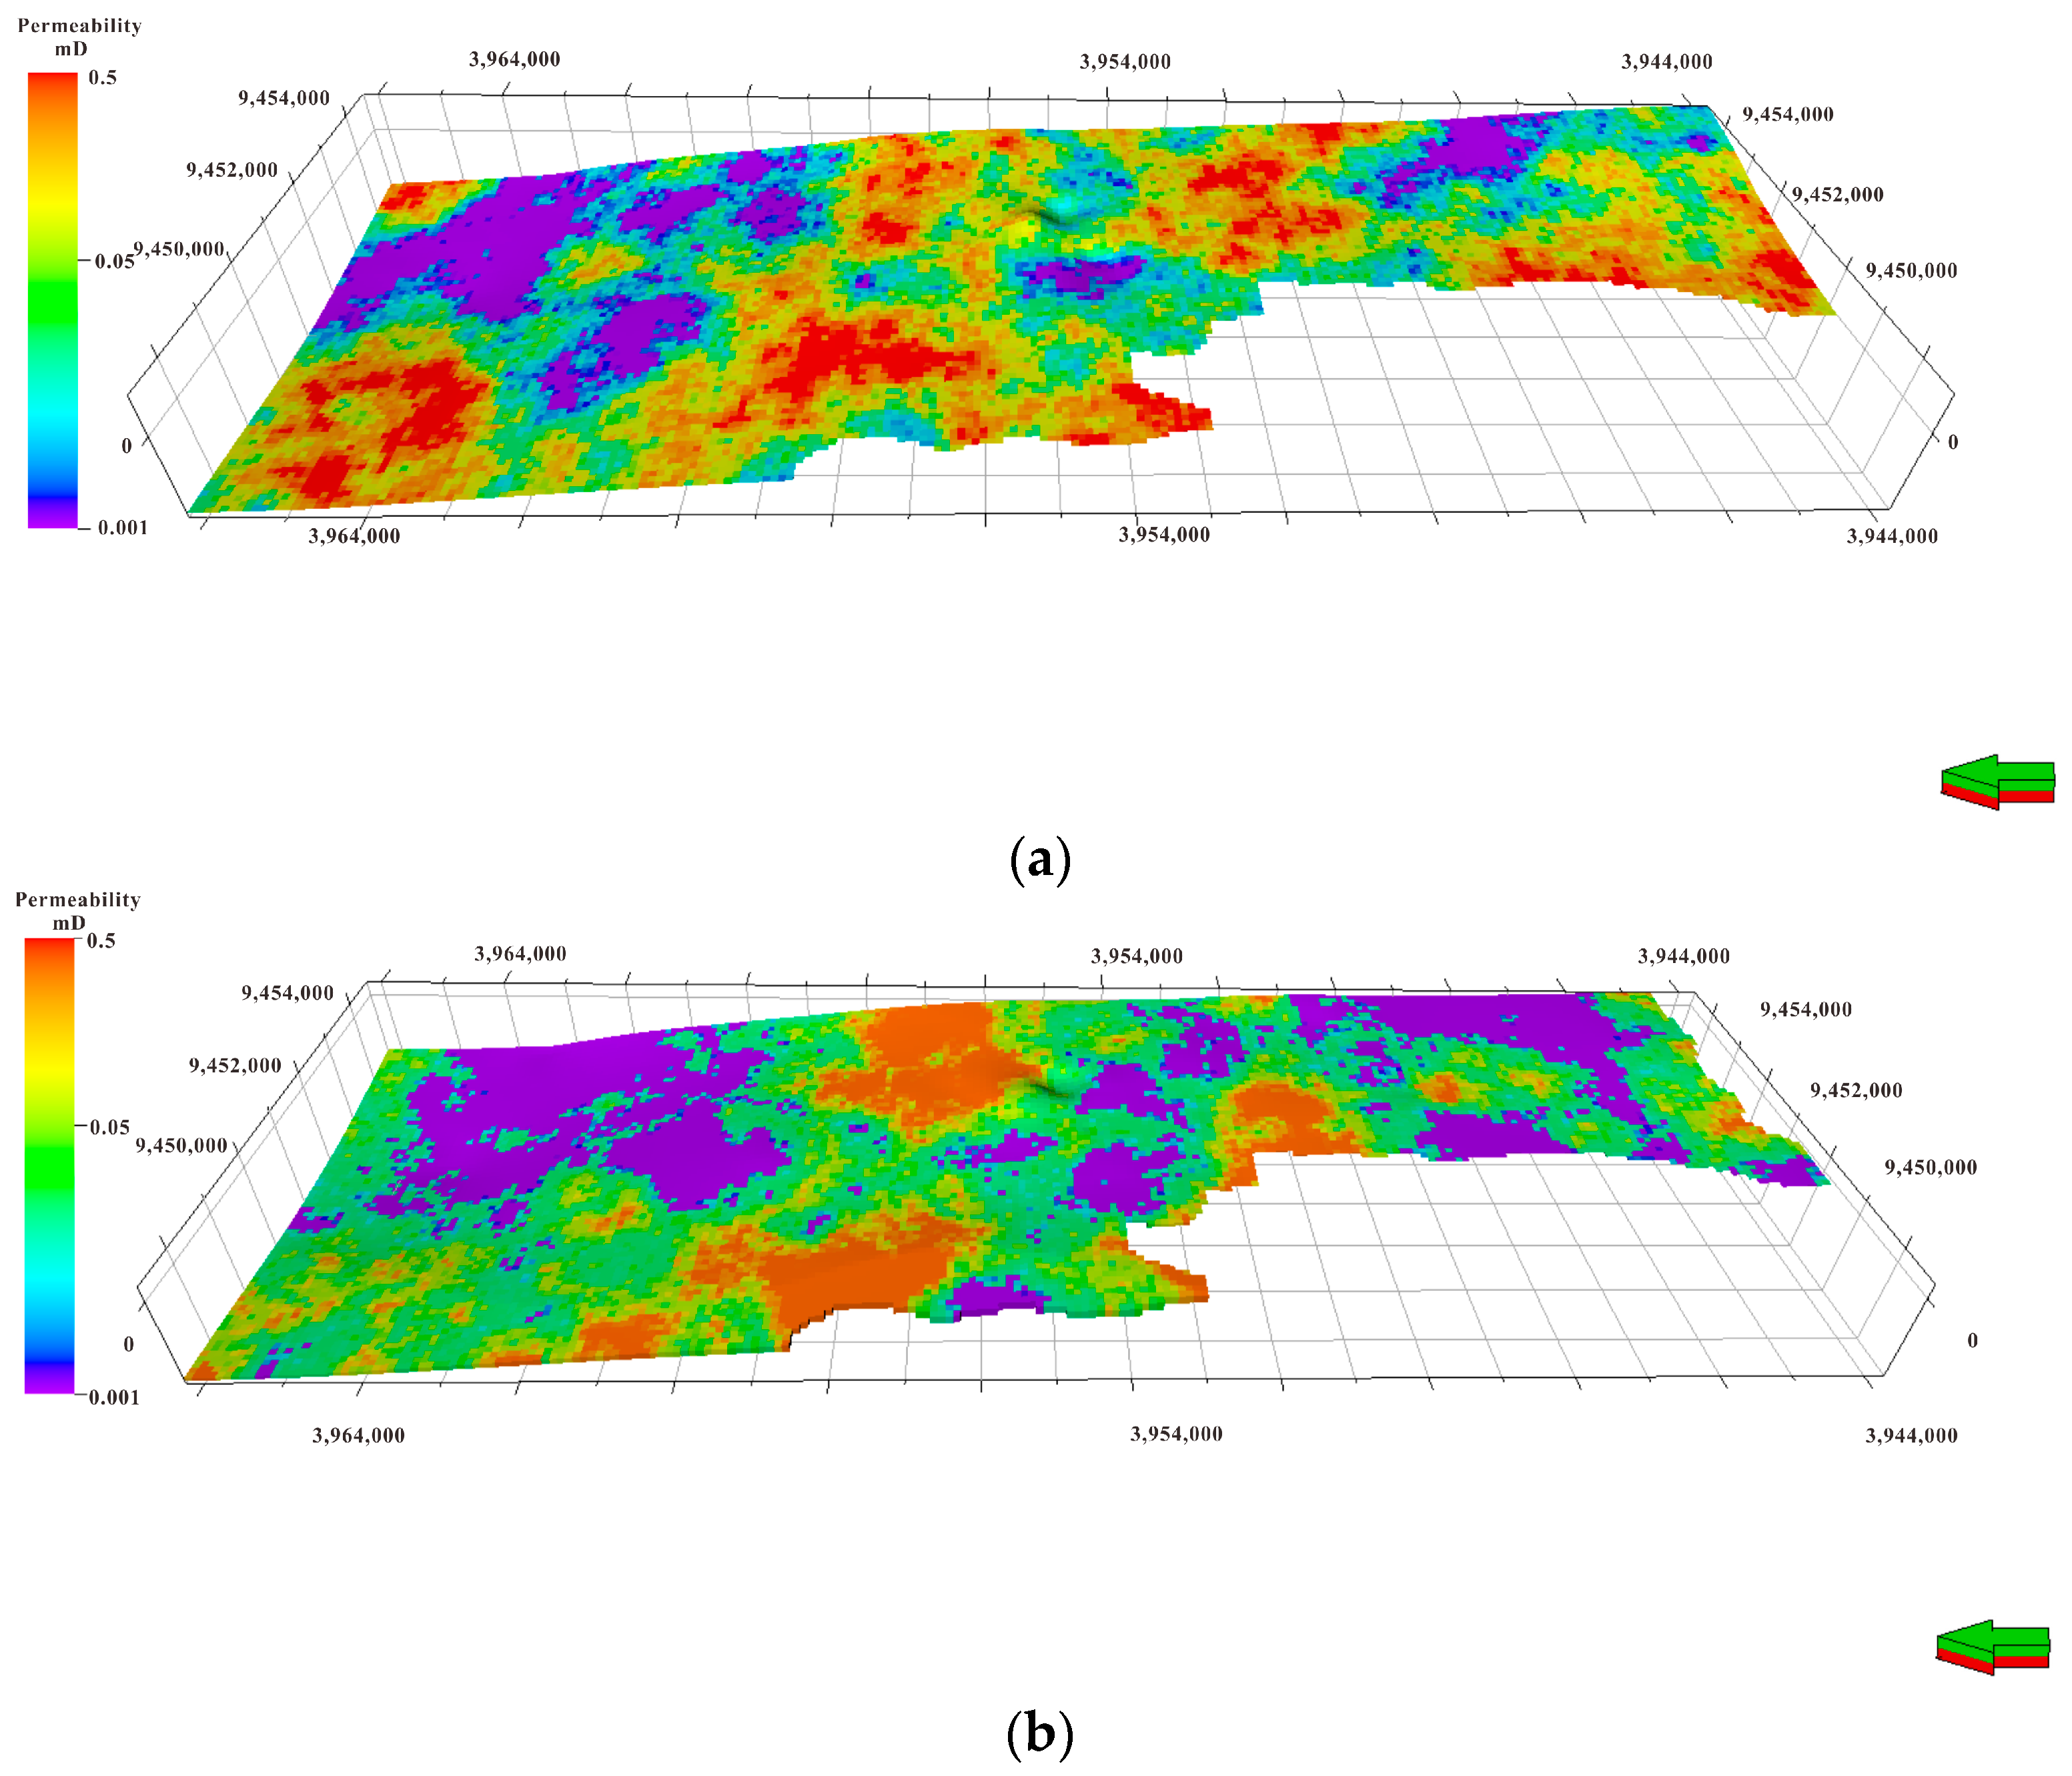
The permeability of coal reservoirs is an important parameter that affects coalbed gas development and determines the ease or difficulty of coalbed gas extraction. Based on data from the only three test wells in the study area, it is evident that the permeability in the Hanchengbei Block ranges from 0.02 to 0.05 mD, with overall low permeability (
Figure 9). Using the explanation model described above, permeability calculations were conducted for 77 coalbed methane wells with complete data. A stochastic modeling algorithm was used to simulate the permeability models for both the No. 5 and No. 11 coal seams in the study area. The permeability model reveals that the permeability of coalbeds in the study area is relatively low, with only a few locations achieving a permeability of 0.5 mD. This low permeability is a significant factor limiting coalbed gas extraction in the Hanchengbei Block. In future work, measures such as hydraulic fracturing should be employed to improve the permeability of coal reservoirs. On the flat plane, the central and north-central parts of the study area have relatively higher permeability. Influenced by burial depth, the permeability of the No. 11 coal seam is lower than that of the No. 5 coal seam. When viewed vertically, the permeability in the middle of the coal seam is relatively better than at the upper and lower ends, likely due to the influence of roof and floor lithology, resulting in denser coal at the upper and lower ends and, consequently, lower permeability (
Figure 10).
3.1.3. Resource Calculation and Model Testing
During the model-building process, due to the inherent randomness and uncertainty in stochastic modeling, it is necessary to verify the accuracy of the model against geological knowledge after the completion of three-dimensional geological modeling. Currently, there are accuracy issues associated with the three-dimensional modeling of reservoir geological models. Huo et al. proposed a quantitative evaluation method of uncertainty of three-dimensional reservoir geological models using geological reserves as a quantitative index. In this study, the original coalbed gas reserves were calculated using the model grid algorithm, and the results were compared with the reserves obtained using traditional volumetric methods [
31,
32,
33]. The difference between the two methods was found to be only 1.36%, which validates the reliability of the model.
3.2. Confirmation of Coal Reservoir Parameter Uncertainty Intervals
When conducting a sensitivity analysis of factors affecting coalbed gas production, it is essential to have a full understanding of the uncertainty associated with coalbed parameters and to describe the three-dimensional spatial distribution of coalbed characteristics and geological parameters. Using the established geological model, the distribution of various geological parameters in the study area was obtained. The results indicate that the distribution follows a certain regularity and, in general, conforms to a log-normal distribution. Based on actual data statistics, the distribution of parameters is as follows:
For the Number 5 coalbed, the thickness ranges from 1.7 to 7.2 m, with an average thickness of 3.7 m. The gas content ranges from 8.76 to 14.87 m3/t, with an average of 11.9 m3/t, and the permeability ranges from 0.01 to 0.50 mD.
For the Number 11 coalbed, the thickness ranges from 1.2 to 3.9 m, with an average thickness of 2.15 m. The gas content ranges from 8.68 to 12.98 m
3/t, with an average of 11.6 m
3/t, and the permeability ranges from 0.01 to 0.20 mD (
Figure 11).
To quantitatively describe the impact of reservoir parameter uncertainty on coalbed gas production, credibility was used to evaluate the uncertainty. The confidence probabilities P5 and P95 were used as the lower and upper limits, respectively, for the uncertainty intervals of geological parameters such as coalbed thickness. The confidence intervals for geological parameters of the Number 5 coalbed in the study area were obtained (as shown in
Figure 9). Specifically, the uncertainty interval for coal thickness was [1.35, 6.89], for gas content was [10.28, 15.52], and for permeability was [0.014, 0.048]. These parameter intervals were utilized as the adjustment range for sensitivity analysis.
3.3. Coalbed Methane Simulation Modeling
Based on the confirmed uncertainty intervals for reservoir parameters, different numerical simulation models were established for production forecasting. In the simulation work, individual geological parameters were changed in single simulations to analyze the production capacity of the two coalbeds. This allowed the assessment of the impact of various reservoir parameters on coalbed gas production.
The modeling was based on the production mode of combined mining of the two coalbeds. The plane grid was designed as 220 × 280 m, with individual grid sizes of 10 × 10 m, resulting in a total of 616 grids. Vertically, it comprised two layers of grids, with sizes based on coalbed thickness, totaling 1232 grids. Coalbed gas simulation wells were placed at the center of each grid and were vertical wells that penetrated both coalbeds.
Using the validated reservoir model, sensitivity analysis was performed on the recovery rate and multiple reservoir parameters affecting coalbed gas production in the context of combined mining of the two coalbeds, and the results were discussed as follows.
3.3.1. History Fitting and Data Preparation
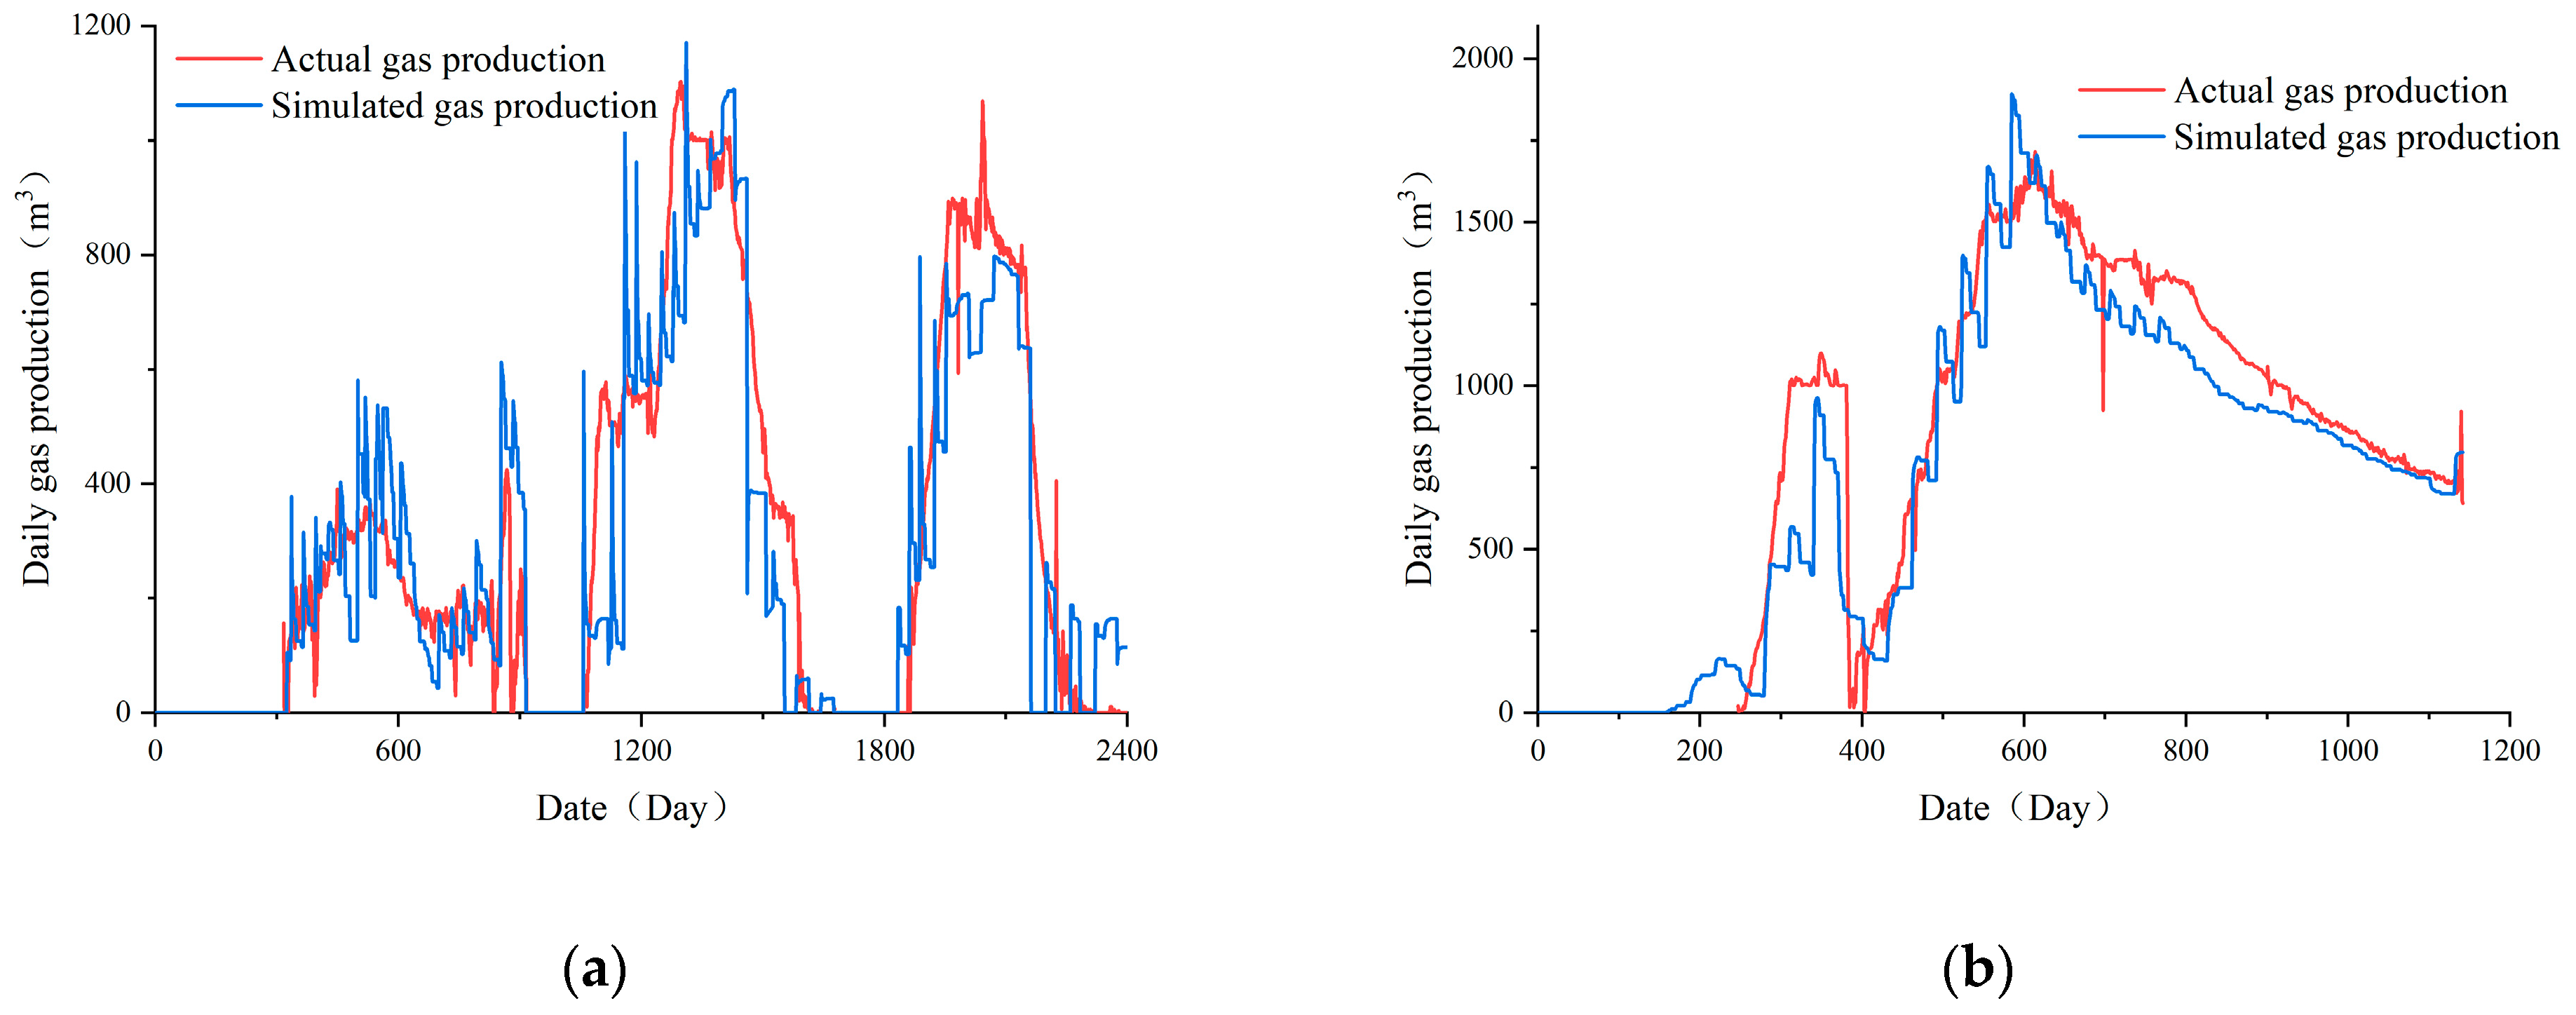
History fitting is a prerequisite for numerical simulation work, and in this paper, history fitting work is carried out for two representative wells in the study area, and the results show that the fitting effect is better (
Figure 12). This historical fitting utilized Well W1 within the Hanchengbei Block as the reference well. Well W1 is a representative well situated in the central part of the research area, producing from the combined mining of the 5th and 11th coal seams. The continuous production from this well has yielded favorable output. The controlled area for a single well covered 0.616 km
2, and the well was designed as a dual-layer combined mining well. During the simulation process, a single parameter was varied in each simulation, while the other parameters were kept constant. The fitting parameters for this well are shown in the table below (
Table 1) [
34].
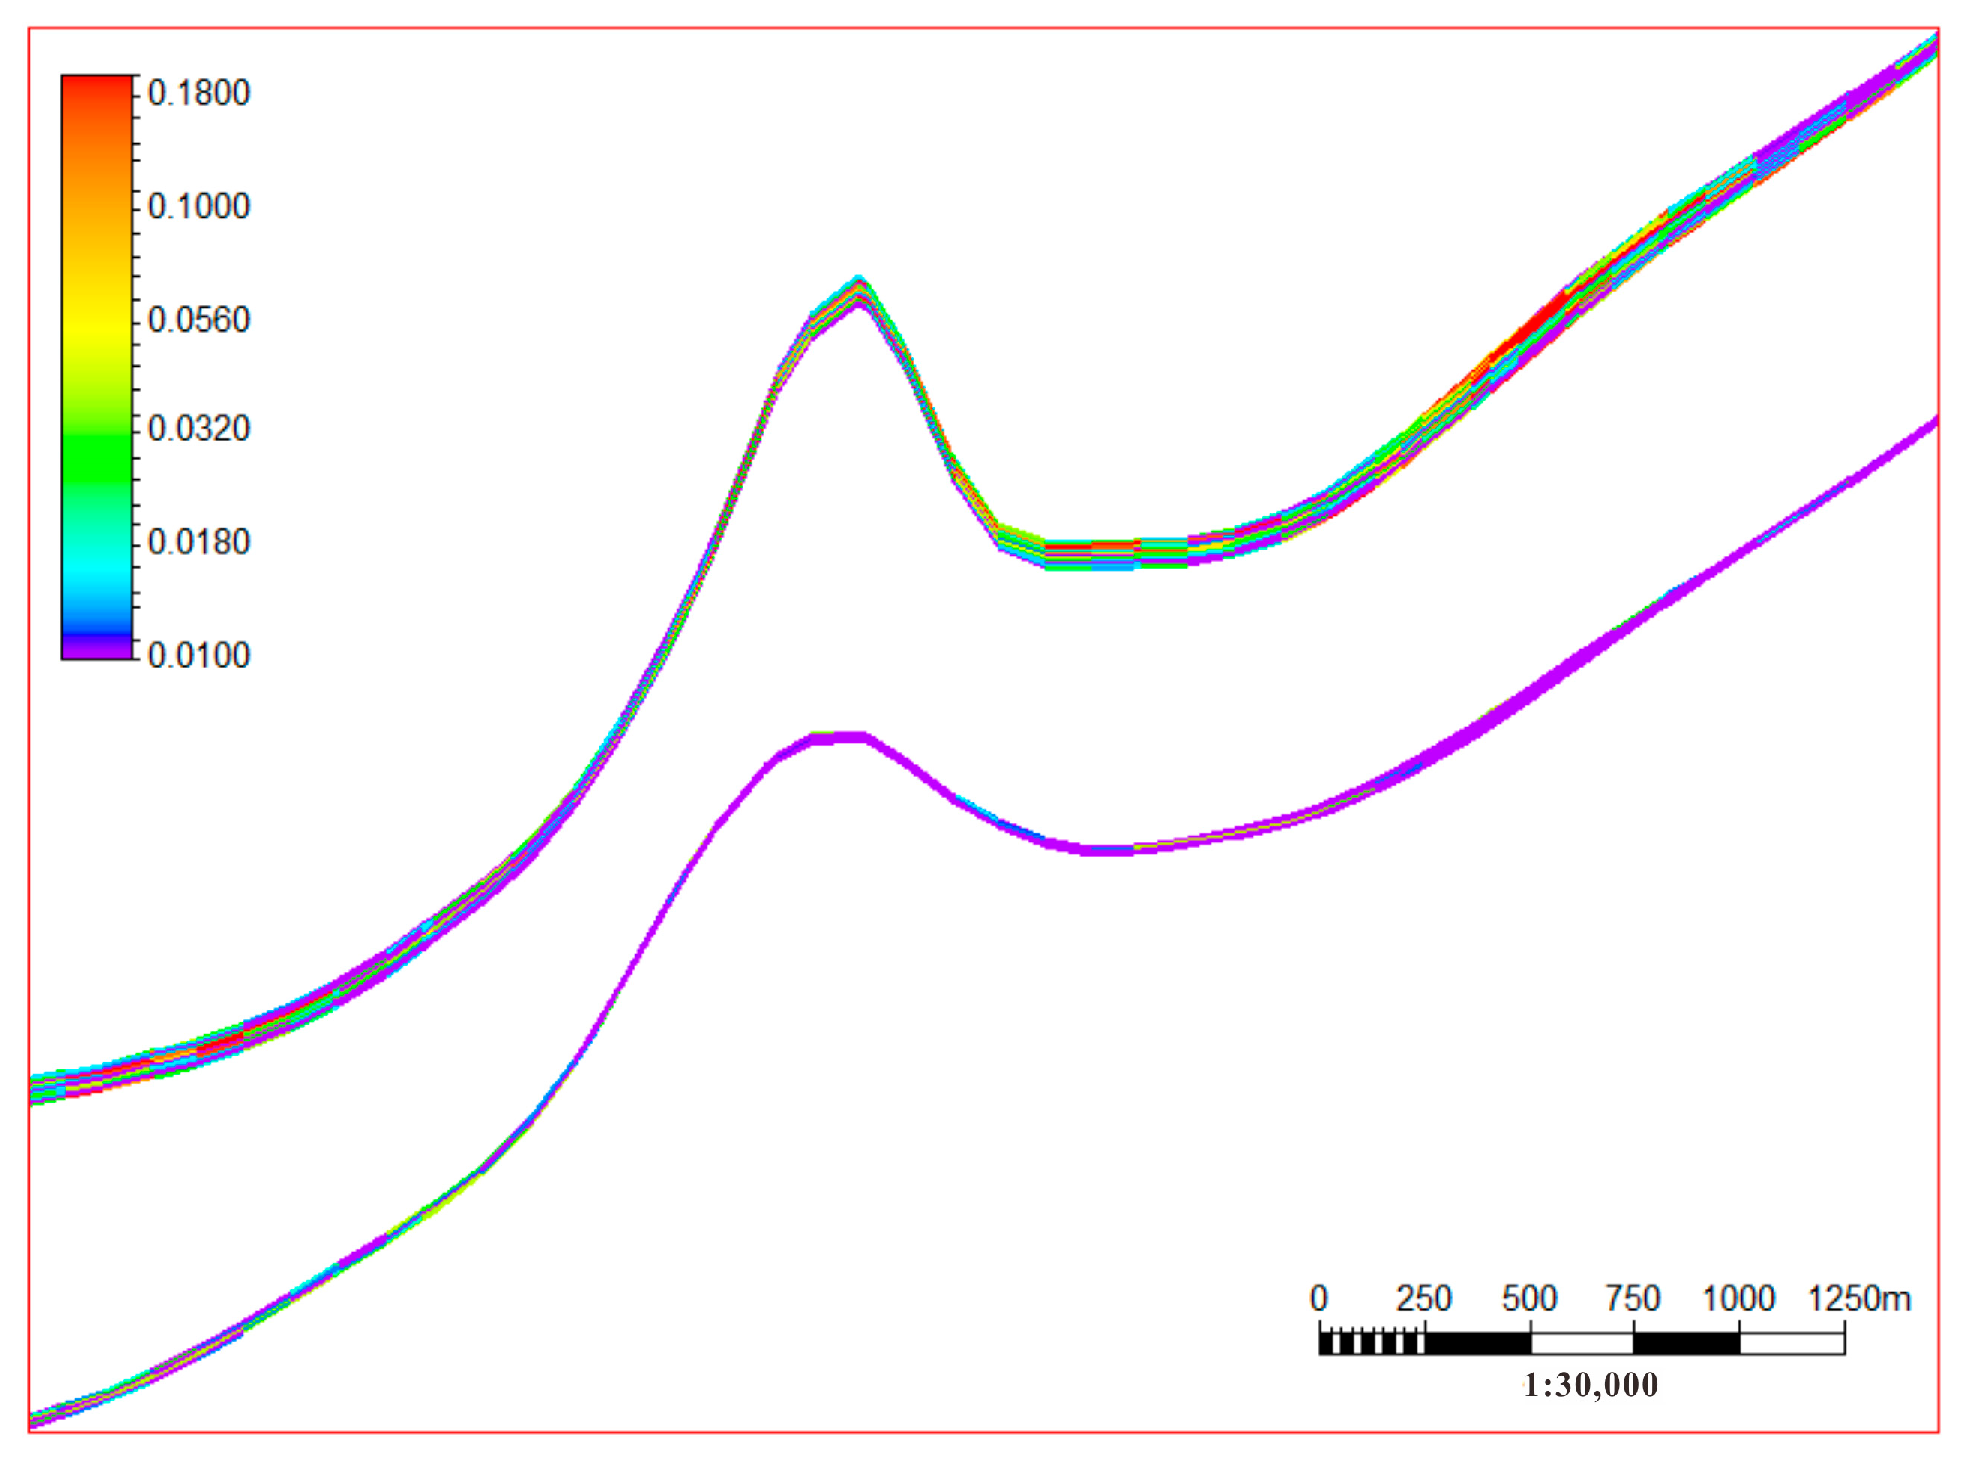
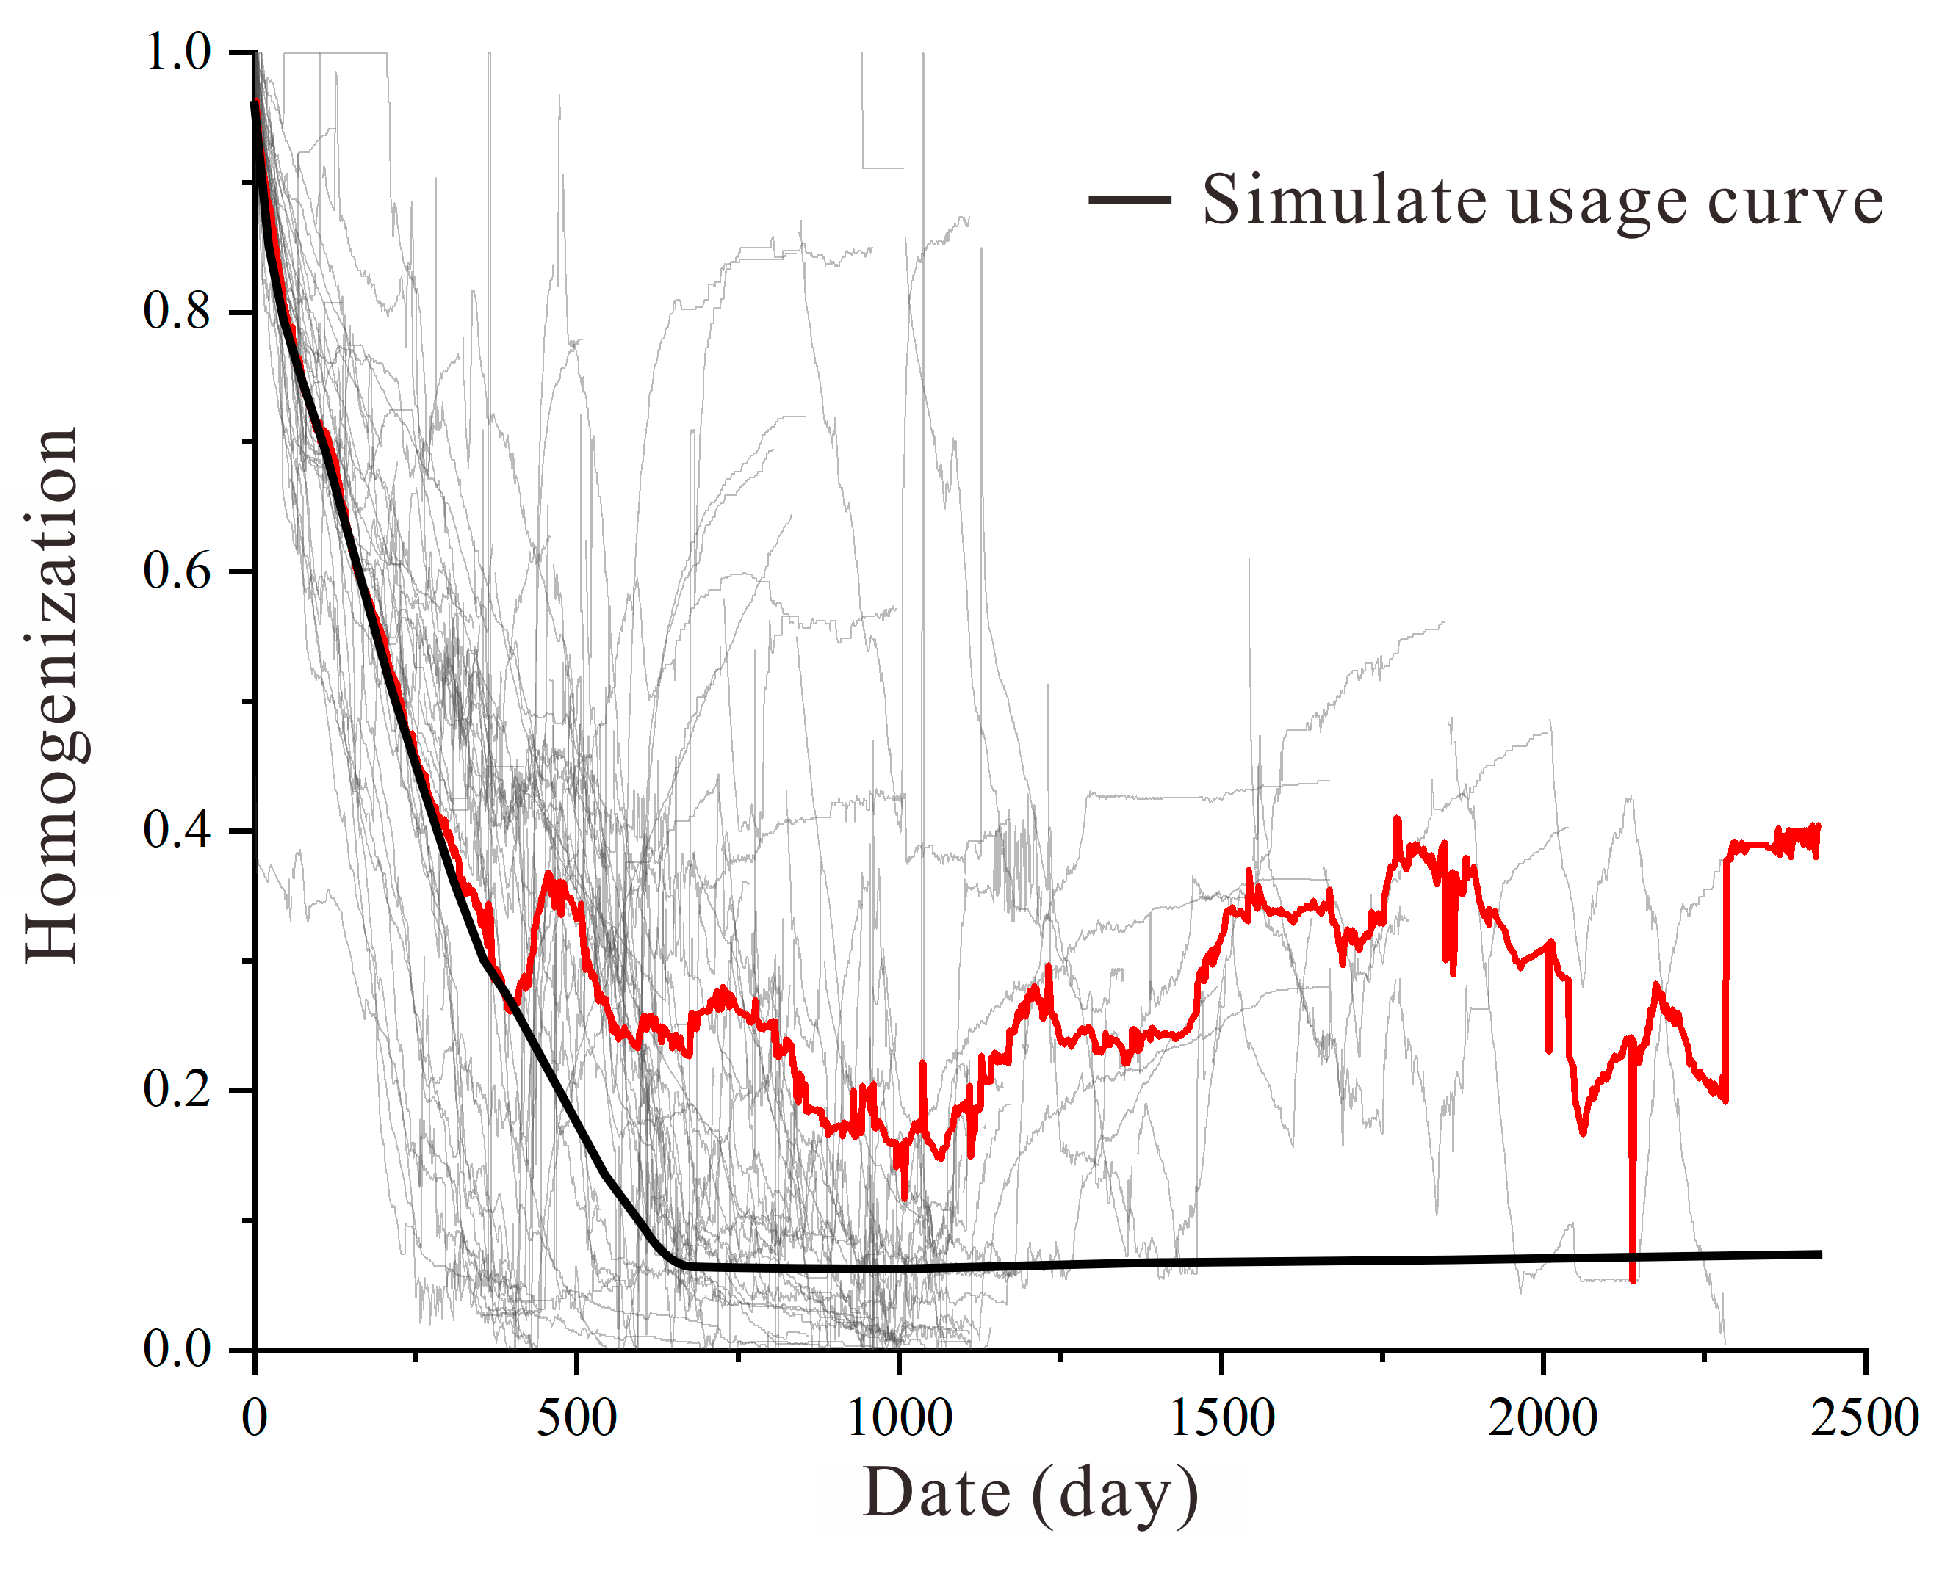
This simulation uses the simulation method of fixed bottom-hole flow pressure to simulate gas production, while bottom-hole flow pressure is related to reservoir pressure and pressure drop rate. In order to eliminate the influence of engineering factors on the simulation results and to explore the general pattern of developed wells, the pressure profile required for simulation was determined. By comparing the average values of pressure drop curves of 30 test production wells in the study area, it is found that most of the wells in the study area can have a stable pressure drop before 400 days, and the pressure curves show fluctuations after 400 days due to various engineering reasons such as well repairs and well shutdowns. To eliminate the influence of engineering factors on the research, the pressure drawdown curves of the 30 wells involved in the earlier production stages were normalized, making its pressure drop trend clearer. Based on the existing pressure drop trends and using curve fitting, the pressure curves were stabilized to obtain the reference pressure curve for the research area, as shown in
Figure 13.
3.3.2. Sensitivity Factor Analysis Based on Monte Carlo Simulation
After establishing the uncertainty intervals for the parameters and developing the corresponding predictive models, a sensitivity analysis of the factors influencing gas production was conducted. Based on the results of historical fitting and the analysis of individual reservoir productivity, it was evident that the 5th coal seam had a much larger impact on gas production than the 11th coal seam in the research area [
35]. To visually investigate the influence of individual factors on gas production, the geological parameters for the fifth coal seam were altered one at a time during the simulation. Monte Carlo simulation was employed, and the parameter selection was based on the data distribution obtained from the previous fitting. The simulation period was extended to 3300 days. The final results provided insights into the sensitivity of various geological parameters in the research area on coalbed gas production.
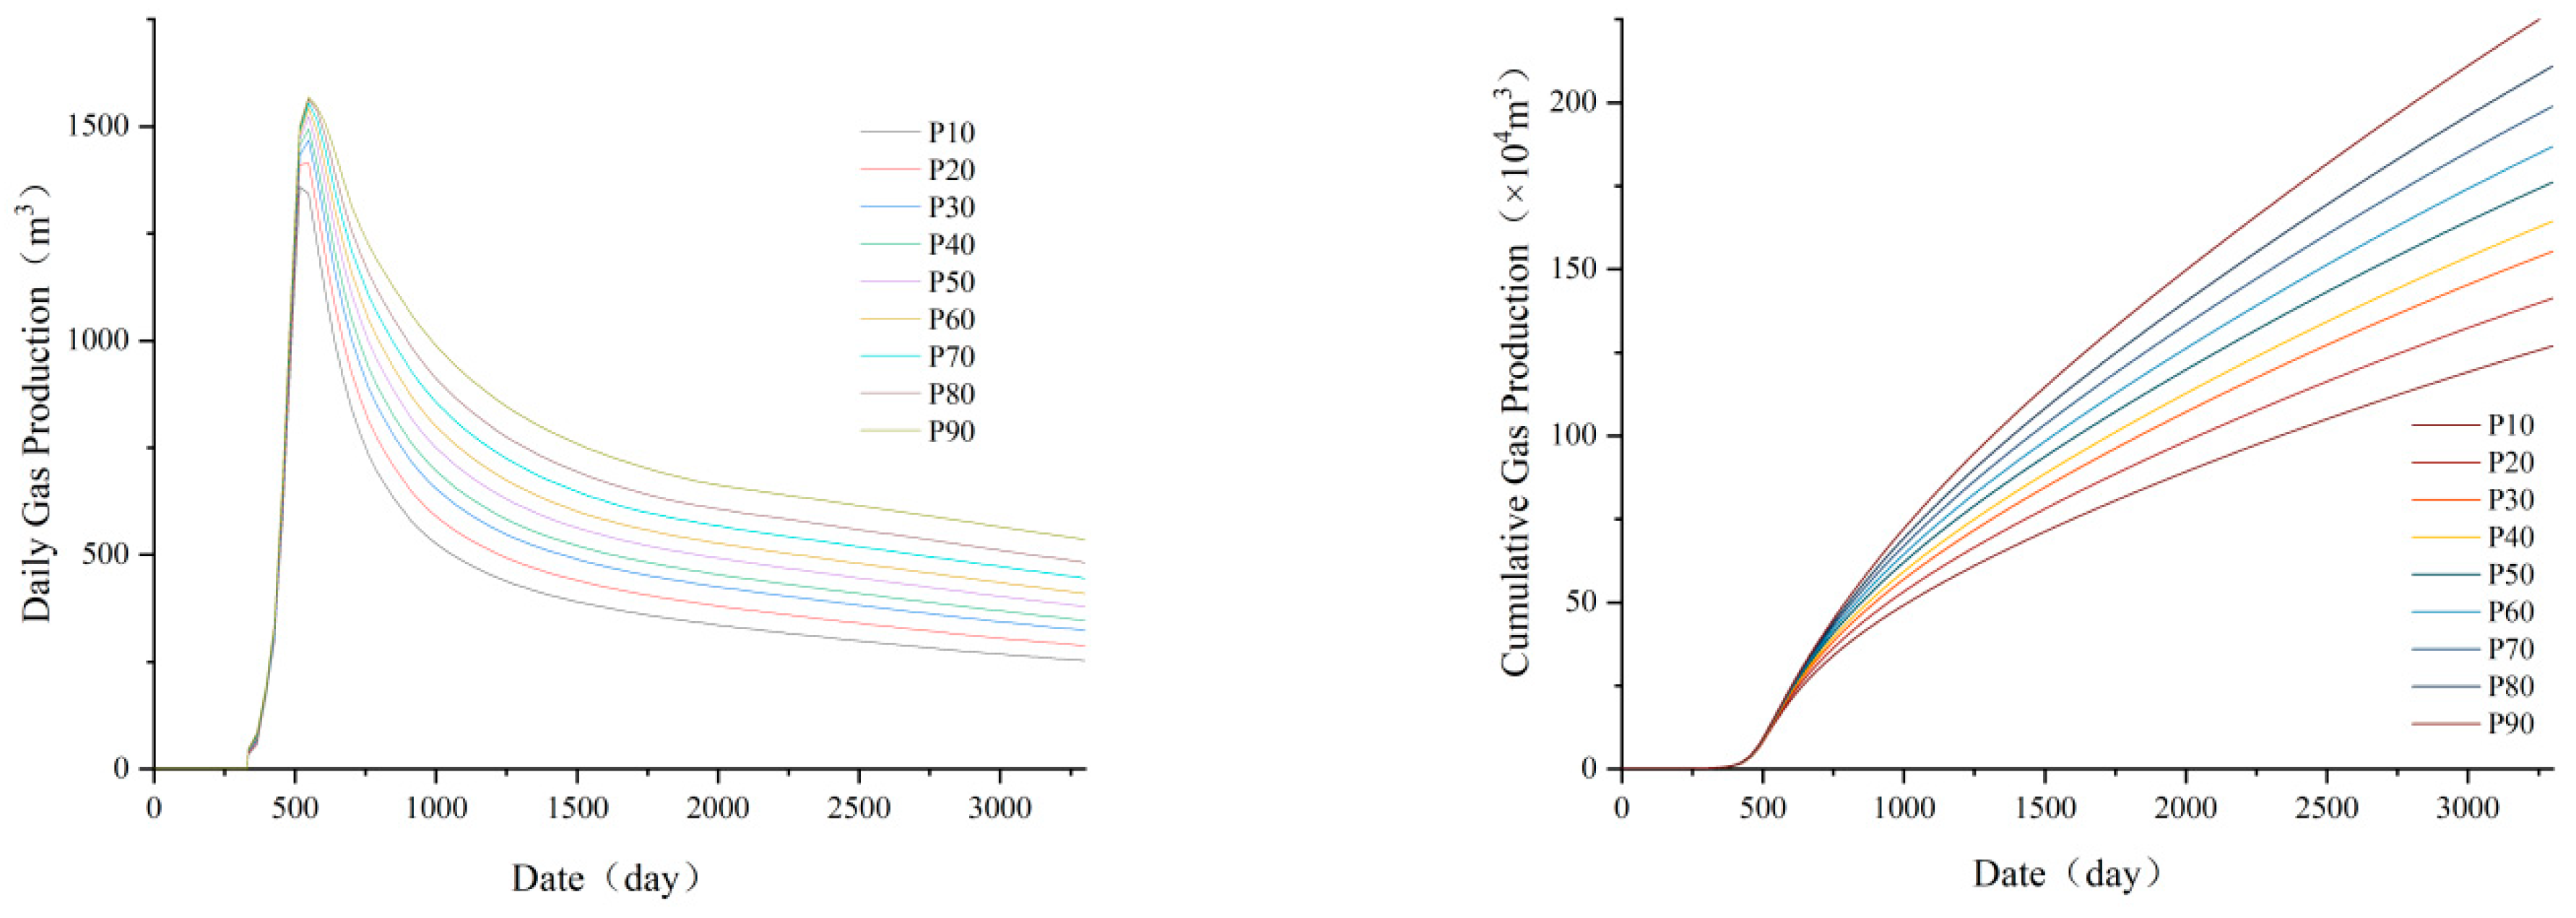
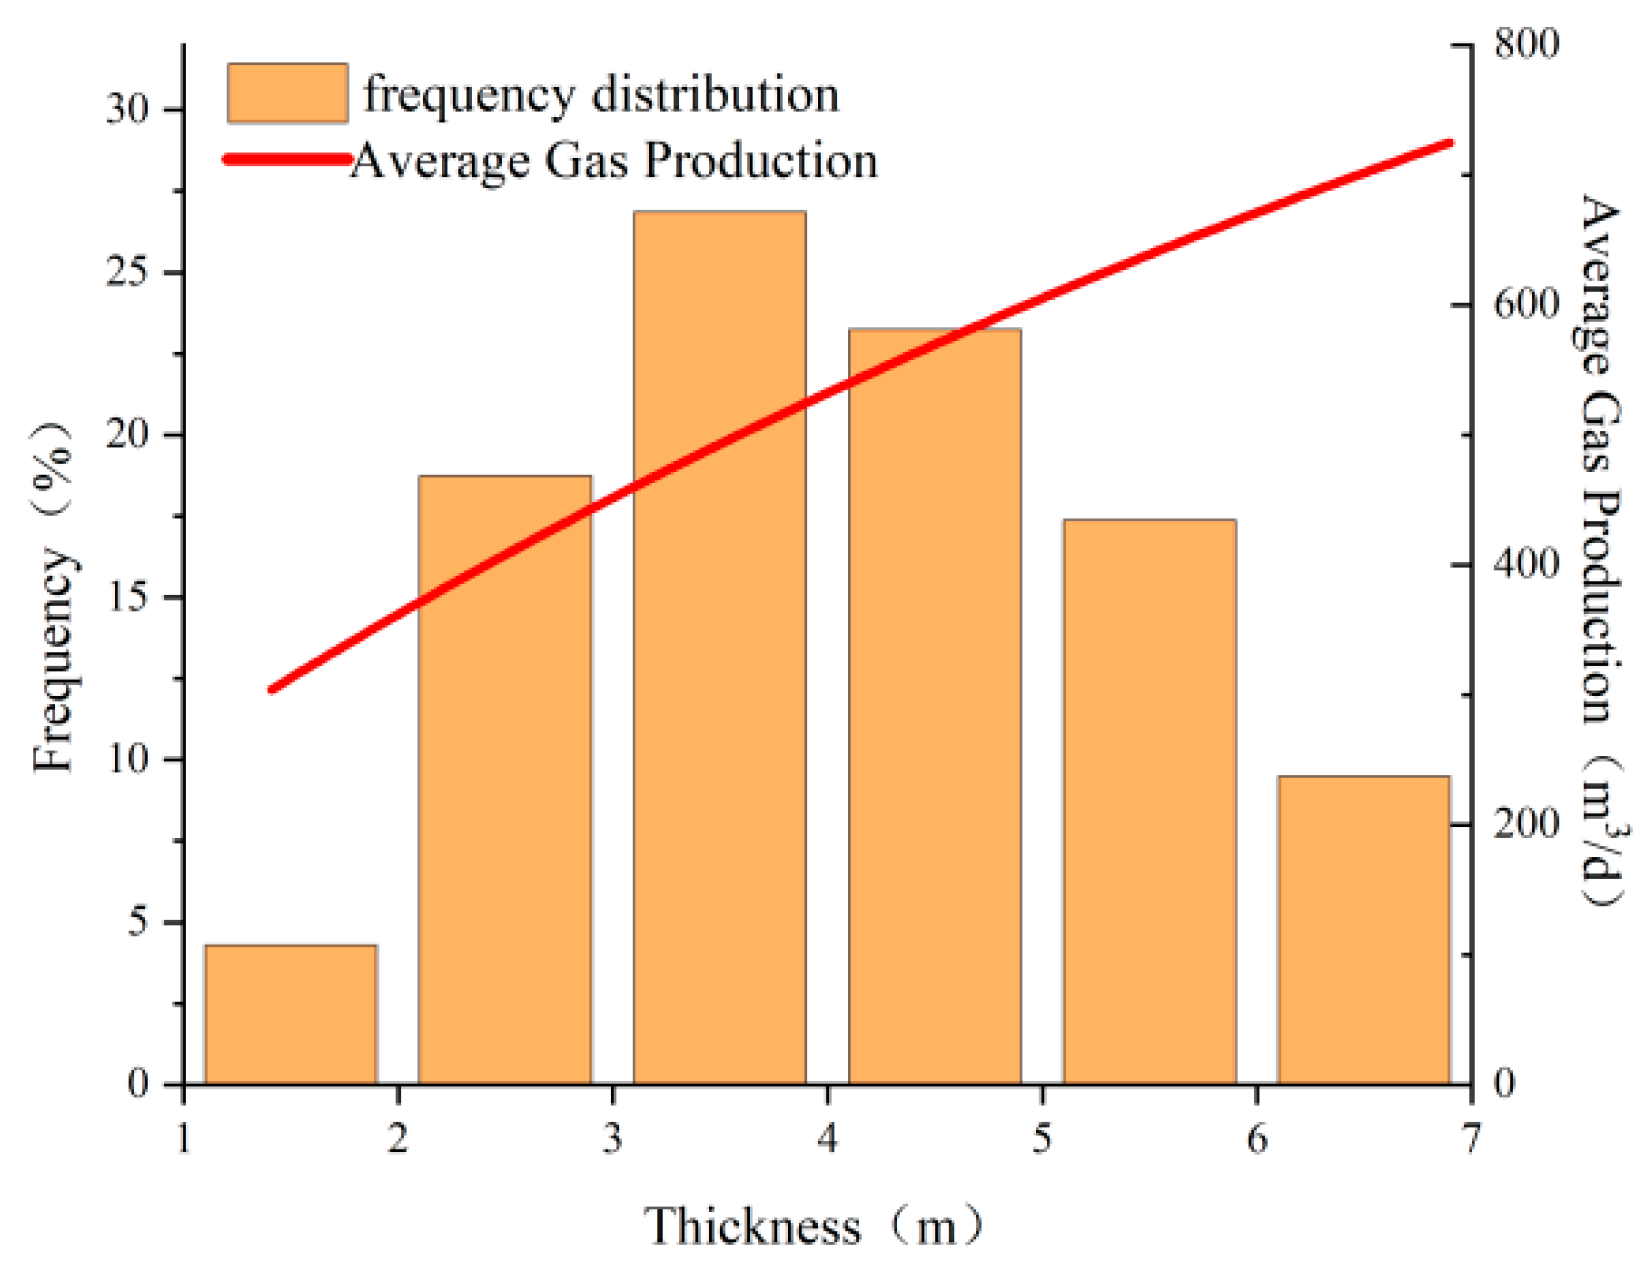
In coalbed gas development, coal seam thickness determines the quantity of resources and subsequently affects the production rate of individual gas wells. To study the impact of coal seam thickness, a production forecasting model was established for the joint development of two coal seams. A relevant Monte Carlo model was set up for simulation. The thickness of the 5th coal seam ranged from 1.38 m to 6.89 m, and the thickness of the 11th coal seam was 2.1 m. The predicted results, as shown in
Figure 14, indicate that with an increase in the thickness of the fifth coal seam, the gas production peak increases. The time to reach gas, gas production rate, and subsequent productivity decline trends remain unchanged. The cumulative gas production uniformly increases as coal seam thickness increases. There is a positive correlation between average gas production and coal seam thickness, with a range of 380 to 720 m
3/d. The daily average gas production varies within a range of 340 m
3 (
Figure 15). This is because an increased coal seam thickness leads to higher initial resource volumes, while the gas content in the reservoir remains unchanged, resulting in an increase in the gas production peak, with no change in the time to reach the gas.
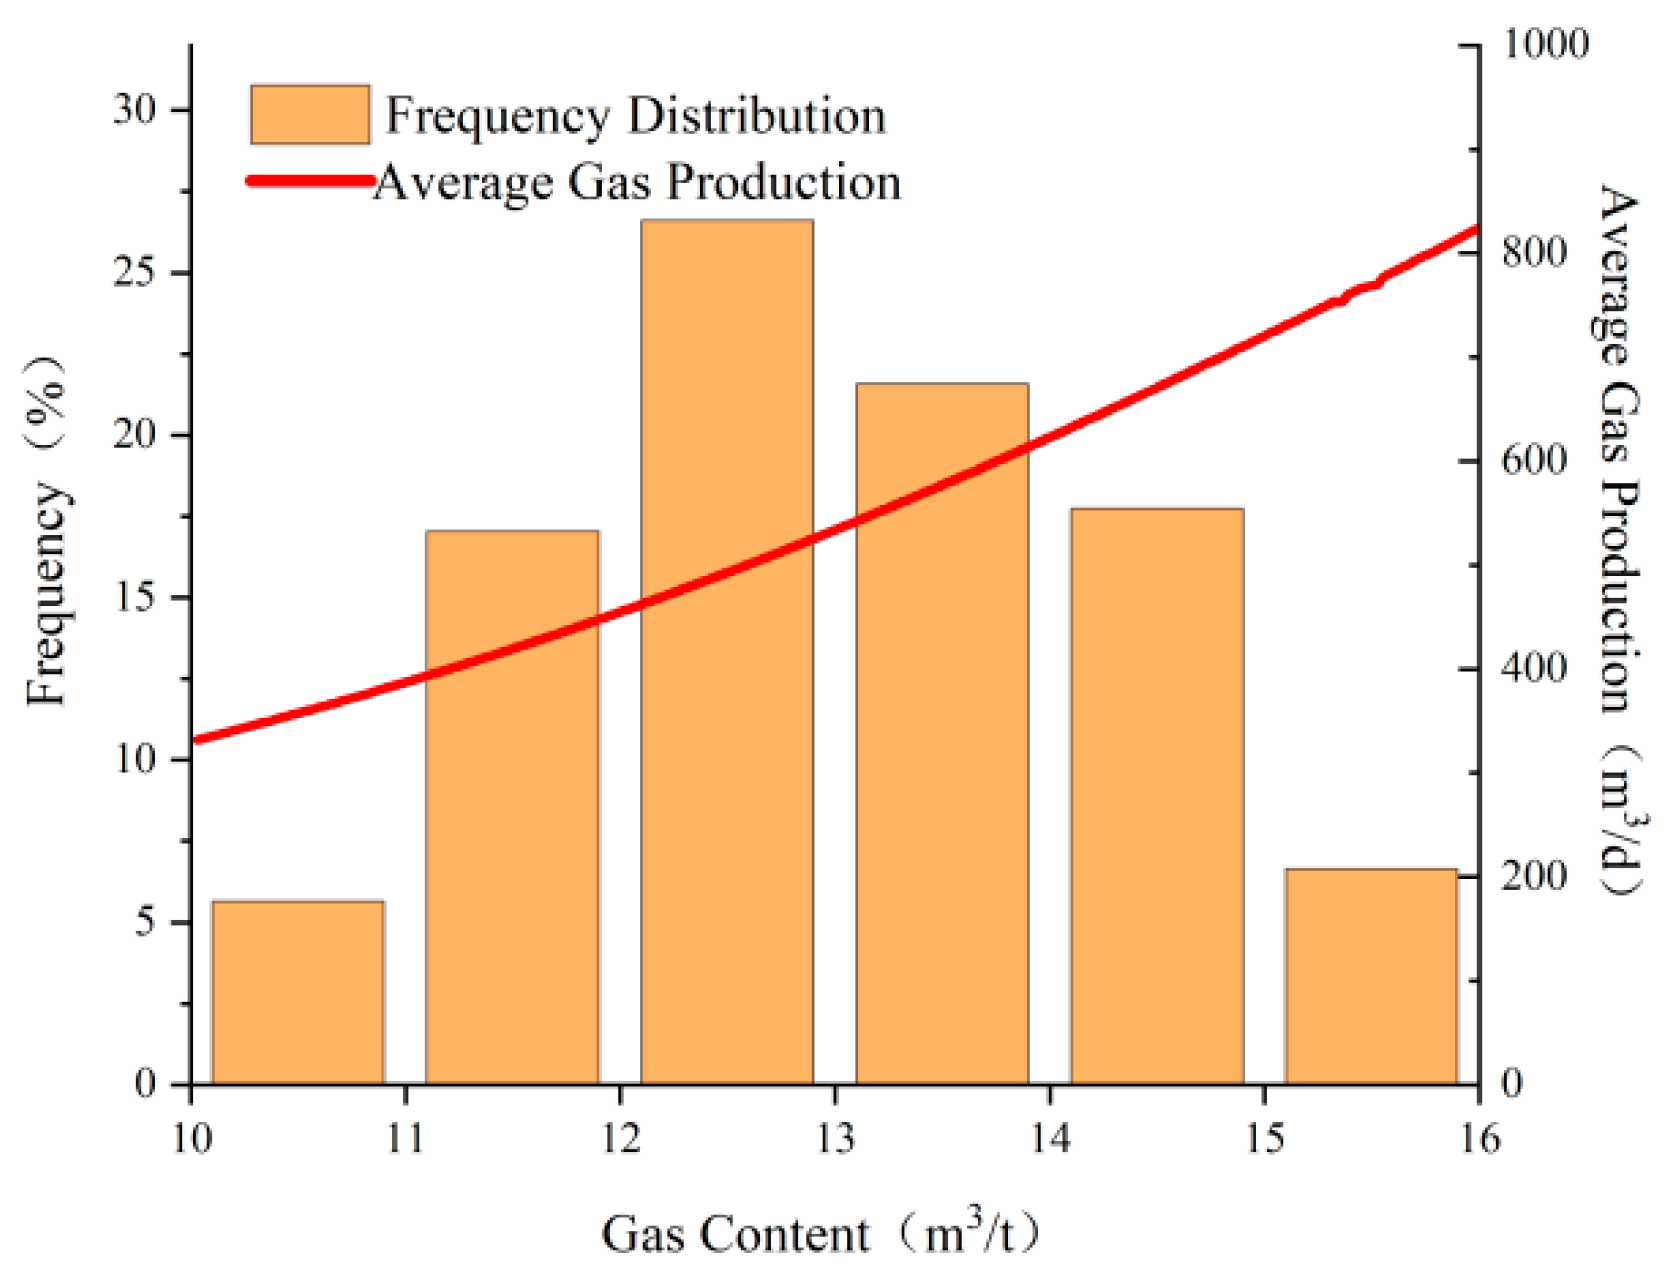
Gas content refers to the volume of methane within a unit mass of a reservoir, similar to coal seam thickness, it impacts the quantity of resources in the coal seam, which subsequently influences the production capacity. Based on geological statistics and fitting results, the main gas production range of the fifth coal seam in the study area is 8–15 m
3/t, following a normal distribution. The 11th coal seam has a gas content of 12.9 m
3/t. The predicted results, as shown in
Figure 16, indicate that as the gas content increases, the time to reach gas, gas production rate, and gas production peak all increase. The decline rate of later-stage productivity also increases. Average gas production increases within the gas content range, with variations between 320–720 m
3/d. The daily average gas production varies by about 400 m
3 (
Figure 17). Higher gas content leads to larger coal seam resources, resulting in a higher gas production peak. With Langmuir volume and Langmuir pressure remaining constant, higher gas content leads to a lower critical desorption pressure. Under the same wellbore pressure trend, a higher gas content reaches the gas production point earlier.
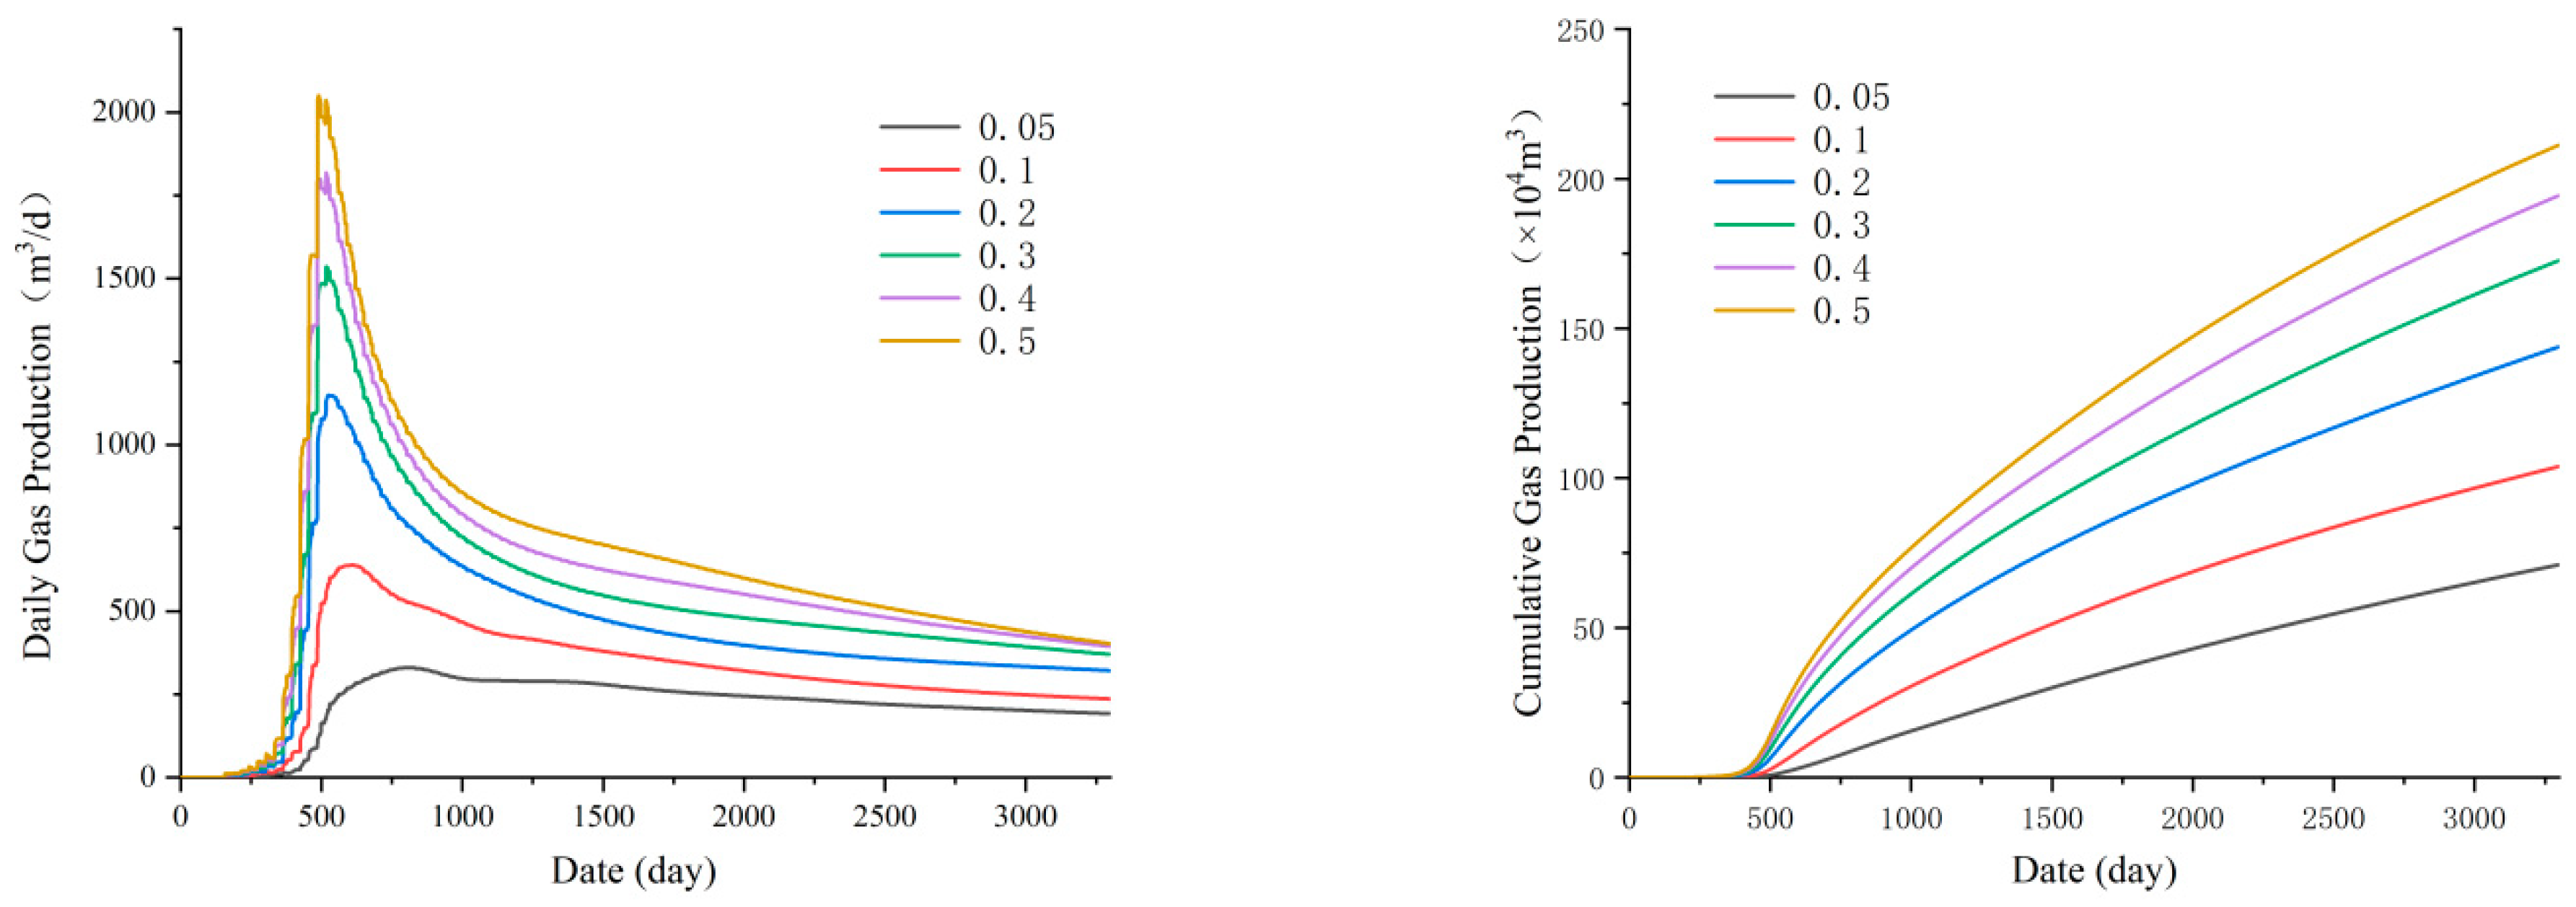
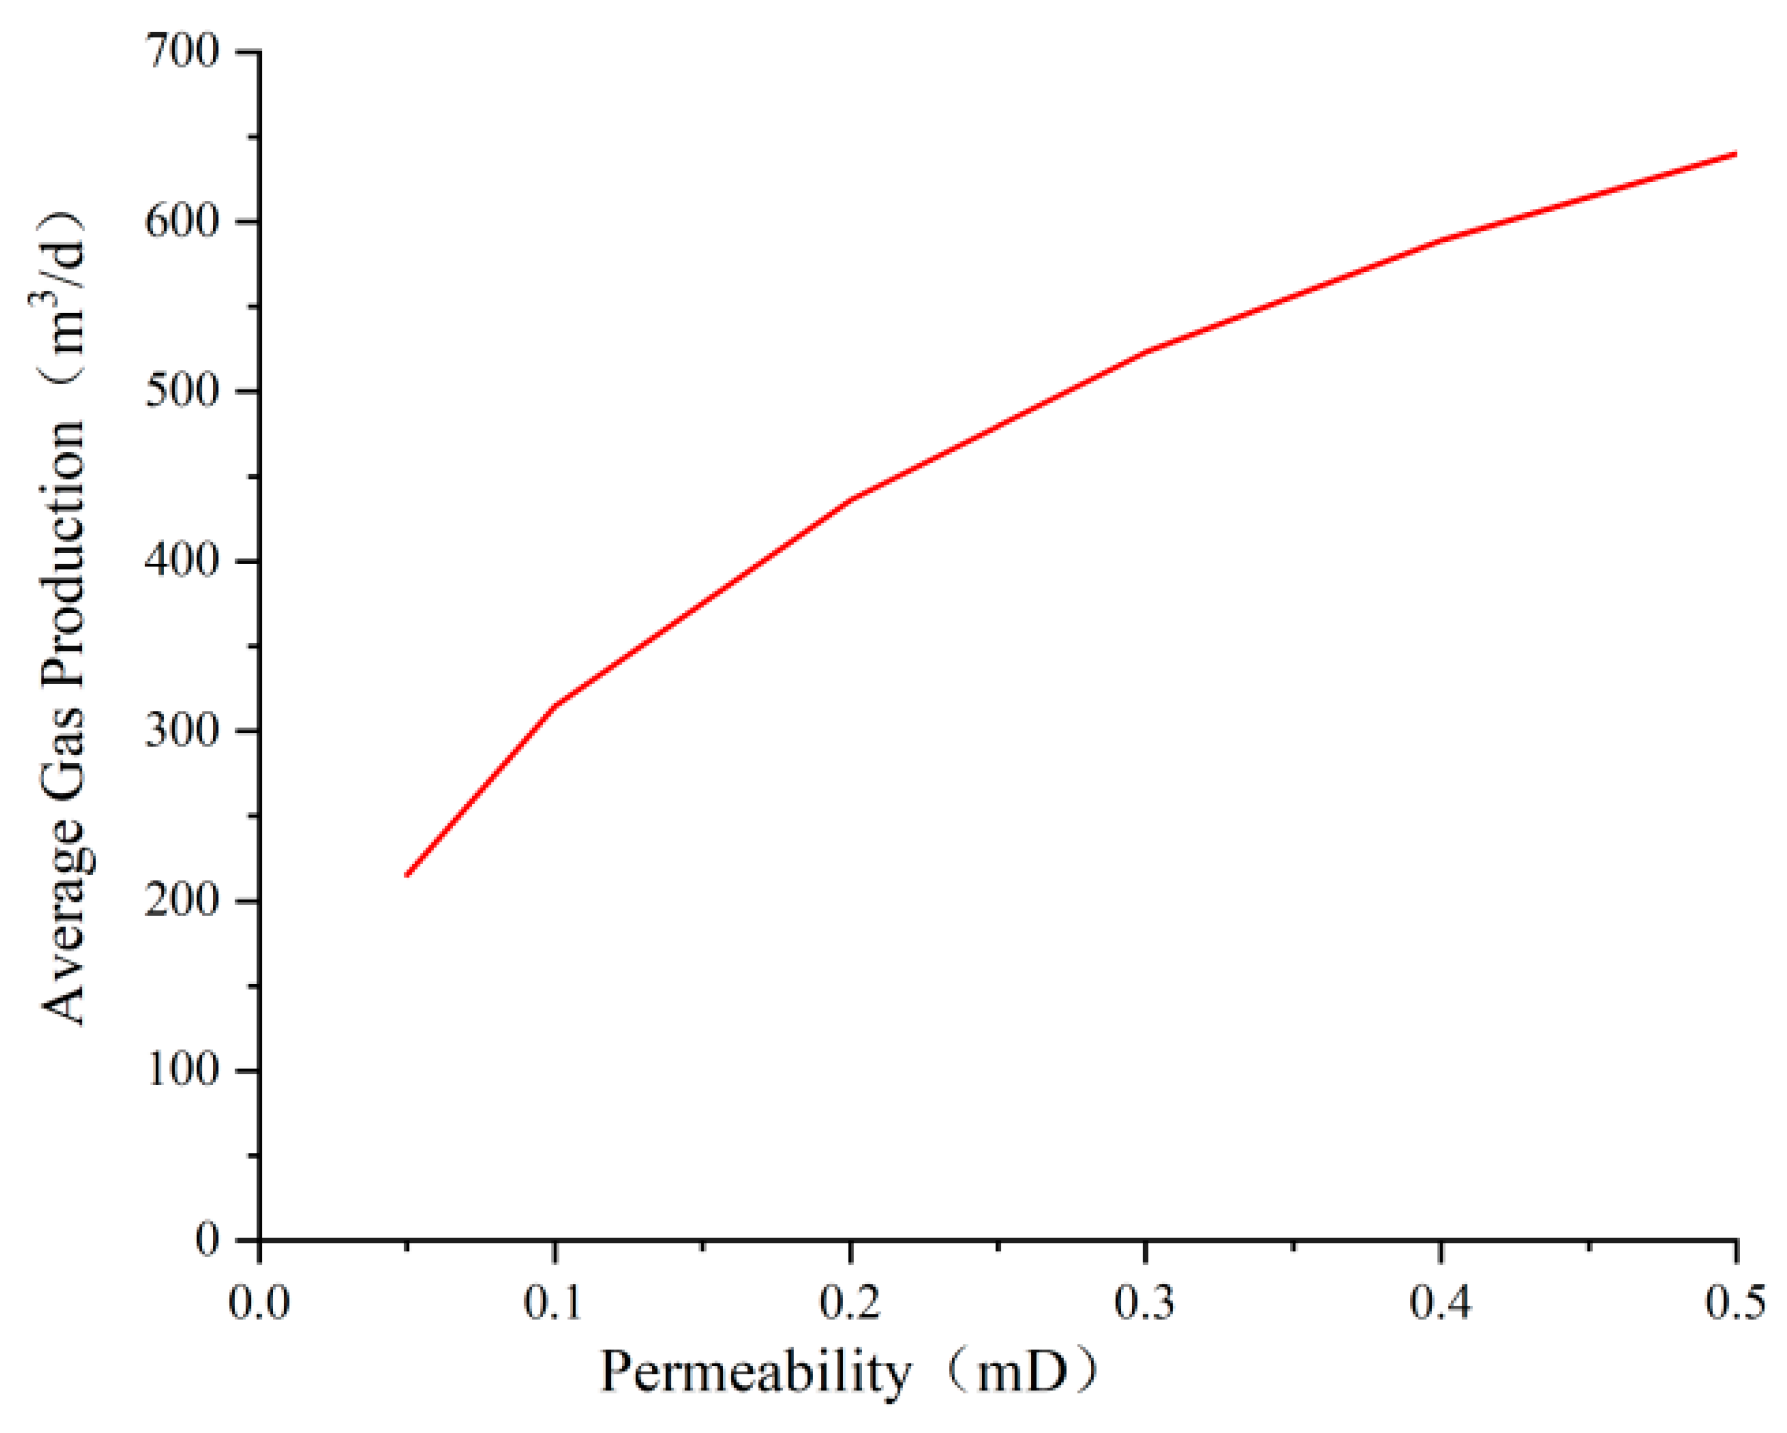
Coal seam permeability is a crucial parameter controlling the flow of fluids within the reservoir. The greater the permeability of the reservoir, the easier it is for gases to flow from the reservoir to the wellbore, resulting in an increased gas production rate. The study area consists of low-permeability reservoirs, with permeability ranging from 0.01 to 0.5 mD.
Figure 18 illustrates the impact of different permeabilities on gas production. The permeability of the 5th coal seam varies between 0.05 mD and 0.5 mD, while the 11th coal seam has a permeability of 0.2 mD. The predictive results, as shown in
Figure 15, indicate that reservoir permeability has a significant influence on gas behavior. With higher reservoir permeability, drainage efficiency is enhanced, resulting in earlier gas production, higher gas production rates, and higher production peaks. Within the range of 0.05 mD to 0.5 mD, the average gas production increases from 200 m
3/d to 620 m
3/d, with a substantial variation of up to 420 m
3 (
Figure 19).
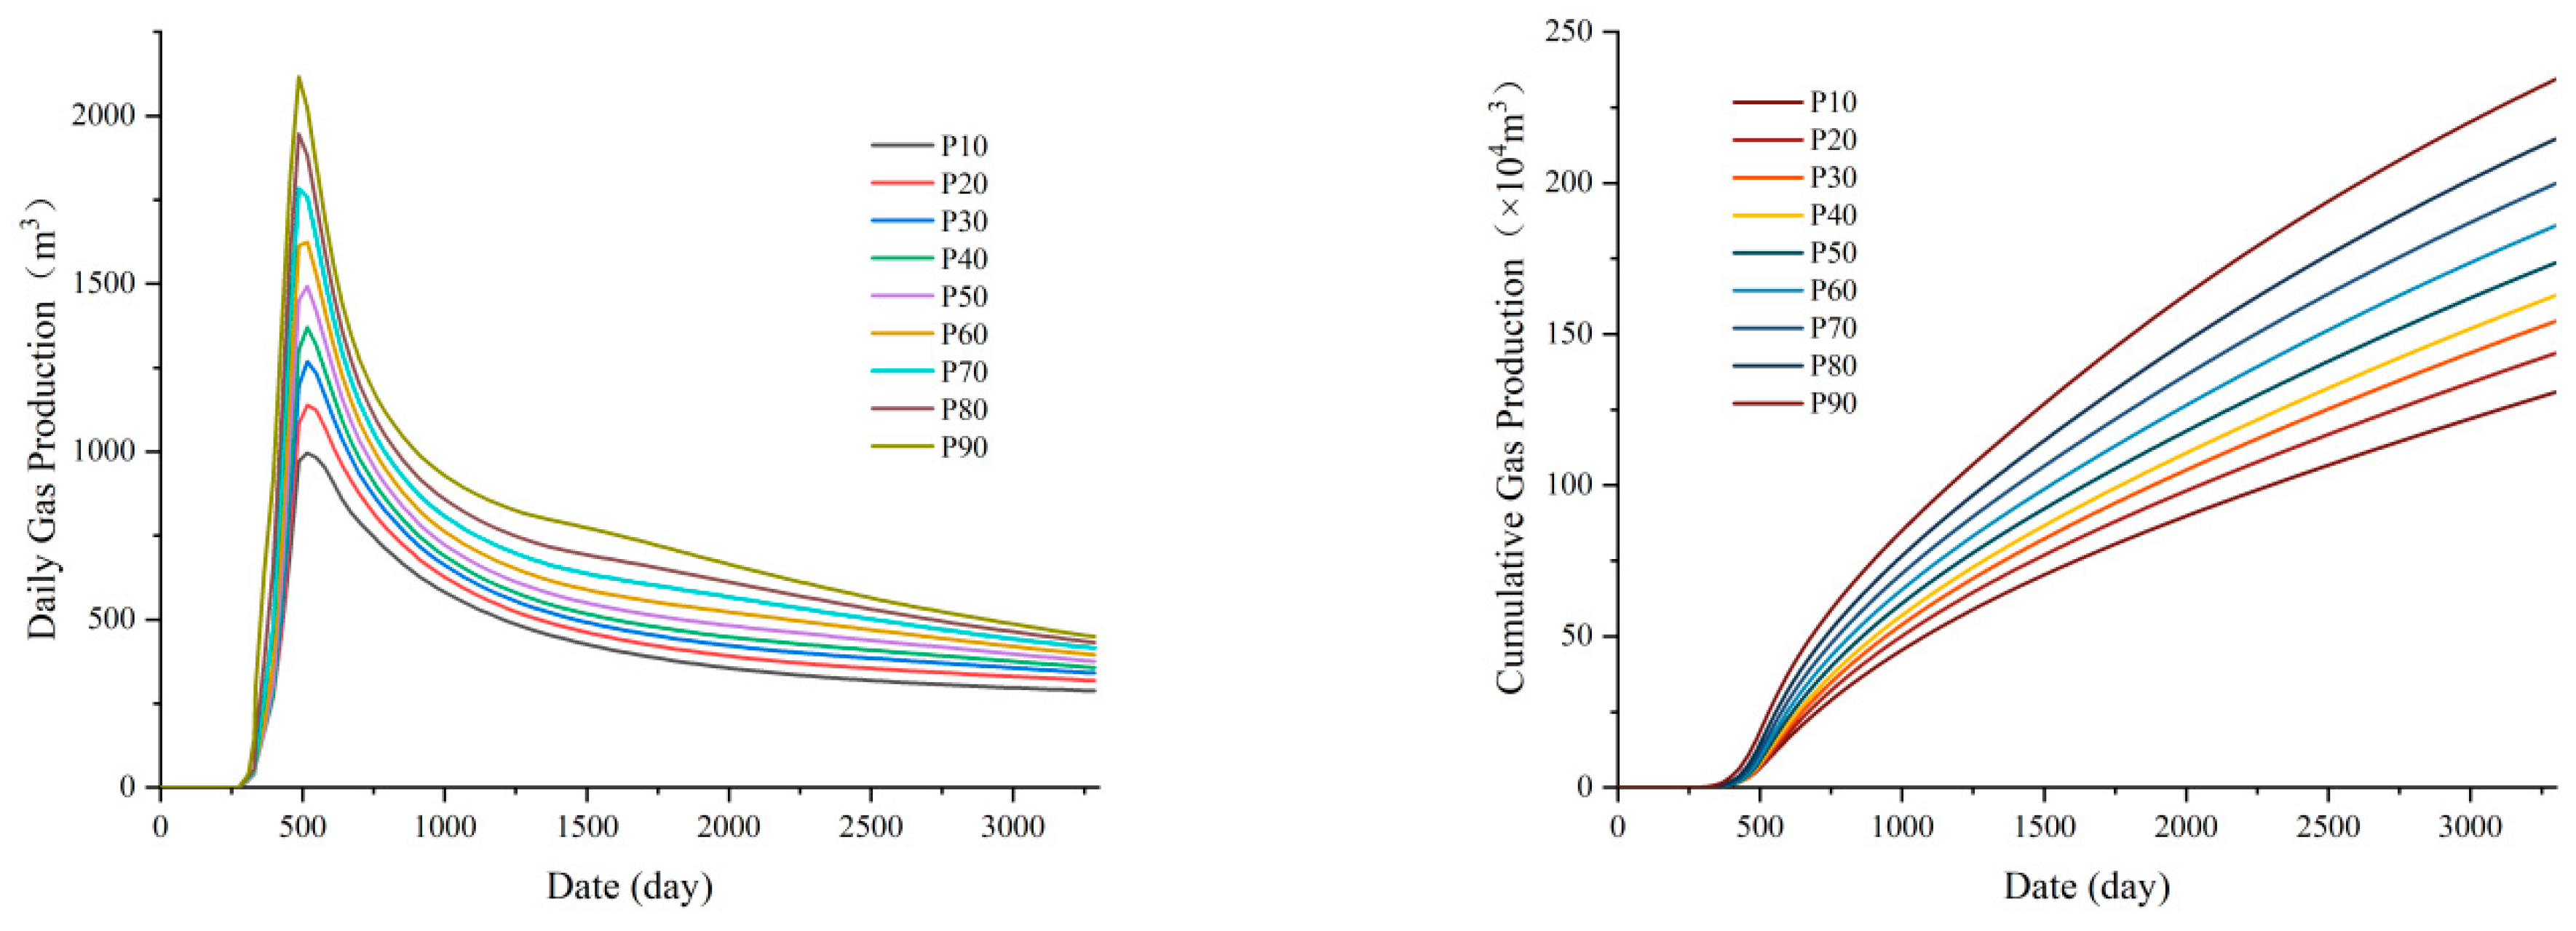
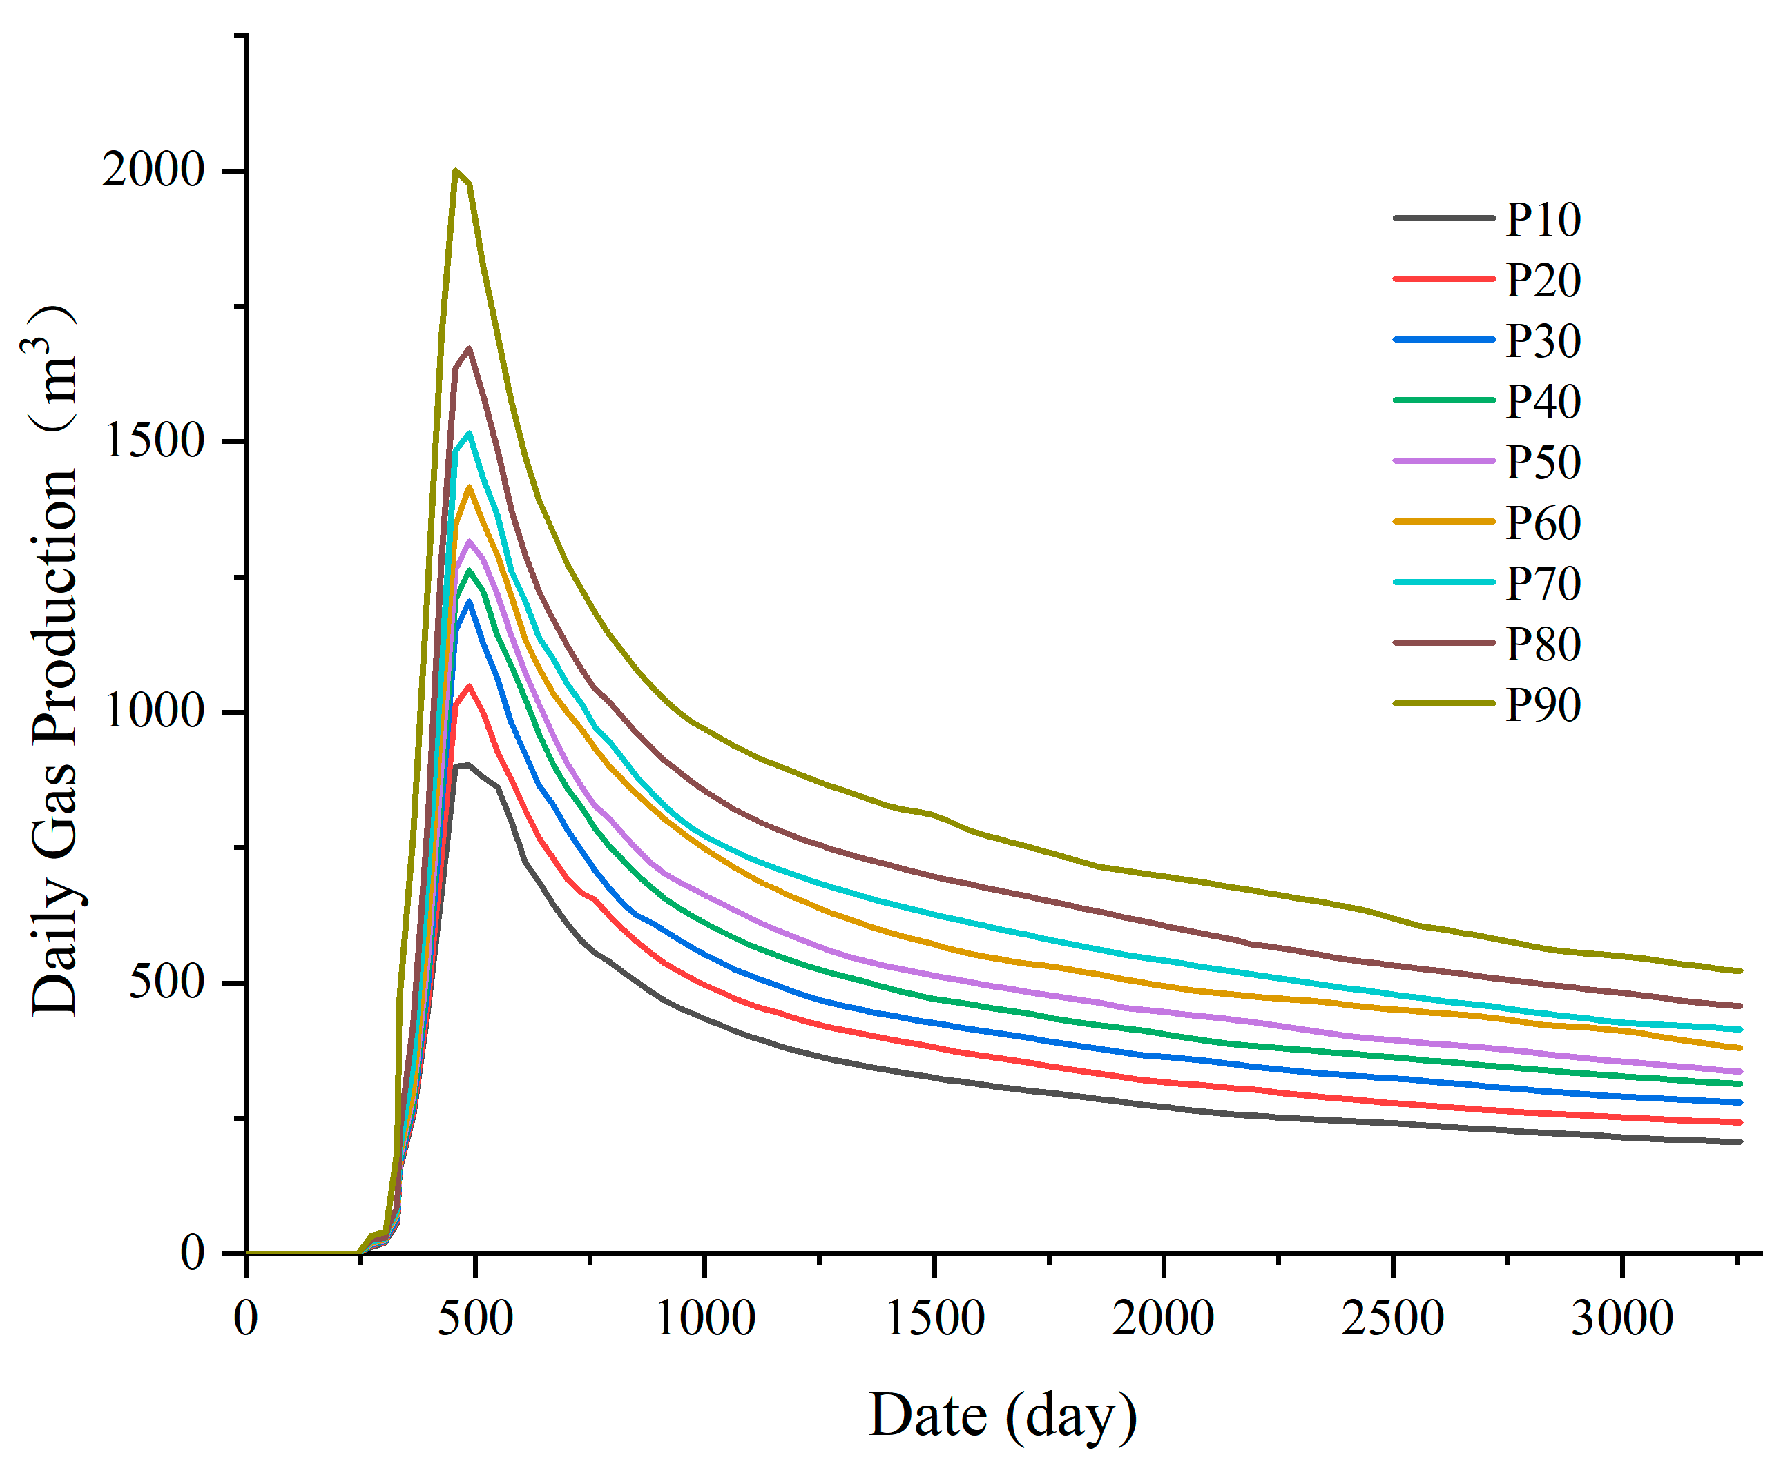
Due to the joint influence of multiple factors on the production capacity of coalbed methane, a comprehensive analysis was conducted on the three influencing factors mentioned above. By utilizing the variation range of various geological factors in Coal Seam 5, a model was imported for numerical simulation to obtain the variation range of production capacity in the Hanchengbei Block (
Figure 20). From the figure, it can be seen that the study area is affected by geological factors, and the gas production time of coalbed methane wells is roughly the same as the time to reach the peak gas production, which has a significant impact on the peak gas production. The peak production capacity varies from 900–2100 m
3/d, and the average gas production is between 310–730 m
3/d. Selecting a gas production rate with a cumulative probability of 50% as the most likely production capacity of the Hanchengbei Block, the highest gas production rate was 1315 m
3/d, and the cumulative gas production per well was 158.12 × 10
4 m
3.
3.4. Discussion
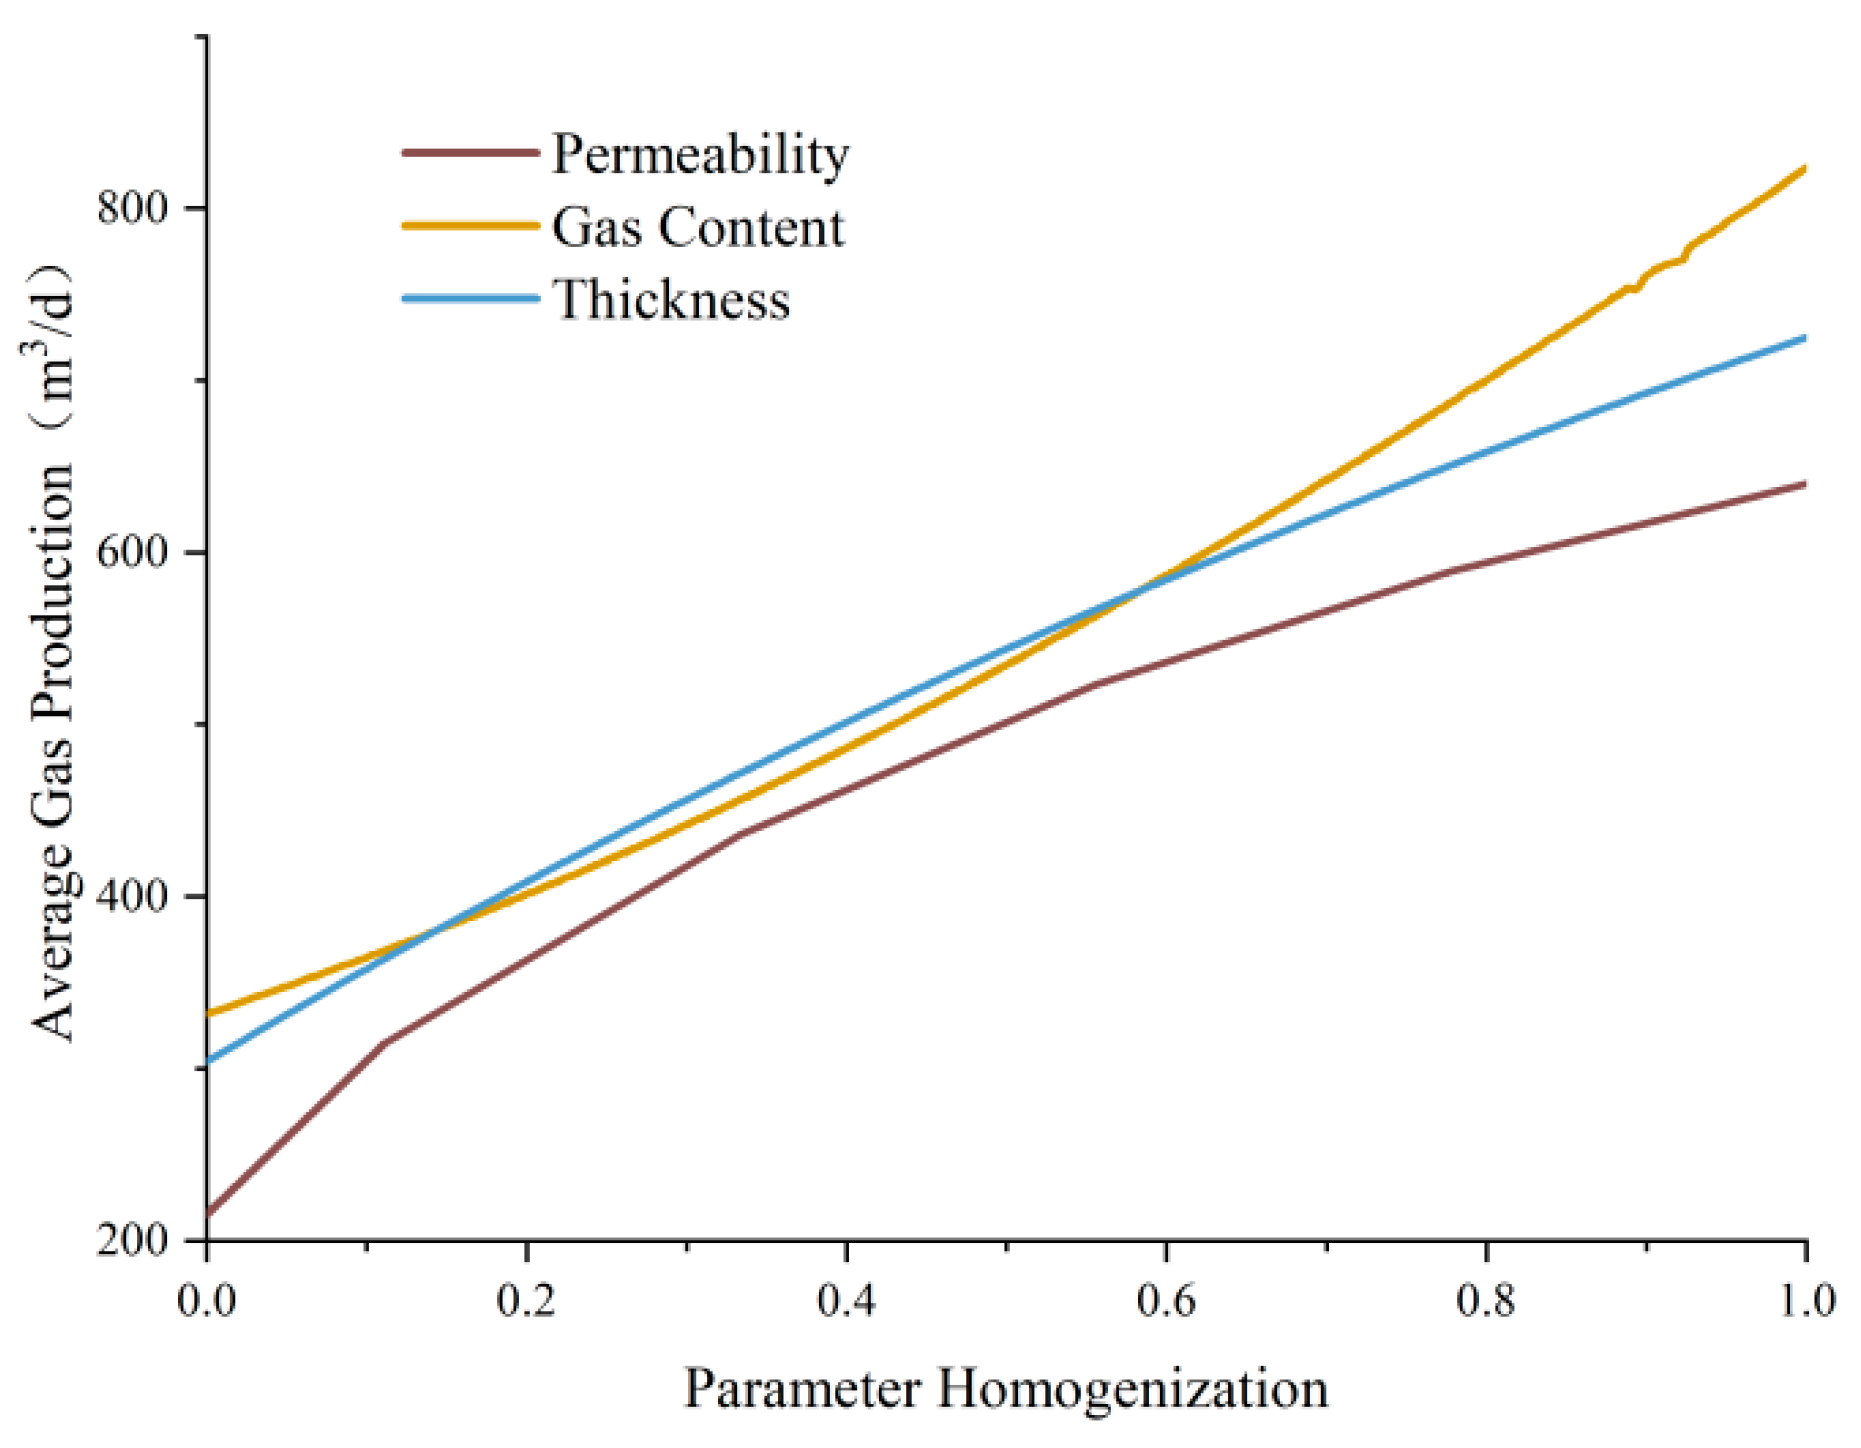
Based on the simulation and prediction method using bottom-hole pressure modeling for gas production, different production curves for various parameters were generated. Through single-factor analysis and parameter normalization, relationships between the average gas production and different geological factors were plotted, resulting in a graph illustrating the impact of each parameter on the average gas production within the study area.
Under this production system, coal seam thickness, gas content, and permeability are all positively correlated with average gas production. When assessing the influence of individual geological parameters on average gas production, permeability exhibits the greatest sensitivity, followed by gas content and thickness. After normalization, the changes in average gas production within the range of different parameter variations in the study area show that gas content has the strongest sensitivity, followed by thickness and permeability (
Figure 21). This is because although permeability has the most significant impact on gas production, the study area primarily consists of low-permeability reservoirs, resulting in a limited range of permeability variation and, thus, a more moderate impact on coal seam gas production.
4. Conclusions
Three-dimensional geological modeling is an important method for accurately characterizing reservoir features and properties. Based on the reservoir characteristics of the study area, a layer-based model for the 5th and 11th coal seams is established using interpolation methods and layer data. A three-dimensional structural model is constructed using seismic interpretation trend surfaces as a control. According to the structural model, the overall structure of the study area is relatively simple. The thickness of the 5th coal seam ranges from 1.7 to 7.2 m, with an average net thickness of 3.7 m. The gas content varies from 8.76 to 14.87 m3/t, with an average gas content of 11.9 m3/t, and the permeability ranges from 0.01 to 0.50 mD.
Based on the modeling results, the distribution of various geological parameters is analyzed. Normal distribution functions are established to represent the uncertainty of parameters influencing coalbed methane production. Uncertainty estimates are made for each parameter, and the P5–P95 range is selected as the confidence interval to provide a range for subsequent simulations. The conclusions are drawn as follows: the main distribution range of the thickness of Coal Seam 5 in Hanchengbei Block is [1.35, 6.89]; the gas content is mainly distributed between 10.28–15.52 m3/t; the permeability is relatively low, mostly between [0.014, 0.048].
Based on the results of Monte Carlo simulations, the average coalbed methane production is positively correlated with coal thickness, gas content, and permeability. The sensitivity factors affecting coalbed methane production, ranked from most to least significant, are coal thickness, gas content, and permeability. Among these factors, coal thickness and gas content have a greater impact on gas production in the research area.
Considering three factors comprehensively, the peak gas production of a single production well in the Hanchengbei Block may range from 900–2100 m3/d, with an average gas production of 310–730 m3/d. Select a cumulative probability of 50% as the representative production capacity of the Hanchengbei Block, the peak gas production is 1315 m3/d, and the cumulative production capacity of a single well is 158.12 × 10⁴ m3. This study can provide a basis for the subsequent optimization of favorable areas, the formulation of drainage systems, and the design and optimization of development well networks.


 ,
, 
