Article

Synthesis, Characterization, and Performance of Nano-Metal-Oxide (Al2O3) Blended Biochar for the Removal of Iron from Contaminated Water for Enhanced Kinetic and Adsorption Studies

by
Aftab Ahmad Khan
1,
Javed Iqbal
2,
Muhammad Tariq Bashir
2,*,
Muhammad Tahir Amin
1,
Muhammad Ali Sikandar
2,
Muhammad Muhitur Rahman
1 and
Md. Arifuzzman
1
1
Department of Civil and Environmental Engineering, College of Engineering, King Faisal University, Al-Ahsa 31982, Saudi Arabia
2
Department of Civil Engineering, CECOS University of IT and Emerging Sciences, Peshawar 5200, Pakistan
*
Author to whom correspondence should be addressed.
Processes 2023, 11(12), 3423; https://doi.org/10.3390/pr11123423
Submission received: 7 November 2023 / Revised: 8 December 2023 / Accepted: 11 December 2023 / Published: 13 December 2023
(This article belongs to the Special Issue Adsorption Kinetics and Thermodynamics: Analysis and Applications)

Abstract

:
This paper explored synthesis, characterization, and adsorption modeling for the application of nano-metal-oxide (Al2O3) blended biochar (NMOBC) derived from date palm waste in removing iron (Fe3+) from contaminated water. The pseudo-second-order model provided a goodness-of-fit that was superior to the pseudo-first-order kinetic model based on the value of R2 with all of the initial concentrations. The Elovich kinetic model also presented a good fit, indicating that chemisorption is a predominant mechanism in the adsorption process. The Langmuir, Freundlich, Redlich-Petersons, Temkin, and Sips models provided an exclusive perspective of the adsorption dynamics based on the high value of R2. However, the Sips model suggested the best fit of all of the employed models, with the lowest RMSE value of 0.0239 mg/g and the maximum adsorption capacity of 22.680 mg/g for NMOBC. Both adsorbents were effectively regenerated and reused in multiple cycles, thus leading to sustainable practices. Numerous analytical techniques, including SEM/EDX, FTIR, and BET, were employed in characterizing the structural, morphological, and functional properties of the synthesized NMOBC and BC. Subsequently, it revealed that the adsorption process and the role of various interactions are attributed to surface area, porosity, and ion exchange.

1. Introduction

Water quality is a principal concern in both developing and developed countries. Groundwater is considered a primary source of potable water for a significant portion of the population around the globe, which is vulnerable to contamination from various sources [1,2,3]. Among the contaminants, metals such as Iron (Fe3+) are frequently observed in groundwater, particularly in regions under rocky geological formations. The presence of these metals, even in trace amounts, can compromise the water’s appearance and usability for both domestic and industrial purposes. Regulatory bodies worldwide have established permissible limits for the metals in drinking water and the threshold value for Fe is 0.3 mg/L [2,4]; exceeding this concentration affects the water’s sensory properties and raises concerns about the potential health implications and challenges in industrial applications. Based on these problems, there is a persistent need for efficient and economically viable methods to mitigate Fe concentrations in water sources [2,5].
Over the years, many methods have been proposed and examined for metal ion removal. However, adsorption has emerged as one of the most promising techniques. It is defined as a surface-bound phenomenon that entails the accumulation of adsorbates on the substrate of an adsorbent or at the interface between two phases. This aggregation is mediated through a variety of interactions including but not limited to electrostatic attraction, ion exchange, cation-π interactions, hydrophobic hydration, and van der Waals forces [2,6,7]. Adsorbates may form a strong bond via chemisorption, involving covalent or ionic interactions, or a weak bond with the adsorbent surface that results in physisorption, typically via van der Waals interactions [2,7,8]. In addition, its acceptance can be attributed to several factors, such as operational flexibility, high efficiency, reproducibility, and potential for cost savings. Significantly, using naturally occurring or waste-derived materials as precursors for adsorbents can further drive down treatment costs, making the method more accessible to communities and industries with budget constraints.
Several researchers have delved into adsorption studies, exploring various materials as potential adsorbents. For instance, Toli et al. [1] investigated the efficacy of tea waste activated with different agents in removing methylene blue from water [1]. Their findings highlighted the superior adsorption capacity of the H3PO4-activated adsorbent. Similarly, Hameed and El-Khaiary [9] utilized rice straw char for malachite green removal, confirming its suitability for dye elimination [9]. Each material offers unique properties and advantages, shaped by its inherent composition and undergoing modifications. The interplay of functional groups such as carboxyl, amine, hydroxyl, and carbonyl, especially in lignocellulose-based biosorbents, such as rice and maize straw [9,10], tea leaves, banana peels [11], palm kernel shells [12], and olive fruit waste [13], facilitates metal ion bonding and enhances adsorption performance.
The advent of nanotechnology has paved a path for environmentally friendly sorbents. Nanoscale metal coatings not only introduce new reactive sites but also enhance the affinity of biochar towards specific metal ions. In particular, the adsorption of iron, a prevalent contaminant in groundwater and industrial effluents, can be remarkably efficient with the nano-metal-oxide blended biochar [2,14,15]. This combination harnesses the natural sorptive properties of biochar and the reactivity of nano-metals, creating a system that is both effective and environmentally benign [14]. Furthermore, this endeavor entails impregnating biochar with diverse functional nanoparticles, leveraging biochar as a foundational matrix to stabilize these nanomaterials. These emergent composite materials exhibit enhanced physicochemical properties compared to unmodified biochar. Subsequently, they possess augmented surface-active sites, an expanded specific surface area, high porosity, augmented stability, and superior recyclability [2,15]. Moreover, a complex interplay results between the adsorptive ability of biochar and the generation of free radicals by the integrated nano-catalysts. Subsequently, the adaptability of this material, given the ability to tailor the nano-metal coatings to target specific contaminants, underscores its potential in diverse water treatment scenarios and offers a promising avenue for future research [6,14,16,17]
Considering Al2O3 nanoparticles, the large surface area provides numerous prospects for creating pores, resulting in enhanced porosity [18,19]. In addition, nano-sized (Al2O3) particles possess increased surface reactivity, making them more prone to chemical reactions that can lead to the formation of pores. For instance, the surface of Al2O3 nanoparticles can readily react with other chemicals and materials to create pores. Furthermore, they possess different mechanical and thermal properties from their bulk counterparts. These characteristics can induce porosity, as smaller particles may deform or fracture more easily and develop pores [18,19]. Hence, the enhanced porosity of nano-metal materials such as Al2O3 is primarily attributed to their high surface area, increased surface reactivity, and size-dependent properties. These properties can permit the development of tailored porous materials with potential applications in various fields, including catalysis and water filtration. Notably, no study has hitherto been accompanied to assess the characteristics and performance of Al2O3 (nano-metal oxide) blended biochar synthesized from the stems of date palm for the adsorption dynamics of iron.
To comprehend the efficacy and mechanisms of biochar and nano-metal-oxide (Al2O3) blended biochar, sophisticated analytical techniques have been employed. Characterizations such as Fourier transform infrared spectra (FTIR), scanning electron microscopy (SEM), EDX, and the BET area provide invaluable insights into the adsorbents’ structural, morphological, and functional properties, as well as the pore size guiding researchers in optimizing their performance. To provide robust analysis, this study employed different isotherm and kinetic mathematical models to interpret the behavior of the system under varying conditions. Our findings aim to establish the viability of the proposed biosorbents as a promising alternative for iron removal from contaminated water sources.

2. Materials and Methods

2.1. Materials and Reagents

The present study employed deionized (DI) water (Nuclease, Shanghai, China) to prepare all aqueous solutions. Various chemicals, including iron chloride (FeCl3·6H2O), nano-aluminum oxide (Al2O3), hydrochloric acid (HCl), sodium hydroxide (NaOH), and ethanol (CH3CH2OH), were utilized without subsequent purification. All chemicals and reagents procured from Merck (Merck, Darmstadt, Germany) were of analytical grade.

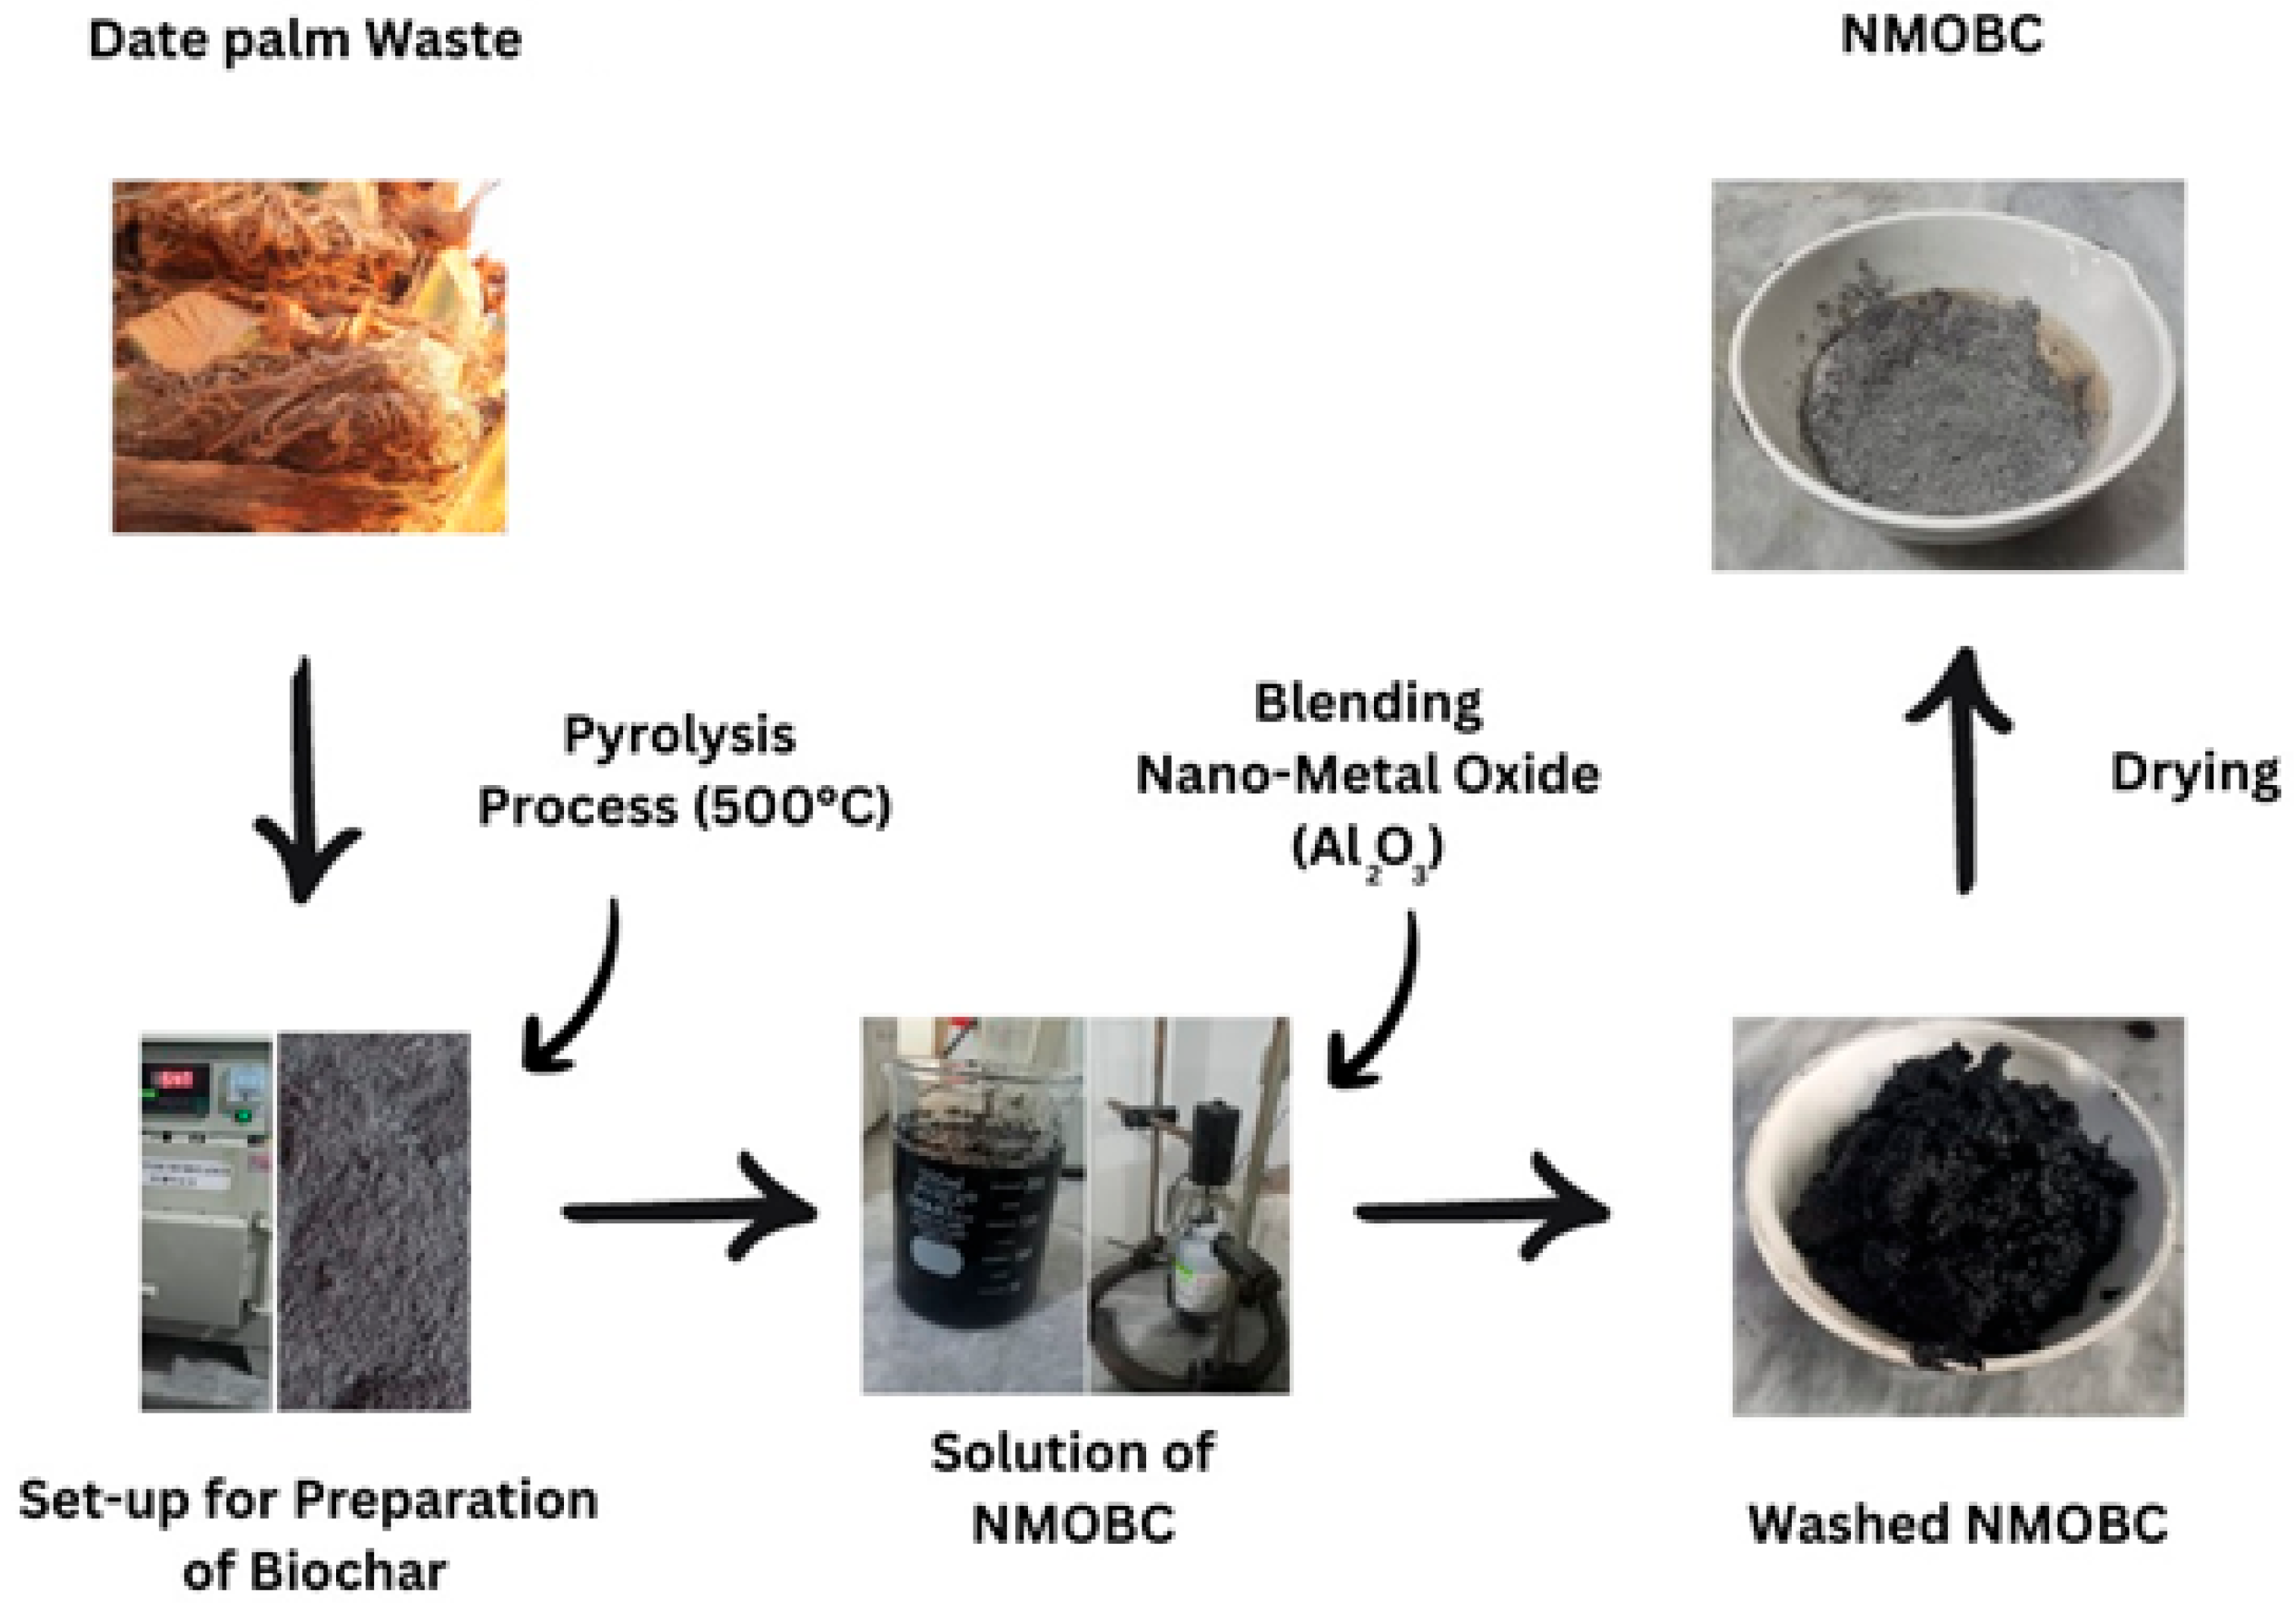
2.2. Synthesis of Biochar Using Date Palm Stems

Residues of date palm Stems (DPS) collected from arid regions in Peshawar, Pakistan, were converted into biochar through pyrolysis. Prior to pyrolysis, the DPS fibers were meticulously cleaned to eliminate unnecessary soil and debris, ensuring the derivation of uncontaminated, high-quality biochar. After cleaning, the durable fibers composing the outer layer were manually separated, a process vital for enhancing the combustion during pyrolysis and thus generating biochar [2,20].
The fibers obtained from DPS were washed, dried at 85 °C for 24 h, and processed to create biochar in a sealed furnace, with a gradual temperature increase of 10 °C per minute until 500 °C was attained. This temperature was sustained for 30 min. Post pyrolysis, the biochar was carefully extracted, stored in an airtight container, and subsequently pulverized to a particle size of 75 µm in a ball mill, a process shown to have minimal impact on biochar crystallinity and composition [2,21].

2.3. Formulation of Nano-Metal Oxide (Al2O3) Blended Biochar

Nano-metal-oxide blended biochar (NMOBC) was synthesized utilizing a one-step hydrothermal method. For this, 5 g of biochar and 1% nano-Al2O3 were immersed in a mixture containing 150 mL of ethanol and 50 mL of DI water. The solution was magnetically stirred for 20 min at room temperature and then sonicated for an additional 20 min, followed by 4 h of rigorous stirring. Subsequent to separating the resultant material from the solvent, it was successively washed with ethanol and DI water, oven-dried at 60 °C overnight, and pyrolyzed in a muffled furnace at 500 °C for an hour under an ambient atmosphere with a heating rate of 10 °C per minute [2]. This technique facilitated the formulation of nano-metal-oxide (Al2O3) blended biochar composites, demonstrating enhanced properties for potential applications. Figure 1 illustrates the steps involved in the synthesis methodology opted for the formulation of NMOBC.

2.4. Formulation of Iron Solutions

The synthetic solution of iron was prepared by accurately weighing and dissolving high-purity iron chloride (FeCl3·6H2O) in DI water, resulting in desired concentrations of 1000 mg L−1. The suitable dilutions were performed for the required varying concentrations.

2.5. Characterization of BC and NMOBC

BC and NMOBC utilized within this experimental set-up of research were subjected to numerous characterization methodologies. The surface morphology and elemental composition of both BC and NMOBC were examined by SEM combined with EDX (S-3400N, Hitachi, Tokyo, Japan). For SEM analysis, the adsorbents powder was spread on double-sided adhesive tape fixed onto an SEM stub. To improve the electrical conductivity and achieve better image quality, the edges of the tape were coated with a thin gold layer. The SEM images were captured at a voltage of 25 kV and a magnification of 400× to provide a detailed overview of the carbon surfaces.
In order to investigate the functional groups that exist on the surface of the carbon materials, Fourier Transform Infrared Spectroscopy (FTIR) was conducted. The FTIR spectra were recorded in the range of 400–4000 cm−1 using a Perkin-Elmer spectrometer (1750X, Perkin Elmer, Waltham, MA, USA). The adsorbent samples were mixed with potassium bromide (KBr) and compacted into pellets containing 0.5% by weight of carbon before subsequent analysis. This method was vital for understanding the surface chemistry of both BC and NMOBC by identifying the various functional groups that could be detected in the infrared spectrum. In addition, to determine the surface area of the samples, the BET method was utilized using an AutoSorb-1 Quantachrome (Hook, UK). The BJH equation developed by Barrett, Johner, and Halenda, was utilized to ascertain the pore size distribution, the average pore size, and the pore volume of both BC and NMOBC.

2.6. Iron Adsorption Process on BC and NMOBC

Numerous sets of batch studies were performed to examine the performance of the adsorption process for iron ions. Experiments involved stoppered flasks containing measured quantities of Fe+3 aqueous solutions and a predetermined amount of the NMOBC and BC (4 g/L). Flasks were agitated at a rate of 90 rpm for a specified duration, maintaining the initial pH and a temperature of 28 °C (±2 °C). After shaking, the supernatant was carefully collected to separate the adsorbents, and the iron cation concentration of the filtrate was measured using an atomic absorption spectrophotometer (PerkinElmer 2380, Perkin Elmer). The pH of the solutions was adjusted using either hydrochloric acid or sodium hydroxide to establish the requisite conditions for the study. These batch studies evaluated the influence of various parameters, such as the initial iron concentration, contact time, initial suspension pH at specific BC and NMOBC dosages (4 g/L), and subsequent examination of their impacts on adsorption. Initial iron concentrations were set at 5, 10, 15, 20, 25, and 30 mg. L−1 with a solution pH around neutral (7 ± 2). Tests, conducted in 250 mL Erlenmeyer flasks containing 100 mL of sample and mixed at 28 °C (±2 °C), were repeated thrice to minimize errors.

2.7. Adsorption Process Modeling

2.7.1. Kinetic Modeling for Iron Removal

For the modeling of the adsorption process, different kinetic models, including the pseudo-first-order (Equation (1)), pseudo-second-order (Equation (2)), and Elovich models (Equation (3)), were used. The models aimed to describe the dynamics of iron ion uptake by BC and NMOBC. The pseudo-first-order model assumes that there are a fixed number of vacant sites and an occupancy rate of adsorption sites as well. The pseudo-second-order model, on the other hand, postulates that adsorption occurs encompassing chemisorption and suggests that valence forces may be involved in the rate-limiting phase through electron exchange or sharing between the adsorbent and adsorbate. In addition, the Elovich equation (Equation (3)) is generally applied to describe chemisorption on heterogeneous surfaces, implying varying energy adsorption sites on the adsorbent. It involves the determination of certain parameters that are essential for accurately representing the reaction. These models help understand the kinetics of iron ion adsorption and identify the most suitable parameters for an effective treatment process [2,22,23].
ln q e q t = l n q e k 1 t
t q t = 1 K 2 q e 2 + 1 q e t
q t = 1 β ( l n ( α β ) + 1 β l n ( t )
Here, the constants k1 (1/min) and k2 (g/mg·min) represent pseudo-first-order and -psuedo-second-order kinetic rates, respectively. qe is the quantity of adsorbate adsorbed at equilibrium, measured in milligrams per gram. The variable “qt” represents the quantity of adsorbate that has been adsorbed at a certain time “t” in milligrams per gram (mg/g).

2.7.2. Isotherm Modeling

Langmuir, Freundlich, Redlich-Peterson, Temkin, and Sips isotherm models were utilized to evaluate the adsorbents’ applicability and efficiency of adsorption. Equations (4)–(8) provide valuable insights into the adsorption behavior and performance of the studied systems. These parameters facilitate the performance evaluation of adsorption capacities, equilibrium concentrations, and isotherm model constants, supporting comprehensive experimental data analysis and interpretation [2,12,22].
The Langmuir isotherm model (Equation (4)) is based on the assumption that adsorption occurs on a homogenous surface with a finite number of identical sites. Once a site is occupied, no further adsorption phenomena can occur at that site. While the Freundlich isotherm model applies to non-ideal adsorption on heterogeneous surfaces. It is an empirical equation (Equation (5)) that can describe reversible adsorption.
q e = q m K L C e 1 + K L C e
q e = K F C e 1 n
Here, qe refers to the amount of solute adsorbed per unit weight of adsorbent at equilibrium (mg/g), and qm is the maximum adsorption capacity corresponding to complete monolayer coverage on the surface (mg/g). In addition, KL denotes the Langmuir constant related to the energy of adsorption (L/mg). While Ce is the equilibrium concentration of the solute in the solution (mg/L). In addition, KF and n are Freundlich constants, indicating adsorption capacity and heterogeneity factor or adsorption intensity, respectively.
The Redlich-Peterson isotherm model portrays features of the Langmuir and Freundlich isotherms [2,22]. It applies to both homogeneous and heterogeneous systems and can be expressed in the form of Equation (6). On the other hand, the Sips isotherm (Equation (7)) is a combination of the Langmuir and Freundlich isotherms and can describe both homogeneous and heterogeneous adsorption systems.
q e = K R C e β 1 + a R C e β
q e = q m K S C e n 1 + K S C e n
Here, kR and αR refer to Redlich-Peterson constants, while β is the exponent that lies between 0 and 1. While qm and ks are the maximum adsorption capacity and Sips constant related to adsorption capacity, respectively. While n refers to the Sips exponent, indicating the nature of adsorption
The Temkin isotherm (Equation (8)) considers the effects of indirect adsorbate/adsorbate interactions on adsorption isotherms, assuming that the heat of adsorption linearly decreases with coverage.
q e = B T l n ( K T C e )
Here, BT and KT denote the Temkin constant related to the heat of adsorption and equilibrium binding constant (L/g).
To navigate the limitation of the conventional R2 factor, which does not account for curve errors, the Root Mean Square Error (RMSE) was calculated using Equation (9). A lower RMSE value indicates higher fitting accuracy, allowing for a more accurate evaluation of the isotherm models’ efficacy in describing the iron adsorption phenomena [24].
R M S E = 1 n i = 1 n ( y o b s , y p r e d , ) 2
Here, n denotes the number of observations. y o b s and y p r e d , are observed as well as predicted values, respectively.

3. Results and Discussion

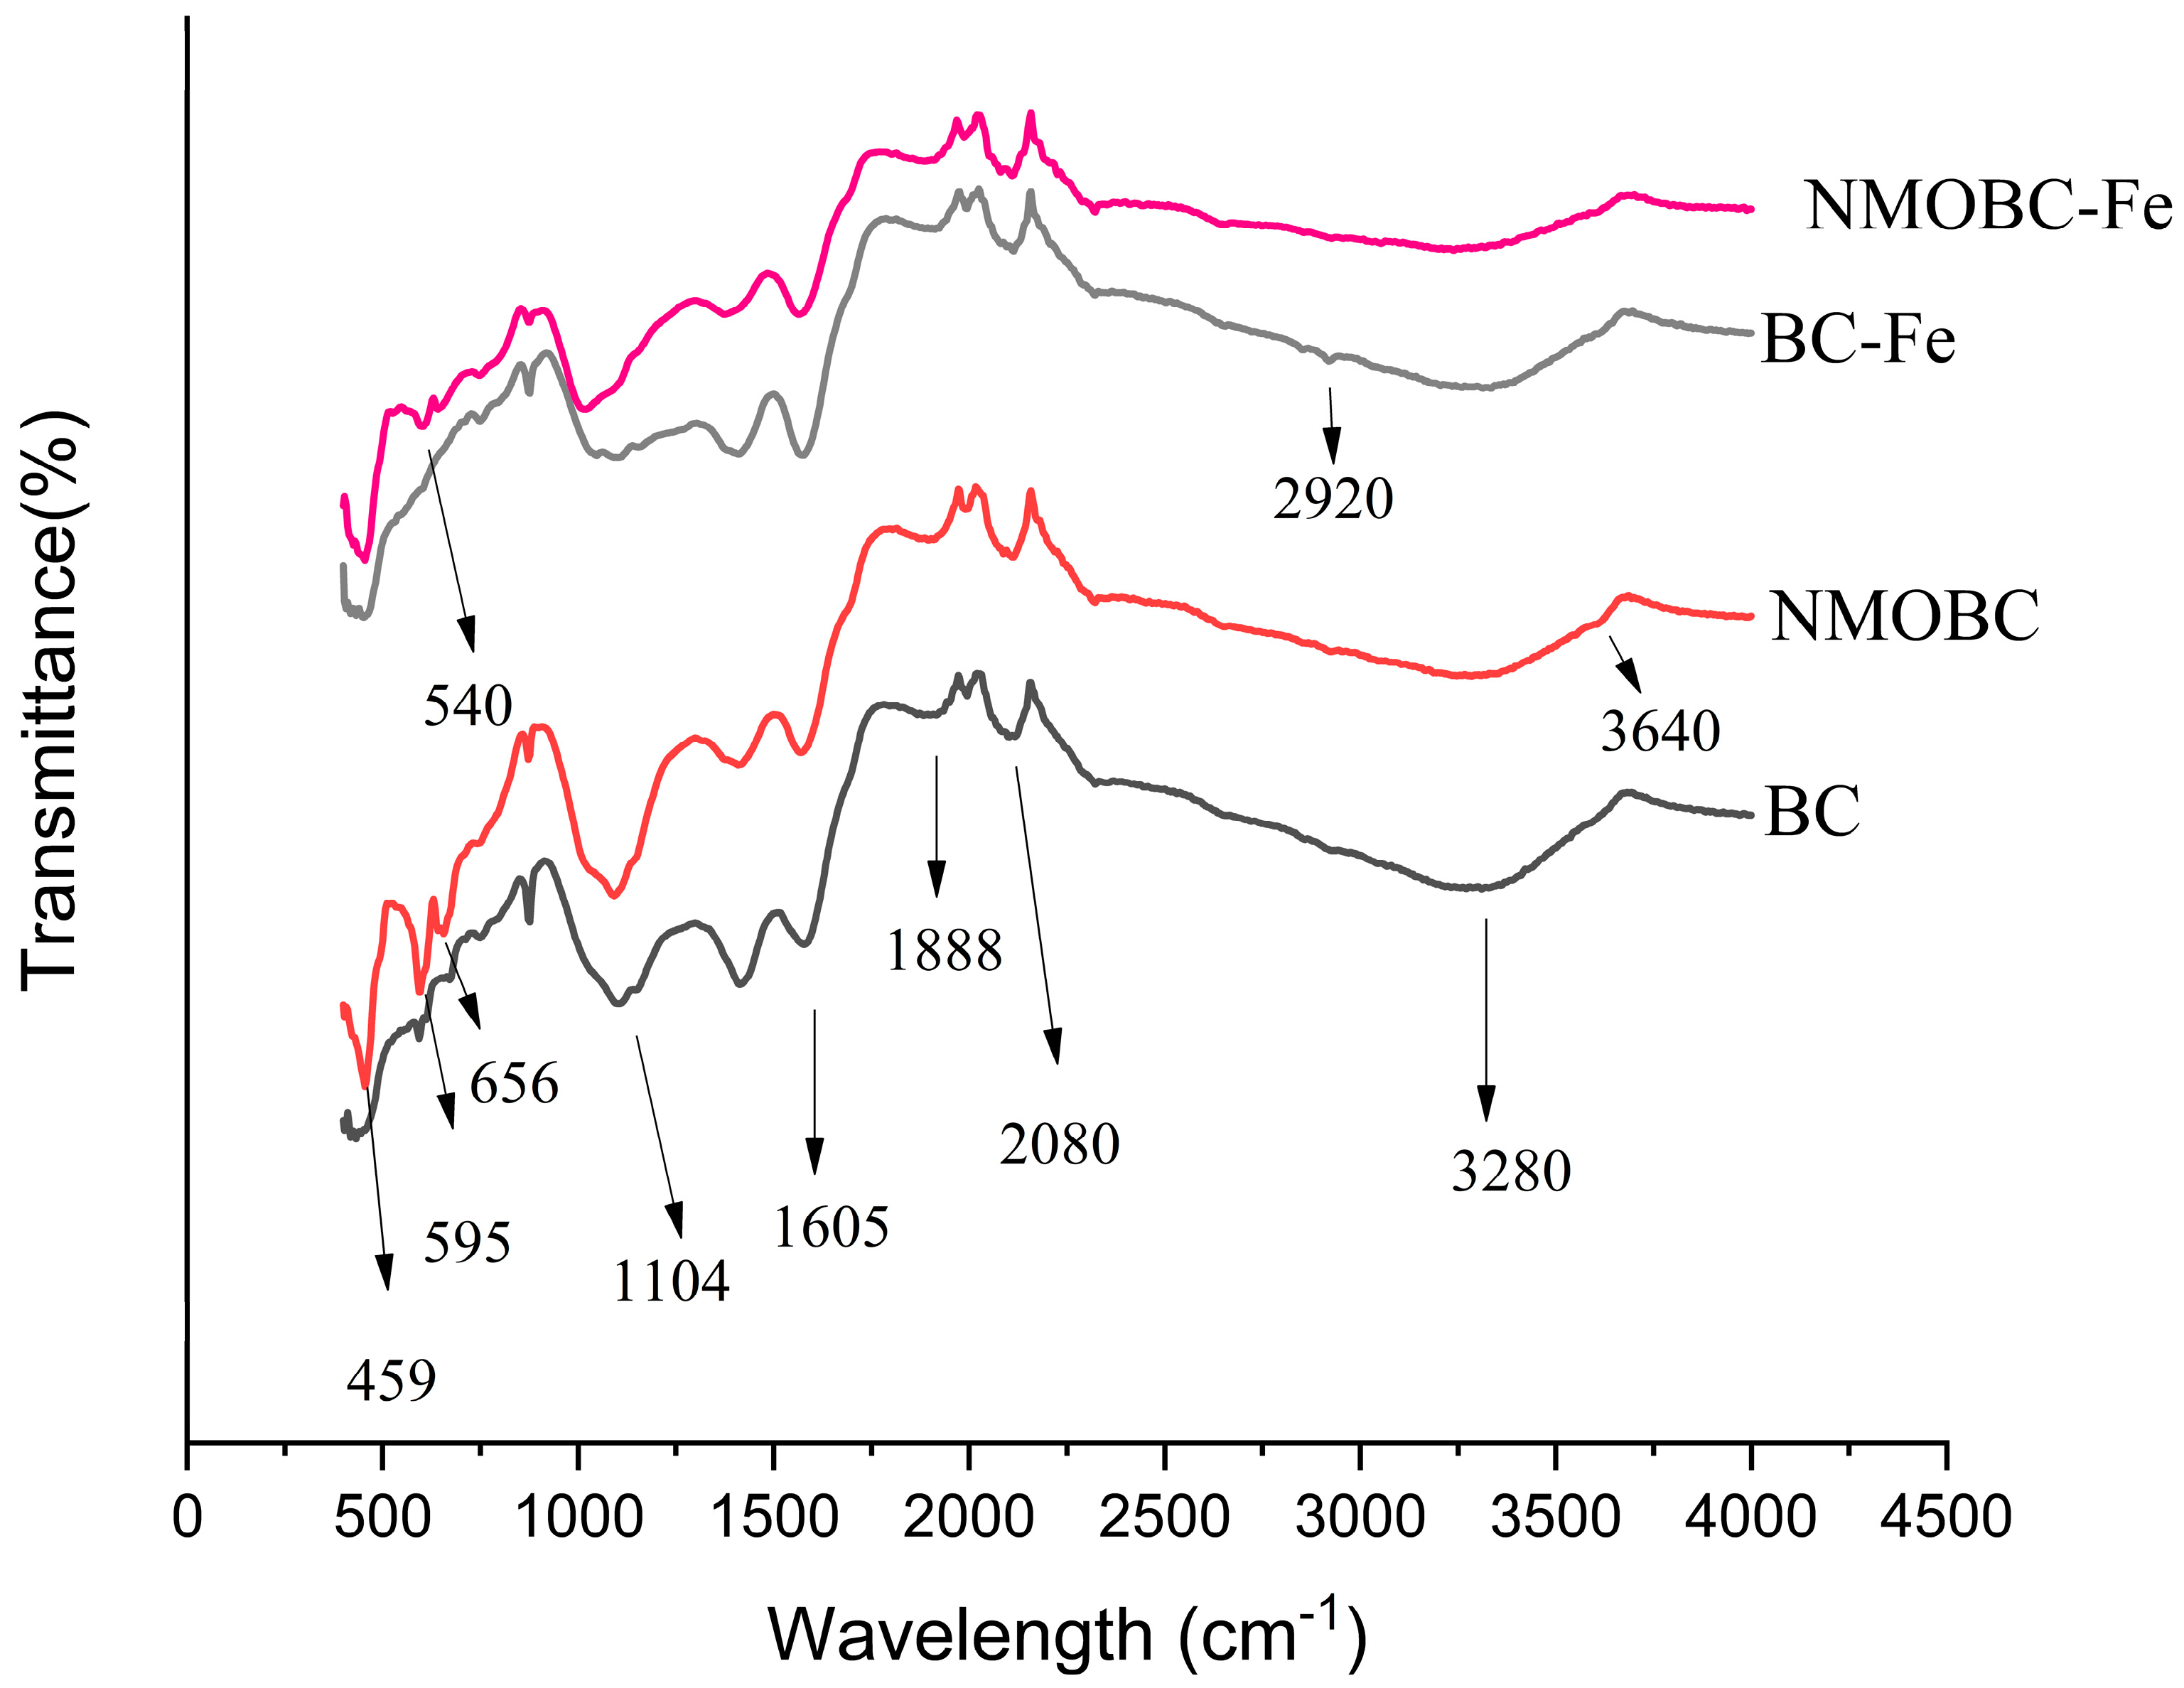
3.1. FTIR of Raw and Iron Loaded Adsorbents

Figure 2 delineates the FTIR analysis of several samples including raw biochar (BC), Al2O3 blended/coated biochar (NMOBC), and iron-loaded adsorbents (BC-Fe and NMOBC-Fe), which were utilized in the context of iron remediation from contaminated water. Within the presented spectrum, distinct infrared transmittance bands are apparent at numerous wavenumbers. For instance, the band at 3640 cm−1 corresponds to the O-H stretching vibrations originating from silanol groups (Si-OH), while the transmittance band at 3280 cm−1 can be linked to the O-H stretching vibrations of hydroxyl groups that participate in hydrogen bonding. In addition, the Si-O stretching vibrations manifest themselves at the 1104 cm−1 band. The band observed at 2920 cm−1 is indicative of C-H vibrational modes pertaining to aliphatic chains. On the other hand, the 2080 cm−1 peak is representative of the C=O stretching vibration in ketene structures. The 1888 cm−1 and 1605 cm−1 bands arise from C=O stretching vibrations and carbon double bonds (C=C stretching), respectively, which are characteristic of cyclic anhydrides [25,26,27].
Moreover, the FTIR spectrum of the Al2O3-coated biochar (NMOBC) unveils supplementary bands located at 459, 595, and 656 cm−1. These specific peaks are characteristic of the Al-O vibrational modes inherent to octahedral coordination environments. In addition, following FTIR analysis of BC and NMOBC formulated for iron extraction from aqueous solutions, a distinctive transmittance band is apparent at 540 cm−1. This band is intrinsically associated with the Fe-O bending vibrational modes. When comparing NMOBC with BC, the FTIR spectra can provide significant insights into their functional groups, interactions, and chemical modifications that arise due to the presence of the nano-metal-oxide coatings [25,26,28]. The raw biochar predominantly exhibits organic functional groups, which are highlighted in the FTIR spectra as mentioned in the aforementioned vibrational bands. These bands reveal the presence of hydroxyl groups, aliphatic chains, ketene structures, and cyclic anhydrides, among others [27]. On the other hand, NMOBC presents additional peaks, evidence of the interactions between the biochar and the Al2O3. These interactions can lead to shifts in peak positions or the emergence of new bands, indicative of the bonding between the metal oxides and the organic components of the biochar.

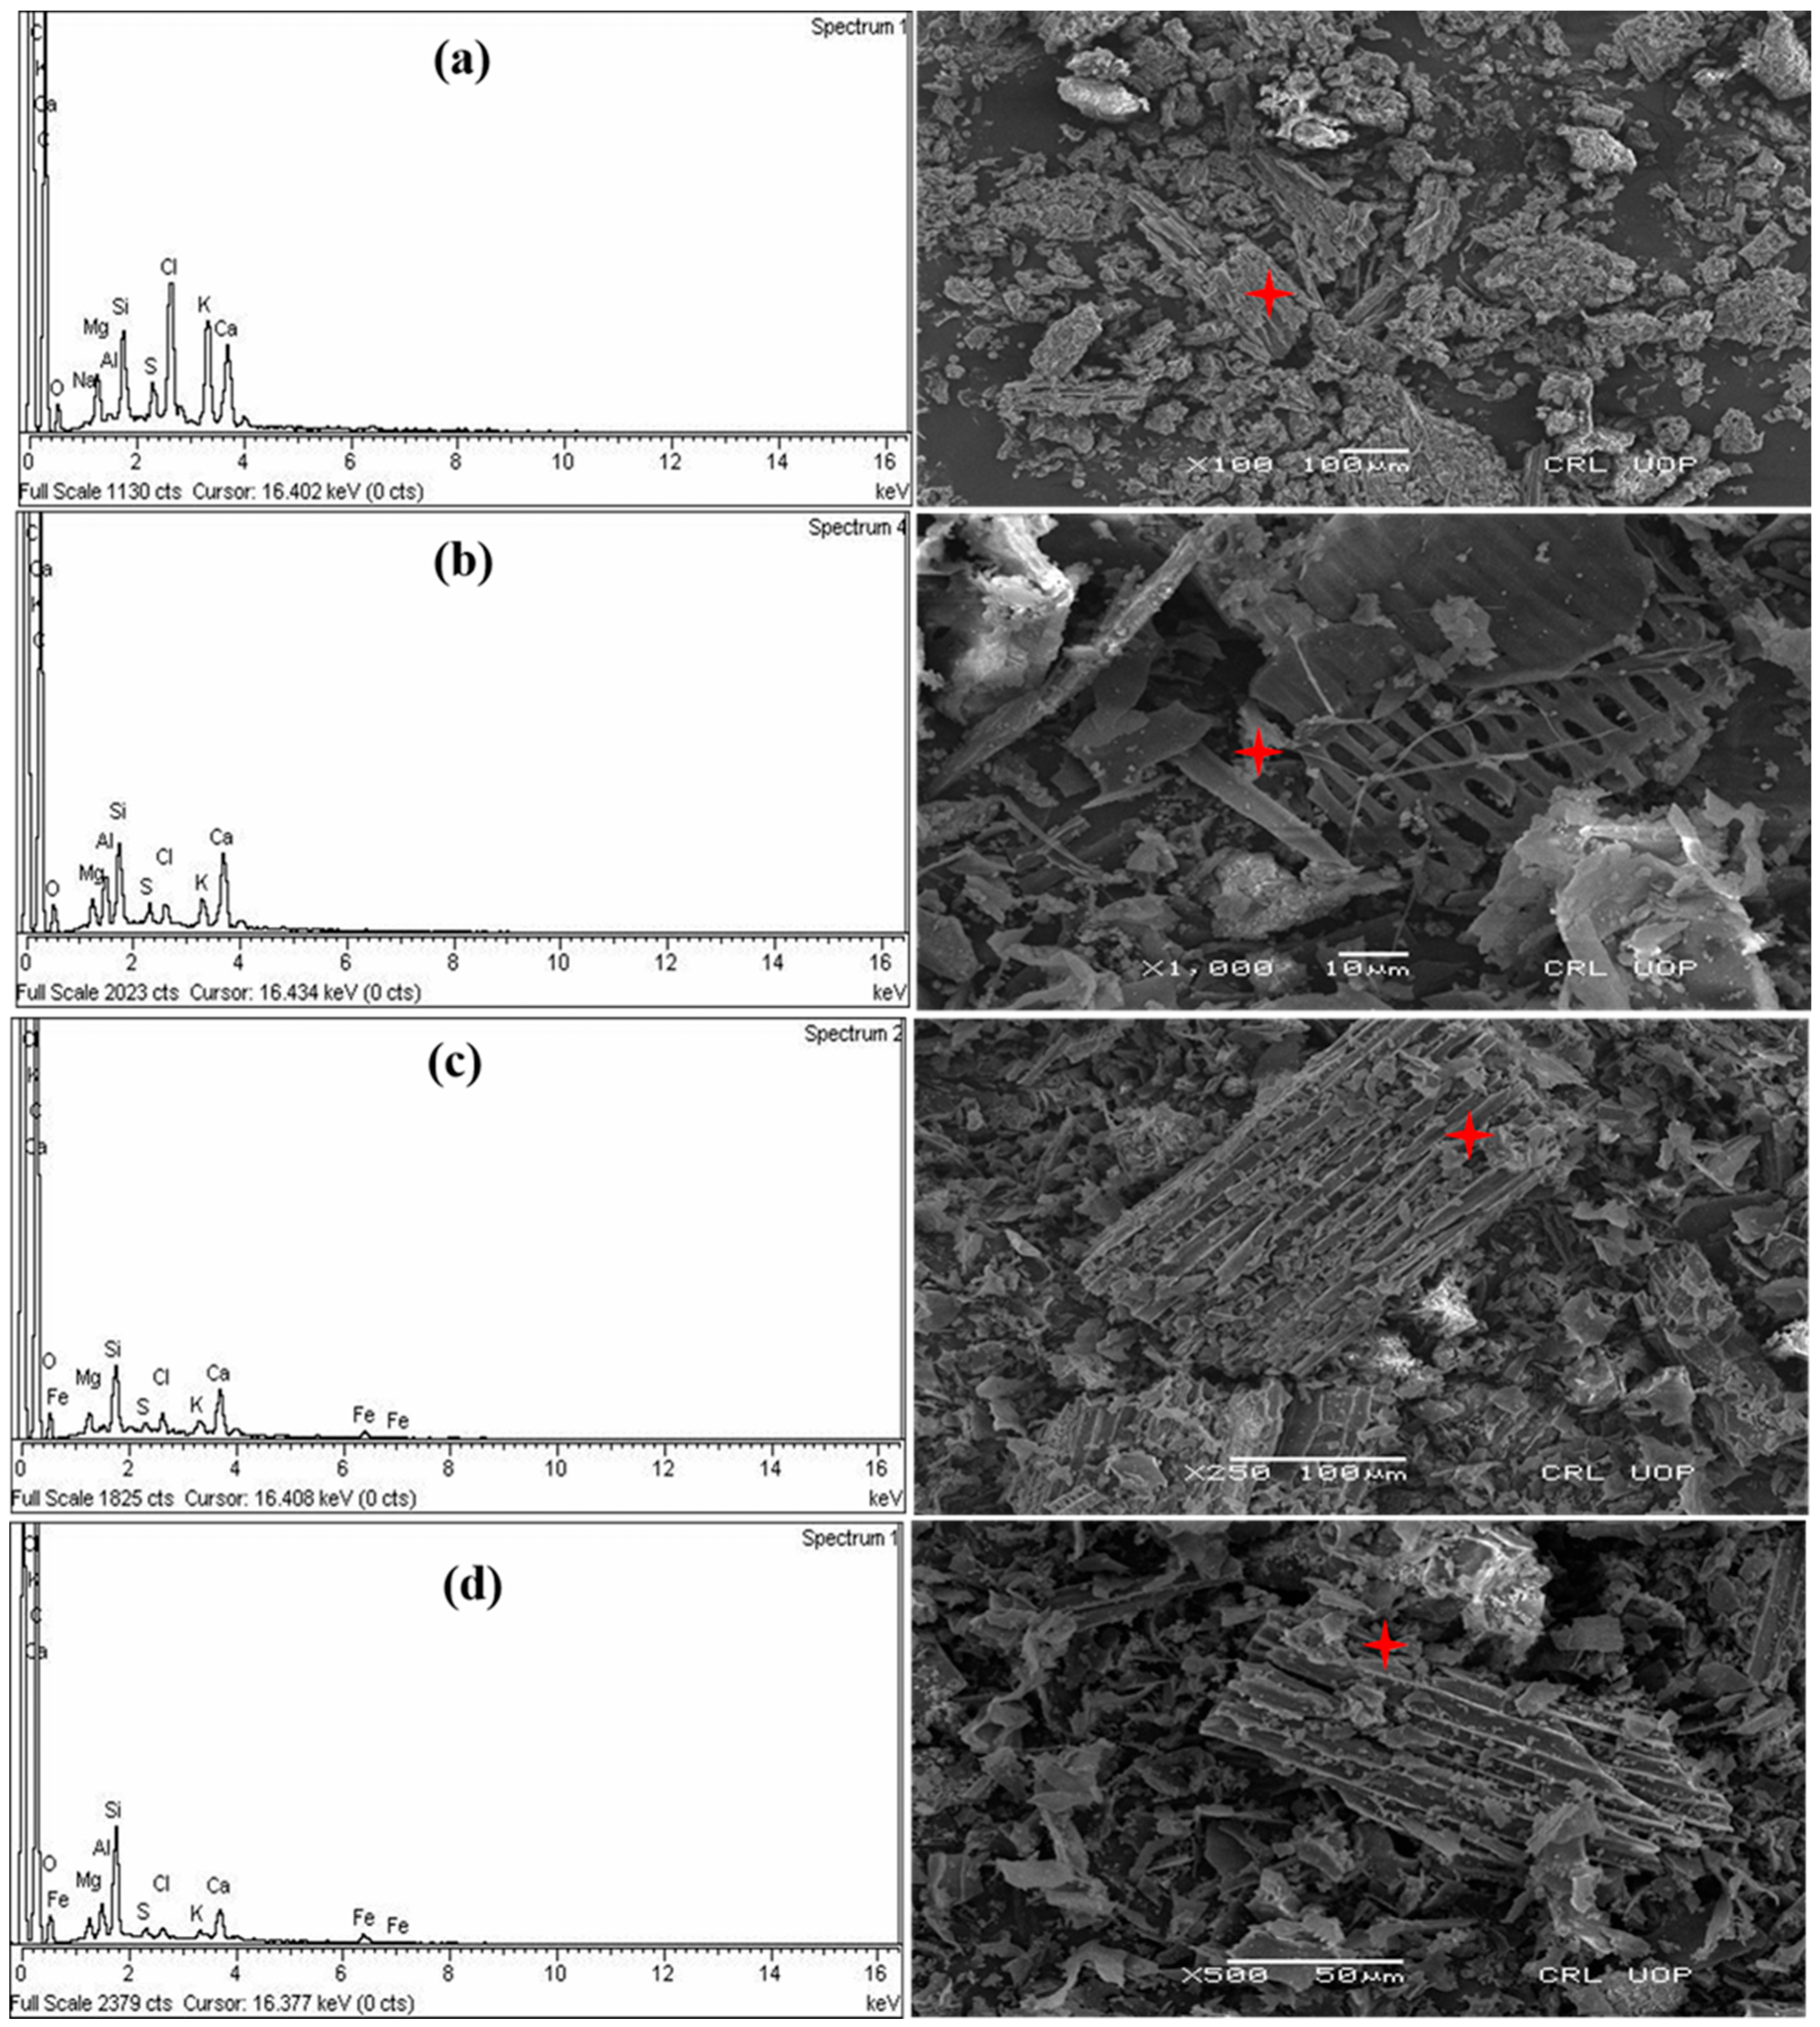
3.2. SEM/EDX study of Raw and Iron-Loaded Adsorbents

Figure 3 and Table 1 present the outcomes of the Scanning Electron Microscopy coupled with Energy Dispersive X-ray (SEM/EDX) for quantitative assessment, performed on both BC and NMOBC samples. This analysis was carried out both before and after the remediation of iron metal from contaminated water. In the SEM micrographs delineated in Figure 3a,b, one can distinguish the morphological characteristics of the BC and NMOBC. These images reveal BC and NMOBC particles with notable projections, exhibiting an irregular and granulated texture. The particle size distribution for these specimens ranges between 50 and 150 µm.
Upon comparing the SEM images of the raw BC (Figure 3a) and NMOBC (Figure 3b), there is a noticeable differentiation attributed to the inclusion of nano-alumina. This assertion is further substantiated by the EDX spectral data presented in Figure 3a,b, which confirm the presence of aluminum in the NMOBC samples. Simultaneously, the EDX spectra for both iron-loaded BC and NMOBC samples (Figure 3c,d) validate the presence of the targeted iron constituents. The intensity of the Fe peak has been measured at approximately 1.28 (Table 1), indicating the enhanced effectiveness of NMOBC in removing iron from the solution. Additionally, the SEM image of NMOBC reveals the presence of small, fine-grained white particles on the biochar’s surface, which are possibly nano-alumina particles. This is indicative of their interactions during the iron removal process [29]. In fact, the impregnation of nano-alumina particles onto raw biochar induces significant morphological alterations in the biochar structure. This process leads to the formation of a more crystalline biochar when impregnated with nano-alumina. It is worth noting that previous research [30,31,32,33] has highlighted the importance of various nanometals and their precursors for enhancing the functionality of biochar for a wide array of applications. For instance, the pretreatment of cottonwood biomass with AlCl3, followed by slow pyrolysis, resulted in the production of well-crystallized AlOOH/biochar with a distinctive rough surface morphology. This data (Table 1) also emphasizes the superior efficacy of Al2O3 (nano-metal-oxide) augmentation in biochar, emphasizing its enhanced capability to remediate iron ions from aqueous solutions of iron [26,29].

3.3. BET Analysis of BC and NMOBC

The physical and chemical properties of adsorbents have an impact on the removal of metals including iron ions. Hence, the BET surface area, pore size, and pore volume are presented in Table 2, which demonstrate that NMOBC exhibits a 9.1% higher BET surface area than BC (34.42 m2g1 and 31.29 m2g1 of NMOBC and BC, respectively). Consequently, there are greater number of adsorption sites, which in turn improves the efficiency of the removal of iron. Additionally, complexes of iron ions have smaller sizes in water; hence, pores of NMOBC give superior fitting by enhancing the removal efficiency. The results of the BET analysis also demonstrated that both NMOBC and BC have appropriate pore volumes, with the former having 51.12 cm3g1 and the latter having 42.43 cm3g1. Table 2 shows that both the pore size and the pore volume of the NMOBC are higher than BC. Subsequently, this indicates that NMOBC can adsorb more iron than BC from the surrounding environment [2,28].

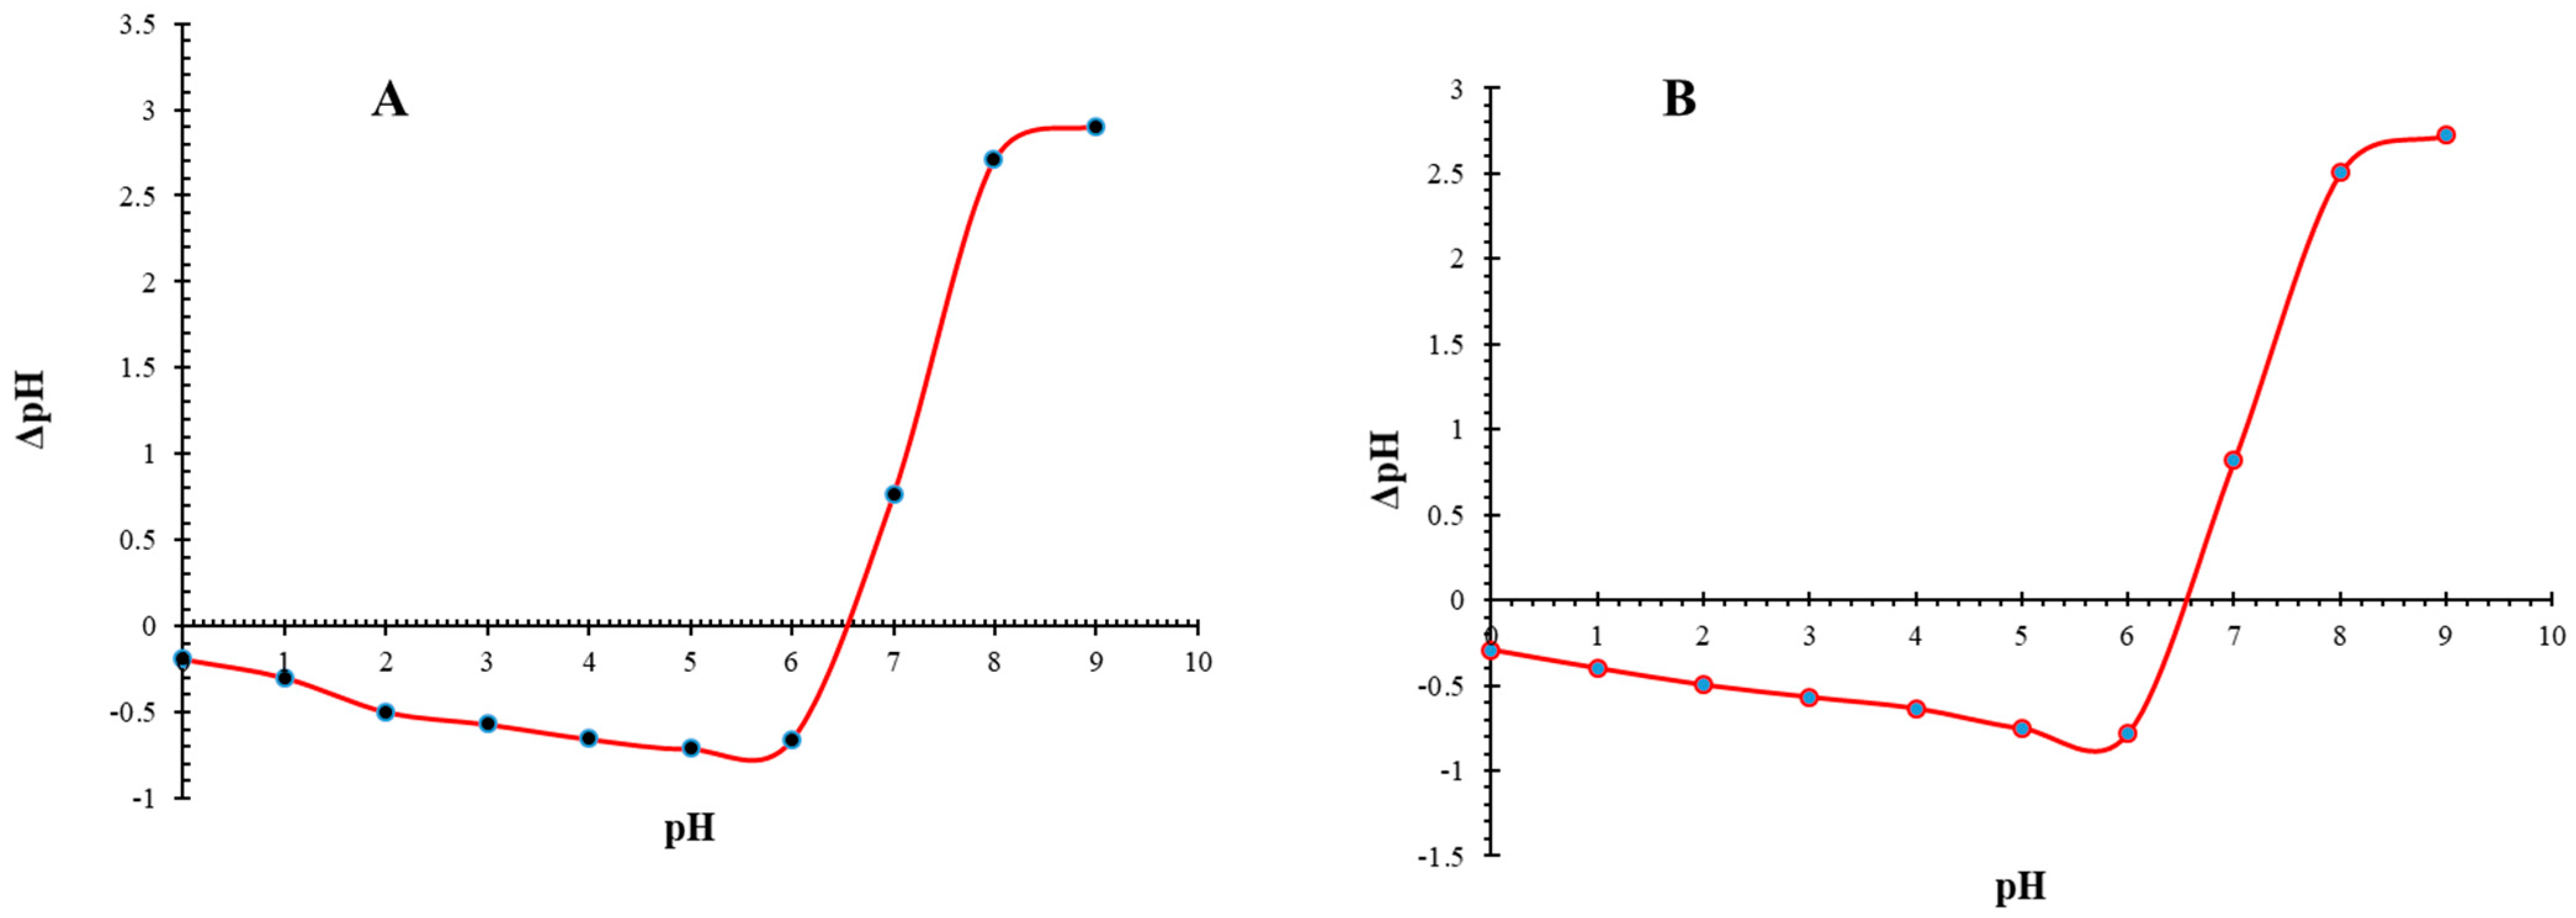
3.4. pHpzc and pH Impact on NMOBC and BC for Iron Adsorption

The finding of the pH at the Point of Zero Charge (pHPZC) is imperative for decoding and forecasting the adsorption behavior of adsorbents across diverse pH environments. It offers valuable insights into the net charge of the biochar surface as well as NMOBC, which, in turn, dictates its interactions with various pollutants. Subsequently, the pH of a solution substantively invariably influences its adsorptive capacities and interactions with various cationic species [2,22]. Empirical observations have generally indicated that both NMOBC and BC manifest an augmented tendency for the adsorption of iron (Fe) when the pH of the aqueous solution resides within a slightly acidic to neutral range (Figure 4). This predilection can be attributed to the prevalent existence of Fe cations, specifically in the form of Fe+3 under these particular conditions, which facilitates their adsorption onto the neutrally charged surfaces of NMOBC and BC.
In the present study, the pHPZC of the BC and NMOBC was ascertained by employing the drift method, revealing values of 6.3 (±1) and 6.5 (±1), respectively (Figure 4A,B). It shows that the dominant influence on the adsorption of Fe cations is due to increased surface area and pore volume compared to the surface charge of the BC and NMOBC, and, consequently, its affinity toward these metal ions. This attribute also enables the efficacious adherence of positively charged Fe cations to the adsorbent for optimal removal. The pH experimentation yielded an optimal removal efficacy of 90.5% and 92.7% on BC and NMO BC, respectively, for the removal of iron at a pH of approximately 7.
Moreover, at pH values inferior to the pHPZC of the adsorbents, the surface predominantly exhibits a positive charge, which may inhibit the adsorption of metal cations due to electrostatic repulsion. In contrast, at pH values exceeding the pHPZC, the surface adopts a negative charge, thereby fostering the adsorption of Fe cations via electrostatic attraction [2,10,33]. Additionally, pH exerts influence over the ionization states of functional groups such as hydroxyl carboxyl on the surfaces of BC and NMOBC, potentially altering their aptitude to form complexes with Fe cations, thereby affecting adsorption via complexation mechanisms [6]. Conversely, NMOBC exhibits a distinctive adsorption behavior at selected pH values, attributable to its specific interactions with the higher porosity of Fe cations. For instance, certain nano-metals might act as facilitators in redox reactions, influencing the valence state and, consequently, the adsorption of the metal ions [2,34].

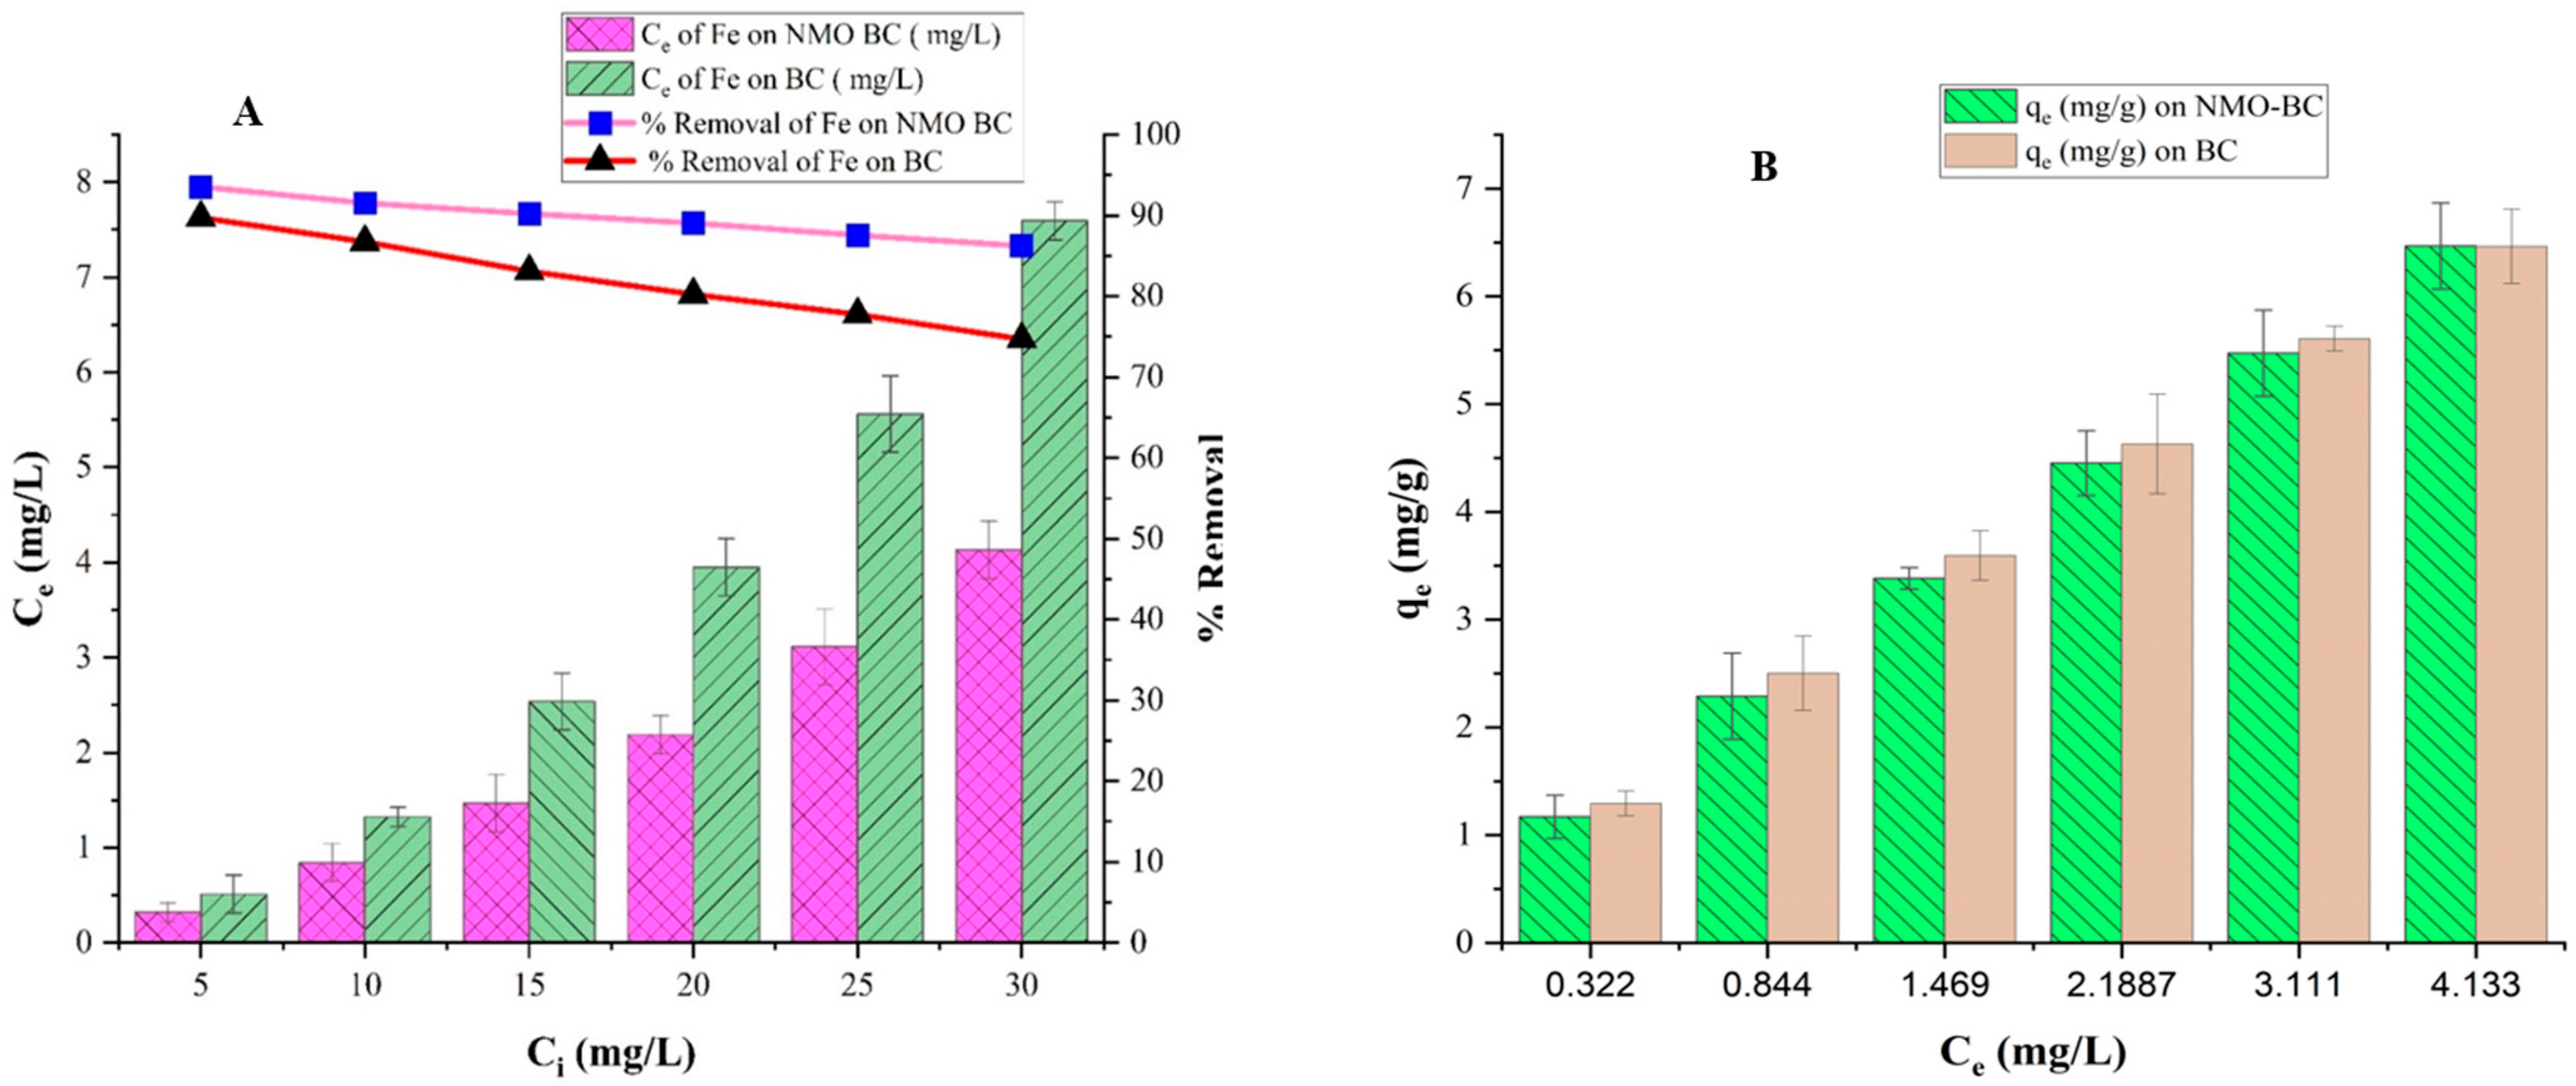
3.5. Influence of Initial Iron Concentration on BC and NMOBC

The essence of static/batch studies lies in their ability to interpret equilibrium conditions within the adsorption process [13]. Figure 5A,B portrays the sequential dynamics of iron adsorption onto BC and NMOBC across varied initial iron concentrations. The curves/bars in Figure 5A,B highlight the continuous progression of adsorption, exhibiting an initial rapid uptake of iron onto BC and NMOBC, indicating the chemical nature of the adsorption. This rapid phase is prone to slow down as equilibrium approaches. When the starting iron concentration fluctuates between 5 to 30 mg/L, maintaining optimal pH and adsorbent dosages (BC and NMOBC, 4 mg/L), the iron removal efficiency observes a decline from 89.75% to 74.68% as well as from 93.56% to 86.22% on BC and NMOBC, respectively. This decline can be attributed to the limited adsorption capacity of BC and NMOBC, which becomes progressively saturated as the initial iron concentration rises.
Additionally, a high initial iron concentration means that more ions compete for limited available binding sites [2,27]. The increasing initial iron concentration also limits the formation of complexes due to the scarcity of binding sites. Despite these challenges, there is a positive correlation between the initial iron concentrations, ranging from 1.22–5.60 mg/g and 1.17–6.47 mg/g, with the amount of iron adsorbed on BC and NMOBC, respectively. The observed adsorption capacity is higher than biochar and NMO biochar prepared by blending TiO2 (nono-metal-oxide) [2]. It can be attributed to the higher porosity of Al2O3 compared to TiO2. Moreover, the increase in BC and NMOBC adsorption capacity is primarily due to the enhanced surface functional groups as the augmented active sites evidently enhance the overall adsorption efficacy [2,22].

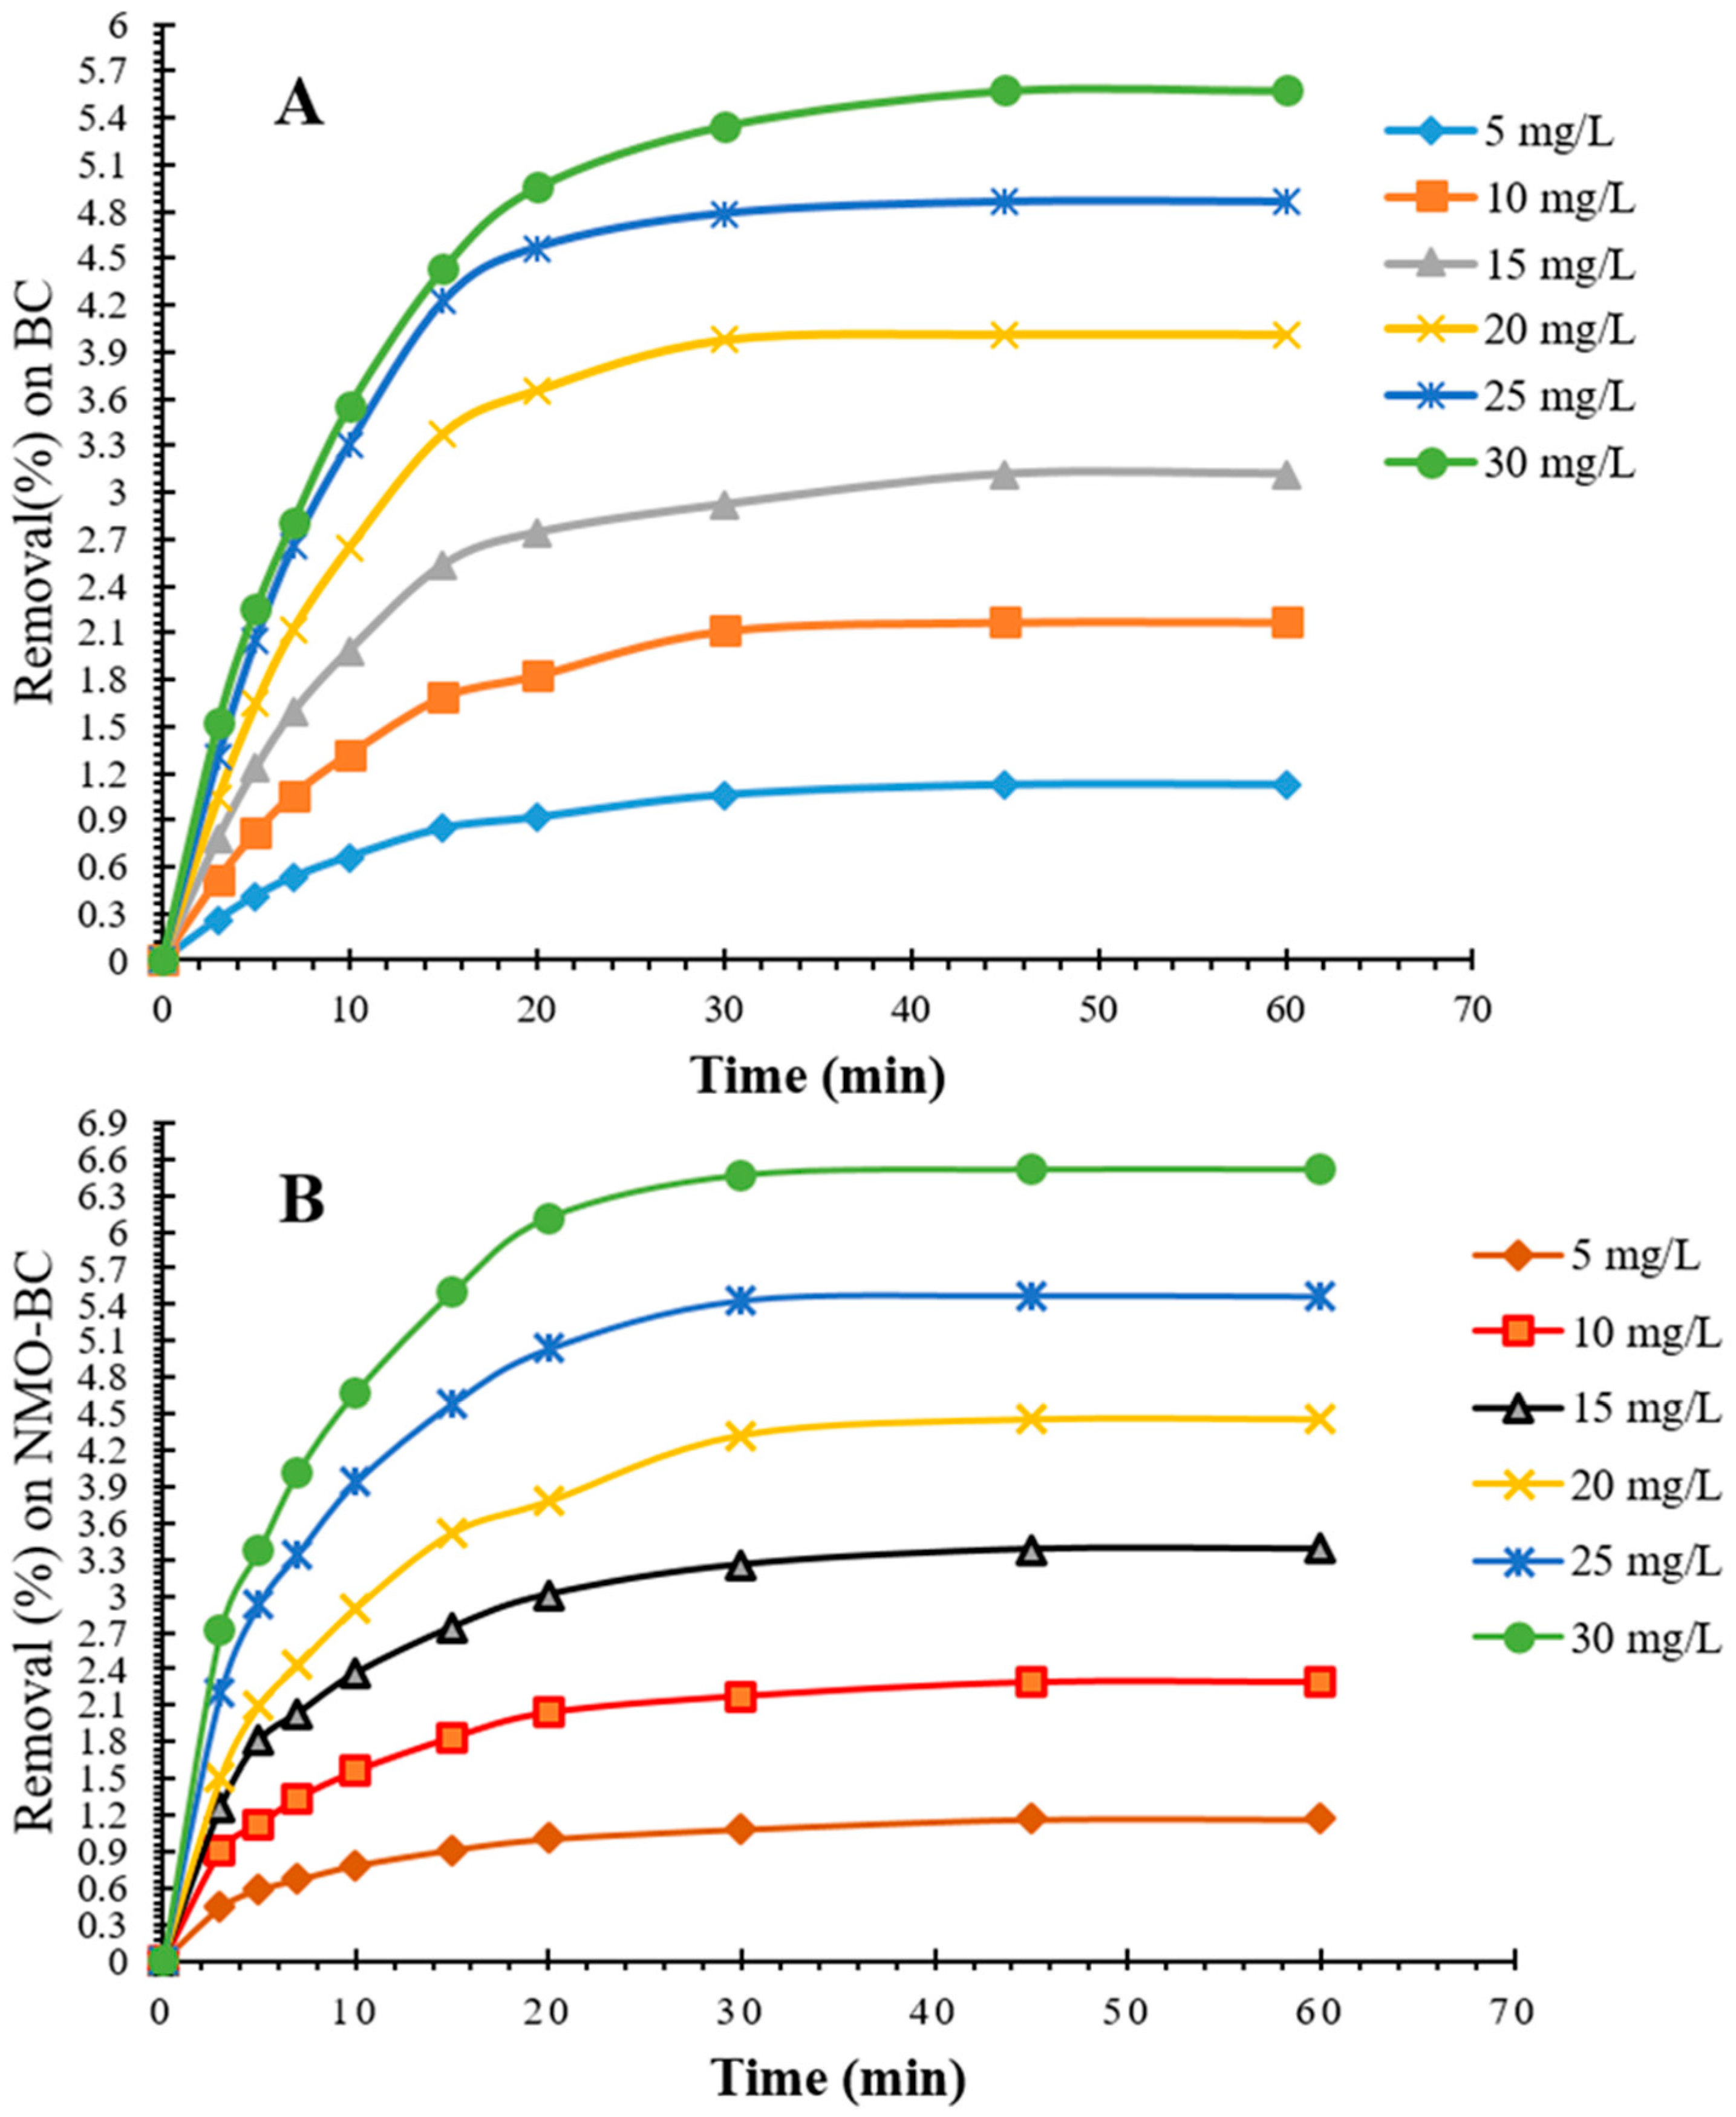
3.6. Removal Kinetics of Iron onto BC and NMOBC

Figure 6A,B provides insights into the impact of varying contact durations on iron removal efficiency, keeping the BC and NMOBC dosage (4 g/L), pH (7 ± 2), and iron concentrations (5 mg/L to 30 mg/L). The findings suggest a direct relationship between the extended contact time and enhanced iron removal rates. However, this relationship becomes less pronounced as equilibrium is approached [2,10]. A closer examination reveals two distinct phases: an initial rapid uptake phase dominated by swift iron ion sequestration, particularly evident at pH 7, and an equilibrium phase, which sets in around 30 and 40 min on NMOBC and BC, respectively. The shorter duration of the equilibrium state onto NMOBC can be attributed to Al2O3 blending with biochar which potentially increases porosity and electrostatic attraction. Furthermore, this equilibrium phase showcases minimal further iron uptake, reflecting an almost complete removal efficiency.

3.7. Kinetic Modelling of Iron Removal on BC and NMOBC

3.7.1. Insights from Pseudo Order Models for Iron Adsorption on BC and NMOBC

The data obtained from the static study for contact time was fitted to pseudo-first-order models. It reveals that the R2 values for the pseudo-first-order model are mostly above 0.9 on both adsorbents for all initial concentrations, suggesting a good fit for the experimental data (Table 3). Furthermore. the slight increase in k1 with increasing initial concentration suggests a faster initial rate of adsorption due to the higher driving force exerted by a higher concentration gradient (Table 3). Further insights showed that qe values range from 1.1883 to 7.469 mg/g, as well as from 2.052 to 6.682 mg/g on NMOBC and BC, respectively (Table 3).
The pseudo-second-order model showed that the R2 values are higher than its counterpart, the pseudo-first-order model, for all initial concentrations on NMOBC and BC, respectively (Table 3). Moreover, the pseudo-second-order model showed that qe ranges from 1.305 to 7.168 mg/g on NMOBC (Table 3), which are closer to corresponding experimental values. This showed that iron adsorption on both NMOBC and BC might be predominately governed by chemisorption processes and the model captures all the system’s complexities.

3.7.2. Insights from Elovich Model for Iron Adsorption on BC and NMOBC

The Elovich model provides information about chemisorption on heterogeneous surfaces, implying varying energy adsorption sites on the adsorbent [2,27]. This reveals that the R2 values for the Elovich model are reasonable, and α values ranging from 0.524 to 3.750 mg/g min, and β ranges from 3.870 to 0.716 g/mg on NMOBC. The R2 values are quite high for all concentrations on both adsorbents, indicating a good fit (Table 3). The decent fit of the Elovich model suggests that there is some level of surface heterogeneity in the NMOBC and BC. The increase in α with concentration suggests that as the concentration increases, the rate at which iron cations find and occupy available sites on the BC and NMOBC also increases. The decrease in β may indicate that increasing concentration reduces the extent of surface coverage or activation energy for chemisorption [2,3,27].
In short, the kinetic behavior of adsorption on NMOBC and BC prepared from date palm stems, as analyzed through the three kinetic models, unveils insightful aspects regarding the adsorption processes of both adsorbents. NMOBC tends to exhibit higher adsorption capacities (qe) compared to BC across all models, potentially attributable to the enhanced adsorptive properties conferred by the nanometal oxide (Al2O3) blending, which may introduce additional active sites or enhance surface reactivity. The pseudo-first-order kinetic model exhibits a good fit but is slightly inferior to its counterpart, the pseudo-second-order kinetic model. Furthermore, a general increase in adsorption capacity (qe) was observed with the initial concentration, which also demonstrates a good fit across various concentrations, suggesting that the adsorption process may be governed by physisorption to some extent, where the solute uptake rate is proportional to the number of available sites on the BC and NMOBC [2,27,33]. The Elovich model also presents a good fit, indicative of chemisorption being a significant mechanism in the adsorption process, where the rate might be influenced by the increased surface area, the surface coverage, and activation energy required for adsorption.

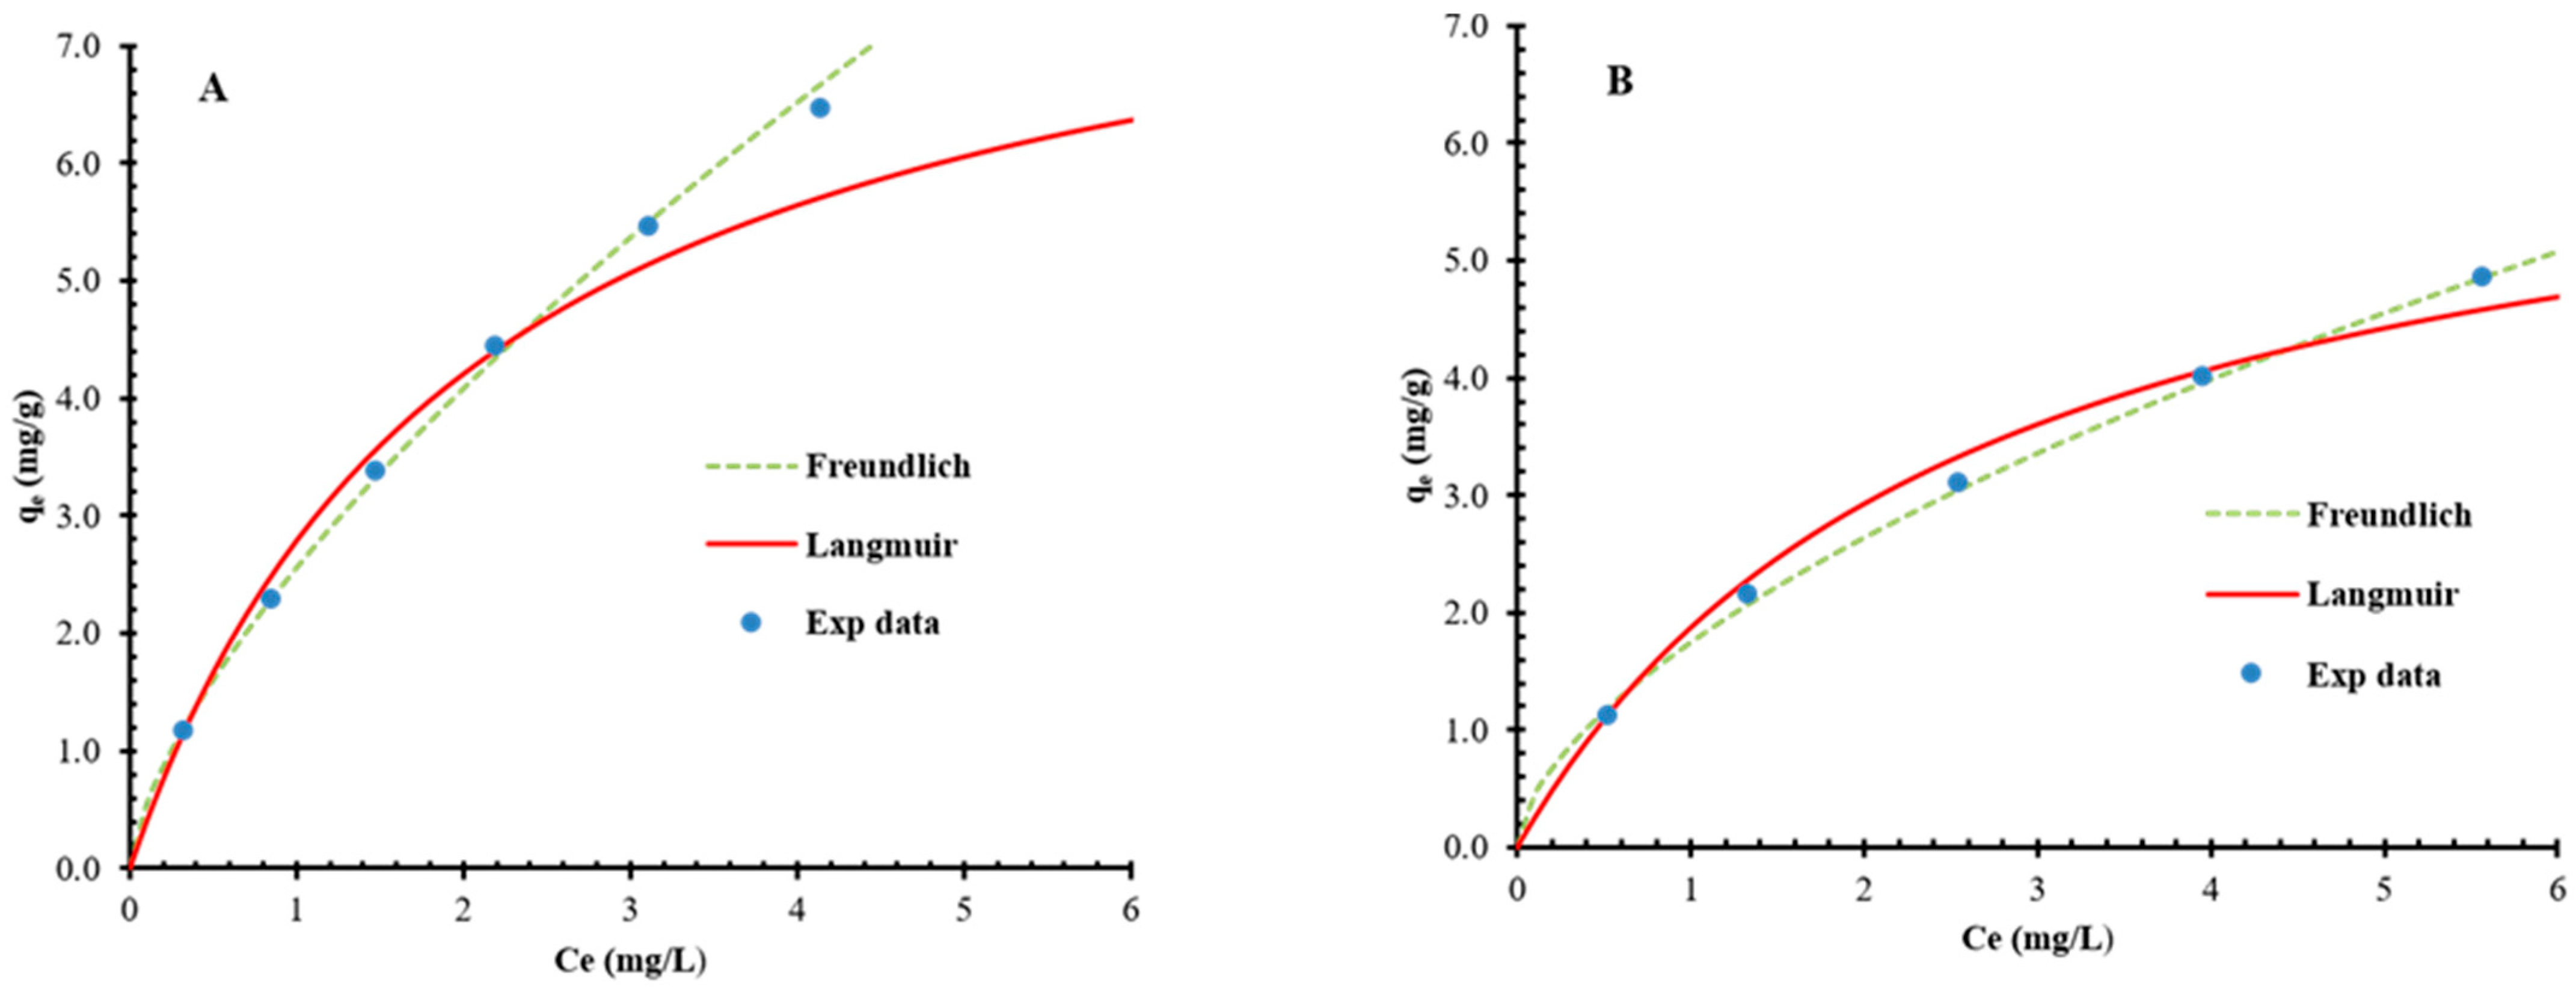
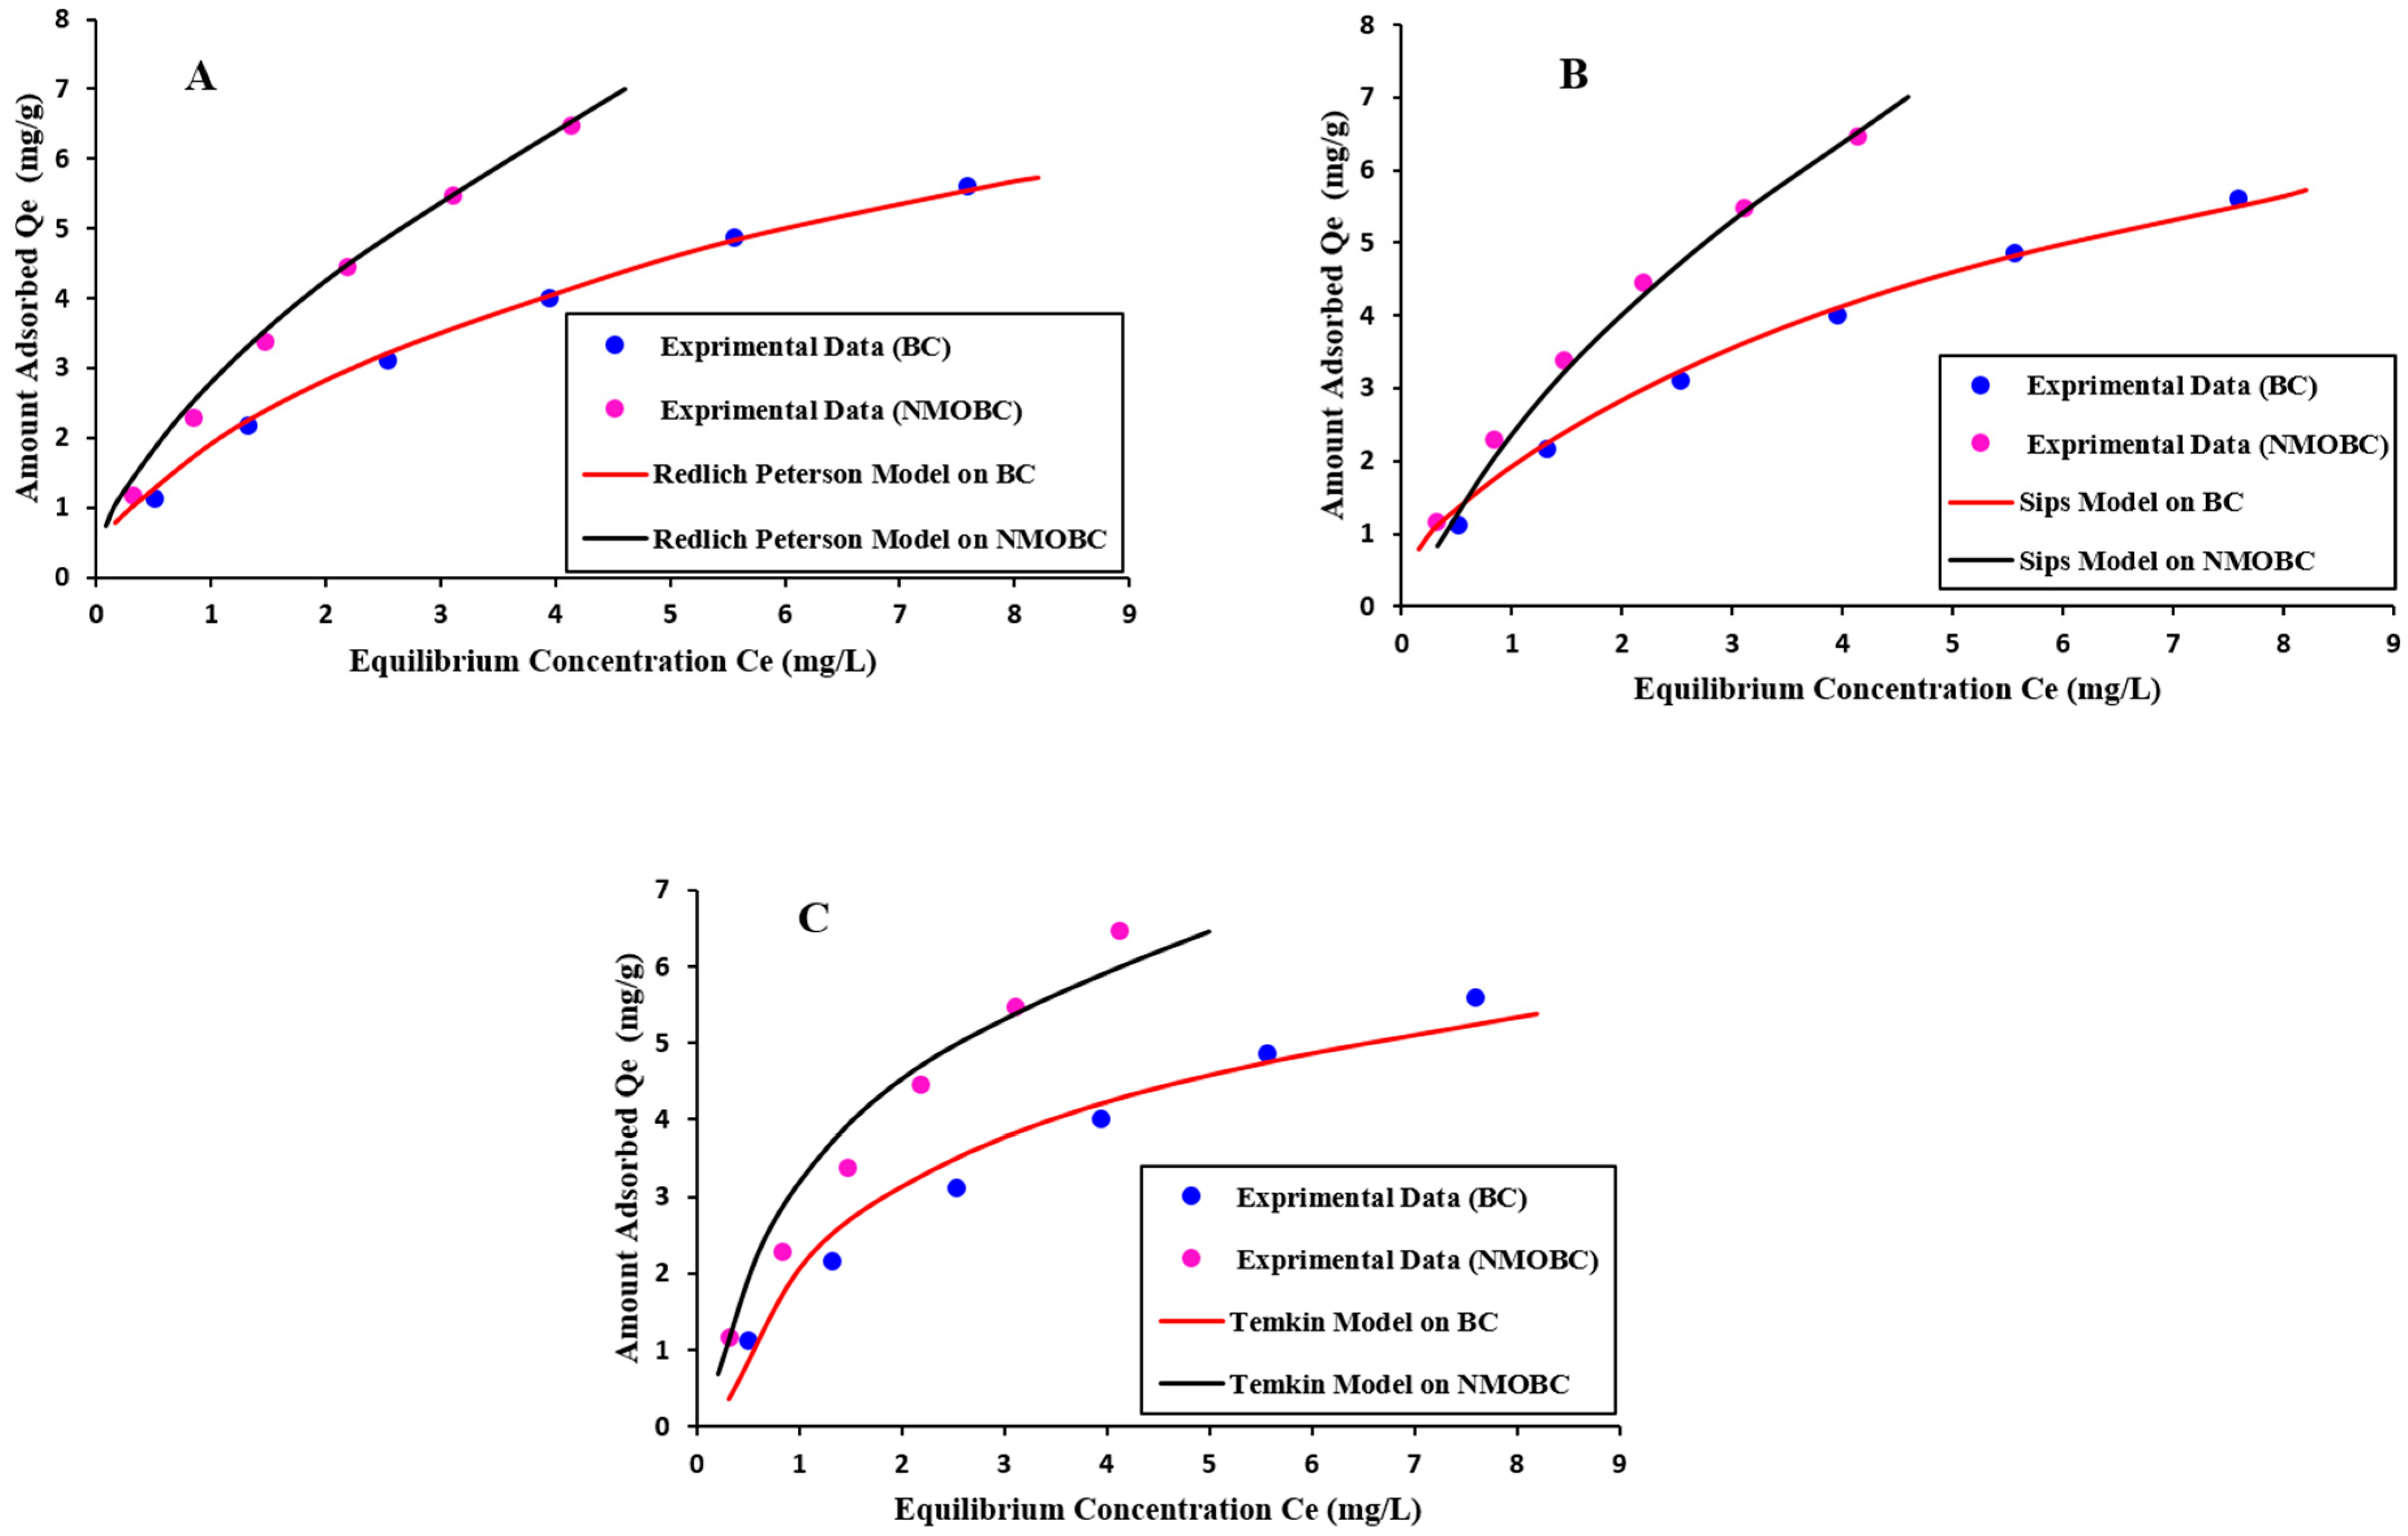
3.8. Evaluation of Isotherm Dynamics of Iron Removal on BC and NMOBC

The high R2 values of 0.994 and 0.998 on BC and NMOBC, respectively, indicate that the Langmuir model fits the experimental data on both adsorbents. The value of Qmax (6.71 mg/g and 8.56 mg/g) on BC and NMOBC represents the maximum adsorption capacity (Table 4). A good fit by the Langmuir model based on the value of R2 suggests that iron adsorption on both adsorbents might occur as a surface monolayer (Figure 7). In addition, the value b is 0.483 L/mg on NMOBC for the Langmuir constant related to the energy of adsorption, which is indicative of a higher value with a higher affinity between the adsorbent and adsorbate.
Moreover, the Freundlich model is an empirical equation used for non-ideal and reversible adsorption, not restricted to forming a monolayer [11,22]. The R2 value of 0.998 and 0.966 on NMOBC and BC, respectively, which is very close to 1, indicates a perfect fit (Figure 7 and Table 4). The exponent value n is 1.481 and 1.679 on BC and NMOBC, respectively, which is greater than 1, suggesting favorable adsorption conditions (Table 4). These values also suggest that both the adsorbents provide favorable conditions for iron adsorption [2,11]. On the other hand, the kF, indicative of the adsorbent’s relative adsorption capacity, was observed to be 1.747 mg/g and 2.556 mg/g on BC and NMOBC, respectively (Table 3).
In addition, the Redlich-Peterson model is a hybrid isotherm that incorporates features of both the Langmuir and Freundlich models [2,22]. The fit for this model is excellent and the exponent g is 0.625, 0.577, and less than 1, suggesting that the model leans more towards Freundlich behavior, indicating heterogeneous adsorption (Table 4, Appendix A). The value of constants specific to isotherm A and B are observed at 5.603 mg/g and 1.135 L/mg on NMOBC, respectively. The values suggest moderate adsorption characteristics, while g lies between 0 and 1 with a value of 0.577 on NMOBC. This value suggests a balance between the two (Langmuir and Freundlich), leaning slightly more towards Langmuir [2,11,22].
Furthermore, the Temkin isotherm considers adsorbent-adsorbate interactions and assumes that the heat of adsorption linearly decreases with coverage due to adsorbent-adsorbate interactions [2,35]. The R2 values suggest a reasonable but not as strong fit compared to the other models (Table 4, Appendix A). The constants AT and BT are related to the heat of adsorption and are observed to be 3.039 and 2.067 mg/g, respectively, on NMOBC. These observed values suggest that there is a moderate interaction between the adsorbent and iron. Consequently, the heat released during the adsorption process is of a reasonable magnitude [22].
Moreover, the Sips isotherm is also a hybrid model generalizing the Langmuir and Freundlich isotherms [22]. The fit is excellent, with an R2 value of 0.999 as well as 0.999 on BC and NMOBC, respectively (Table 4, Appendix A). The exponent n is 0.7898, which, being less than 1, suggests that the model exhibits Freundlich-like behavior at higher concentrations. The value QS is 15.87 mg/g and 22.68 mg/g on BC and NMOBC, respectively, which is notably higher than that of the Langmuir isotherm, suggesting a higher adsorption capacity in this model. The constants KS and B (0.1301 L/g and 0.7898, respectively) on NMOBC, which are related to the energy of adsorption and the system heterogeneity, respectively, reveal that the given values suggest moderate adsorption characteristics.
In short, the performance of iron removal using NMOBC and BC is described well by all employed isotherm models. Each model provides a unique perspective on the adsorption dynamics. The high R2 values indicate that the models fit the data well, especially the Langmuir, Freundlich, Redlich-Peterson, and Sips models. The Sips model suggests a maximum adsorption capacity of 15.871 as well as 22.680 mg/g on BC and NMOBC, respectively. In addition, the RMSE values of 0.0239 mg/g and 0.0278 mg/g, which are relatively minimum among all the models employed, indicate the best fit of the Sips model on BC and NMOBC, respectively, to remove iron from contaminated water.

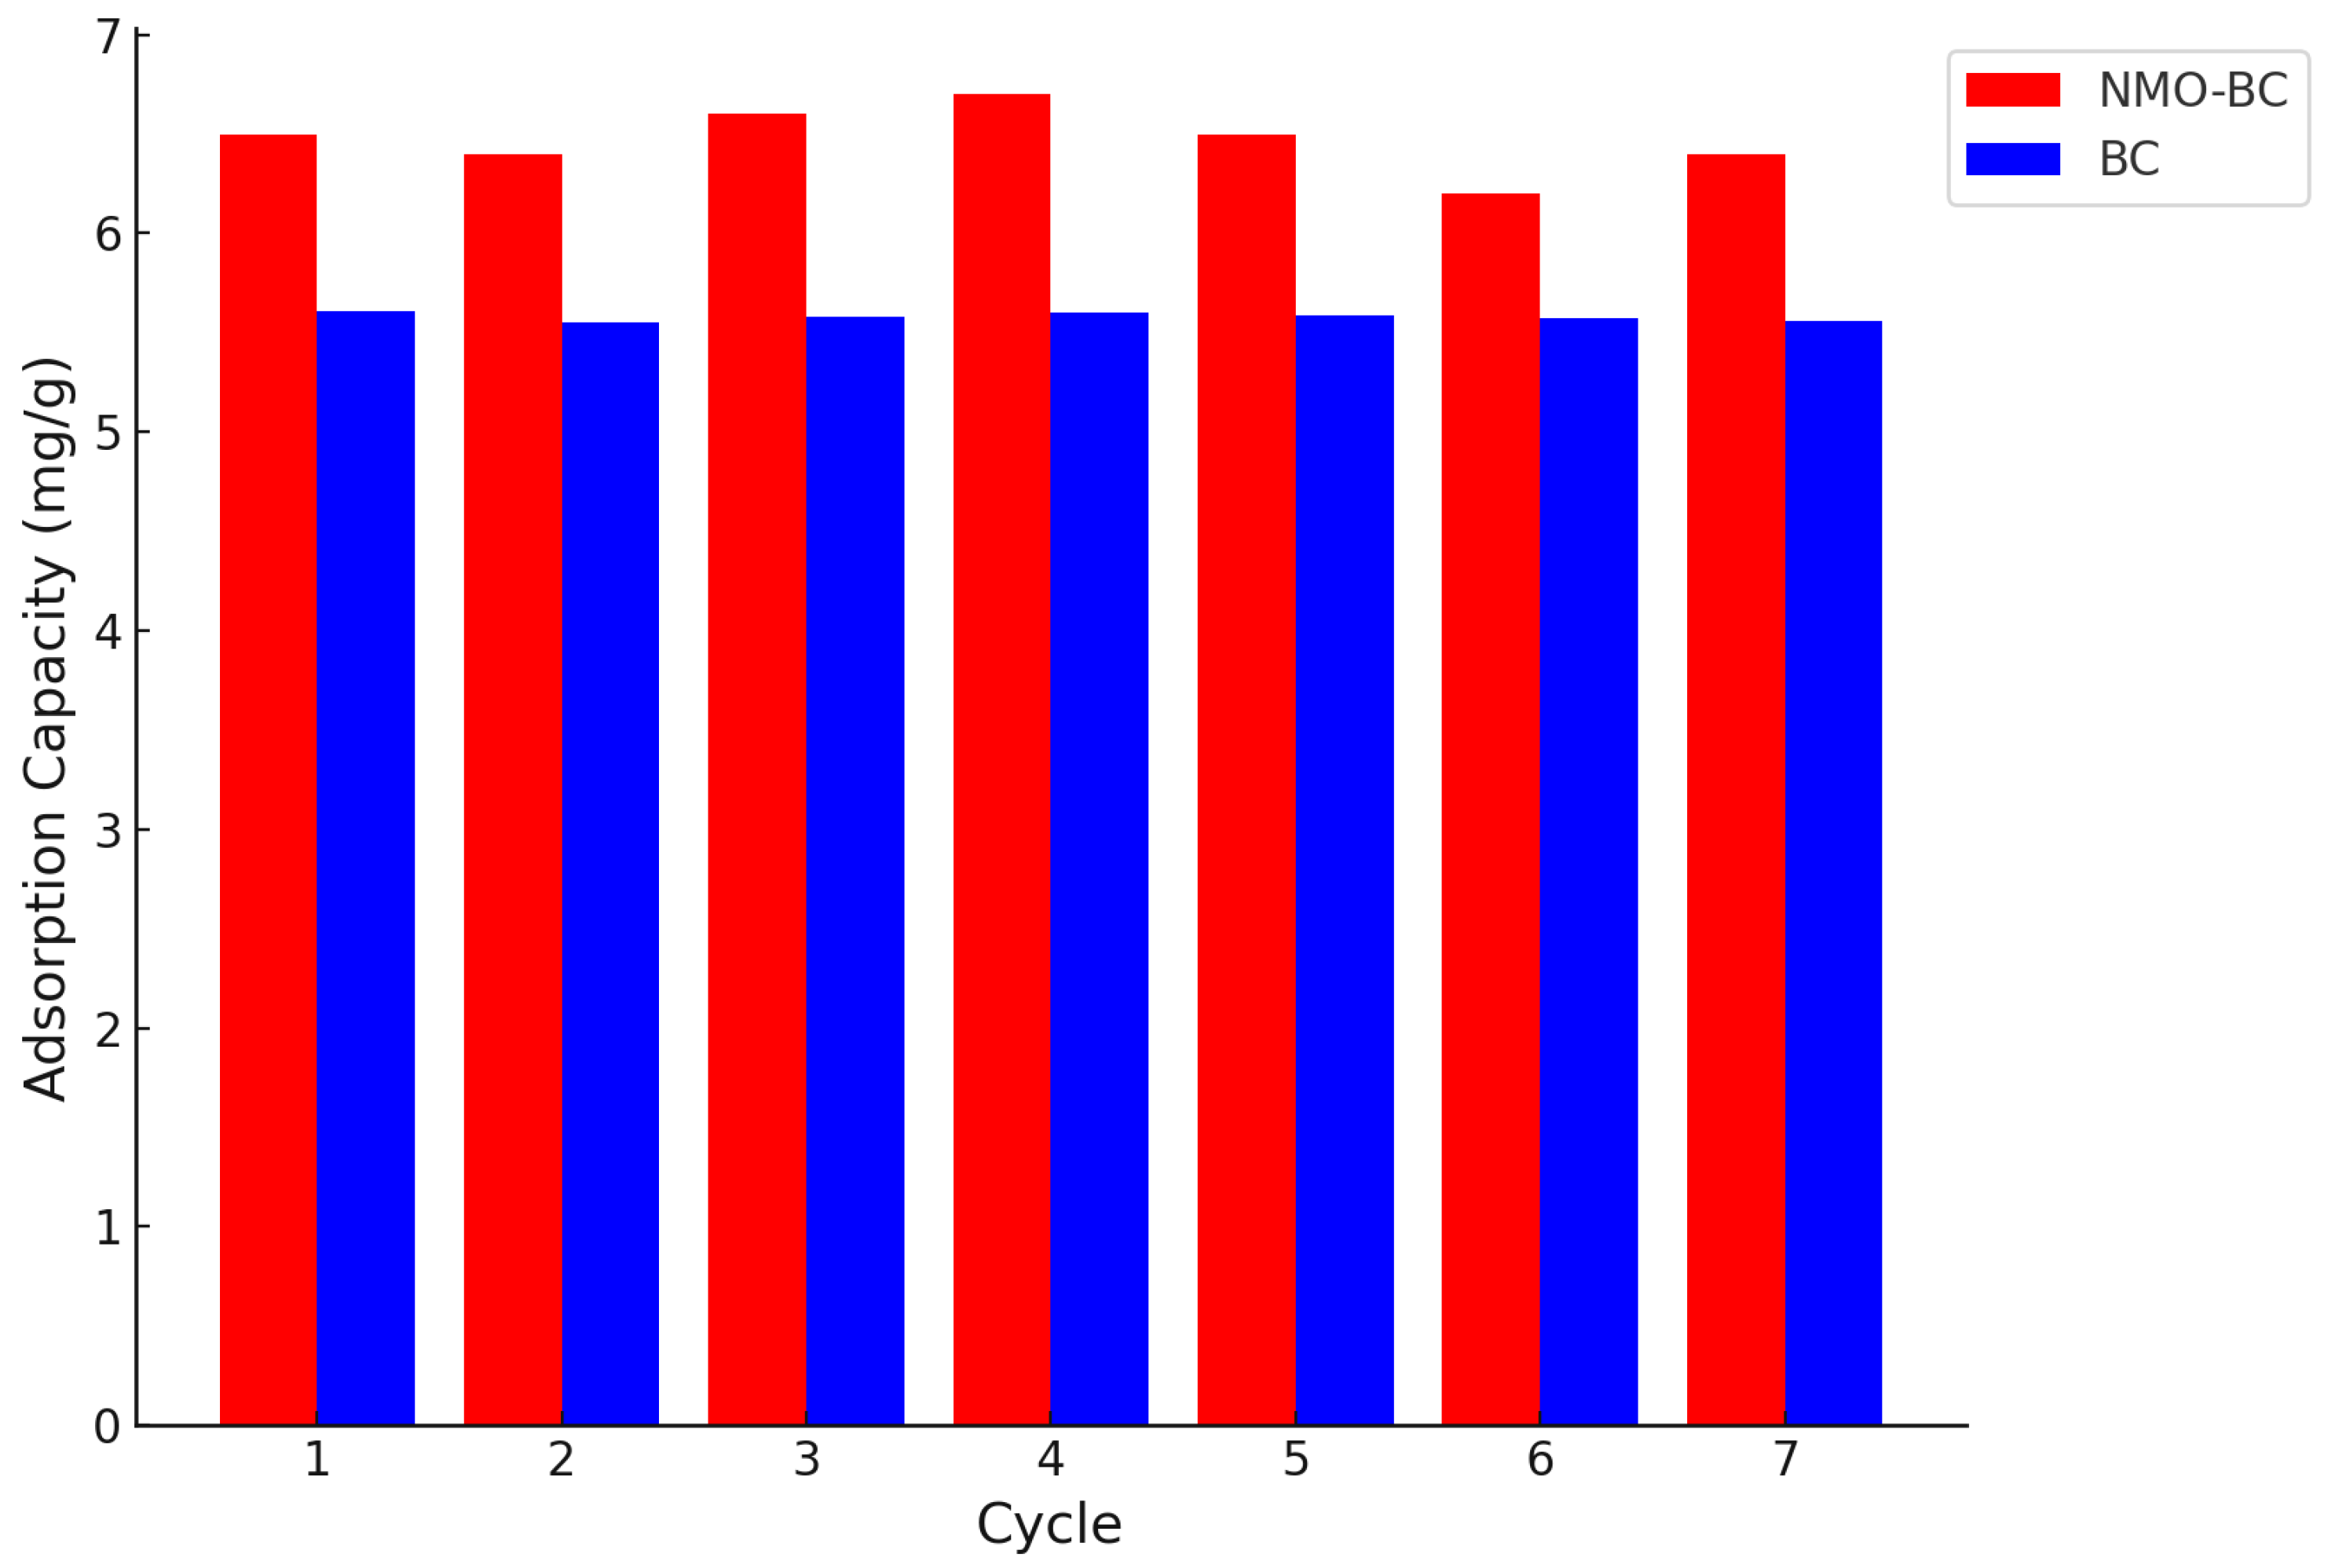
3.9. Regeneration and Reuse of NMOBC and BC

The regeneration process typically involves using chemical agents to mobilize or desorb iron that has been adsorbed onto the NMOBC and BC during its usage. This method aims at reinstating the adsorptive capacity of the adsorbents, allowing them to be reused in subsequent cycles. The type of chemical solution used can significantly impact the efficacy of the regeneration process and involves the use of chelating or acidic agents [10,35]. The acidic solution, such as 5 M hydrochloric acid (HCl), is employed in this study due to its ability to protonate the binding sites on both NMOBC and BC, thereby facilitating the release of adsorbed iron cations. Furthermore, the acidic environment fosters the conversion of iron cations into more soluble forms, enhancing their desorption from the NMOBC and BC. During post regeneration, both the adsorbents were thoroughly washed to remove any residual chemical agents, ensuring their suitability for reuse.
In this regeneration process, cycles 1–5 demonstrate the tremendous effectiveness of NMOBC and BC as an adsorbent for iron, maintaining a relatively consistent performance (Figure 8). The adsorption capacity of the NMOBC is consistently around 6.5 mg/g, indicating the stable and efficient removal of iron from the solution in these cycles. The adsorption capacity slightly decreases to 6.2 mg/g and 5.5 mg/g, implying that the NMOBC and BC’s efficiency in iron removal is beginning to slightly decline, potentially due to the saturation or degradation of active sites [10,11,35]. Adsorption capacities of 6.4 mg/g and 5.56 mg/g were observed in the seventh cycle on both NMOBC and BC, respectively, suggesting continuing stability in the NMOBC and BC’s adsorption efficiency. This pattern highlighted the importance of developing effective regeneration strategies to maximize the lifespan and efficiency of biochar as an adsorbent.
In short, NMOBC and BC demonstrated effective iron removal in all the cycles, and their capacity slightly diminished over repeated uses. These observations and the optimization of regeneration methods, as well as exploring enhancements to the NMOBC and BC, have prolonged its usability and efficiency in water treatment applications. Moreover, managing the regeneration solution, containing the desorbed iron, warrants careful consideration to prevent environmental contamination and explore possibilities for iron recovery and recycling.

4. Conclusions

The adsorption dynamics of Fe3+ ions were studied using nano-metal-oxide (Al2O3) blended date palm stem biochar, termed NMOBC, in batch studies at ambient temperature. The result established an optimal adsorption at a pH level of 7. NMOBC demonstrated high efficiency in adsorbing Fe3+ ions (6.5 mg/g) from water, attributed to the increased surface area and the specific interactions between the adsorbents and iron cations, such as electrostatic attraction and ion exchange. Characterization techniques, including EDX/SEM, FTIR, and the BET area, were employed to observe the structural, morphological, and functional properties of the synthesized NMOBC and BC. Subsequently, it proved successful in blending Al2O3 with biochar, with significant radical and morphological changes.
The pseudo-second-order model and Elovich model showed that the R2 values are closer to unity compared to the pseudo-first-order model. Subsequently, it proved a superior goodness-of-fit for all initial concentrations on both NMOBC and BC. The goodness of fit for the Elovich model is also indicative of chemisorption, being a significant mechanism in the adsorption process, where the uptake rate might be influenced by the surface coverage and activation energy required for adsorption. Hence, adsorption kinetics are partially governed by physisorption, but are dominantly controlled by chemisorption. The Langmuir, Freundlich, Redlich-Peterson, Temkin, and Sips’ models provided a unique perspective on adsorption dynamics. The high R2 values indicated that the models fit the data well, especially the Langmuir, Freundlich, Redlich-Peterson, and Sips models. Furthermore, the Sips model suggested a maximum adsorption capacity of 22.68 mg/g on NMOBC, with the lowest value of RMSE (0.0278 mg/g) among all models employed. In addition, both the adsorbents can be regenerated and reused with sustainable adsorption capacity.
In conclusion, the NMOBC synthesized in this study emerges as a promising, efficient, and environmentally friendly adsorbent for removing metal ions, particularly iron, from contaminated water. This approach of adopting nanotechnology with biochar derived from waste material addresses critical environmental challenges and sets a precedent for future innovations in water treatment technologies.

Author Contributions

M.T.B., A.A.K., J.I., M.A.S. and M.T.A. conceived the original idea for the research, led the data analysis process, and contributed to the drafting and revising of the manuscript. M.T.B. also supervised the overall research process, providing critical feedback and insights to improve the final manuscript. M.T.A., M.M.R., J.I. and M.A. performed a significant amount of experimentation, data collection, and analysis for the manuscript. All authors have read and agreed to the published version of the manuscript.

Funding

The study was supported by the Deanship of Scientific Research, Vice Presidency for Graduate Studies and Scientific Research at King Faisal University, Al-Ahsa, Saudi Arabia (Project No. GRANT4994).

Institutional Review Board Statement

Not applicable.

Informed Consent Statement

Not applicable.

Data Availability Statement

Data are contained within the article.

Acknowledgments

The authors acknowledge the Deanship of Scientific Research, Vice Presidency for Graduate Studies and Scientific Research, King Faisal University, Al-Ahsa, Saudi Arabia (Project No. GRANT4994). The authors wish to express their gratitude for the financial support that made this study possible. The authors also extend their thanks to CECOS University of IT and Emerging Sciences, Pakistan for moral support and Fillmore Central High School, USA for IT support as well.

Conflicts of Interest

The authors declare no conflict of interest.

Appendix A

Figure A1. Isotherm models for iron removal on NMOBC and BC, (A) Redlich-Peterson, (B) Sips, (C) Temkin (dosage: 4 g L–1; temperature: 28 °C).
Processes 11 03423 g0a1

References

  1. Tuli, F.J.; Hossain, A.; Kibria, A.K.M.F.; Tareq, A.R.M.; Mamun, S.M.M.A.; Ullah, A.K.M.A. Removal of Methylene Blue from Water by Low-Cost Activated Carbon Prepared from Tea Waste: A Study of Adsorption Isotherm and Kinetics. Environ. Nanotechnol. Monit. Manag. 2020, 14, 100354. [Google Scholar] [CrossRef]
  2. Alrowais, R.; Bashir, M.T.; Sikandar, M.A.; Khan, M.H.; Alwushayh, B.; Ghazy, A.; Uddin, A.; Iqbal, J. Synthesis and Characterization of Nanometal Oxide-Biochar Derived from Date Palm Waste for Adsorption of Manganese and Iron from Contaminated Water. Water 2023, 15, 3603. [Google Scholar] [CrossRef]
  3. Wu, P.; Wu, W.; Li, S.; Xing, N.; Zhu, N.; Li, P.; Wu, J.; Yang, C.; Dang, Z. Removal of Cd2+ from Aqueous Solution by Adsorption Using Fe-Montmorillonite. J. Hazard. Mater. 2009, 169, 824–830. [Google Scholar] [CrossRef] [PubMed]
  4. WHO. Guidelines for Drinking-Water Quality, 4th Edition, Incorporating the 1st Addendum; WHO: Geneva, Switzerland, 2017; Available online: https://www.who.int/publications/i/item/9789241549950 (accessed on 2 July 2023).
  5. Marcelo, L.R.; de Gois, J.S.; da Silva, A.A.; Cesar, D.V. Synthesis of Iron-Based Magnetic Nanocomposites and Applications in Adsorption Processes for Water Treatment: A Review. Environ. Chem. Lett. 2021, 19, 1229–1274. [Google Scholar] [CrossRef]
  6. Osman, A.I.; Ayati, A.; Farghali, M.; Krivoshapkin, P.; Tanhaei, B.; Karimi-Maleh, H.; Krivoshapkina, E.; Taheri, P.; Tracey, C.; Al-Fatesh, A.; et al. Advanced Adsorbents for Ibuprofen Removal from Aquatic Environments: A Review; Springer International Publishing: Berlin/Heidelberg, Germany, 2023; ISBN 0123456789. [Google Scholar]
  7. Pakade, V.E.; Tavengwa, N.T.; Madikizela, L.M. Recent Advances in Hexavalent Chromium Removal from Aqueous Solutions by Adsorptive Methods. RSC Adv. 2019, 9, 26142–26164. [Google Scholar] [CrossRef]
  8. Ayati, A.; Tanhaei, B.; Beiki, H.; Krivoshapkin, P.; Krivoshapkina, E.; Tracey, C. Insight into the Adsorptive Removal of Ibuprofen Using Porous Carbonaceous Materials: A Review. Chemosphere 2023, 323, 138241. [Google Scholar] [CrossRef]
  9. Hameed, B.H.; El-Khaiary, M.I. Kinetics and Equilibrium Studies of Malachite Green Adsorption on Rice Straw-Derived Char. J. Hazard. Mater. 2008, 153, 701–708. [Google Scholar] [CrossRef] [PubMed]
  10. Wang, H.; Zhang, M.; Lv, Q. Removal Efficiency and Mechanism of Cr (VI) from Aqueous Solution by Maize Straw Biochars Derived at Different Pyrolysis Temperatures. Water 2019, 11, 781. [Google Scholar] [CrossRef]
  11. Anwar, J.; Shafique, U.; Salman, M.; Dar, A.; Anwar, S. Removal of Pb (II) and Cd (II) from Water by Adsorption on Peels of Banana. Bioresour. Technol. 2010, 101, 1752–1755. [Google Scholar] [CrossRef]
  12. Bashir, M.T.; Ali, S.; Idris, A.; Harun, R. Kinetic and Thermodynamic Study of Nitrate Adsorption from Aqueous Solution by Lignocellulose-Based Anion Resins. Desalination Water Treat. 2017, 62, 20136. [Google Scholar] [CrossRef]
  13. Alrowais, R.; Bashir, M.T.; Sikandar, M.A.; Khan, M.A. Synthesis and Performance Evaluation of Olive Fruit Waste Resin for Removal of Fluoride from Aqueous Solution: Batch and Column Modeling. Desalination Water Treat. 2022, 252, 261–275. [Google Scholar] [CrossRef]
  14. Amdeha, E. Biochar-Based Nanocomposites for Industrial Wastewater Treatment via Adsorption and Photocatalytic Degradation and the Parameters Affecting These Processes. Biomass Convers. Biorefinery 2023, 1–26. [Google Scholar] [CrossRef]
  15. Ulhassan, Z.; Khan, I.; Hussain, M.; Khan, A.R.; Hamid, Y.; Hussain, S.; Allakhverdiev, S.I.; Zhou, W. Efficacy of Metallic Nanoparticles in Attenuating the Accumulation and Toxicity of Chromium in Plants: Current Knowledge and Future Perspectives. Environ. Pollut. 2022, 315, 120390. [Google Scholar] [CrossRef]
  16. Deng, R.; Huang, D.; Zeng, G.; Wan, J.; Xue, W.; Wen, X.; Liu, X.; Chen, S.; Li, J.; Liu, C. Decontamination of Lead and Tetracycline from Aqueous Solution by a Promising Carbonaceous Nanocomposite: Interaction and Mechanisms Insight. Bioresour. Technol. 2019, 283, 277–285. [Google Scholar] [CrossRef] [PubMed]
  17. Yang, J.; Hou, B.; Wang, J.; Tian, B.; Bi, J.; Wang, N.; Li, X.; Huang, X. Nanomaterials for the Removal of Heavy Metals from Wastewater. Nanomaterials 2019, 9, 424. [Google Scholar] [CrossRef] [PubMed]
  18. Banerjee, S.; Dubey, S.; Gautam, R.K.; Chattopadhyaya, M.C.; Sharma, Y.C. Adsorption Characteristics of Alumina Nanoparticles for the Removal of Hazardous Dye, Orange G from Aqueous Solutions. Arab. J. Chem. 2019, 12, 5339–5354. [Google Scholar] [CrossRef]
  19. Rheima, A.M.; sabri Abbas, Z.; Kadhim, M.M.; Mohammed, S.H.; Alhameedi, D.Y.; Rasen, F.A.; Ramadan, M.F.; Abed, Z.T.; Jaber, A.S.; Hachim, S.K. Aluminum Oxide Nano Porous: Synthesis, Properties, and Applications. Case Stud. Chem. Environ. Eng. 2023, 8, 100428. [Google Scholar] [CrossRef]
  20. Lingamdinne, L.P.; Choi, J.-S.; Angaru, G.K.R.; Karri, R.R.; Yang, J.-K.; Chang, Y.-Y.; Koduru, J.R. Magnetic-Watermelon Rinds Biochar for Uranium-Contaminated Water Treatment Using an Electromagnetic Semi-Batch Column with Removal Mechanistic Investigations. Chemosphere 2022, 286, 131776. [Google Scholar] [CrossRef]
  21. Dixit, A.; Gupta, S.; Dai Pang, S.; Kua, H.W. Waste Valorisation Using Biochar for Cement Replacement and Internal Curing in Ultra-High Performance Concrete. J. Clean. Prod. 2019, 238, 117876. [Google Scholar] [CrossRef]
  22. Bakar, A.H.B.A.; Koay, Y.S.; Ching, Y.C.; Abdullah, L.C.; Choong, T.S.Y.; Alkhatib, M.; Mobarekeh, M.N.; Zahri, N.A.M. Removal of Fluoride Using Quaternized Palm Kernel Shell as Adsorbents: Equilibrium Isotherms and Kinetics Studies. BioResources 2016, 11, 4485–4511. [Google Scholar]
  23. Dehmolaei, A.; Vadi, M. Comparative Study of Isotherms Adsorption of B12 by Single-Wall Carbon Nanotube and Multi-Wall Carbon Nanotube. Orient. J. Chem. 2014, 30, 265. [Google Scholar] [CrossRef]
  24. Noura, A.L.; Abu-Sharar, T.M. Kinetics of Fluoride Adsorption onto Native and Mg(OH)2-Amended Limestone. Appl. Water Sci. 2021, 11, 37. [Google Scholar] [CrossRef]
  25. Hagemann, N.; Joseph, S.; Schmidt, H.-P.; Kammann, C.I.; Harter, J.; Borch, T.; Young, R.B.; Varga, K.; Taherymoosavi, S.; Elliott, K.W. Organic Coating on Biochar Explains Its Nutrient Retention and Stimulation of Soil Fertility. Nat. Commun. 2017, 8, 1089. [Google Scholar] [CrossRef] [PubMed]
  26. Tan, X.; Liu, Y.; Zeng, G.; Wang, X.; Hu, X.; Gu, Y.; Yang, Z. Application of Biochar for the Removal of Pollutants from Aqueous Solutions. Chemosphere 2015, 125, 70–85. [Google Scholar] [CrossRef] [PubMed]
  27. Ahmad, M.; Rajapaksha, A.U.; Lim, J.E.; Zhang, M.; Bolan, N.; Mohan, D.; Vithanage, M.; Lee, S.S.; Ok, Y.S. Biochar as a Sorbent for Contaminant Management in Soil and Water: A Review. Chemosphere 2014, 99, 19–33. [Google Scholar] [CrossRef] [PubMed]
  28. Xiao, X.; Chen, B.; Zhu, L. Transformation, Morphology, and Dissolution of Silicon and Carbon in Rice Straw-Derived Biochars under Different Pyrolytic Temperatures. Environ. Sci. Technol. 2014, 48, 3411–3419. [Google Scholar] [CrossRef] [PubMed]
  29. Goldstein, J.I.; Newbury, D.E.; Michael, J.R.; Ritchie, N.W.M.; Scott, J.H.J.; Joy, D.C. Scanning Electron Microscopy and X-ray Microanalysis; Springer: Berlin/Heidelberg, Germany, 2017; ISBN 1493966766. [Google Scholar]
  30. Ahuja, R.; Kalia, A.; Sikka, R.; Chaitra, P. Nano Modifications of Biochar to Enhance Heavy Metal Adsorption from Wastewaters: A Review. ACS Omega 2022, 7, 45825–45836. [Google Scholar] [CrossRef]
  31. Chaukura, N.; Murimba, E.C.; Gwenzi, W. Synthesis, Characterisation and Methyl Orange Adsorption Capacity of Ferric Oxide–Biochar Nano-Composites Derived from Pulp and Paper Sludge. Appl. Water Sci. 2017, 7, 2175–2186. [Google Scholar] [CrossRef]
  32. Zhang, M.; Gao, B. Removal of Arsenic, Methylene Blue, and Phosphate by Biochar/AlOOH Nanocomposite. Chem. Eng. J. 2013, 226, 286–292. [Google Scholar] [CrossRef]
  33. Yan, J.; Han, L.; Gao, W.; Xue, S.; Chen, M. Biochar Supported Nanoscale Zerovalent Iron Composite Used as Persulfate Activator for Removing Trichloroethylene. Bioresour. Technol. 2015, 175, 269–274. [Google Scholar] [CrossRef]
  34. Cedrún-Morales, M.; Ceballos, M.; Polo, E.; Del Pino, P.; Pelaz, B. Nanosized Metal–Organic Frameworks as Unique Platforms for Bioapplications. Chem. Commun. 2023, 59, 2869–2887. [Google Scholar] [CrossRef]
  35. Inyang, M.; Gao, B.; Yao, Y.; Xue, Y.; Zimmerman, A.R.; Pullammanappallil, P.; Cao, X. Removal of Heavy Metals from Aqueous Solution by Biochars Derived from Anaerobically Digested Biomass. Bioresour. Technol. 2012, 110, 50–56. [Google Scholar] [CrossRef]
Figure 1. Preparation sequence of Al2O3 (nano-metal oxide) blended biochar.
Processes 11 03423 g001
Figure 2. FTIR spectrums for BC and NMOBC before and after iron removal from contaminated water.
Processes 11 03423 g002
Figure 3. EDX/SEM analysis of BC and NMOBC samples: (a) BC, (b) NMOBC, (c) iron-loaded BC, (d) iron-loaded NMOBC.
Processes 11 03423 g003
Figure 4. Plots for pHPZC on BC and NMOBC. (A); pHPZC on BC (B); pHPZC on NMOBC.
Processes 11 03423 g004
Figure 5. Performance of adsorption of iron on BC and NMOBC. (A) Removal % of iron and equilibrium, (B) adsorption capacity of iron (BC and NMOBC dosages, 4 g/L, pH = 7 ± 2).
Processes 11 03423 g005
Figure 6. Adsorption dynamics of kinetics for iron uptake. (A) Iron uptake on BC, (B) iron uptake on NMOBC (BC and NMOBC dosages, 4 g/L, pH = 7 ± 2).
Processes 11 03423 g006
Figure 7. Adsorption isotherms for iron removal predicted by the Langmuir and Freundlich models, (A) NMOBC, (B) BC (dosage: 4 g L–1; temperature: 28 °C).
Processes 11 03423 g007
Figure 8. Comparative adsorption capacities across cycles on regeneration on NMOBC and BC.
Processes 11 03423 g008
Table 1. EDX point analysis of BC and NMOBC samples (%wt).
AdsorbentsCOSiClKCaFeAl
BC75.687.322.094.774.173.44------------------
NMOBC77.8211.471.591.121.294.06---------0.33
BC-Fe81.488.952.431.380.812.860.90---------
NMOBC-Fe79.9310.172.320.500.221.821.280.88
Table 2. Surface and pore size analysis of BC and NMOBC.
AdsorbentBET Area (m2g−1)Pore Size (nm)Pore VAv (cm3g−1)
BC31.295.4542.73
NMOBC34.425.9351.12
Table 3. Parameters of kinetics models for iron removal: Pseudo orders and Elovich model on NMOBC and BC.
Ci (mg/L)q(mg/L)
Exp.
Pseudo—First—Order on NMOBCPseudo—First—Order on BC
qe (mg/g)k1 (1/min)R2qe (mg/g)k1 (1/min)R2
51.1701.1880.16340.8942.0520.15990.891
102.2891.9640.09780.9932.4610.16640.907
153.3844.6620.15710.9295.0510.15790.903
204.4535.9960.19280.9275.2520.15540.931
255.4696.8270.09910.9215.5620.14320.996
306.5137.4690.15790.9776.6820.19060.906
Ci (mg/L)q(mg/L)
Exp.
Pseudo—second—order on NMOBCPseudo—second—order on BC
qe (mg/g)k2 (g/mg·min)R2qe (mg/g)k2 (g/mg·min)R2
51.1701.3050.12380.9991.3630.06870.999
102.2892.5480.06750.9992.4830.15680.999
153.3843.7480.04890.9993.6710.03120.994
204.4535.0660.02860.9984.6930.02710.991
255.4696.0280.03390.9975.61800.02480.990
306.5137.1680.02910.9966.54020.02070.995
Ci (mg/L)q(mg/L)
Exp.
Elovich Model on NMOBCElovich Model on BC
Adsorption rate (α) (mg/g·min)Surface coverage (β) (g/mg)R2Adsorption rate (α) (mg/g·min)Surface coverage (β) (g/mg)R2
51.1700.5243.8700.9810.2583.2160.977
102.2891.0821.9830.9690.5311.6710.964
153.3841.7211.3590.9650.8421.2020.955
204.4531.6160.9420.9721.1650.9330.934
255.4693.1080.8520.9481.5280.7850.918
306.5133.7490.7160.941.5540.6780.957
Table 4. Different parameters and characteristics of isotherm dynamics for iron removal on NMOBC and BC.
IsothermsLangmuirFreundlichRedlich-PetersonSipsTemkin
Isotherm Dynamics on NMOBC
ParametersQmax= 8.56 mg/gKF = 2.556 mg/gA = 5.603 mg/gQmax = 22.68 mg/gAT =3.039
b = 0.0.483 L/mgn = 1.481B = 1.135 L/mgKS =0.1301 L/gBT = 2.067 mg/g
g = 0.577β = 0.7898
R20.9940.9980.9990.9990.955
RMSE (mg/g)0.09720.07200.03120.02390.3832
Isotherm Dynamics on BC
ParametersQmax = 6.71 mg/gKF = 1.747 mg/gA = 4.0029 mg/gQmax = 15.87 mg/gAT = 1.918
b = 0.386 L/mgn = 1.679B = 1.4132 L/mgKS = 0.1259 L/gBT = 1.656 mg/g
g = 0.6250β = 0.7246
R20.9980.9960.9990.9990.971
RMSE (mg/g)0.12130.08050.02950.02780.2615
Disclaimer/Publisher’s Note: The statements, opinions and data contained in all publications are solely those of the individual author(s) and contributor(s) and not of MDPI and/or the editor(s). MDPI and/or the editor(s) disclaim responsibility for any injury to people or property resulting from any ideas, methods, instructions or products referred to in the content.

