Article

A Study on the Production Simulation of Coal–Shale Interbedded Coal Measure Superimposed Gas Reservoirs under Different Drainage Methods

1
School of Resources and Geosciences, China University of Mining and Technology, Xuzhou 221008, China
2
Jiangsu Key Laboratory of Coal-Based Greenhouse Gas Control and Utilization, China University of Mining and Technology, Xuzhou 221008, China
3
Carbon Neutrality Institute, China University of Mining and Technology, Xuzhou 221008, China
4
Key Laboratory of Coalbed Methane Resources and Reservoir Formation Process, China University of Mining and Technology, Xuzhou 221008, China
*
Author to whom correspondence should be addressed.
Processes 2023, 11(12), 3424; https://doi.org/10.3390/pr11123424
Submission received: 21 November 2023 / Revised: 6 December 2023 / Accepted: 9 December 2023 / Published: 13 December 2023
(This article belongs to the Special Issue Advances in Enhancing Unconventional Oil/Gas Recovery)

Abstract

:
To study the influence of different drainage methods on the production performance of coal measure gas wells, the interbedded reservoir composed of coal and shale in the Longtan Formation of the Dahebian block was used as the research object. Considering the influence of coal and shale matrix shrinkage, effective stress, and interlayer fluid flow on reservoir properties such as fluid migration behavior and permeability, a fluid–solid coupling mathematical model of coal measure superimposed gas reservoirs was established. Numerical simulations of coal measure gas production under different drainage and production modes were conducted to analyze the evolution of reservoir pressure, gas content in the matrix, permeability, and other characteristic parameters of the superimposed reservoir, as well as differences in interlayer flow. The results showed that, compared to single-layer drainage, cumulative gas production increased by 33% under multi-layer drainage. Both drainage methods involve interlayer energy and substance transfer. Due to the influence of permeability, porosity, and mechanical properties, significant differences exist in reservoir pressure distribution, preferential flow direction, gas content in the matrix, and permeability ratio between coal and shale reservoirs under different drainage and production modes. Multi-layer drainage effectively alleviates the influence of vertical reservoir pressure differences between reservoir layers, facilitates reservoir pressure transmission in shale reservoirs, enhances methane desorption in shale matrices, promotes matrix shrinkage, and induces the rebound of shale reservoir permeability, thus improving overall gas production.

1. Introduction

Coal measure gas refers to all kinds of natural gas (i.e., coalbed methane, coal measure shale gas, and coal measure sandstone gas) in a coal measure reservoir, which is an important part of unconventional natural gas [1,2]. Western Guizhou is rich in coal measure gas resources and is a key area for coal measure gas development [3,4,5,6]. Due to the difference in physical properties of superimposed reservoirs, the gas production law is more complicated than that for single reservoirs, and the development is more difficult [7,8]. Therefore, studying the gas production effect of coal measure reservoirs under different drainage methods is helpful to understand the fluid migration law in coal measure superimposed reservoirs.
With the maturation of computer technology, the research method for coal measure gas development has changed in the direction of numerical simulation [9,10]. Models such as CMG, Eclipse, COMSOL Multiphysics, and so on are widely used [11,12,13,14] for the numerical simulation of coal measure gas development. Some scholars have developed gas and water seepage numerical models for coalbed methane and tight gas reservoirs and have studied the influence of pressure, saturation, and reservoir permeability on combined production [15,16,17,18]. Some scholars have also developed mathematical models for coal measure gas seepage in coal–sandstone composite reservoirs that consider interlayer channeling, have analyzed the variation law of reservoir pressure and gas production, and have discussed the gas seepage mechanism in coal–sandstone composite reservoirs [15,19]. In summary, the above models are mainly based on a combination of coal and sandstone reservoirs. There are relatively few studies on the combination of coal and shale reservoirs in coal measure reservoirs and the effect of coal measure gas production under different drainage methods. Research in this area is still in its infancy and needs further exploration.
In this paper, the C409 coal and its shale roof and floor in the Dahebian block of the Liupanshui Coalfield in western Guizhou are used as the research objects. Considering the influence of stress on the adsorption, diffusion, and seepage of CH4 in coal and shale and the dynamic change characteristics of coal and shale permeability, a fluid–solid coupling mathematical model of coal measure superimposed gas reservoirs was developed. Numerical simulations of coal measure gas output are carried out, and the gas production effect of coal measure gas wells under different drainage modes is discussed, which provides a scientific basis for the development of coal measure gas in the Dahebian block.

2. Coal Measure Superimposed Gas Reservoir Drainage Mathematical Model

2.1. Basic Assumptions

According to the differences in occurrence state and migration mechanism of coal measure gas in different reservoirs and previous studies [20,21,22], this study puts forward the following assumptions: (1) The reservoir is a ‘double pore‘ medium and homogeneous in all directions. (2) The seepage of CH4 and water in different reservoirs follows Darcy’s law, and water and CH4 are saturated in the fractures of coal and shale reservoirs. (3) The adsorption and desorption of CH4 mainly occur in the pores of the coal and shale matrix, and the diffusion process of CH4 in the matrix follows Fick’s first diffusion law. (4) The deformation of rock mass conforms to the assumption of small deformation, while the adsorption, desorption, and effective stress of CH4 will change the volume of the coal and shale matrix. (5) The reservoir temperature change is not considered in the process of coal measure gas drainage.

2.2. Governing Equations of Mechanical Field

According to assumption (4), considering the effective stress and the strain caused by the shrinkage effect of the coal and shale matrix, the governing equation for the stress field of coal and shale can be expressed as follows [23,24]:
G ( 1 ,   2 ) u i , j j + G ( 1 ,   2 ) 1 2 v ( 1 ,   2 ) u j , j i + F i = α m ( 1 ,   2 ) P m ( 1 ,   2 ) , i + α f ( 1 ,   2 ) P f ( 1 ,   2 ) , i + K ( 1 ,   2 ) ε a ( 1 ,   2 ) , i
where
α m = 1 K K s α f = 1 K a K n ε a = a s g V s g
where (1, 2) is coal and shale, respectively; G is the shear modulus (Pa); ui (i = x,y,z) is the displacement in the i direction; v is the Poisson’s ratio; K is the bulk modulus (Pa); Fi is the force in the i direction; αm and αf are Biot effective pressure coefficients; Kn is the stiffness of fracture (Pa); Pf and Pm are the fluid pressure in the fracture and the gas pressure in the matrix (Pa); εa is the matrix desorption shrinkage strain; Vsg is the adsorbed gas content (m3/kg); and asg is the adsorption strain coefficient (kg/m3).
The fluid pressure (Pf) in the fracture can be expressed as follows [25,26,27]:
P f ( 1 ,   2 ) = S w ( 1 ,   2 ) P f w ( 1 ,   2 ) + S g ( 1 ,   2 ) P f g ( 1 ,   2 )
where Pfw and Pfg are the water pressure and gas pressure in the fracture (Pa), respectively, while Sw and Sg are water saturation and gas saturation, respectively.
The content of adsorbed gas in coal and shale reservoirs can be expressed by the Langmuir volume equation as follows [9,27,28]:
V s g ( 1 ,   2 ) = V L ( 1 ,   2 ) P m ( 1 ,   2 ) P L ( 1 ,   2 ) + P m ( 1 ,   2 )
where VL is the Langmuir volume constant (m3/kg), and PL is the Langmuir pressure constant (Pa).

2.3. Governing Equation of Hydraulic Field

Before drainage, CH4 in the superimposed reservoir is in a dynamic equilibrium state, and the CH4 pressure in the matrix is equal to the CH4 pressure in the fracture. After the beginning of drainage, CH4 in the matrix begins to desorb. According to the Fick‘s diffusion law and the mass conservation equation of CH4 in the coal and shale matrix, the CH4 migration equation in the coal and shale reservoir matrix can be expressed as follows [29]:
m m ( 1 ,   2 ) t = M g τ ( 1 ,   2 ) R T P m ( 1 ,   2 ) P f g ( 1 ,   2 )
where (1, 2) is coal and shale, respectively; mm is the methane content in the matrix (kg/m3); τ is the methane desorption time (s); and Mg is the CH4 molar mass (kg/mol).
m m ( 1 ,   2 ) = V L ( 1 ,   2 ) P m ( 1 ,   2 ) P L ( 1 ,   2 ) + P m ( 1 ,   2 ) ρ s ( 1 ,   2 ) M g R T s P s + ϕ m ( 1 ,   2 ) M g R T P m ( 1 ,   2 )
where ρs is the coal skeleton density (kg/m3), and ϕm is the porosity in the matrix system.
During the exploitation of coal measure gas, the coal and shale matrix continuously provides CH4 to the fracture. The coal and shale matrix can be considered the mass source of CH4 in the fracture. The mass conservation equation of CH4 in the fracture of coal and shale can be expressed as follows [27,28]:
t S g ( 1 ,   2 ) ϕ f ( 1 ,   2 ) M g P f g ( 1 ,   2 ) R T ( 1 ,   2 ) + M g P f g ( 1 ,   2 )   +   b 1 R T ( 1 ,   2 ) k r g k ( 1 ,   2 ) μ g P f g ( 1 ,   2 ) = Q g t S w ( 1 ,   2 ) ϕ f ( 1 ,   2 ) ρ w + ρ w k r w k ( 1 ,   2 ) μ w P f w ( 1 ,   2 ) = Q w
where
Q g = 1 ϕ f ( 1 ,   2 ) M g τ R T ( 1 ,   2 ) P m ( 1 ,   2 ) P f g ( 1 ,   2 ) Q w = 0
where ϕf is the porosity in the fracture; ug and uw are the velocities of gas and water (Pa·s); Qg and Qw are gas and water sources or sinks, respectively; and krg and krw are the relative permeabilities of gas and water, respectively, which are given as follows [9,30,31]:
k r g = 1 S w     S w r 1     S w r     S g r 2 1 S w     S w r 1     S w r 2 k r w = S w     S w r 1     S w r 4
where Swr is the irreducible water saturation, and Sgr is the residual gas saturation.
Under the influence of the vertical pressure difference, the fluid migrates to the reservoir with better permeability through interlayer flow. According to Darcy’s law, the interlayer fluid flow equation can be expressed as follows [32]:
t ρ g ϕ c P f   +   z ρ g u z = 0
where uz is the velocity of interlayer flow, which can be expressed as follows [32]:
u z = k c ( P f ) μ g d i v ( P z )
where kc is interlayer permeability, and div(Pz) is the pressure gradient.

2.4. Porosity and Permeability Equations in Reservoirs

Considering the influence of effective stress and adsorption strain on porosity, the porosity of coal and shale reservoirs can be expressed as follows [27,33]:
{ ϕ ( 1 ,   2 ) = [ ( 1   +   s 0 ( 1 ,   2 ) ) ϕ 0 ( 1 ,   2 )   +   α f ( s ( 1 ,   2 )     s 0 ( 1 ,   2 ) ) ] ( 1   +   s ( 1 ,   2 ) ) ϕ 0 ( 1 ,   2 ) s ( 1 ,   2 ) = ε v ( 1 ,   2 ) + P f K s ( 1 ,   2 ) + ε a ( 1 ,   2 )
where s0 is the initial value of the variable, εa is the deformation of the coal and shale matrix caused by gas adsorption, εv is the volumetric strain, and Ks is the bulk modulus (Pa).
Based on the cubic law, the relationship between permeability and porosity can be derived. Specifically, the fracture permeability of the reservoir can be expressed as follows: [27,34,35]:
k ( 1 ,   2 ) = k 0 ( 1 ,   2 ) ( ϕ ( 1 ,   2 ) ϕ 0 ( 1 ,   2 ) ) 3
where k0 is the initial absolute permeability (m2).

3. Model Validation

3.1. Simulation Case

Liupanshui Coalfield is located in the west of Guizhou Province (Figure 1a). It is an important coal industry base in China and an important CBM exploration and development zone in China [36,37,38,39]. The Dahebian block is located in the Liupanshui coalfield (Figure 1b), which is rich in coalbed methane resources and has good development potential for coalbed methane resources [37,38]. The C409 coal seam is the main coal seam with a relatively stable distribution in this area, with a thickness of 1.17~13.8 m and an average thickness of 4.6 m. According to logging data, the gas content of the C409 coal seam in the W1 well is as high as 25.27 m3/t, and each coal seam in the well field is a methane-rich coal seam (Figure 2). The C409 coal and its roof and floor generally contain gas, and the gas content of the coal seam is much higher than that of other lithologic reservoirs. The peak values of gas logging are generally 5~20 times those of non-coal seams (Figure 1c).
Before the production of coal measure gas wells in the Dahebian block, sand hydraulic fracturing was first carried out. Taking the W1 well as an example, fracture simulation was carried out using Fracpro PT fracturing software. The results of the fracture simulation showed that the half-length of the fracture, the total height of the fracture, and the total height of the supporting fractures were far greater than the thickness of the C409 coal seam and that the fracture extended to the roof and floor of the coal seam (Table 1).
In this study, the C409 coal and its roof and the floor coal reservoir of the W1 well in the Dahebian block of the Liupanshui mining area were selected as the objects to carry out numerical simulation. The buried depth of the reservoir is 903 m, the thickness of the C409 coal seam is 13.5 m, and the thickness of the roof shale is 10.5 m. The bottom mud shale is 2 m thick. According to the formation structure of the production well and taking into account the computer memory and running speed, 1/4 of the area was selected according to symmetry to construct the physical model (Figure 3). The length and width were 250 m × 250 m, the height was the actual reservoir thickness of 26 m, and the radius of the gas well was 0.12 m. In order to observe the simulation effect of gas drainage in coal measures, the XZ plane was selected as the observation surface, and A (1,1,21), B (1,1,8), C (1,1,1), A′ (10,10,21), B′ (10,10,8), and C′ (10,10,1) were the spatial position coordinates (m) of the observation points (Figure 3c).

3.2. Numerical Parameters and Their Schemes

Experimental findings or the relevant literature were the sources for the parameters utilized in the numerical simulation of coal measure gas drainage (Table 2) [27,32,34,40].
The accuracy of the mathematical model was verified by comparing it to the actual production history of coal measure gas wells. Combined with the actual production characteristics of gas wells, the variation law of reservoir characteristic parameters and differences in interlayer flow during the production process of coal measure gas under different drainage modes were studied. According to the conditions mentioned above, the simulations were divided into two categories: multi-layer drainage (full-stage perforation) and single-layer drainage (coal seam perforation) (Table 3).

3.3. Boundary Conditions

The initial coal measure reservoir pressure was set as the initial condition (the coal seam and its roof and floor are in the same pressure system under the initial condition), Pfg0 = 9.203 MPa; the actual bottom hole flow pressure of the gas well was set as the internal boundary condition, and the other boundaries were designated non-flow boundaries. For the physical model, the upper boundary was designated a vertical downward boundary load, the lower boundary was designated a fixed constraint, and the surrounding area was designated a slip boundary.

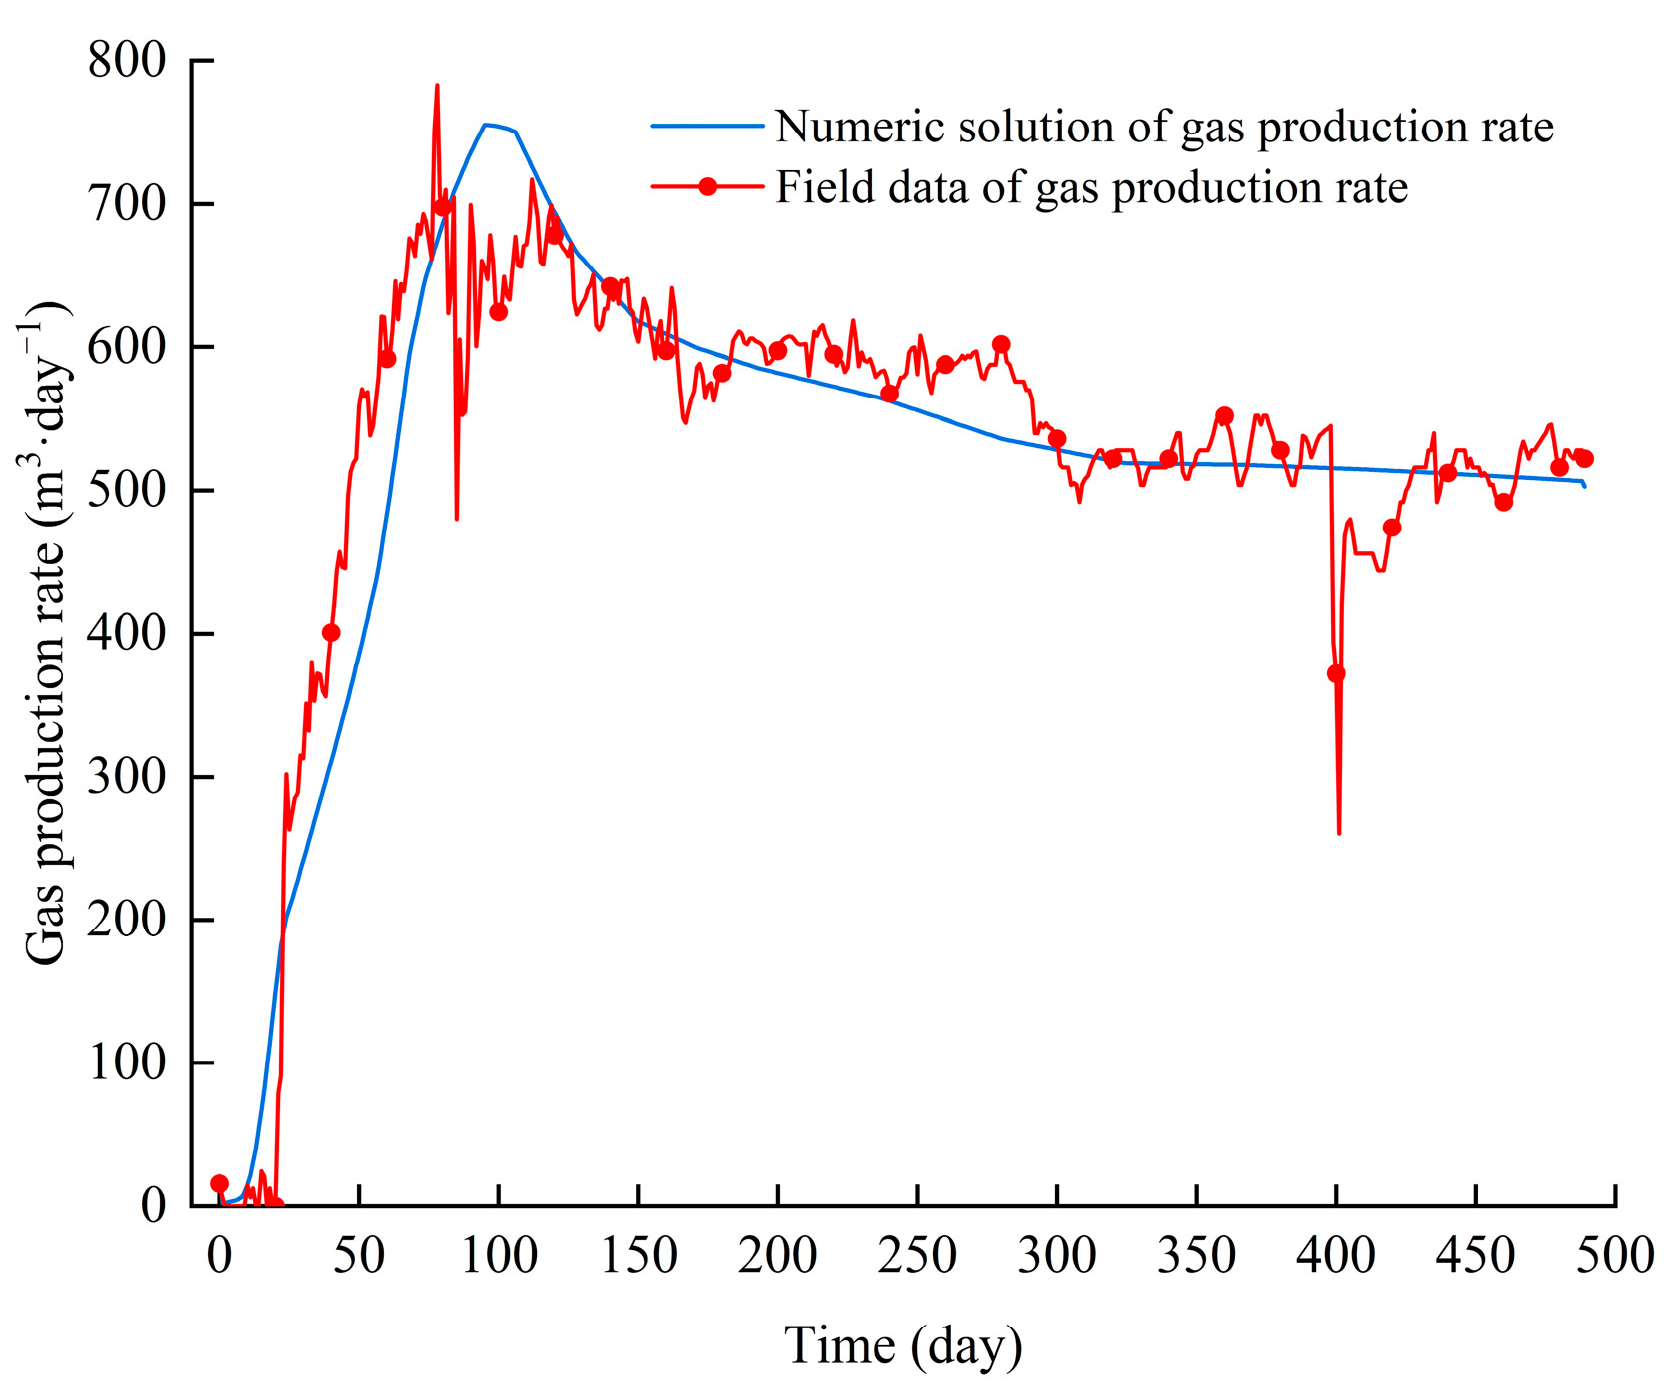
3.4. History Fitting
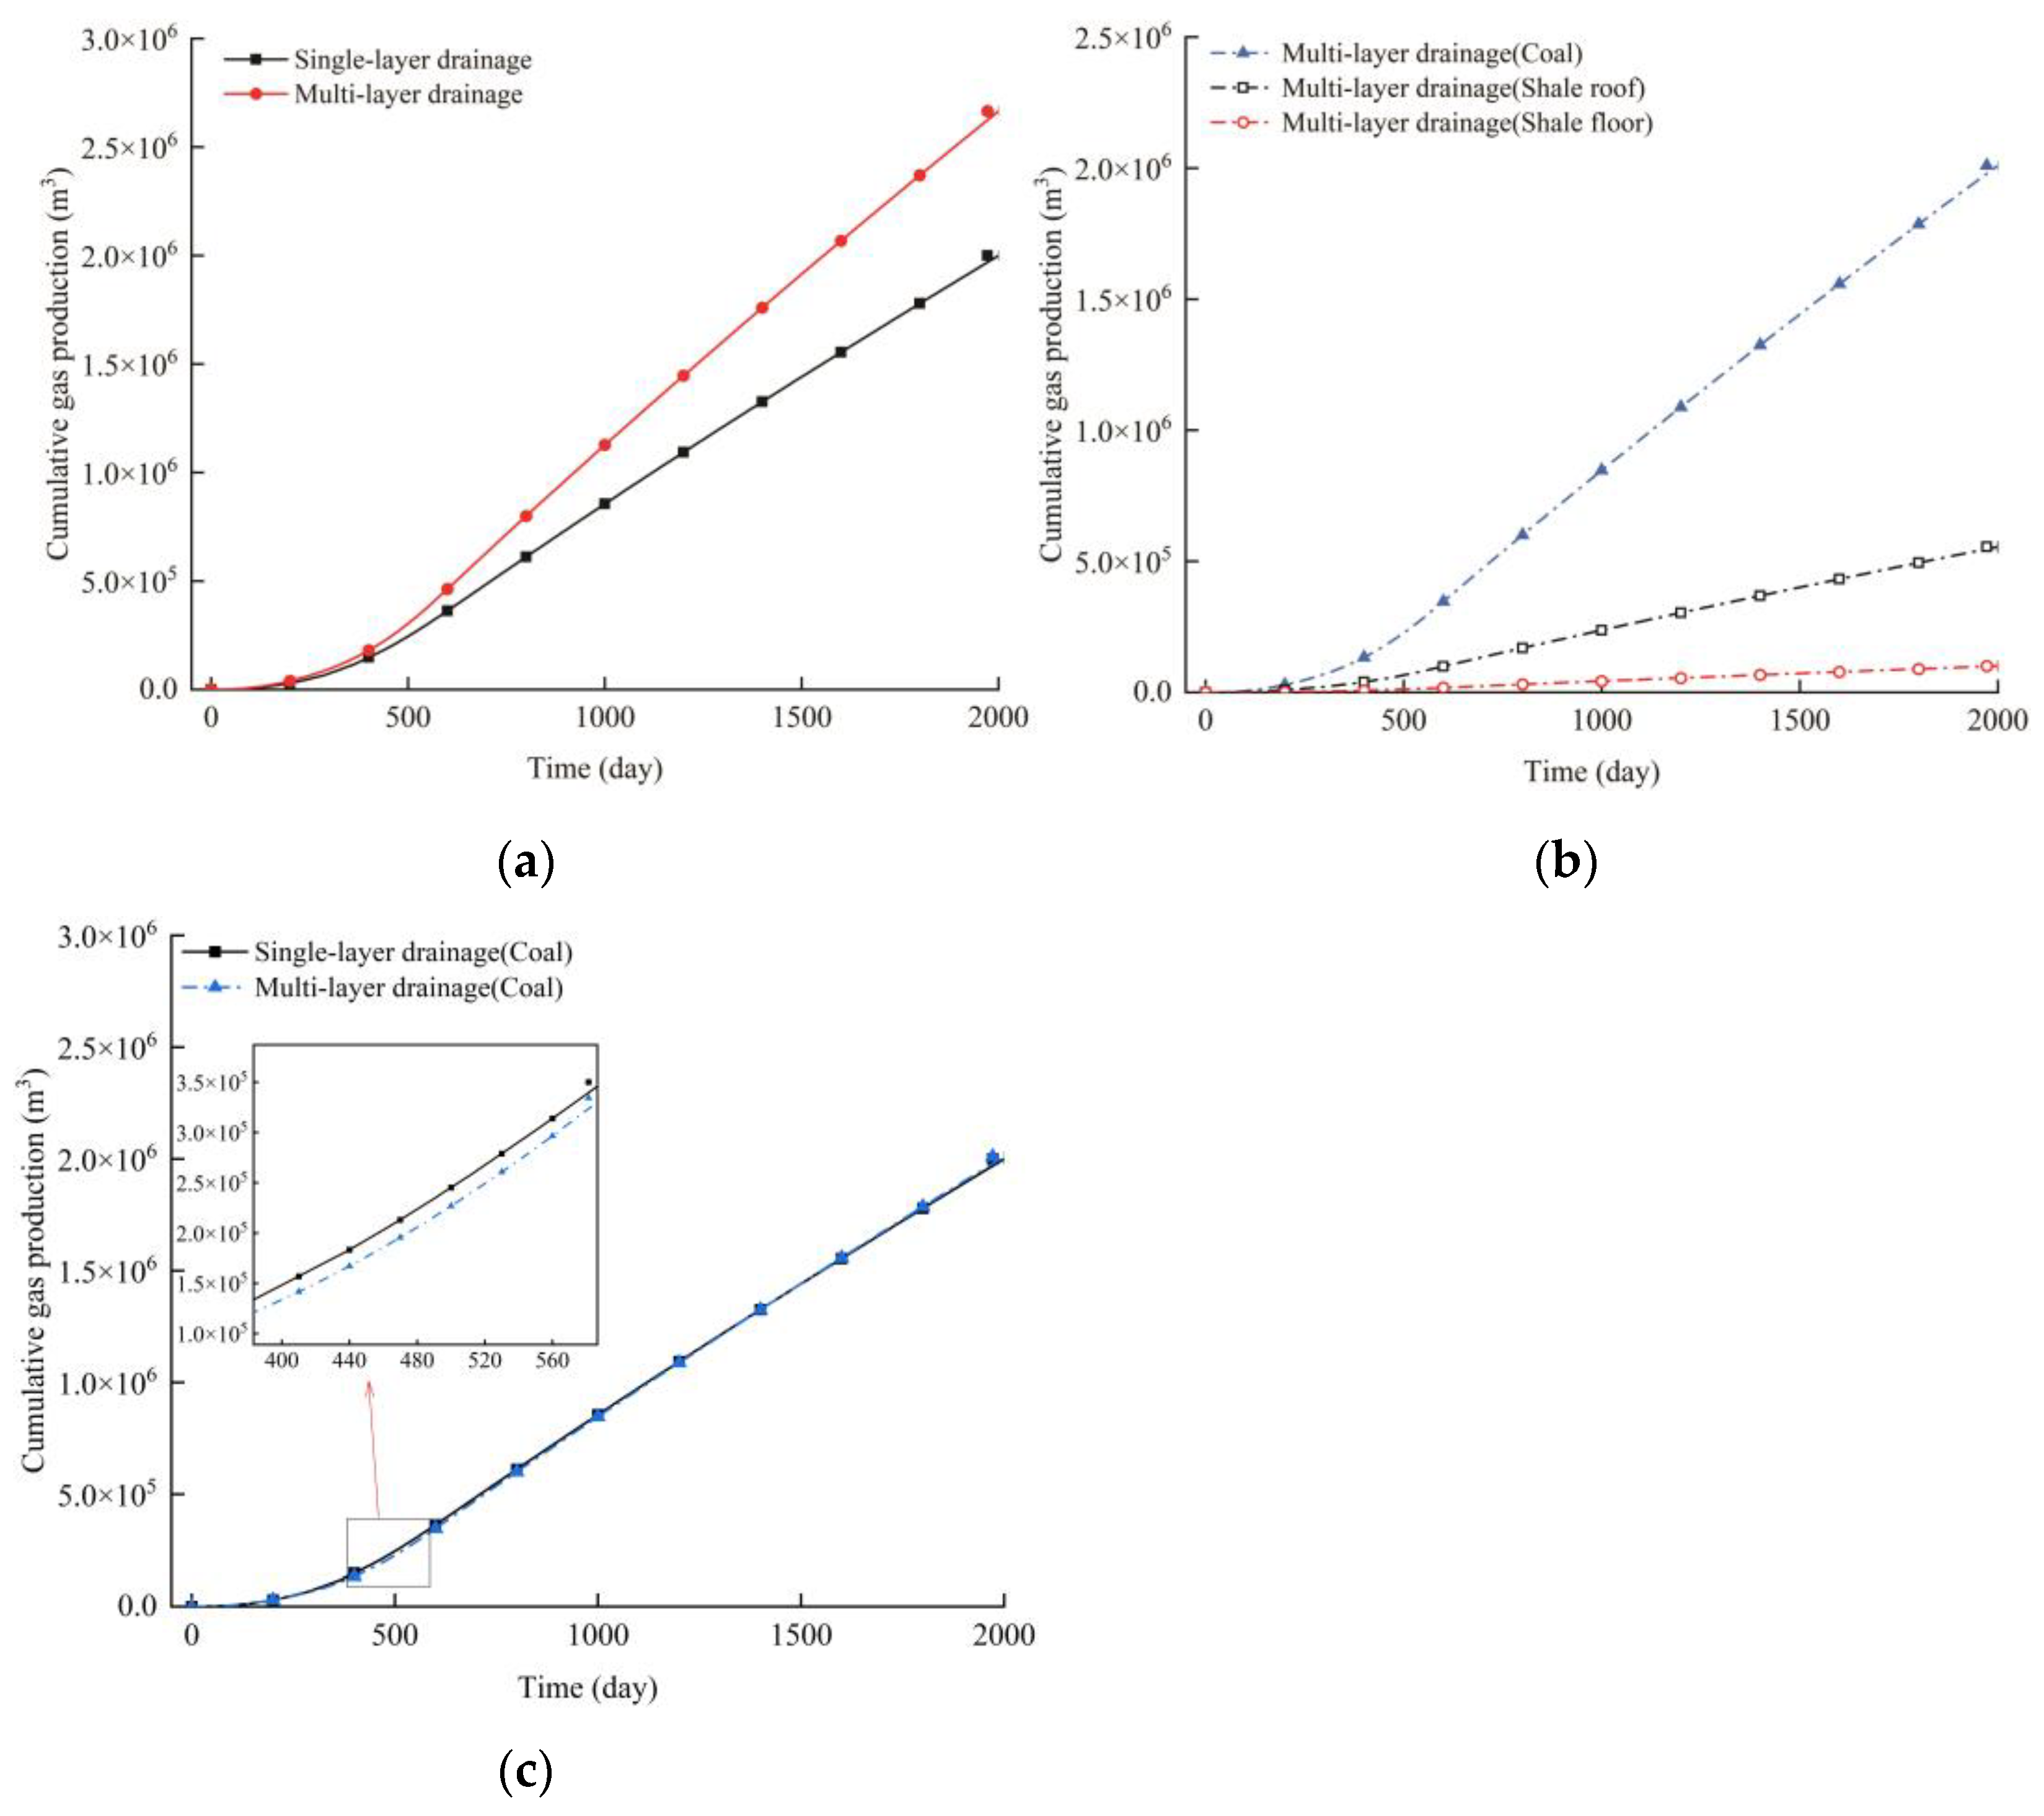
By comparing the measured daily gas production of CH4 in the production well with the numerical simulation results, it can be seen that the simulated daily gas production is in good agreement with the measured daily gas production, with an error of 10.7%. The applicability and accuracy of the mathematical model are verified, which provides a basis for estimating dynamic changes in reservoir parameters in subsequent research and development (Figure 4).

4. Results

Compared with single-layer drainage, the cumulative gas production of full-layer drainage is increased by 33% (Figure 5a). Among them, coal seam gas production contributed the most, accounting for 75%; the shale roof was second, accounting for 21%; and the shale floor was the smallest, accounting for 4% (Figure 5b). It can be seen from Figure 5c that the cumulative gas production of the coal seam under single-layer drainage is slightly larger than that of the coal seam under full-layer drainage. This is because, during the single-layer drainage process, the methane in the roof and floor (shale) migrates to the coal seam under the influence of the vertical pore pressure difference and permeability difference among reservoirs and flows to the wellbore under the influence of the radial pore pressure difference of the reservoir. The rebound of the radial pore pressure difference and permeability of the roof and floor (shale) in the full-layer drainage process weakens the influence of the vertical pore pressure difference between reservoirs on the methane migration, so that the methane in the roof and floor (shale) flows radially to the wellbore, resulting in the cumulative gas production under single-layer drainage being slightly larger than the cumulative gas production of the coal seam under full-layer drainage.

5. Discussion

5.1. Influencing Factors of Gas Production Effect of Coal Measure Gas Wells under Different Drainage Methods

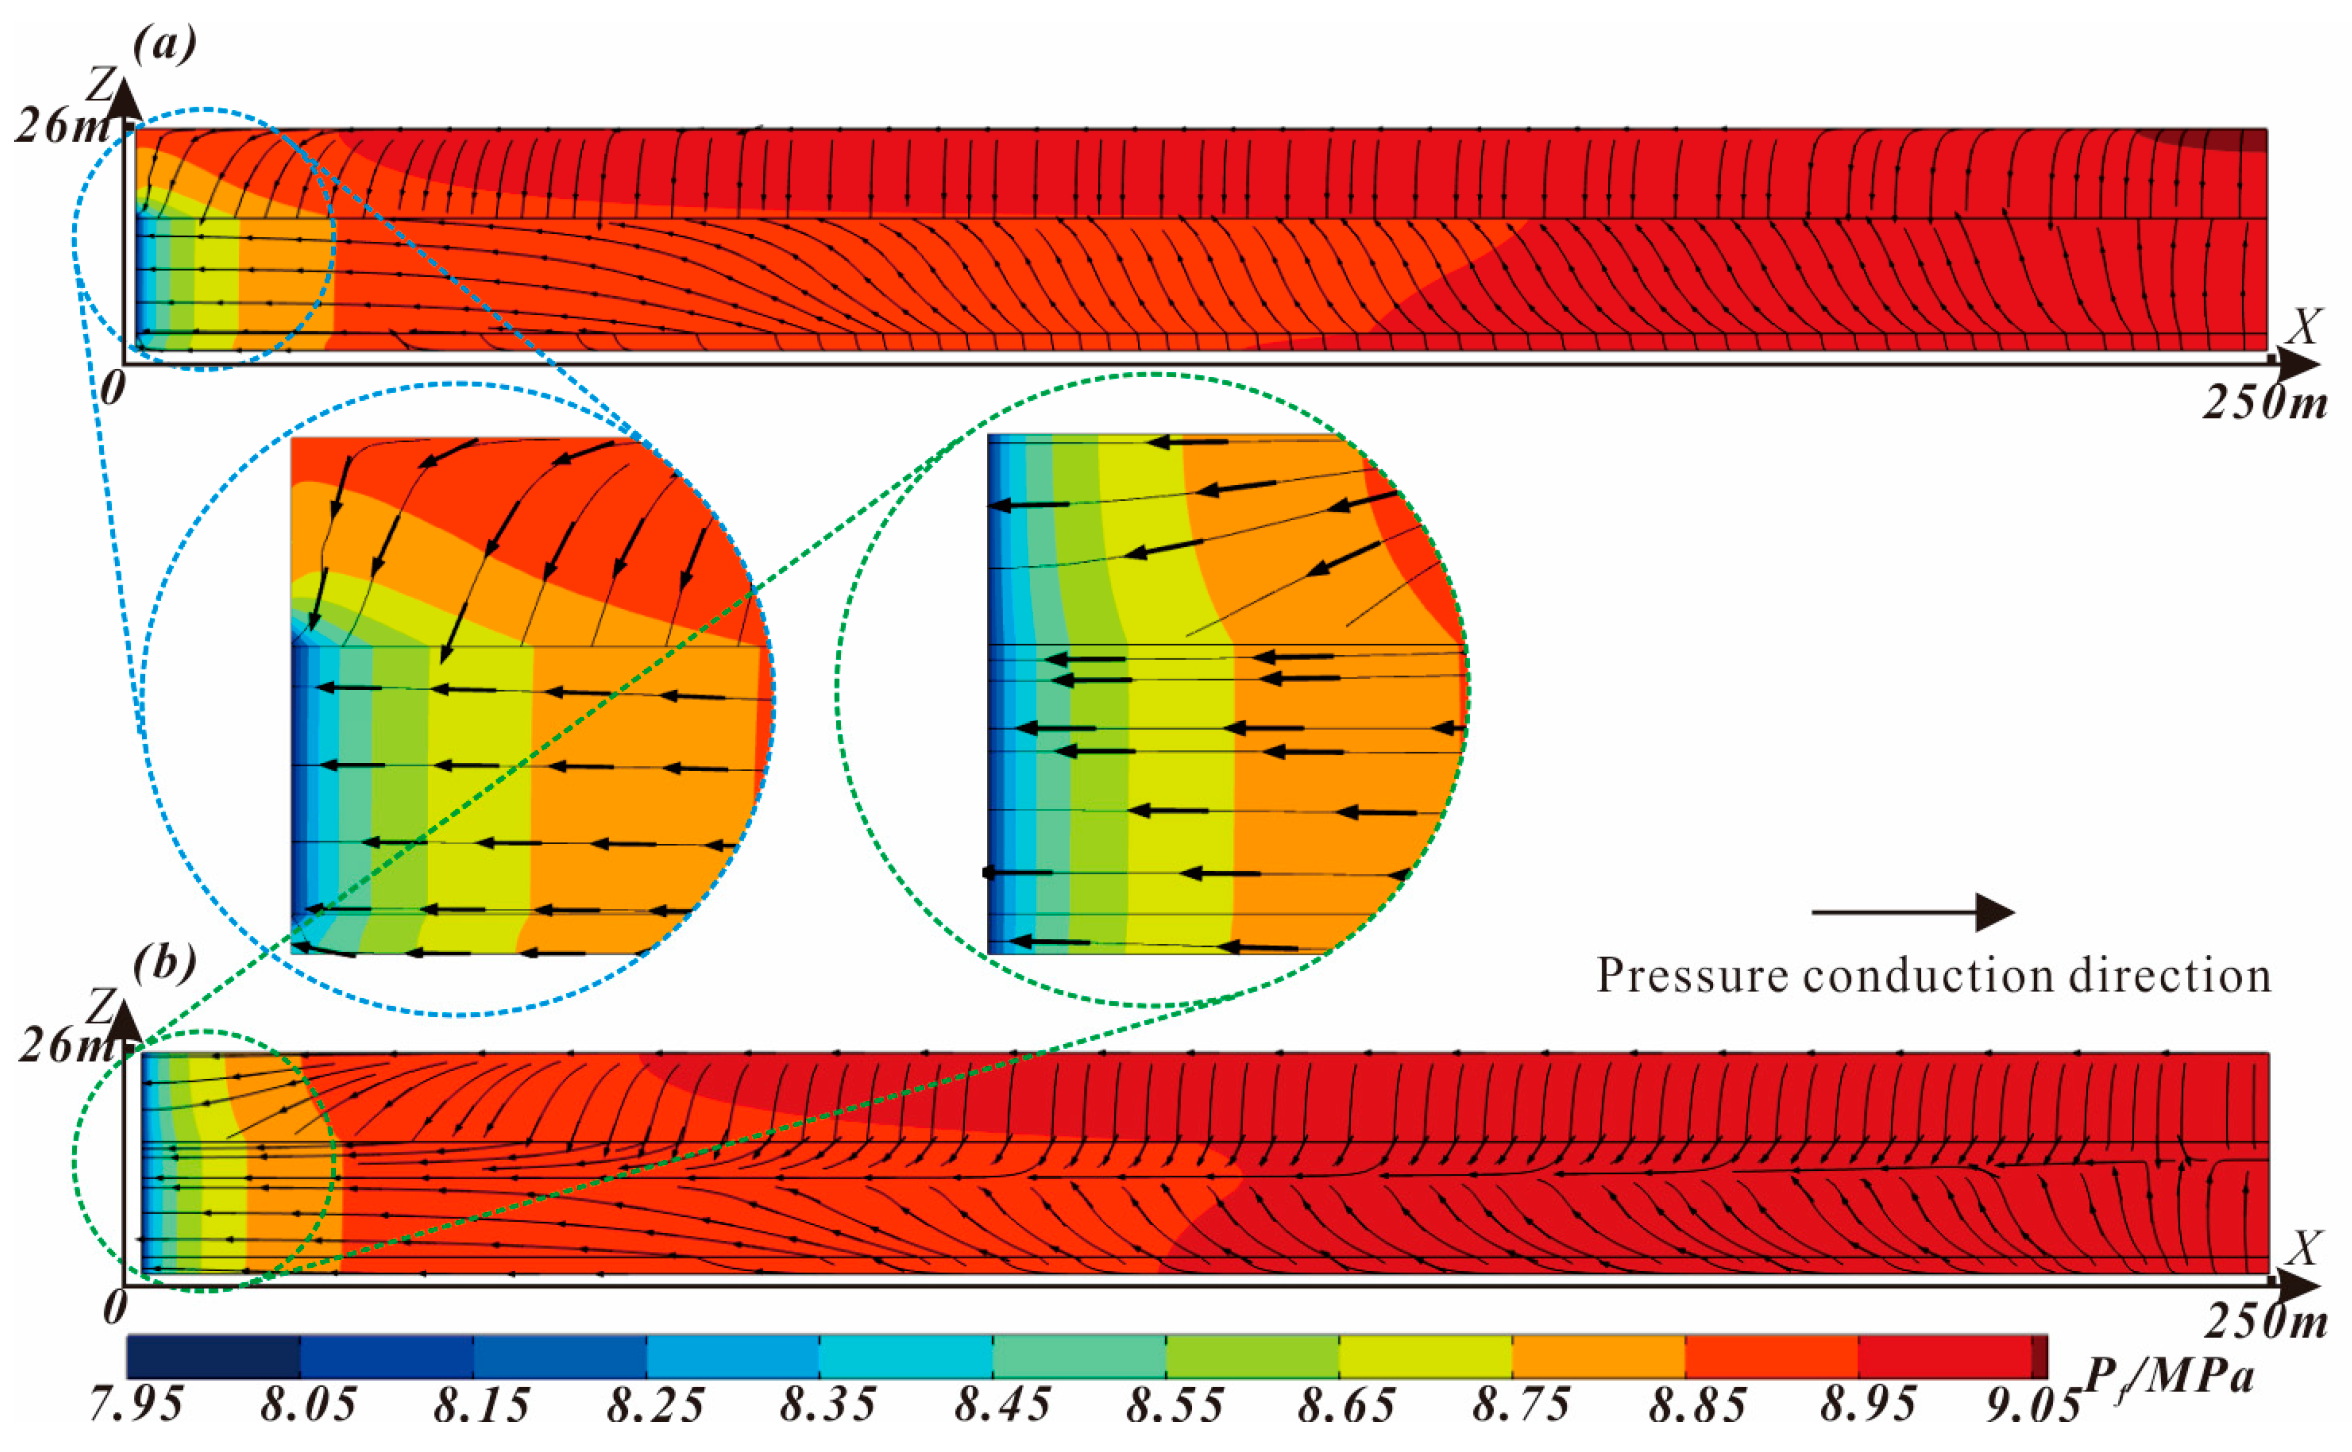
5.1.1. Influence of Pressure Conduction Mode on Gas Production Effect

With the development of coal measure gas drainage, the reservoir pressure in each reservoir changes continuously. Affected by the difference in drainage methods and physical properties of different reservoirs, the reservoir pressure changes and conduction directions of coal and shale reservoirs are significantly different.
On the 30th day of drainage, the decreased range of reservoir pressure in the coal reservoir is larger than that in the shale reservoir under both drainage modes, which leads to the formation of a vertical reservoir pressure difference between the coal reservoir and the shale reservoir, and the reservoir pressure is transmitted from the high-reservoir-pressure area of the shale reservoir to the low-reservoir-pressure area of the coal reservoir (Figure 6). The pressure gradient is the main driving force for the migration of coal measure gas. Under the influence of the reservoir pressure difference between reservoirs, the migration direction of coal measures gas is also from the high-reservoir-pressure area of the shale reservoir to the low-reservoir-pressure area of the coal reservoir.
The pressure drop range of coal and shale reservoirs under single-layer drainage and multi-layer drainage increases gradually with the increase in drainage time. The decreased range of pore pressure in the shale reservoir near the coal seam is greater than that further away from the coal seam. Taking the reservoir pressure drop to the range of 7 MPa as an example, after 500 d, 1000 d, and 2000 d of drainage, the pressure drop range of the coal reservoir under multi-layer drainage increased by 1.5 m, 2.1 m, and 7.1 m, respectively, compared with single-layer drainage, and increased gradually with drainage time (Figure 7).
Combined with Figure 6 and Figure 7, it can be seen that, compared with single-layer drainage, multi-layer drainage can effectively reduce the vertical reservoir pressure difference between layers, slow down the vertical pressure conduction between reservoirs, and promote the expansion of the radial reservoir pressure drop range of the overall reservoir.

5.1.2. The Influence of Gas Content Change on Gas Production Effect

Figure 8 shows the changes in matrix gas content with drainage time under different drainage modes at 1.4 m and 14 m from the wellbore.
Under the two drainage methods, the gas content of the matrix at 1.4 m and 14 m from the wellbore showed a trend of gradual decrease with the extension of production time. Due to the differences in gas content, porosity, and permeability between coal and shale reservoirs, there are significant differences in the reduction in gas content between the two reservoirs.
At the end of single-layer drainage, the gas content of the coal reservoir decreases by 6.98 m3/t, the gas content of the shale roof decreases by 0.15 m3/t, and the gas content of the shale floor decreases by 0.25 m3/t (Figure 8a); at 14 m from the wellbore, the gas content of the coal reservoir decreases by 2.31 m3/t, the gas content of the shale roof decreases by 0.08 m3/t, and the gas content of the shale floor decreases by 0.09 m3/t. With the increase in distance, the drop in reservoir pressure decreases, and the desorption amount of the reservoir matrix decreases gradually (Figure 8b).
At the end of multi-layer drainage, the gas content of the coal reservoir at 1.4 m from the wellbore is reduced by 7.04 m3/t, the gas content of the shale roof is reduced by 0.28 m3/t, and the gas content of the shale floor is reduced by 0.30 m3/t (Figure 8a); at a distance of 14 m from the wellbore, the gas content of the coal reservoir is reduced by 2.39 m3/t, the gas content of the shale roof is reduced by 0.09 m3/t, and the gas content of the shale floor is reduced by 0.09 m3/t (Figure 8b). In addition, at a distance of 1.4 m from the wellbore, there is a significant difference in the reduction in gas content in the shale roof and floor under single-layer drainage. This is mainly due to the difference in reservoir pressure between the shale roof and floor reservoirs. The floor is thinner than the roof, and the reservoir pressure is more susceptible to the change in coal seam reservoir pressure. Under multi-layer drainage, the reservoir pressure conduction efficiency of the shale roof is improved, facilitating the desorption and diffusion of methane in the shale matrix. Compared with single-layer drainage, the reduction in gas content in each reservoir has increased, which is more conducive to the increase in production.

5.1.3. The Influence of Permeability on Gas Production Effect

Figure 9 shows the change in permeability ratio of each reservoir with drainage time under different drainage modes at different distances from the wellbore. At a distance of 1.4 m from the wellbore, under single-layer drainage, the proportion of coal seam permeability decreases first and then increases. Due to the rapid decrease in reservoir pressure of the coal reservoir at the initial stage of drainage, the amount of matrix desorption is small, and the effective stress effect is greater than the matrix shrinkage effect, resulting in an initial coal reservoir permeability decrease to the lowest value of 0.978 after 90 days (Figure 9a). As the desorption amount of the coal matrix increases, matrix shrinkage increases, and permeability begins to increase (max = 1.153). Combined with Figure 7, it can be seen that after 500 days, the decrease in gas content of the coal matrix slows down, the shrinkage of the matrix weakens, and the increase in coal seam permeability ratio slows down.
The permeability ratio of the shale roof shows a decreasing trend with the extension of production time. The changing trend for shale floor permeability ratio is similar to that for coal seam permeability ratio. This is mainly because the shale floor is thin, and the reservoir pressure of the reservoir is more susceptible to the influence of the coal seam, and then the shale floor matrix is more prone to desorption shrinkage, so the permeability ratio has a slight rebound. Compared with single-layer drainage, the effect of multi-layer drainage on coal reservoir permeability is relatively small, and the permeability ratio only increases by about 0.003. For the shale roof and floor, the maximum permeability ratio increases by 0.034 and 0.013, respectively.
At 14 m away from the wellbore, the permeability of each reservoir shows a decreasing trend under the two drainage methods; the permeability ratio of the coal reservoir has a slight rebound after 500 days (Figure 9b). This is mainly due to the permeability change away from the wellbore being dominated by the effective stress, resulting in a decrease in the permeability ratio.

5.2. Enlightenment of Coal Measure Gas Development Project

The simulation results show that multi-layer drainage helps increase production. Under multi-layer drainage, the shale reservoir obtains a better seepage channel, thereby improving the overall reservoir pressure transfer efficiency of the superimposed reservoir, promoting matrix desorption and permeability rebound, and achieving the purpose of increasing production. However, due to the large differences in permeability, porosity, and mechanical properties of different lithologic reservoirs, the selection of perforation and perforation intervals and the selection of fracturing technology for non-coal seam sections in multi-layer drainage need to be further studied.

6. Conclusions

A fluid–solid coupling mathematical model for typical coal-series superimposed gas reservoirs was developed and solved by the finite element method. The simulation results show that the actual gas production and the simulated gas production fit well, which verifies the accuracy of the mathematical model.
Based on the numerical simulation results, the effects of different drainage methods on the production effect were discussed from three perspectives: reservoir pressure, matrix gas content, and the permeability of superimposed reservoirs. The results show that, compared with single-layer drainage, cumulative gas production under multi-layer drainage increases by 33%; both drainage methods exhibit interlayer energy and material transfer; affected by permeability, porosity, and mechanical properties, there are obvious differences in reservoir pressure and conduction direction, matrix gas content, and permeability ratio between coal and shale reservoirs under different drainage methods. Multi-layer drainage is more conducive to the reservoir pressure conduction of shale reservoirs, promotes the desorption of shale matrix methane, enhances matrix shrinkage, promotes an increase in shale reservoir permeability, and thus increases gas production.

Author Contributions

Conceptualization, S.L. and S.S.; Data curation, W.W., Y.L. and R.D.; Formal analysis, S.L. and W.W.; Investigation, W.W., Y.L. and R.D.; Methodology, W.W.; Project administration, S.L. and S.S.; Resources, S.L. and S.S.; Writing—original draft, W.W., S.L., R.D. and Y.L.; Writing—review and editing, W.W. All authors have read and agreed to the published version of the manuscript.

Funding

This research was funded by the National Natural Science Foundation of China (No. 42030810, 41972168) and was supported by the Fundamental Research Funds for the Central Universities (No. 2023KYJD1001).

Data Availability Statement

Data are unavailable due to privacy or ethical restrictions.

Conflicts of Interest

The authors declare no conflict of interest.

References

  1. Bi, C.; Hu, Z.; Tang, D.; Tao, S.; Zhang, J.; Tang, S.; Huang, H.; Tang, Y.; Yuan, Y.; Xu, Y.; et al. Research progress of coal measure gas and some important scientific problems. Geol. China 2021, 48, 402–423. [Google Scholar]
  2. Cao, D.; Yao, Z.; Li, J. Evaluation Status and Development Trend of Unconventional Gas in Coal Measure. Coal Sci. Technol. 2014, 42, 89–92. [Google Scholar]
  3. Yi, T.; Gao, W. Reservoir formation characteristics as well as co-exploration and co-mining orientation of Upper Permian coal-bearing gas in Liupanshui Coalfield. J. China Coal Soc. 2018, 43, 1553–1564. [Google Scholar]
  4. Gao, W.; Yi, T.; Yan, Z.; Jin, J. Reservoir forming conditions and exploration direction of coal measure gas in Guizhou Province. Nat. Gas Geosci. 2022, 33, 799–806. [Google Scholar]
  5. Zhang, Z.; Qin, Y.; You, Z.; Yang, Z. Distribution characteristics of in situ stress field and vertical development unit division of CBM in Western Guizhou, China. Nat. Resour. Res. 2021, 30, 3659–3671. [Google Scholar] [CrossRef]
  6. Zhang, Z.; Qin, Y.; Yang, Z.; Li, G.; You, Z. Primary Controlling Factors of Coalbed Methane Well Productivity and High Productive Well Patterns in Eastern Yunnan and Western Guizhou, China. Nat. Resour. Res. 2023, 32, 2711–2726. [Google Scholar] [CrossRef]
  7. Qin, Y.; Wu, J.; Li, G.; Wang, Y.; Shen, J.; Zhang, B.; Shen, Y. Patterns and pilot project demonstration of coal measures gas production. J. China Coal Soc. 2020, 45, 2513–2522. [Google Scholar]
  8. Sang, S.; Zhou, X.; Liu, S.; Huang, H.; Wang, R.; Han, S.; Wang, J.; Pan, D.; Zhang, Z. A review of mechanical stratigraphy methodology and its application in high-efficient exploration and development of coal measure gas. Acta Geol. Sin. 2022, 53, 394–402. [Google Scholar]
  9. Che, J.; Wang, H.; Zhang, Y.; Wang, Y.; Liu, Y.; Du, M. Field test and numerical simulation of the section mill in U-shaped wells of coalbed methane. J. Nat. Gas Sci. Eng. 2020, 84, 103681. [Google Scholar] [CrossRef]
  10. Fan, Y.; Shu, L.; Huo, Z.; Hao, J.; Yang, L. Numerical simulation research on hydraulic fracturing promoting coalbed methane extraction. Shock Vib. 2021, 2021, 3269592. [Google Scholar]
  11. Perera, M.S.A.; Ranjith, P.G.; Ranathunga, A.S.; Koay, A.Y.J.; Zhao, J.; Choi, S.K. Optimization of enhanced coal-bed methane recovery using numerical simulation. J. Geophys. Eng. 2015, 12, 90–107. [Google Scholar] [CrossRef]
  12. Fang, H.; Sang, S.; Liu, S. Numerical simulation of enhancing coalbed methane recovery by injecting CO2 with heat injection. Petrol. Sci. 2019, 16, 32–43. [Google Scholar] [CrossRef]
  13. Yang, R.; Ma, T.; Xu, H.; Liu, W.; Hu, Y.; Sang, S. A model of fully coupled two-phase flow and coal deformation under dynamic diffusion for coalbed methane extraction. J. Nat. Gas Sci. Eng. 2019, 72, 103010. [Google Scholar] [CrossRef]
  14. Ma, T.; Rutqvist, J.; Oldenburg, C.M.; Liu, W.; Chen, J. Fully coupled two-phase flow and poromechanics modeling of coalbed methane recovery: Impact of geomechanics on production rate. J. Nat. Gas Sci. Eng. 2017, 45, 474–486. [Google Scholar] [CrossRef]
  15. Meng, S.; Li, Y.; Wang, L.; Wang, K.; Pan, Z. A mathematical model for gas and water production from overlapping fractured coalbed methane and tight gas reservoirs. J. Pet. Sci. Eng. 2018, 171, 959–973. [Google Scholar] [CrossRef]
  16. Feng, Q.; Zhang, X.; Zhang, J.; Chen, D. Numerical simulation of commingling production for coalbed methane and adjoining sandstone gas reservoirs. J. China Coal Soc. 2014, 39, 169–173. [Google Scholar]
  17. Li, Y.; Meng, S.; Wu, P.; Wang, Z.S.; Yu, Z.L. Numerical simulation of coal measure gases coproduction. J. China Coal Soc. 2018, 43, 1728–1737. [Google Scholar]
  18. Xie, Y. Theory and Method for Compatibility Evaluation of Joint Deep Coalbed Methane and Tight Sandstone Gas Production: In a Case of Member C2b~P1t in Linxing Block. Ph.D. Thesis, China University of Mining and Technology, Xuhzou, China, 2022. [Google Scholar]
  19. Li, L.; Kang, T.; Zhang, X.; Guo, J. Percolation Model and Numerical Simulation of Coal-based Gas in Coal-Sandstone Composite Reservoir. Min. Res. Dev. 2019, 39, 43–47. [Google Scholar]
  20. Zhang, H.; Liu, J.; Elsworth, D. How sorption-induced matrix deformation affects gas flow in coal seams: A new FE model. Int. J. Rock Mech. Min. Sci. 2008, 45, 1226–1236. [Google Scholar] [CrossRef]
  21. Xia, T.; Zhou, F.; Gao, F.; Kang, J.; Liu, J.; Wang, J. Simulation of coal self-heating processes in underground methane-rich coal seams. Int. J. Coal Geol. 2015, 141–142, 1–12. [Google Scholar] [CrossRef]
  22. Liu, Q.; Cheng, Y.; Zhou, H.; Guo, P.; An, F.; Chen, H. A mathematical model of coupled gas flow and coal deformation with gas diffusion and Klingenberg effects. Rock Mech. Rock Eng. 2015, 48, 1163–1180. [Google Scholar] [CrossRef]
  23. Wang, G.; Yang, X.; Chu, X.; Shen, J.; Jiang, C. Microscale numerical simulation of Non-Darcy flow of coalbed methane. Arab. J. Sci. Eng. 2018, 43, 2547–2561. [Google Scholar] [CrossRef]
  24. Kong, X.; Wang, E.; Liu, Q.; Li, Z.; Li, D.; Cao, Z.; Niu, Y. Dynamic permeability and porosity evolution of coal seam rich in CBM based on the flow-solid coupling theory. J. Nat. Gas Sci. Eng. 2017, 40, 61–71. [Google Scholar] [CrossRef]
  25. Fang, H.; Li, A.; Sang, S.; Gu, C.; Yang, J.; Li, L.; Liu, H.; Xu, H.; Huang, Y. Numerical analysis of permeability rebound and recovery evolution with THM multi-physical field models during CBM extraction in crushed soft coal with low permeability and its indicative significance to CO2 geological sequestration. Energy 2023, 262, 125395. [Google Scholar] [CrossRef]
  26. Rutqvist, J.; Wu, Y.-S.; Tsang, C.-F.; Bodvarsson, G. A modeling approach for analysis of coupled multiphase fluid flow, heat transfer, and deformation in fractured porous rock. Int. J. Rock Mech. Min. Sci. 2002, 39, 429–442. [Google Scholar] [CrossRef]
  27. Li, S.; Fan, C.; Han, J.; Luo, M.; Yang, Z.; Bi, H. A fully coupled thermal-hydraulic-mechanical model with two-phase flow for coalbed methane extraction. J. Nat. Gas Sci. Eng. 2016, 33, 324–336. [Google Scholar] [CrossRef]
  28. Zhu, W.; Wei, C.; Liu, J.; Qu, H.; Elsworth, D. A model of coal–gas interaction under variable temperatures. Int. J. Coal Geol. 2011, 86, 213–221. [Google Scholar] [CrossRef]
  29. An, F.-H.; Cheng, Y.-P.; Wang, L.; Li, W. A numerical model for outburst including the effect of adsorbed gas on coal deformation and mechanical properties. Comput. Geotech. 2013, 54, 222–231. [Google Scholar] [CrossRef]
  30. Xu, H.; Tang, D.; Tang, S.; Zhao, J.; Meng, Y.; Tao, S. A dynamic prediction model for gas–water effective permeability based on coalbed methane production data. Int. J. Coal Geol. 2014, 121, 44–52. [Google Scholar] [CrossRef]
  31. Naik, S.; You, Z.; Bedrikovetsky, P. Rate enhancement in unconventional gas reservoirs by wettability alteration. J. Nat. Gas Sci. Eng. 2015, 26, 1573–1584. [Google Scholar] [CrossRef]
  32. Li, L. Research on Migration Mechanism and Application of Coal Measures Gas Considering Interlayer Crossflow and Dynamic Slipstream. Ph.D. Thesis, Taiyuan University of Technology, Taiyuan, China, 2019. [Google Scholar]
  33. Liu, X.; Sang, S.; Zhou, X.; Wang, Z. Coupled adsorption-hydro-thermo-mechanical-chemical modeling for CO2 sequestration and well production during CO2-ECBM. Energy 2023, 262, 125306. [Google Scholar] [CrossRef]
  34. Pan, Z.; Connell, L.D. A theoretical model for gas adsorption-induced coal swelling. Int. J. Coal Geol. 2007, 69, 243–252. [Google Scholar] [CrossRef]
  35. Wu, Y.; Liu, J.; Elsworth, D.; Miao, X.; Mao, X. Development of anisotropic permeability during coalbed methane production. J. Nat. Gas Sci. Eng. 2010, 2, 197–210. [Google Scholar] [CrossRef]
  36. Sang, S.; Zheng, S.; Yi, T.; Zhao, F.; Han, S.; Jia, J.; Zhou, X. Coal measures superimposed gas reservoir and its exploration and development technology modes. Coal Geol. Explor. 2022, 50, 13–21. [Google Scholar]
  37. Gao, W.; Han, Z.; Jin, J.; Bai, L.; Zhou, P. Occurrence characteristics and assessment of favorable a-reas of coalbed methane exploration in Liupanshui coalfield. Coal Geol. Explor. 2018, 46, 81–89. [Google Scholar]
  38. Jin, J.; Yang, Z.; Qin, Y.; Cui, Y.; Wang, G.; Yi, T.; Wu, C.; Gao, W.; Chen, J.; Li, G.; et al. Progress, potential and prospects of CBM development in Guizhou Province. J. China Coal Soc. 2022, 47, 4113–4126. [Google Scholar]
  39. Zhang, Z.; Qin, Y.; Yi, T.; You, Z.; Yang, Z. Pore structure characteristics of coal and their geological controlling factors in Eastern Yunnan and Western Guizhou, China. ACS Omega 2020, 5, 19565–19578. [Google Scholar] [CrossRef]
  40. Song, X.; Jiang, M.; Peng, Q.; Xiong, P. Thermal property parameters and influencing factor analysis of main rock strata in Guizhou province. Acta Geol. Sin. 2019, 93, 2092–2103. [Google Scholar]
Figure 1. Location and gas content of the study area: (a) Guizhou Province in China, (b) the Dahebian block, and (c) gas content of the W1 well.
Processes 11 03424 g001
Figure 2. Gas content of each coal seam.
Processes 11 03424 g002
Figure 3. Geological model of coal measure gas drainage: (a) geometric model, (b) mesh partition, and (c) wellbore and observation points.
Processes 11 03424 g003
Figure 4. History fitting results of gas production.
Processes 11 03424 g004
Figure 5. Cumulative gas production (a) under different drainage methods, (b) from each layer under multi-layer drainage, and (c) under different drainage methods (coal).
Processes 11 03424 g005
Figure 6. Direction of reservoir pressure conduction in the 30th day under different drainage modes: (a) single-layer drainage and (b) multi-layer drainage.
Processes 11 03424 g006
Figure 7. Dynamic distribution of reservoir pressure under different drainage methods: (a) single-layer drainage and (b) multi-layer drainage.
Processes 11 03424 g007
Figure 8. Change in matrix gas content under different drainage methods: (a) observation points (A, B, C) and (b) observation points (A′, B′, C′).
Processes 11 03424 g008
Figure 9. Permeability ratio changes under different drainage methods: (a) observation points (A, B, C) and (b) observation points (A′, B′, C′).
Processes 11 03424 g009
Table 1. Fracture simulation results.
ParameterValueParameterValue
Fracture half-length (m)157.9/165.9Support crack half-length (m)147.3/160.4
Total crack height (m)24.2/38.8Total height of support cracks (m)22.6/35.1
Vertical depth at the top of the crack (m)903.2/889.9Vertical depth of supporting crack top (m)904.6/893.4
The bottom of the crack is deep (m)927.4/928.7The bottom of the support crack is deep (m)927.2/928.5
Table 2. Key parameters for numerical simulation.
VariableParameterValueUnit
ϕm10Initial porosity for coal matrix4.50%
ϕf10Initial porosity for coal fracture2.30%
ϕm20Initial porosity for shale matrix3.20%
ϕf20Initial porosity for shale fracture1.12%
k10Initial reservoir permeability (Coal)0.55010−3 μm2
k20Initial reservoir permeability (Shale)0.19710−3 μm2
K1Bulk modulus (Coal)3.0GPa
K2Bulk modulus (Shale)6.550GPa
υ1Poisson’s ratio of coal0.350-
υ2Poisson’s ratio of shale0.280-
KsSkeleton bulk modulus7.340GPa
ρs1Density of coal skeleton1470kg m−3
ρs2Density of shale2660kg m−3
μwGas dynamic viscosity1 × 10−3Pa·s
μgWater dynamic viscosity1.84 × 10−5Pa·s
PL1Langmuir pressure constant (Coal)2.07MPa
VL1Langmuir volume constant (Coal)0.0256m3·kg−1
PL2Langmuir pressure constant (Shale)1.01MPa
VL2Langmuir volume constant (Shale)0.02m3·kg−1
b1Klinkenberg factor0.76MPa
RGas molar constant8.314J·mol−1·K−1
PsStandard atmospheric pressure101kPa
TsStandard temperature273.5K
Table 3. Schemes for numerical simulation.
SchemesDrainage Pressure/MPaSimulation Duration/d
Production history fittingActual bottom hole flowing pressure500
Single-layer drainage (coal seam perforation)0.162000
Multi-layer drainage (full-stage perforation)0.162000
Disclaimer/Publisher’s Note: The statements, opinions and data contained in all publications are solely those of the individual author(s) and contributor(s) and not of MDPI and/or the editor(s). MDPI and/or the editor(s) disclaim responsibility for any injury to people or property resulting from any ideas, methods, instructions or products referred to in the content.

