Article

Prediction of Clean Coal Ash Content in Coal Flotation through a Convergent Model Unifying Deep Learning and Likelihood Function, Incorporating Froth Velocity and Reagent Dosage Parameters

School of Materials Science and Engineering, Anhui University of Science and Technology, Huainan 232001, China
*
Author to whom correspondence should be addressed.
Processes 2023, 11(12), 3425; https://doi.org/10.3390/pr11123425
Submission received: 15 October 2023 / Revised: 7 December 2023 / Accepted: 11 December 2023 / Published: 13 December 2023

Abstract

:
This study successfully achieved high-precision detection of the clean coal ash content in the coal froth flotation domain by integrating deep learning with the likelihood function. Methodologically, a novel data processing and prediction framework was established by combining a deep learning Keras neural network with the likelihood function from probability statistics. The SIFT algorithm was utilized to extract key feature points and descriptors from the images, and keypoint matching and mean-shift clustering algorithms were employed to accurately obtain information on foam motion trajectories and velocities. For parameter optimization, the maximum likelihood estimation was applied to find the optimal parameter estimates of the likelihood function, ensuring enhanced model accuracy. By incorporating the optimized likelihood function parameters into the Keras deep neural network, an efficient prediction model was constructed for the dosage of flotation reagents, froth velocity, and clean coal ash content. The model’s evaluation involved six performance metrics. The experimental results were highly significant, with R2 at 0.99997%, RMSE at 0.04458%, MAE at 0.00170%, MAPE at 0.02329%, RRSE at 0.00994%, and MAAPE at 0.00067%.

1. Introduction

Froth flotation finds extensive application in coal beneficiation, aiming to augment coal quality and its adaptability [1,2,3]. Within this process, a liquid medium acts as a carrier for solid particles and gas bubbles. The hydrodynamic characteristics encompassing fluid flow patterns, velocities, and dynamic features play a pivotal role in governing the distribution and trajectories of solid particles and bubbles. Efficient fluid dynamics are crucial in ensuring homogeneous dispersion within the flotation chamber, preventing agglomeration and obstructions, thus favoring the effective separation of target minerals from contaminants [4]. The fundamental procedure involves the injection of bubbles into the coal slurry, facilitating the attachment of coal particles onto bubble surfaces, subsequently buoying them to the upper layer of the flotation chamber, thereby forming froth concentrate [5,6]. The surface properties of bubbles exert significant influence on their affinity towards mineral particles, thereby impacting separation efficiency. The trajectories and velocities of solid particles within the flotation chamber dictate their frequency and the duration of interaction with bubbles [6]. Optimized particle movement aids in elevating collision probabilities with bubbles, consequently enhancing flotation efficiency. Additionally, interparticle interactions such as agglomeration, settling, and convective movements also influence their behavior during the flotation process [7]. A benchmark for successful froth flotation lies in the ash content within the concentrate, a critical indicator of coal quality [8,9]. Nonetheless, traditional ash content measurement methodologies entail multistep procedures and protracted durations, lacking real-time adaptability for process control. Operators, relying on visual cues from foam appearances on flotation chamber surfaces, encounter precision limitations. Consequently, there exists an imperative need to devise rapid, precise, and practical techniques for ash content quantification to support real-time process monitoring in flotation. Researchers have explored rapid ash content measurement instruments, including X-ray fluorescence (XRF) analyzers [10] and γ-ray transmission [11], among others. However, the accuracy of these radiation-based instruments is susceptible to the intricate heterogeneity inherent in coal samples. Regional disparities in coal composition, mineralogy, and impurity profiles contribute to potential measurement inaccuracies. Particularly in heterogeneous coal blends, higher resolution and intricate calibration procedures are imperative to ensure measurement accuracy. Employing XRF and γ-ray technologies in ash content measurement instruments necessitates the utilization of radioactive sources, entailing radiation risks. Despite their relative expediency, these measurement instruments incur high costs and pose hazards to both operators and the environment, thereby exhibiting limited potential for widespread adoption within the flotation domain.
Zhiping Wen et al. have proposed a methodology employing visual data from coal froth flotation images to predict flotation ash content [12]. Machine learning techniques have seen widespread adoption in various domains such as object recognition [13], object detection [14], and medical image analysis. For instance, Hassan Nateghi utilized machine learning methodologies to determine the solubility of imatinib mesylate, an anticancer pharmaceutical, in a supercritical carbon monoxide environment [15]. Remarkable strides have been made in industrial sectors as well. Runda Jia integrated machine learning into mineral flotation, specifically focusing on the recognition of flotation froth images, an area of extensive research [16]. Bei Sun, Zhiping Wen, and their colleagues have employed flotation image characteristics to predict critical variables including flotation recovery and ash content [12,17]. The accurate prediction of flotation outcomes holds paramount importance in controlling and optimizing production processes within coal production. By leveraging machine learning for analyzing foam image features, it becomes possible to forecast the ash content in flotation concentrates, thereby fostering increased recovery rates of clean coal and reducing material wastage. Typically, analyses involve features such as bubble size [18], bubble morphology [19], and chromatic attributes [20], as well as texture, among others [21]. Diverse intelligent algorithms are utilized to establish models that delineate the correlation between foam characteristics and metallurgical parameters, facilitating the creation of predictive models [22]. However, the risk of critical feature information loss exists, compounded by biases in feature selection that may lead the system to overlook pivotal information crucial for predicting the requisite parameters. Machine learning systems frequently rely on prior knowledge and experiential insights during the process of feature extraction and model establishment. Inadequacies or biases within prior knowledge may consequently impose limitations and inaccuracies within the resultant model. Consequently, the untapped potential of machine learning in flotation monitoring persists as an area ripe for further exploration and refinement.
In recent times, Zhiping Wen and M.R. Hosseini, along with their peers, have embraced the application of deep learning and neural network methodologies to address predicaments surrounding process performance and prognostication [23,24]. M.R. Hosseini et al. engaged neural networks to elucidate and model the intricate relationship between procedural parameters, surface bubble dimensions, and operational efficacy during the batch flotation of copper sulfide ores [23]. Concurrently, V. K. Kalyani et al. harnessed artificial neural networks to scrutinize laboratory-scale froth flotation operations, undertaking estimations of optimal model parameters to compute diverse process parameters across assorted experimental conditions inherent to the coal flotation processes [25]. Similarly, Mengcheng Tang et al. delved into the anticipation of flotation concentrate ash content by leveraging foam image processing and BP neural network modeling [26]. Moreover, Gholamhossein Sodeifian et al. employed a multifaceted approach involving response surface methodology (RSM), genetic algorithms, and artificial neural network (ANN) models to elucidate and predict extraction rates, solubility, and concomitant parameters [27]. Neural networks inherently necessitate voluminous datasets for proficient training to yield commendable performance. In the realm of mineral processing, however, procuring high-fidelity data could prove challenging due to potential noise, incompleteness, or inaccuracies within the datasets. Despite inherent constraints such as data volume dependencies, interpretational constraints, and susceptibility to parameter sensitivity within foam flotation processes, neural networks persist in offering latent value in predictive analytics and optimization strategies, necessitating a judicious appraisal considering both their merits and constraints for pragmatic deployment. Gonzalo Montes-Atenas et al. adeptly prognosticated bubble size and velocity in water and froth flotation slurries through the adept application of deep neural networks (DNNs) entwined with computational fluid dynamics (CFD) [28]. Likewise, Zhiping Wen et al. envisaged coal flotation concentrate ash content employing a convolutional neural network (CNN) rooted in deep learning principles [24]. Additionally, Hu Zhang et al. introduced the Feature Reconstruction–Regression Network (FRRN), a resource-efficient deep neural network tailored for monitoring foam flotation performance [29]. Despite the relative prowess of deep learning in precise flotation performance prognostication, its efficacy hinges upon hyperparameter calibration and demands sizable annotated datasets for robust training, mandating protracted training processes. Furthermore, its implementation necessitates intricate computational resources and specialized expertise in deep learning, posing techno-economic hurdles for ventures constrained by resources and financial limitations. Additionally, extant features exhibit relative limitations, inadequately encompassing the multifaceted interplay between foam image attributes and coal concentrate ash content. Hence, forthcoming research endeavors should delve deeper into exploring multidimensional and intricate image features for enhanced accuracy in flotation outcome prognostication.
The likelihood function, in statistical parlance, elucidates the intricate relationship between parameter probability distribution and the observed dataset, serving as a fundamental tool in statistical modeling [30]. It quantifies the probability of observing specific data given a certain set of parameters. Within statistical models, the estimation of various unknown parameters necessitates rigorous attention [31]. Fundamentally, the likelihood function denotes the plausibility of data occurrences under varied parameter scenarios. Maximum likelihood estimation (MLE) represents an approach aimed at estimating model parameters by optimizing the likelihood function, thus seeking parameter values that optimize the probability of observed data occurrences within the selected statistical model [32]. Essentially, MLE fine-tunes parameter values to optimize the probability of observed data occurrences, resulting in the computed maximum likelihood estimate. In industrial contexts, the imperative nature of interpreting model outputs and assessing credibility necessitates the application of maximum likelihood estimation to determine parameter values optimizing the probability of observed data occurrences within parameterized models. This facilitates a nuanced comprehension of the alignment between features and observed data characteristics [33]. In our approach, we endeavor to amalgamate the principles of maximum likelihood estimation with the advancements in deep learning. Specifically, leveraging deep neural networks to autonomously extract feature representations from foam images eliminates the need for manual feature engineering. The optimal parameters derived from this process are integrated as neural network weights, effectively harnessing the feature learning prowess inherent in deep neural networks. This amalgamation aims to exploit the strengths of deep learning’s feature learning capabilities alongside statistical estimation techniques, resulting in a comprehensive encapsulation of intricate foam image attributes, thereby significantly enhancing predictive performance concerning coal ash content. The crux of this methodology lies in employing maximum likelihood estimation to infer parameters associated with features, facilitating a deeper understanding of the relationship between features and coal ash content values. This fusion of likelihood function principles with deep learning stands poised to elevate predictive performance while concurrently reinforcing the interpretability and credibility of model outcomes.
This investigation aims to amalgamate deep learning methodologies with the principles of likelihood functions to formulate a predictive model for coal’s refined ash content. The model utilizes parameters such as bubble velocity and reagent dosages, acquired from coal froth flotation processes. The primary objective is to optimize the stability and efficiency of coal flotation techniques, ultimately enhancing the effective utilization of coal resources. This study aspires to steer the coal industry towards a trajectory characterized by cleaner, more efficient, and sustainable practices, thereby making significant contributions to global endeavors for sustainable energy development.

2. Materials and Experiments

2.1. Materials

This research employed froth flotation experiments using coal samples with particle sizes smaller than 0.5 mm, sourced from the Panji Coal Preparation Plant in Huainan, Anhui, China. The imaging equipment chosen for this investigation was the HIKROBOT MV-CS200-10GC (HIKROBOT, Hangzhou, China) color industrial camera, strategically positioned on top of the flotation machine, at an approximate distance of 30 cm from the foam surface. Additionally, a 240 W LED light source was utilized for effective illumination. To ensure experimental stability, a shading hood was employed to cover the imaging area. The computational aspect of this study involved a high-performance workstation equipped with an Intel i9-13900K CPU (Intel, Santa Clara, CA, USA) and 128 GB of RAM, alongside a dust removal system for meticulous cleanliness. The experiments were conducted on a 1.5 L mechanical agitated flotation machine situated in the Flotation Laboratory of the School of Materials Science and Engineering at Anhui University of Science and Technology. The operating parameters of the flotation machine are shown in Table 1. The operations strictly adhered to the guidelines specified in the “GB/T 30046.1–2013 Coal Flotation Test” standard [34]. The comprehensive schematic diagram depicted in Figure 1 outlines the entire process, beginning from foam image acquisition, to data processing, to the conventional methodology of ash content measurement via foam flotation comparison techniques. Each flotation batch consisted of 150 g of coal and 1 L of tap water.
The sequential procedure unfolds as follows: (1) Precision weighing of 150 g of coal, introduction into the flotation apparatus, and subsequent initiation of slurry agitation. (2) After a 2 min interval, the addition of the collector agent below the surface of the coal slurry. (3) Following an additional minute, the introduction of the frother beneath the coal slurry surface. (4) Stirring for a duration of 10 s, succeeded by the opening of the air valve for a flotation duration of 60 s to gather the concentrate. (5) Subsequent filtration of all concentrates acquired during flotation, followed by an 8 h drying period in a 75 °C oven, culminating in the determination of ash content using the combustion weighing technique.

2.2. Flotation Reagent
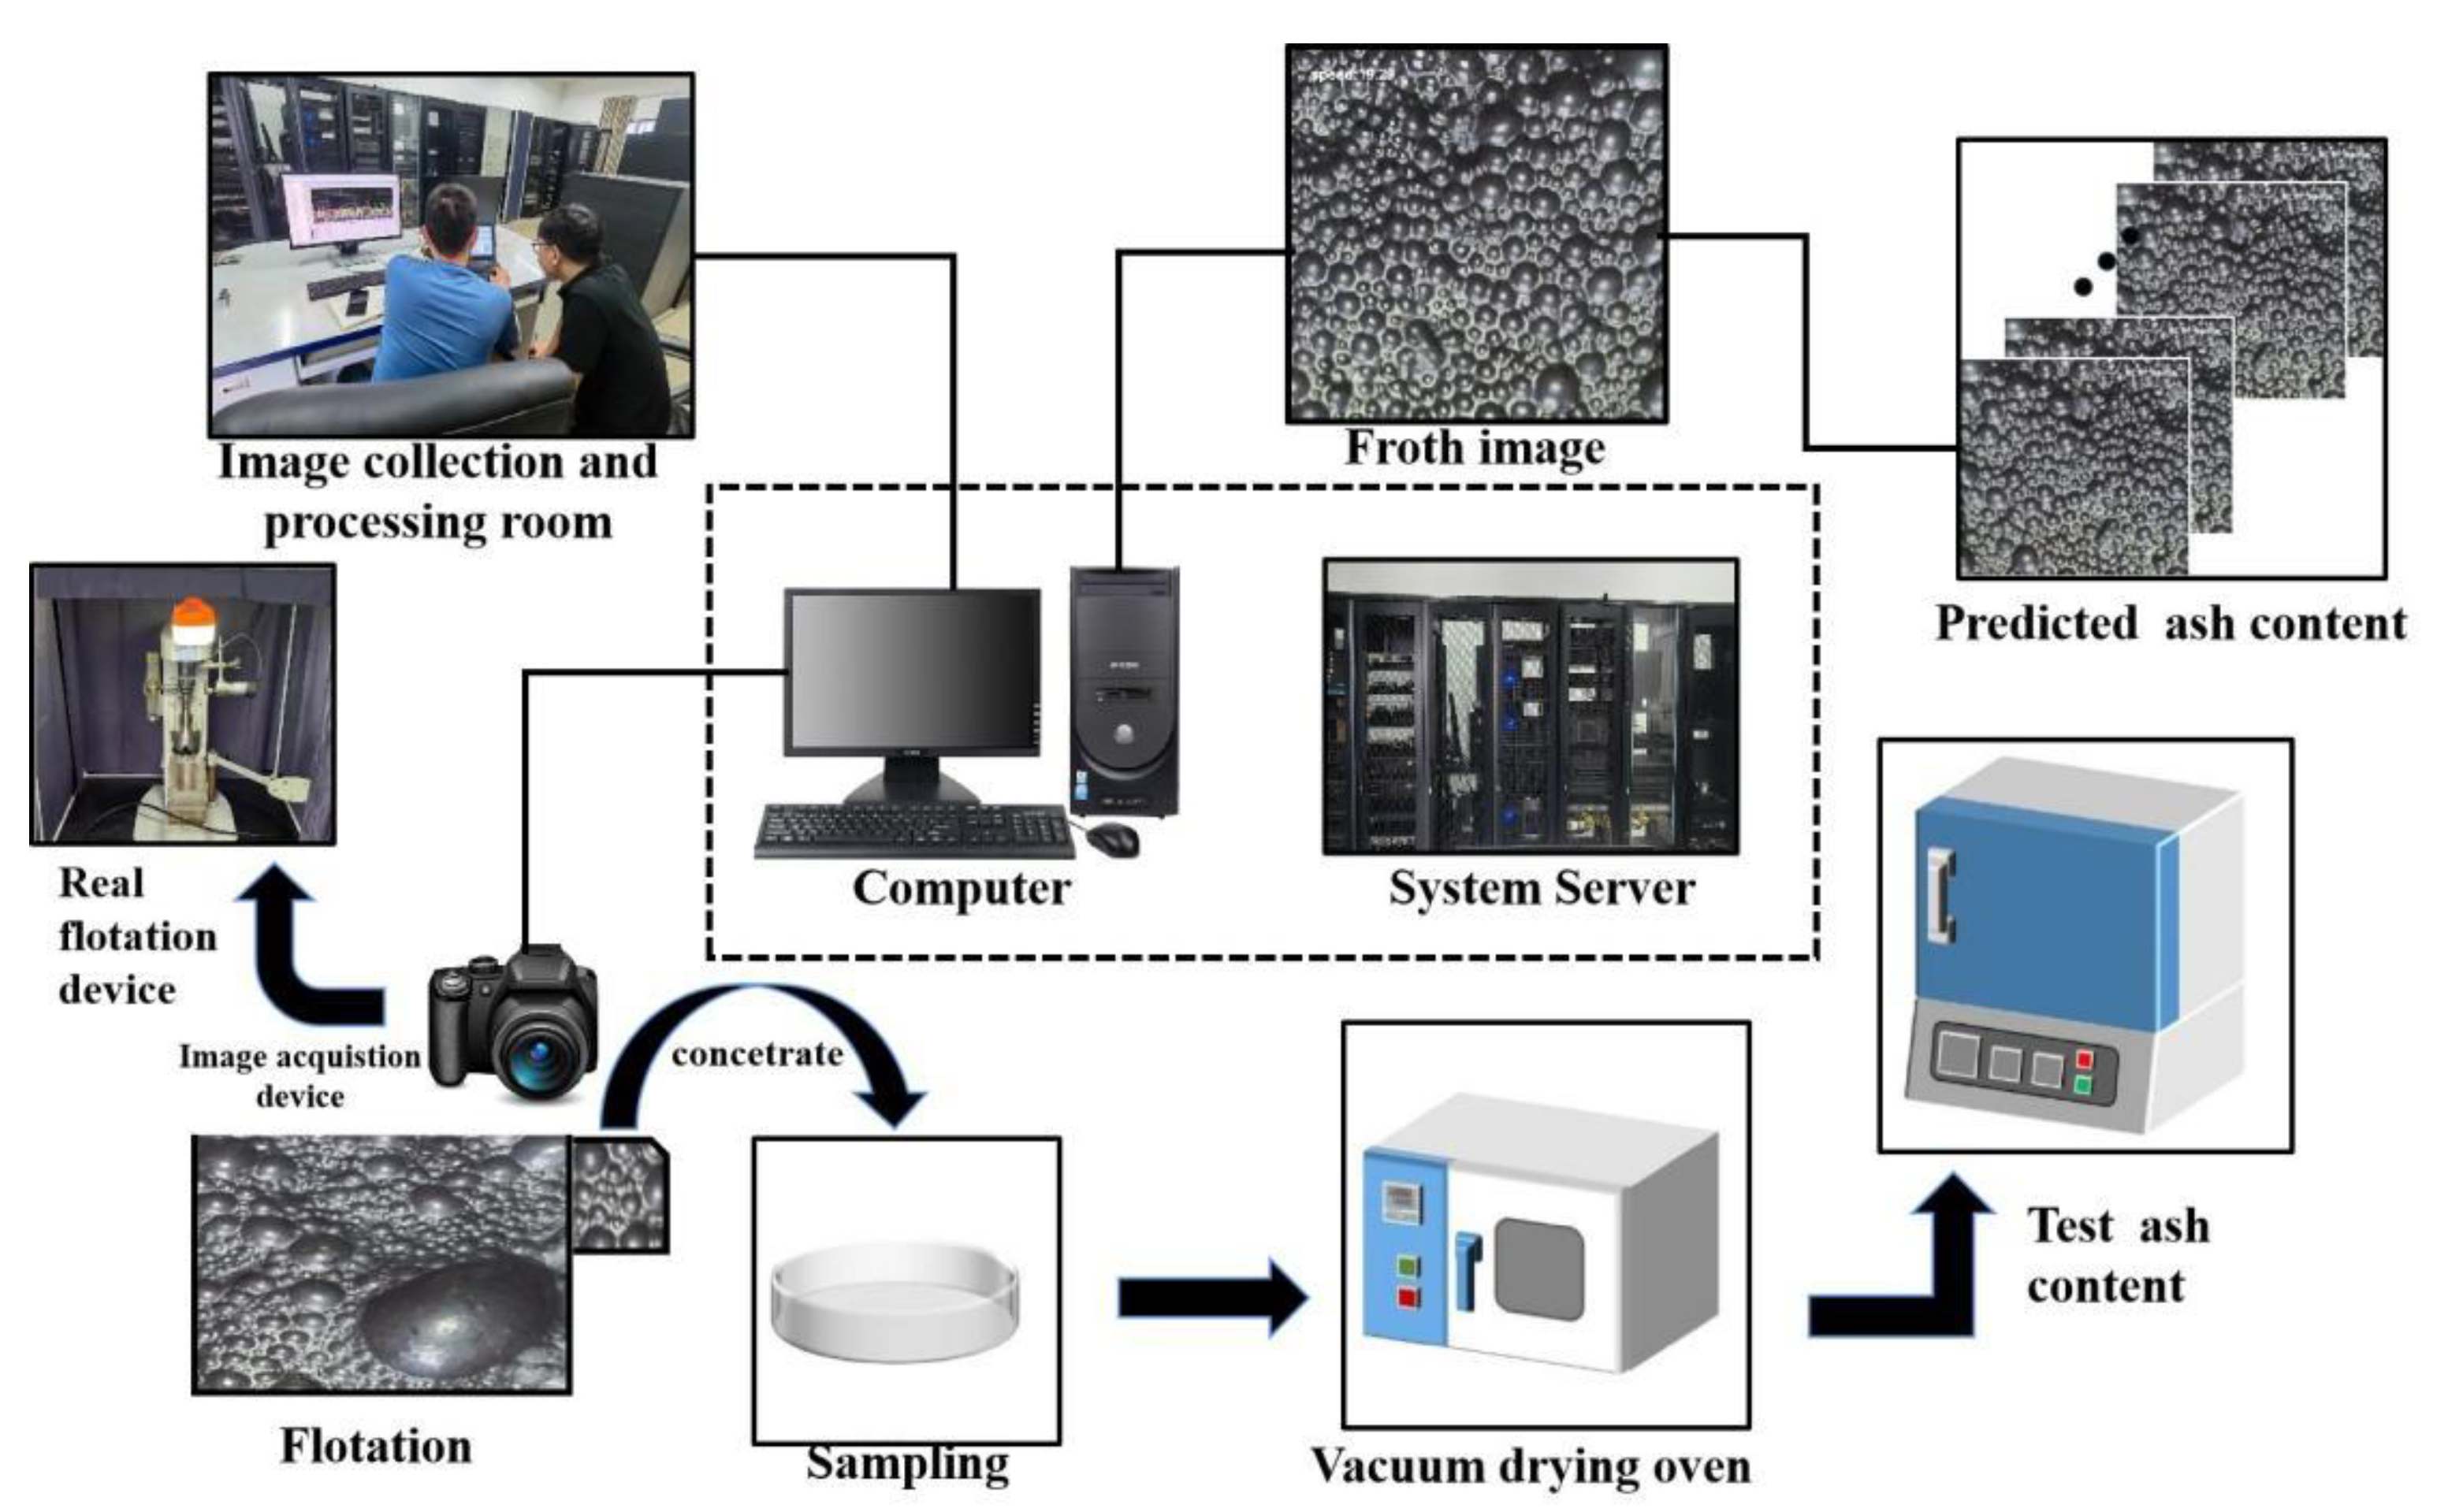
In this experiment, the collector used was n-dodecane, which was of analytical purity with a density ranging from 0.748 g/cm3 to 0.751 g/cm3. The foaming agent employed was methyl isobutyl carbinol (MIBC), also of analytical purity, with a density of 0.807 g/cm3. All reagents utilized in this study exhibited a purity level exceeding 99%. The specific dosage information on the amount of experimental reagents added and the initial bubble size magnitude is shown in Table 2.

2.3. Data Gathering

During our flotation experimentation, we meticulously designed and executed 25 distinct sets of process parameters, each corresponding to a unique video segment. Each video segment, spanning approximately 1 min, yielded a corpus of 7500 images. These images, correlating with specific ash content values, boast a resolution of 2048 × 2048 pixels, thus enabling meticulous capture of intricate foam details and characteristics. Concerning dataset segmentation, the entire array of images within the foam image dataset was allocated for training purposes. Concurrently, from this dataset, we randomly extracted five sets of 1500 images each to constitute our validation set [29]. Table 3 comprehensively outlines the partitioning specifics of the dataset. In selecting foam images, paramount emphasis was placed on encapsulating the diverse foam characteristics and ash content values under disparate process parameter configurations. Our meticulous curation ensured that the chosen images exhibited a spectrum of variations in terms of size, shape, and spatial positioning, effectively encapsulating the dynamic evolution of foam throughout the flotation process. The systematic partitioning and utilization of the entire dataset were purposefully geared towards training and validating the model’s comprehension of foam images across an expansive range of process parameter configurations. This strategy serves to facilitate the prediction of the interrelation between flotation efficiency and ash content values.

3. Methodology and Modeling

Through the preceding experiments, a comprehensive dataset was obtained, encompassing essential parameters such as froth velocity, reagent dosage, and their corresponding values of coal ash content. This dataset lays a robust groundwork for subsequent modeling and prediction endeavors. We intend to harness the potential of cutting-edge deep learning techniques to process and extract dynamic features from the bubble images. By incorporating the concept of the likelihood function, we aim to establish a sophisticated probabilistic model that comprehensively captures the intricate relationships among reagent dosage, froth velocity, and coal ash content. This approach will offer a more holistic and accurate representation of the complex interplay between these variables. Furthermore, we will seamlessly integrate the optimized parameters derived from the likelihood function into the Keras deep neural network, thereby elevating the accuracy of predicting the coal ash content value.

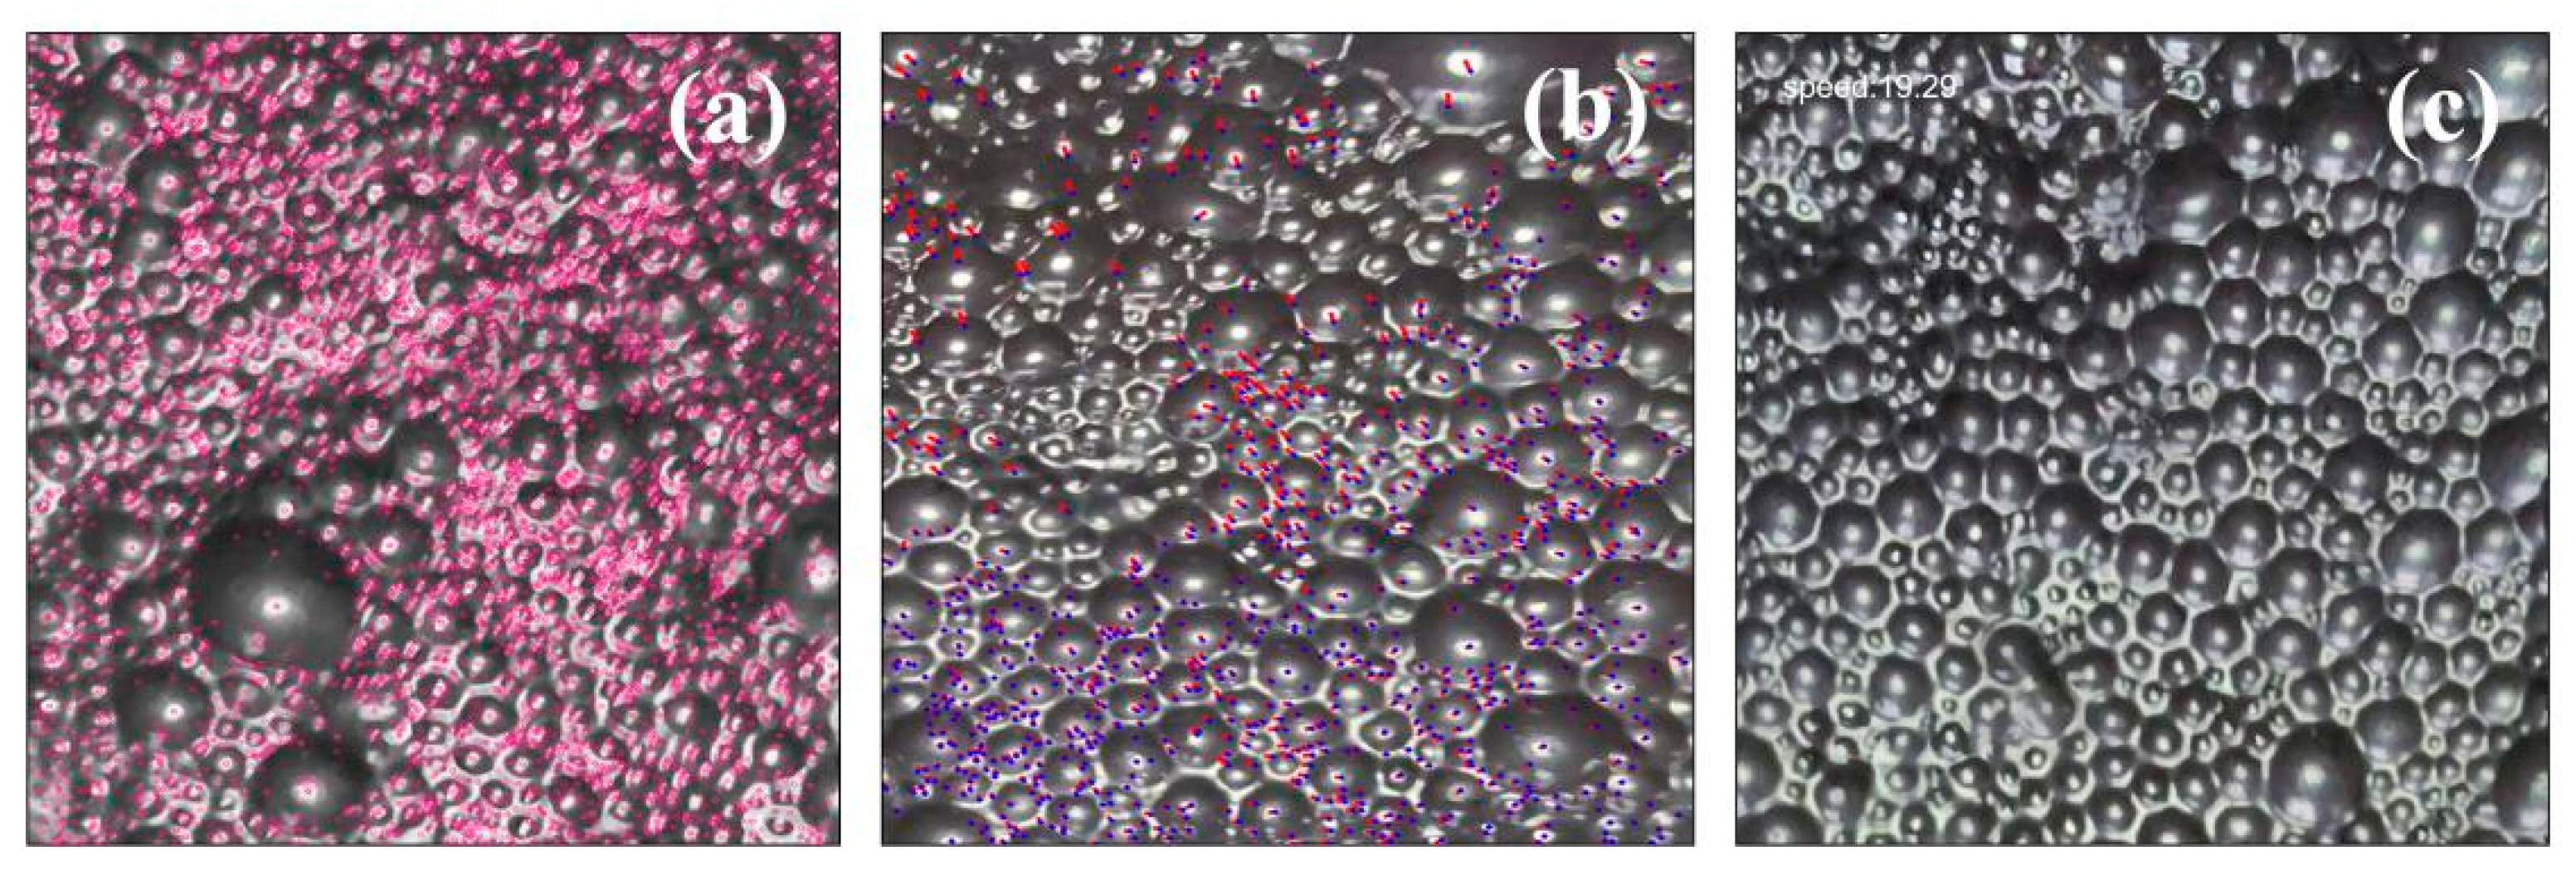
3.1. Modeling of Froth Velocity Feature Extraction

The traditional methodologies employed for foam image analysis typically concentrate solely on the static attributes of foam while disregarding its dynamic nature, particularly the pertinent froth velocity information. Froth velocity, often denoted as the foam’s fluidity, embodies the dynamic facet of foam behavior, providing critical insights into the flux of concentrate quality [35]. Notably, research conducted by P.N. Holtham accentuates froth velocity as the most crucial dynamic determinant in assessing flotation performance [36]. Investigations by A. Jahedsaravani et al. have substantiated the pivotal significance of froth velocity characteristics in the regulation and efficacy of foam flotation control [1]. Ming Lu et al., through the application of matching algorithms for extracting flotation foam velocity, validated its practicality and effectiveness in industrial production settings [9]. Additionally, M. Massinaei et al., focusing on the characteristics of froth velocity, formulated predictive control systems to anticipate process states and performance under varied operational conditions [20]. The velocity of bubbles plays a pivotal role in determining flotation efficiency, as it is intricately linked to bubble generation, flotation, and rupture processes [37]. Consequently, accurate measurement and analysis of froth velocity are of paramount importance in gaining deeper insights into the flotation process, predicting bubble behavior, and optimizing operational parameters. To perform a meticulous analysis of foam images, we utilized a fusion of sophisticated deep learning techniques and advanced computer vision methodologies. Specifically, the application of the Scale-Invariant Feature Transform (SIFT) algorithm facilitated the extraction of distinctive keypoints and feature descriptors from the images, as illustrated in Figure 2a. These keypoints represent salient local features within the images, delineating the image characteristics based on their precise spatial locations, scales, and orientations. Subsequently, leveraging keypoint matching techniques and the mean-shift clustering algorithm, we acquired the motion trajectories of foam across the image sequences (Figure 2b) along with corresponding velocity information (Figure 2c). Keypoint matching involves identifying analogous keypoints across different images, enabling precise tracking of foam positional variations across diverse image frames [38]. Meanwhile, the mean-shift clustering algorithm serves as a robust method for density estimation of data points and identification of cluster centroids, effectively capturing and comprehending patterns and velocity characteristics inherent in foam motion [39]. The employment of the SIFT algorithm enabled precise extraction of distinctive local features from foam images, facilitating accurate tracking and correlation of these salient points and thus ensuring meticulous monitoring and analysis of foam motion. Simultaneously, the utilization of the mean-shift clustering algorithm enhanced our ability to apprehend the motion patterns and velocity dynamics of foam, thereby enabling a more profound insight into the dynamic behaviors of foam during the flotation process. The SIFT algorithm is instrumental in identifying local feature points in the image, each characterized by a unique descriptor [40,41]. For the i -th frame of the image I i ( ϑ , ) , the SIFT algorithm computes the scale-space extrema of the keypoints K p i [ j ] . Subsequently, the image undergoes Gaussian pyramid construction [42], yielding images at varying scales.
L ( ϑ , , ζ ) = G ( ϑ , , ζ ) × I i ( ϑ , )
The scale-space extrema of the image at different levels of the Gaussian pyramid are calculated to detect potential keypoints.
D ( ϑ , , ζ ) = L ( ϑ , , ζ ) max { L ( ϑ 1 , , ζ ) , L ( ϑ 1 , , ζ ) , L ( ϑ 1 , , ζ ) , L ( ϑ 1 , , ζ ) , L ( ϑ 1 , , ζ ) , L ( ϑ 1 , , ζ ) }
The scale-space extrema points are employed as initial candidate keypoints, and the positions and scales of these keypoints are accurately ascertained through interpolation.
ϑ , , ζ = arg max ( D ( ϑ , , ζ ) )
( ϑ , , ζ ) = int e r p o l a t e ( D ( ϑ , , ζ ) )
In the context of the i -th frame image, each keypoint K p i [ j ] undergoes a search process to find the most suitable matching keypoint K p ( i + 1 ) [ j ] in the subsequent frame image I i + 1 ( ϑ , ) . The matching of keypoints is achieved by evaluating the Euclidean distance between their respective descriptors, which are distinctive representations of image features [43,44].
O i ϑ j = arg min ( d j d e s i + 1 )
For each identified keypoint K p i [ j ] and its corresponding matched keypoint K p ( i + 1 ) [ j ] , the motion vector is calculated to quantify the spatial displacement between them.
C j = ( ϑ ϑ , )
C j = ( ϑ ϑ , )
The motion vectors undergo normalization, a process that involves standardizing their magnitudes.
V = ( ϑ ϑ C j , C j )
In this context, L ( ϑ , , ζ ) represents the Gaussian convolution result of image I i ( ϑ , ) at scale ζ , where G ( ϑ , , ζ ) denotes the Gaussian kernel function. D ( ϑ , , ζ ) indicates the scale-space extrema of the image at scale ζ , with max ( ) signifying the maximum value. arg max ( ) refers to the position of the extrema, and int e r p o l a t e ( ) represents the precise determination of the keypoint’s position and scale through interpolation. d j represents the feature descriptor of keypoint K p i [ j ] , and d e s i + 1 represents the feature descriptors of all keypoints in the i + 1 frame image. ϑ , and ϑ , denote the coordinates of keypoints K p i [ j ] and its matched keypoint K p ( i + 1 ) [ j ] , respectively. V represents the normalized velocity vector.
Table 4 illustrates the outcomes achieved through the application of deep learning and computer vision methodologies for the identification and extraction of dynamic features pertaining to froth velocity in froth flotation.

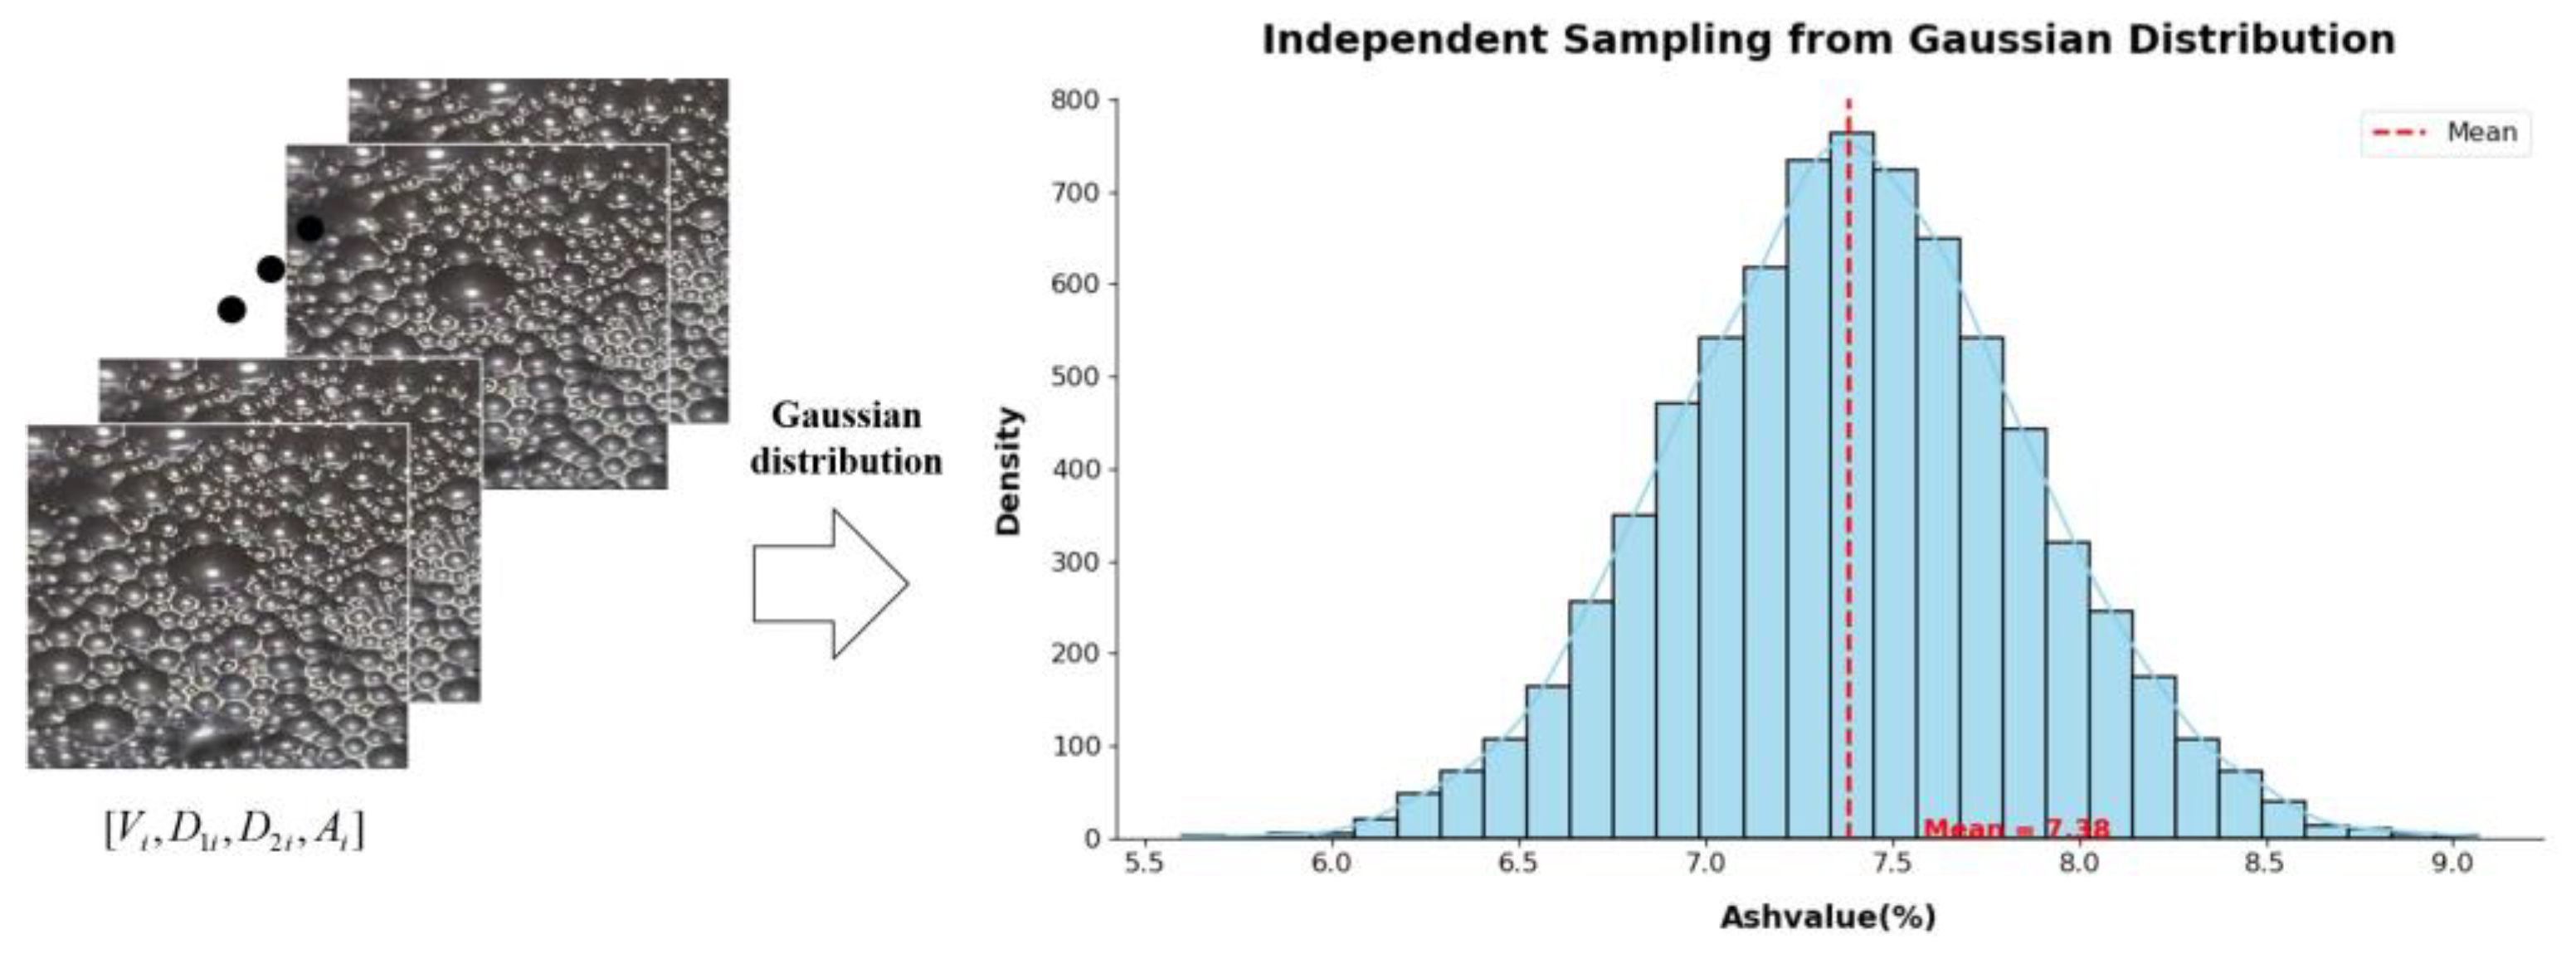
3.2. Likelihood Function Modeling of Froth Velocity and Chemical Additions

In this research, we take into consideration two distinct types of flotation reagent dosages, denoted as D 1 and D 2 , representing the collector and frother, respectively. Our primary objective is to predict the ash content A of the clean coal based on these reagent dosages and the froth velocity V . To achieve this, we propose a hybrid model that effectively captures the impact of different reagent dosages and froth velocity on the clean coal’s ash content. Additionally, we employ the maximum likelihood estimation method to accurately estimate the parameters of the model.
We possess a dataset consisting of 7500 observational samples, denoted as [ V i , D 1 i , D 2 i , A i ] with i = 1 , 2 , , 7500 , where V i represents the bubble velocity of the i -th sample, and D 1 i and D 2 i stand for the two types of reagent dosages for the i -th sample. Furthermore, A i signifies the ash content of the i -th clean coal sample. Our proposition postulates that both the bubble velocity V i and the two types of reagent dosages, D 1 i and D 2 i , exert a substantial influence on the ash content A i of clean coal. To effectively model the intricate interdependencies among these variables, we propose the utilization of a mixed-effects linear regression model:
A i = ψ 0 + ψ 1 V i + ψ 2 D 1 i + ψ 3 D 2 i + ε i
In the presented equation, ψ 0 , ψ 1 , ψ 2 , and ψ 3 denote the model’s coefficients, while ε i represents the residual term associated with the i -th sample, signifying the unexplained variability remaining after accounting for the model’s explanatory variables.
To estimate the model parameters, we employ the maximum likelihood estimation method. Each sample point [ V i , D 1 i , D 2 i , A i ] (as depicted in Figure 3) is independently obtained by sampling from a random variable that follows a Gaussian distribution. Given the model parameters ψ 0 , ψ 1 , ψ 2 , and ψ 3 , the likelihood function of observing the sample points can be expressed as follows:
L i ( ψ 0 , ψ 1 , ψ 2 , ψ 3 , σ 2 ) = 1 2 π σ 2 exp A i ψ 0 ψ 1 V i ψ 2 D 1 i ψ 3 D 2 i 2 2 σ 2
The joint likelihood function can be obtained as the product of the individual likelihood functions for all observed samples:
L ( ψ 0 , ψ 1 , ψ 2 , ψ 3 , σ 2 ) = i = 1 n 1 2 π σ 2 exp A i ψ 0 ψ 1 V i ψ 2 D 1 i ψ 3 D 2 i 2 2 σ 2
To simplify the computations, it is conventionally employed to take the natural logarithm of the likelihood function, resulting in the following:
log L ( ψ 0 , ψ 1 , ψ 2 , ψ 3 , σ 2 ) = i = 1 n 1 2 log ( 2 π σ 2 ) A i ψ 0 ψ 1 V i ψ 2 D 1 i ψ 3 D 2 i 2 2 σ 2
Our objective is to identify the parameter values that maximize the natural logarithm of the likelihood function, represented as follows:
ψ ^ 0 , ψ ^ 1 , ψ ^ 2 , ψ ^ 3 , σ ^ 2 = arg max ψ 0 , ψ 1 , ψ 2 , ψ 3 , σ 2 log L ( ψ 0 , ψ 1 , ψ 2 , ψ 3 , σ 2 )
The derivation obtained is as follows:
log L ψ 0 = i = 1 n A i ψ 0 ψ 1 V i ψ 2 D 1 i ψ 3 D 2 i σ 2 = 0
log L ψ 1 = i = 1 n A i ψ 0 ψ 1 V i ψ 2 D 1 i ψ 3 D 2 i V i σ 2 = 0
log L ψ 2 = i = 1 n A i ψ 0 ψ 1 V i ψ 2 D 1 i ψ 3 D 2 i D 1 i σ 2 = 0
log L ψ 3 = i = 1 n A i ψ 0 ψ 1 V i ψ 2 D 1 i ψ 3 D 2 i D 2 i σ 2 = 0
log L σ 2 = i = 1 n 1 2 σ 2 + ( A i ψ 0 ψ 1 V i ψ 2 D 1 i ψ 3 D 2 i ) 2 σ 2 = 0
By solving the above system of equations simultaneously, we can obtain the estimated values for the model parameters ψ ^ 0 , ψ ^ 1 , ψ ^ 2 , ψ ^ 3 , and σ ^ 2 .

3.3. Deep Neural Network Prediction Model with Multi-Feature Input and Hybrid Data Input Using Keras

Having obtained the optimal parameters for the likelihood function, as described earlier, we applied these parameters as the weights for the Keras deep neural network, as depicted in Figure 4. In this study, we developed an innovative deep neural network model with multiple feature inputs and a hybrid data input scheme, utilizing the Keras framework [45,46,47]. Each neuron in the input layer represents distinct characteristics of foam flotation bubble velocity, collector dosage, and frother dosage. Simultaneously, the output layer comprises a single neuron, which predicts the coal ash content. The architecture of the deep neural network model is presented as follows:
H 1 = Tanh ( X ψ 0 + ε 0 * )
H 2 = Tanh ( H 1 ψ 1 + ε 1 * )
H 3 = Tanh ( H 2 ψ 2 + ε 2 * )
A p r e d = H 3 ψ 3 * + ε 3 *
We adopted the mean squared error as the loss function, denoted by the following:
L o s s = 1 n i = 1 n ( A i A p r e d i ) 2
The gradient calculation for each parameter is as follows:
L o s s ψ 3 * = i = 1 n ( A i A p r e d i ) A p r e d i ψ 3 * σ 2
L o s s ε 3 * = i = 1 n ( A i A p r e d i ) A p r e d i ε 3 * σ 2
L o s s ψ 2 * = i = 1 n ( A i A p r e d i ) A p r e d i H 3 H 3 ψ 2 * σ 2
L o s s ε 2 * = i = 1 n ( A i A p r e d i ) A p r e d i H 3 H 3 ε 2 * σ 2
L o s s ψ 1 * = i = 1 n ( A i A p r e d i ) A p r e d i H 3 H 3 H 2 H 2 ψ 1 * σ 2
L o s s ε 1 * = i = 1 n ( A i A p r e d i ) A p r e d i H 3 H 3 H 2 H 2 ε 1 * σ 2
L o s s ψ 0 * = i = 1 n ( A i A p r e d i ) A p r e d i H 3 H 3 H 2 H 2 H 1 H 1 ψ 0 * σ 2
L o s s ε 0 * = i = 1 n ( A i A p r e d i ) A p r e d i H 3 H 3 H 2 H 2 H 1 H 1 ε 0 * σ 2
where
A p r e d i ψ 3 * = H 3 T
A p r e d i ε 3 * = 1
A p r e d i H 3 = ( ψ 3 * ) T
H 3 ψ 2 * = Tan h ( H 2 ψ 2 * + ε 2 * ) H 2 T
H 3 ε 2 * = Tan h ( H 2 ψ 2 * + ε 2 * )
H 2 ψ 1 * = Tan h ( H 1 ψ 1 * + ε 1 * ) H 1 T
H 2 ε 1 * = Tan h ( H 1 ψ 1 * + ε 1 * )
H 1 ψ 0 * = Tan h ( X ψ 0 * + ε 0 * ) X T
H 1 ε 0 * = Tan h ( X ψ 0 * + ε 0 * )
During the training procedure of the Keras deep neural network, we employed a series of critical hyperparameter configurations to optimize the model’s performance and mitigate overfitting phenomena. The Adam optimizer was selected as the initializer, given its proficient adaptive learning rate properties, which enable more effective adaptation to intricate optimization tasks [48]. The learning rate was set to 0.001 to adequately control the parameter update step during training, avoiding the pitfalls of excessively high or low learning rates that could lead to training instability. Following the completion of each training epoch, the learning rate was subjected to decay by dividing the initial learning rate by 200. This gradual reduction in the learning rate during the later stages of training facilitated a more meticulous search for the optimal solution space, thereby enhancing the model’s convergence speed and stability.
To forestall the model from excessively tailoring itself to the training data, an early stopping strategy was introduced. We diligently monitored the loss function on the validation set and immediately terminated the training process if no improvement was discernible over 200 consecutive training iterations. This judicious approach effectively prevented the model from continuing to train in an overfitting state, thereby bolstering its generalization capacity and reducing the risk of overfitting.

4. Results and Analysis

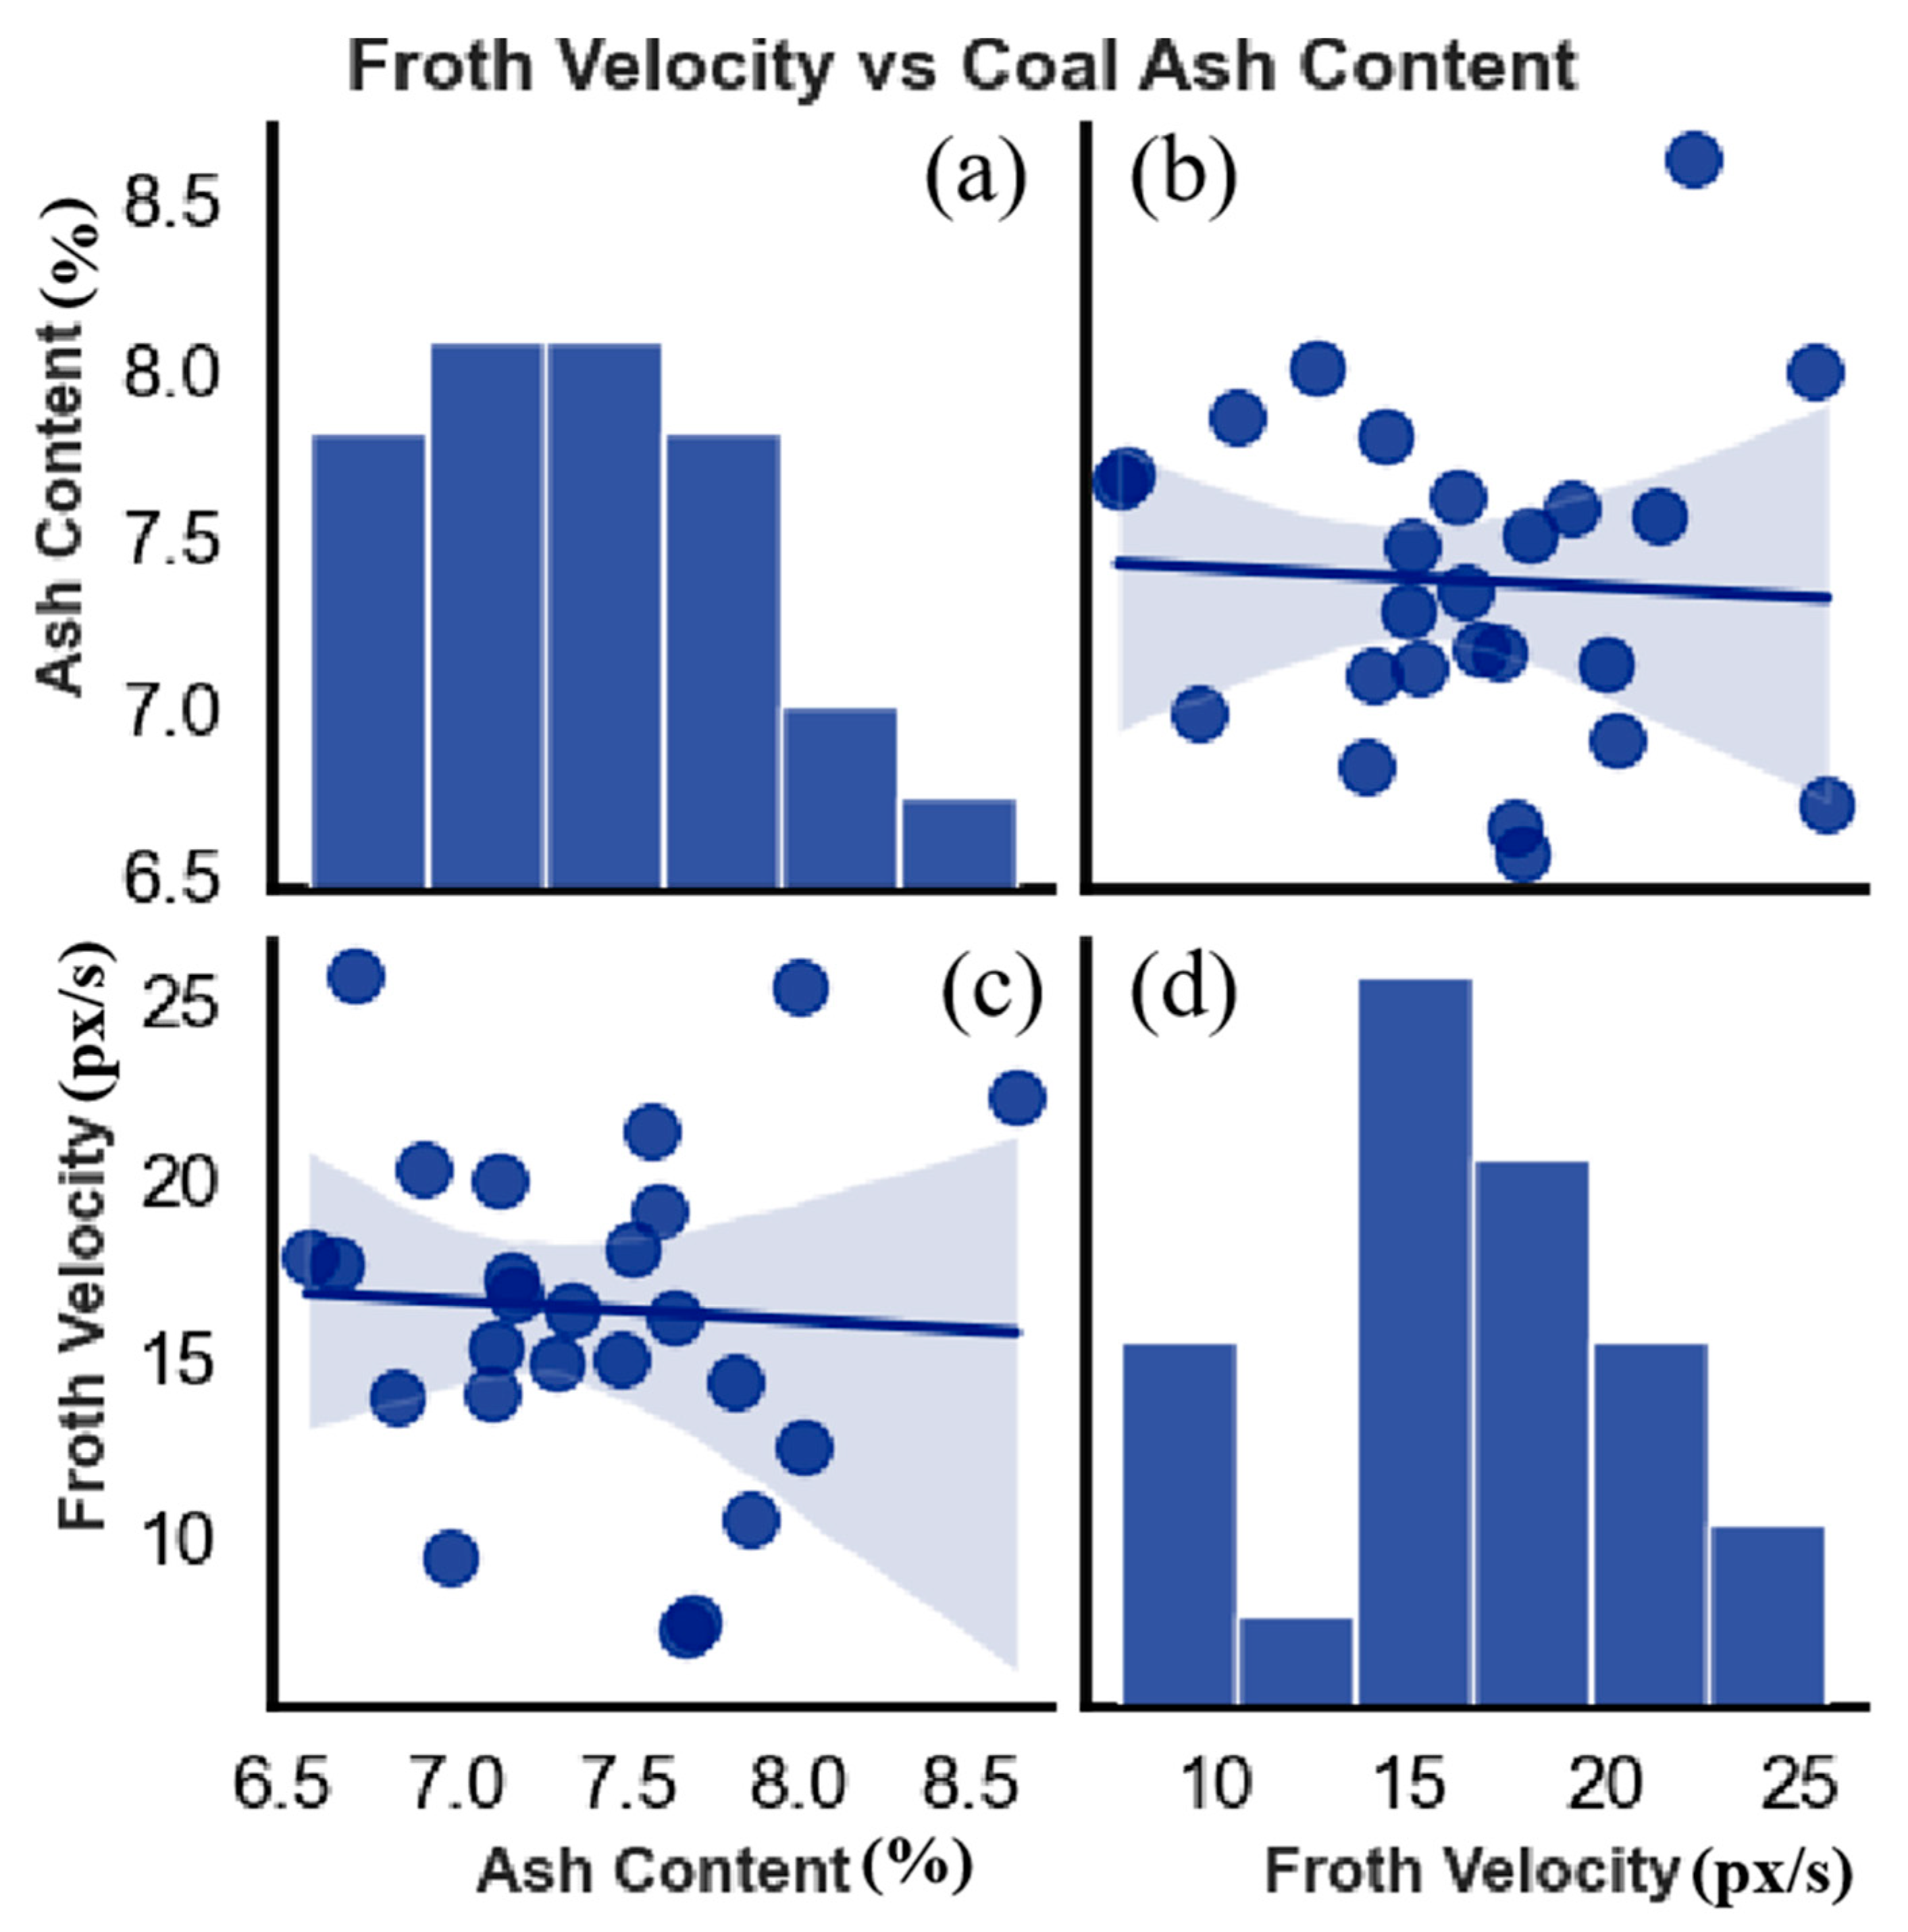
4.1. Dynamic Characterization Parameters of Froth Flotation in Relation to Coal Ash Content

Each video segment, lasting approximately 1 min, corresponds to a specific ash content value. Under the condition of extracting 5 frames per second, images within the same video segment are associated with the same ash content. As depicted in Figure 5, illustrating the distribution chart of identified froth velocity, we conducted an analysis of froth velocity distribution based on this image data. Subsequently, we computed the average dynamic features of the foam flotation process to explore the correlation between foam flotation dynamics and the ash content of fine coal. Employing a confusion matrix, we scrutinized the relationship between ash content values and dynamic feature parameters, as shown in Figure 6. Figure 6 clearly illustrates the impact of bubble velocity on ash content. Figure 6 presents a confusion matrix plot of bubble velocity and ash content, with Figure 6b depicting bubble velocity on the x-axis and ash content on the y-axis. In Figure 6c, the x-axis represents ash content, while the y-axis represents bubble velocity. The correlation analysis results revealed a negative correlation coefficient of −0.05502 between the ash content of fine coal and froth velocity. This negative correlation implies that higher froth velocity in the foam flotation process might indicate larger and swifter-moving bubbles. This circumstance could potentially diminish the contact duration between bubbles and solid particles, thereby influencing flotation efficiency. Conversely, lower froth velocity may allow for an extended contact duration between bubbles and solid particles, potentially fostering a more effective separation between coal and foam, ultimately enhancing coal quality. These findings elucidate a certain correlation between bubble velocity as a dynamic feature parameter within the foam flotation process and the ash content of fine coal. Elevated bubble dynamics parameters closely interrelate with the interaction between coal and foam, potentially wielding substantial influence over the efficiency and quality of products within the coal flotation process.

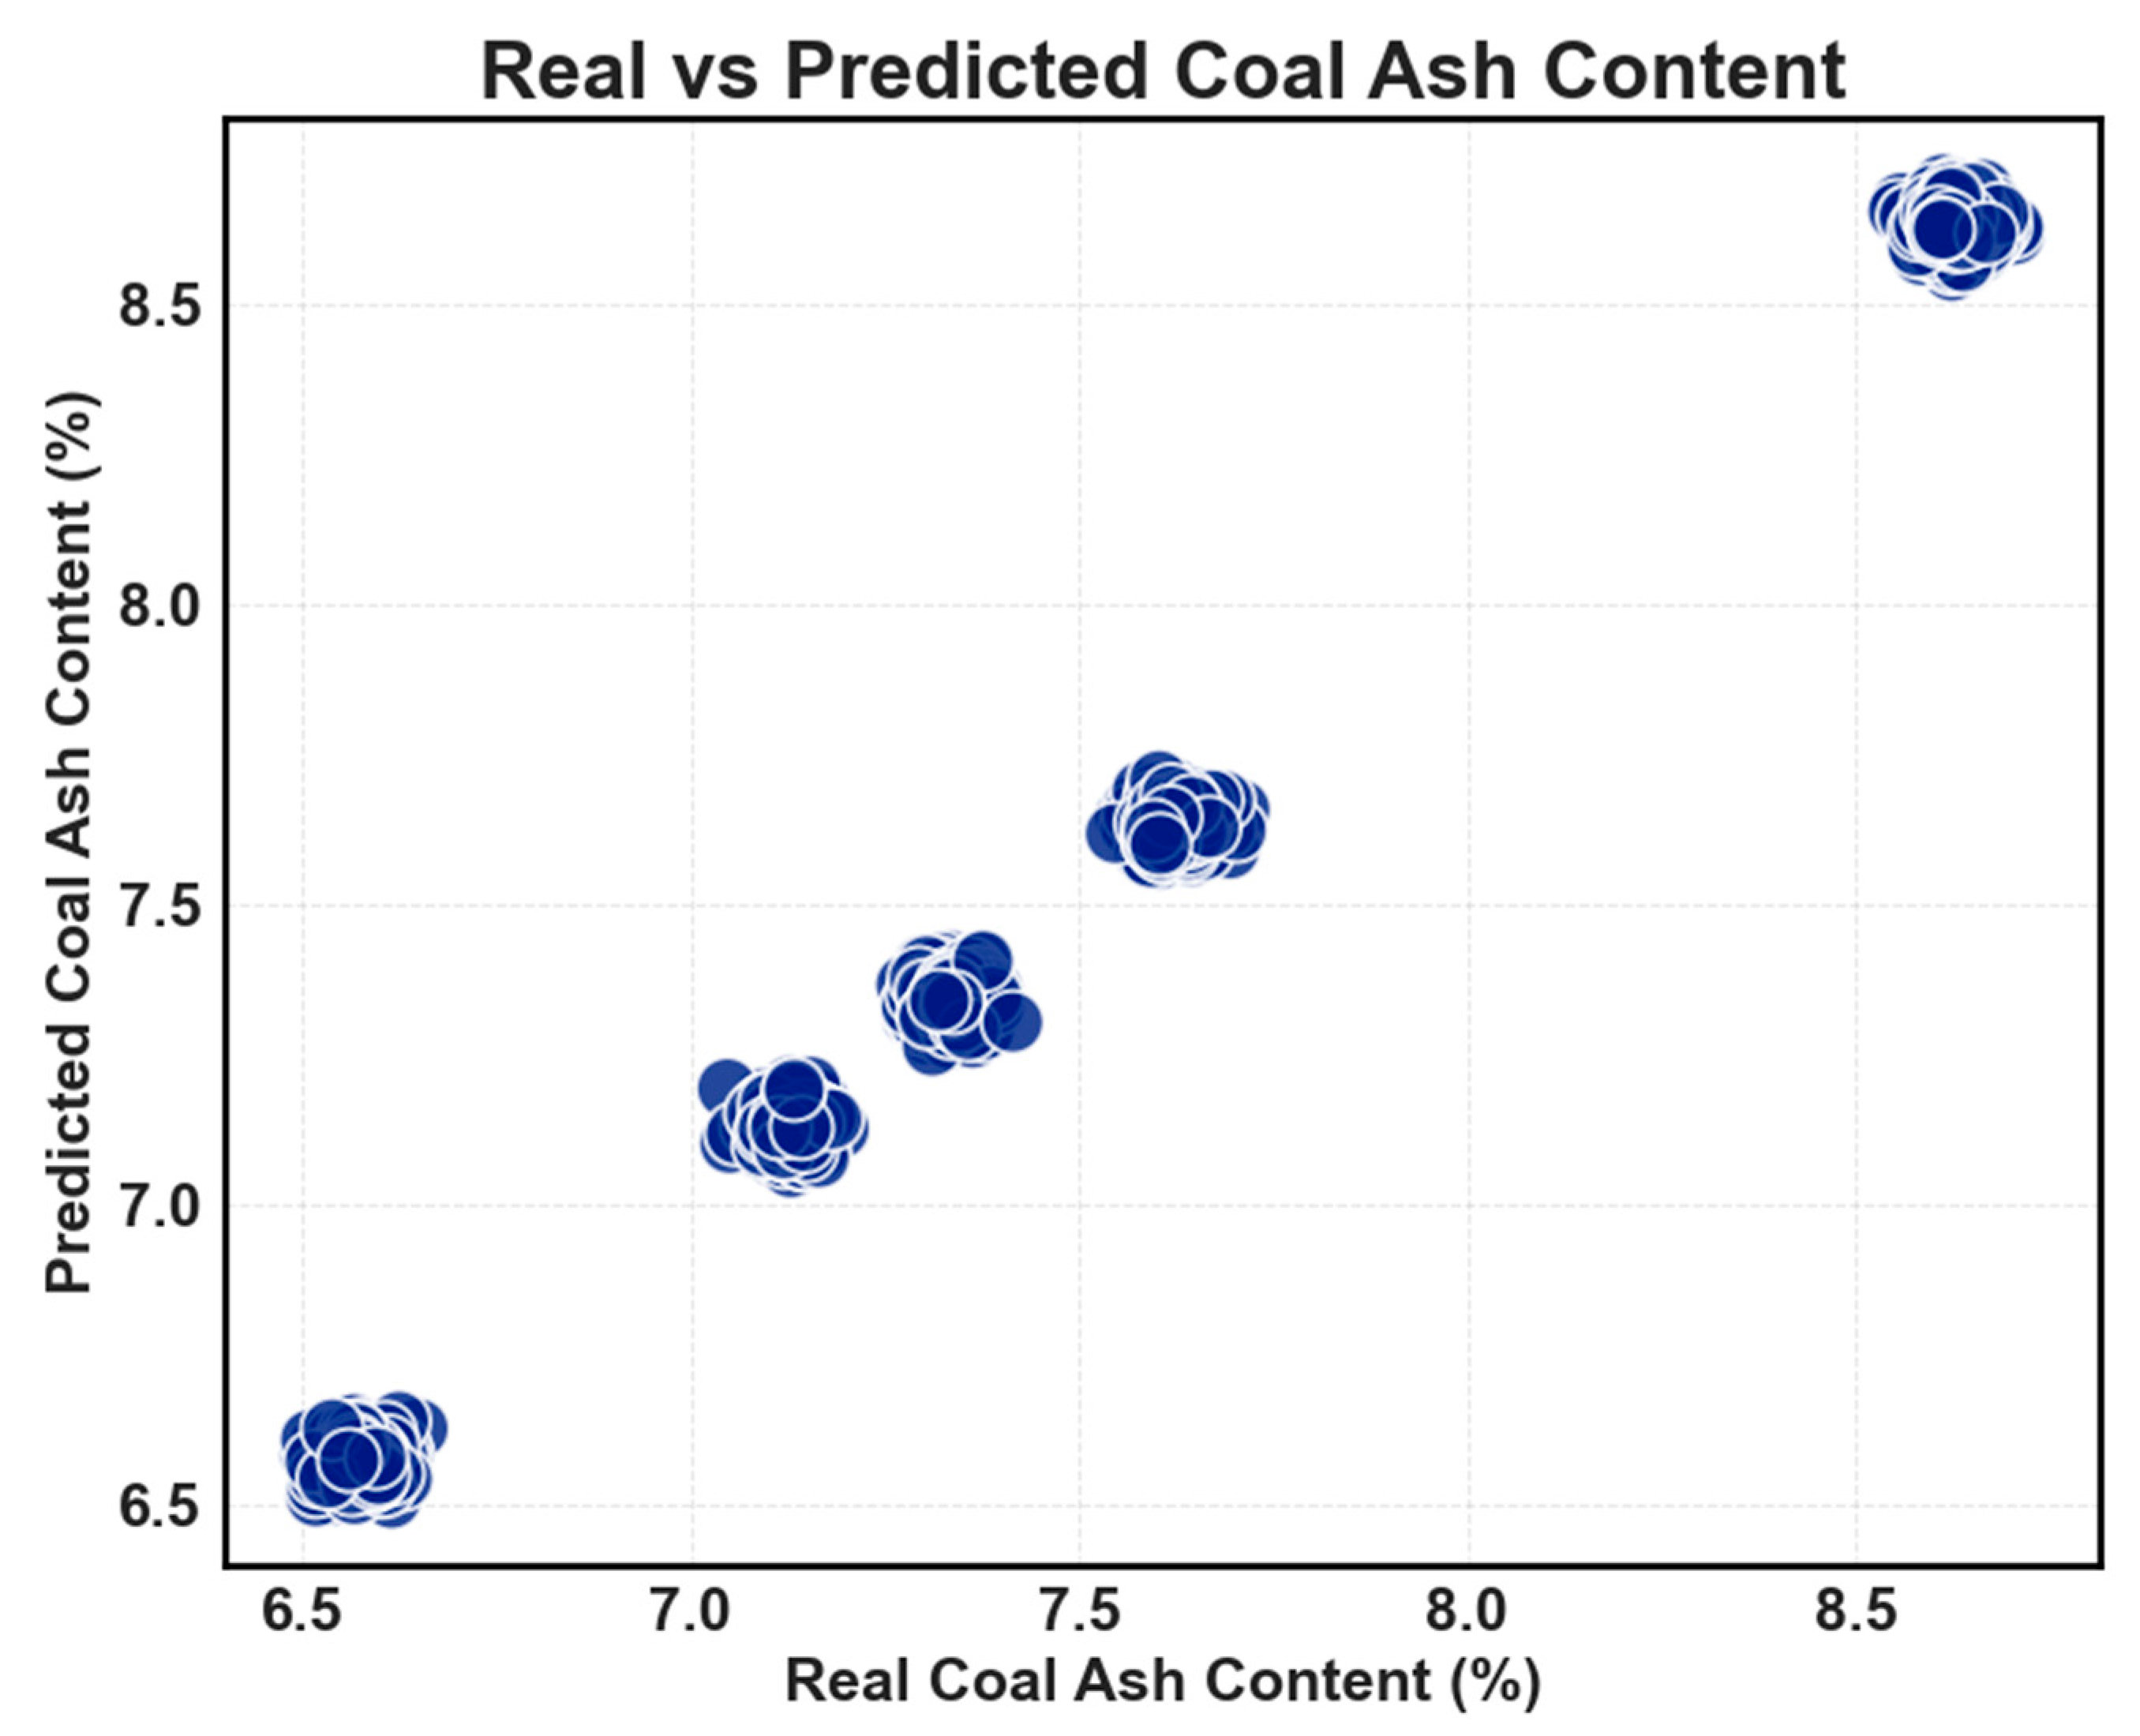
4.2. Froth Flotation Concentrate Coal Ash Content Prediction and Result Analysis

In this investigation, we employed a meticulously trained Keras deep neural network to make accurate predictions regarding the ash content of 25 clean coal samples. The prediction outcomes are presented in Figure 7 and Figure 8. Detailed performance evaluations on the training and validation sets are furnished in Table 5, encompassing essential metrics such as the R2, RMSE, MAE, MAPE, RRSE, and MAAPE. Remarkably, the coefficient of determination (R2) demonstrated exceptionally high scores of 0.99997% on the training set and 0.99992% on the validation set. These outstanding R2 values underscore the model’s remarkable fitting capability to the data, ensuring precise predictions of clean coal ash content. Additionally, both the RMSE and MAE metrics exhibited remarkably low values of 0.00218% and 0.00170%, respectively. This conveys the model’s superior prediction accuracy and its ability to minimize disparities between predicted and actual values. Furthermore, the MAPE yielded a value of 0.02329%, while the RRSE registered at 0.00994%. The MAAPE was found to be 0.00067%. The combined analysis of these metrics underscores the model’s overall capacity to maintain minimal prediction errors and relative precision. Moreover, the model’s performance on the validation set exhibited a slight reduction when compared to the training set. Nevertheless, it remained highly competitive, indicating robust learning capabilities and excellent generalization to unseen data. Lastly, the deep neural network model surpassed alternative machine learning methods in all assessed metrics, solidifying its substantial advantages. Notably, the model’s R2 value, nearing 1 on the validation set, in tandem with the significantly low RMSE, MAE, and MAPE values, attests to its exceptional accuracy and reliability in forecasting clean coal ash content in froth flotation.
Regarded as a fundamental tool, this investigation employed the Keras deep learning framework as a pivotal instrument, establishing a predictive model for fine coal ash content based on neural network architecture. Keras, renowned for its flexibility and user-friendly attributes, boasts exceptional prowess in data processing. This framework organizes neurons hierarchically and across multiple layers, effectively facilitating the comprehension and interpretation of intricate nonlinear features embedded in the data. By delving deeply into these data features, the model comprehends the inherent structure of fine coal sample data comprehensively, consequently enhancing its predictive performance for ash content values. Concurrently, high-resolution 2048 × 2048-pixel image data were harnessed. This selection of high resolution was dictated by the necessity for precise feature extraction in deep learning methodologies. High-resolution images provide nuanced and comprehensive information, aiding the model in accurately discerning and assimilating minute features and intricate patterns within the images. These subtle features often play pivotal roles in influencing fine coal ash content values. Consequently, the precise capture of these features establishes a robust foundation for the model’s predictive capacities. By integrating the robust data processing capabilities of the Keras deep learning framework with the detailed information gleaned from high-resolution image data, this study offers a more accurate and comprehensive feature depiction within the data. This, in turn, provides a more reliable and precise foundation for predicting fine coal ash content values. Through this technological approach, researchers can unveil inherent nonlinear correlations within the data, furnishing dependable solutions for optimizing production processes, enhancing product quality, and curbing expenses in industries such as coal mining. Moreover, the developed model serves as a significant reference point for future research endeavors and industrial applications, guiding further exploration and enhancements.

5. Conclusions

This study successfully integrates deep learning with the likelihood function, thereby establishing a high-precision prediction model for accurately detecting the ash content of clean coal in the realm of coal froth flotation. Leveraging the Scale-Invariant Feature Transform (SIFT) algorithm, this research extracts salient feature points and descriptors from the images, and through the amalgamation of keypoint matching with mean-shift clustering, it achieves a comprehensive understanding of the flotation process, encompassing froth trajectory and velocity information. Studies have revealed an inverse relationship between the ash content of refined coal and the velocity of bubbles observed during the froth flotation process. This negative correlation suggests that elevated bubble velocities may decrease the duration of the interaction between bubbles and solid particles, thereby impacting the efficacy of flotation. Conversely, lower bubble velocities appear to be conducive to facilitating the separation of coal from the foam, consequently elevating the quality of coal. These revelations illuminate the pivotal impact of dynamic parameters in bubble kinetics and the interplay between coal and foam on the efficiency and quality of flotation processes.
This study proposed the utilization of the maximum likelihood estimation to optimize parameters within the likelihood function, which were subsequently integrated into the Keras deep neural network for training and predictive purposes. Evaluation of the model performance on both the training and validation sets exhibited R-squared values nearing 1, accompanied by minimal values across other assessment metrics. This signifies the exceptional predictive capability of our model in estimating the ash content of refined coal. The harmonious fusion of deep learning and the likelihood function has showcased robust predictive prowess, presenting novel technological avenues for quality control in coal product manufacturing and productivity enhancement. The optimized predictive model developed in this study lays a robust groundwork for real-time monitoring within practical industrial applications, particularly in the domain of froth flotation. This advancement holds the potential to drive the froth flotation sector toward automation and intelligent operations. It is noteworthy that our findings offer an efficient and reliable method for the coal industry and related sectors, specifically for the accurate prediction of ash content in refined coal. This capability enhances product quality and provides crucial support for pivotal decisions in industrial production processes. In essence, our research applies the amalgamation of deep learning and the likelihood function to the realm of coal froth flotation, presenting a robust predictive model with superior performance. This achievement holds significant implications for driving technological innovation and industrial intelligence in related fields, laying a solid foundation for the efficient monitoring and control of froth flotation processes.

Author Contributions

All authors contributed to this study’s conception and design. F.L.: methodology, software, formal analysis, visualization, writing—original draft—and writing—review. H.L.: conceptualization, methodology, funding acquisition, supervision, writing—original draft—and writing—review and editing. W.L.: supervision, validation, and writing—reviewing and editing. All authors have read and agreed to the published version of the manuscript.

Funding

This research received no external funding.

Data Availability Statement

The data presented in this study are available on request from the corresponding author. The data are not publicly available due to the continuous research.

Conflicts of Interest

The authors declare that they have no known competing financial interests or personal relationships that could have appeared to influence the work reported in this paper.

Abbreviations

AbbreviationConnotation
SIFTScale-Invariant Feature Transform
XRFX-ray fluorescence
BPBack Propagation
RSMResponse surface methodology
ANNArtificial neural network
DNNDeep neural network
CFDComputational fluid dynamics
CNNConvolutional neural network
FRRNFeature Reconstruction–Regression Network
MLEMaximum likelihood estimation
MIBC4-Methylpentan-2-ol
R2Coefficient of Determination
RMSERoot Mean Square Error
MAEMean Absolute Error
MAPEMean Absolute Percentage Error
RRSERelative Root Squared Error
MAAPEMean Arctangent Absolute Percentage Error
PX/SPixel/Second

References

  1. Jahedsaravani, A.; Marhaban, M.H.; Massinaei, M. Prediction of the metallurgical performances of a batch flotation system by image analysis and neural networks. Miner. Eng. 2014, 69, 137–145. [Google Scholar] [CrossRef]
  2. Liu, J.; Gao, Q.; Tang, Z.; Xie, Y.; Gui, W.; Ma, T.; Niyoyita, J.P. Online Monitoring of Flotation Froth Bubble-Size Distributions via Multiscale Deblurring and Multistage Jumping Feature-Fused Full Convolutional Networks. IEEE Trans. Instrum. Meas. 2020, 69, 9618–9633. [Google Scholar] [CrossRef]
  3. Sutherland, J.L.; Dickinson, J.E.; Galvin, K.P. Flotation of coarse coal particles in the Reflux™ Flotation Cell. Miner. Eng. 2020, 149, 106224–106235. [Google Scholar] [CrossRef]
  4. Yan, Y.; Yang, W.; Fang, X.; Yan, P.; Tu, J. Experimental investigation of multi-phase hydrodynamics and bubble-particle interactions in a Wemco 56 flotation cell. Miner. Eng. 2021, 172, 107115–107126. [Google Scholar] [CrossRef]
  5. Ni, C.; Bu, X.; Xia, W.; Peng, Y.; Xie, G. Effect of slimes on the flotation recovery and kinetics of coal particles. Fuel 2018, 220, 159–166. [Google Scholar] [CrossRef]
  6. Tao, D.; Sobhy, A. Nanobubble effects on hydrodynamic interactions between particles and bubbles. Powder Technol. 2019, 346, 385–395. [Google Scholar] [CrossRef]
  7. Uysal, T.; Guven, O.; Ozdemir, O.; Karaagaclioglu, İ.E.; Tunç, B.; Çelik, M.S. Contribution of particle morphology on flotation and aggregation of sphalerite particles. Miner. Eng. 2021, 165, 106860–106869. [Google Scholar] [CrossRef]
  8. Cheng, Y.; Min, F.; Li, H.; Chen, J.; Fu, X. Effect of reagent interaction on froth stability of coal flotation. Fuel 2022, 318, 123417–123429. [Google Scholar] [CrossRef]
  9. Lu, M.; Liu, D.; Deng, Y.; Wu, L.; Xie, Y.; Chen, Z. R-K algorithm: A novel Dynamic Feature Matching Method of flotation froth. Measurement 2020, 156, 107581–107590. [Google Scholar] [CrossRef]
  10. Zhang, X.; Liang, L.; Li, T.; Tan, J.; Liang, X.; Xie, G. Coal Ash Content Measurement Based on Pseudo-Dual Energy X-ray Transmission. Minerals 2021, 11, 1433–1446. [Google Scholar] [CrossRef]
  11. Rizk, R.; EI-kateb, A.; Abdul-kader, A.M. On-line nuclear ash gauge for coal based on gamma-ray transmission techniques. J. Radioanal. Nucl. Chem. 1999, 242, 139–145. [Google Scholar] [CrossRef]
  12. Wen, Z.; Zhou, C.; Pan, J.; Nie, T.; Jia, R.; Yang, F. Froth image feature engineering-based prediction method for concentrate ash content of coal flotation. Miner. Eng. 2021, 170, 107023–107033. [Google Scholar] [CrossRef]
  13. Pinto, A.M.; Rocha, L.F.; Paulo Moreira, A. Object recognition using laser range finder and machine learning techniques. Robot CIM-INT Manuf. 2013, 29, 12–22. [Google Scholar] [CrossRef]
  14. Bai, Q.; Li, S.; Yang, J.; Song, Q.; Li, Z.; Zhang, X. Object Detection Recognition and Robot Grasping Based on Machine Learning: A Survey. IEEE Access 2020, 8, 181855–181879. [Google Scholar] [CrossRef]
  15. Nateghi, H.; Sodeifian, G.; Razmimanesh, F.; Mohebbi Najm Abad, J. A machine learning approach for thermodynamic modeling of the statically measured solubility of nilotinib hydrochloride monohydrate (anti-cancer drug) in supercritical CO2. Sci. Rep. 2023, 13, 12906–12923. [Google Scholar] [CrossRef]
  16. Jia, R.; Yan, Y.; Lang, D.; He, D.; Li, K. Compression and reconstruction of flotation foam images based on generative adversarial networks. Miner. Eng. 2023, 202, 108299–108311. [Google Scholar] [CrossRef]
  17. He, M.; Sun, B. On-Line Froth Depth Estimation for Sulphur Flotation Process with Multiple Working Conditions. IEEE Access. 2019, 7, 124774–124784. [Google Scholar] [CrossRef]
  18. Zhang, Z.; Yang, J.; Wang, Y.; Dou, D.; Xia, W. Ash content prediction of coarse coal by image analysis and GA-SVM. Powder Technol. 2014, 268, 429–435. [Google Scholar] [CrossRef]
  19. Aldrich, C.; Avelar, E.; Liu, X. Recent advances in flotation froth image analysis. Miner. Eng. 2022, 188, 107823–107839. [Google Scholar] [CrossRef]
  20. Massinaei, M.; Jahedsaravani, A.; Taheri, E.; Khalilpour, J. Machine vision based monitoring and analysis of a coal column flotation circuit. Powder Technol. 2019, 343, 330–341. [Google Scholar] [CrossRef]
  21. Kistner, M.; Jemwa, G.T.; Aldrich, C. Monitoring of mineral processing systems by using textural image analysis. Miner Eng. 2013, 52, 169–177. [Google Scholar] [CrossRef]
  22. Massinaei, M.; Jahedsaravani, A.; Mohseni, H. Recognition of process conditions of a coal column flotation circuit using computer vision and machine learning. Int. J. Coal Prep. Util. 2020, 42, 2204–2218. [Google Scholar] [CrossRef]
  23. Hosseini, M.R.; Shirazi, H.H.A.; Massinaei, M.; Mehrshad, N. Modeling the Relationship between Froth Bubble Size and Flotation Performance Using Image Analysis and Neural Networks. Chem. Eng. Commun. 2014, 202, 911–919. [Google Scholar] [CrossRef]
  24. Wen, Z.; Zhou, C.; Pan, J.; Nie, T.; Zhou, C.; Lu, Z. Deep learning-based ash content prediction of coal flotation concentrate using convolutional neural network. Miner. Eng. 2021, 174, 107251–107260. [Google Scholar] [CrossRef]
  25. Kalyani, V.K.; Pallavika; Chaudhuri, S.; Gouri Charan, T.; Haldar, D.D.; Kamal, K.P.; Badhe, Y.P.; Tambe, S.S.; Kulkarni, B.D. Study of a Laboratory-Scale Froth Flotation Process Using Artificial Neural Networks. Miner. Process. Extr. Metall. Rev. 2007, 29, 130–142. [Google Scholar] [CrossRef]
  26. Tang, M.; Zhou, C.; Zhang, N.; Liu, C.; Pan, J.; Cao, S. Prediction of the Ash Content of Flotation Concentrate Based on Froth Image Processing and BP Neural Network Modeling. Int. J. Coal Prep. Util. 2018, 41, 191–202. [Google Scholar] [CrossRef]
  27. Sodeifian, G.; Sajadian, S.A.; Saadati Ardestani, N. Evaluation of the response surface and hybrid artificial neural network-genetic algorithm methodologies to determine extraction yield of Ferulago angulata through supercritical fluid. J. Taiwan Inst. Chem. Eng. 2016, 60, 165–173. [Google Scholar] [CrossRef]
  28. Montes-Atenas, G.; Seguel, F.; Valencia, A.; Bhatti, S.M.; Khan, M.S.; Soto, I.; Becerra Yoma, N. Predicting bubble size and bubble rate data in water and in froth flotation-like slurry from computational fluid dynamics (CFD) by applying deep neural networks (DNN). Int. Commun. Heat Mass. Trans. 2016, 76, 197–201. [Google Scholar] [CrossRef]
  29. Zhang, H.; Tang, Z.; Xie, Y.; Chen, Q.; Gao, X.; Gui, W. Feature Reconstruction-Regression Network: A Light-Weight Deep Neural Network for Performance Monitoring in the Froth Flotation. IEEE Trans. Ind. Inform. 2021, 17, 8406–8417. [Google Scholar] [CrossRef]
  30. Zhang, P.; Zhu, R.; Chen, J.; Kang, B. A generalized soft likelihood function in combining multi-source belief distribution functions. Appl. Intell. 2021, 52, 3748–3765. [Google Scholar] [CrossRef]
  31. Tian, Y.; Mi, X.; Liu, L.; Kang, B. A New Soft Likelihood Function Based on D Numbers in Handling Uncertain Information. Int. J. Fuzzy Syst. 2020, 22, 2333–2349. [Google Scholar] [CrossRef]
  32. Erem, A.; Bilgehan, B.; Özyapıcı, A.; Boratas Sensoy, Z. Further theories on application of new generalized probability density function and its applications. Qual. Reliab. Eng. Int. 2022, 38, 2405–2419. [Google Scholar] [CrossRef]
  33. Alfonsi, A.; Kebaier, A.; Rey, C. Maximum likelihood estimation for Wishart processes. Stoch. Proc. Appl. 2016, 126, 3243–3282. [Google Scholar] [CrossRef]
  34. Gong, X.; Jiang, W.; Hu, S.; Yang, Z.; Liu, X.; Fan, Z. Comprehensive utilization of foundry dust: Coal powder and clay minerals separation by ultrasonic-assisted flotation. J. Hazard. Mater. 2021, 402, 124124. [Google Scholar] [CrossRef]
  35. Jahedsaravani, A.; Massinaei, M.; Zarie, M. Measurement of bubble size and froth velocity using convolutional neural networks. Miner. Eng. 2023, 204, 108400–108414. [Google Scholar] [CrossRef]
  36. Holtham, P.N.; Nguyen, K.K. On-line analysis of froth surface in coal and mineral flotation using JKFrothCam. Int. J. Miner. Process. 2002, 64, 163–180. [Google Scholar] [CrossRef]
  37. Yianatos, J.; Panire, I.; Vinnett, L. A new method for flotation rate characterization using top-of-froth grades and the froth discharge velocity. Miner. Eng. 2016, 92, 242–247. [Google Scholar] [CrossRef]
  38. Hossein-Nejad, Z.; Agahi, H.; Mahmoodzadeh, A. Image matching based on the adaptive redundant keypoint elimination method in the SIFT algorithm. Pattern Anal. Appl. 2020, 24, 669–683. [Google Scholar] [CrossRef]
  39. Wu, K.-L.; Yang, M.-S. Mean shift-based clustering. Pattern Recogn. 2007, 40, 3035–3052. [Google Scholar] [CrossRef]
  40. He, Y.; Deng, G.; Wang, Y.; Wei, L.; Yang, J.; Li, X.; Zhang, Y. Optimization of SIFT algorithm for fast-image feature extraction in line-scanning ophthalmoscope. Optik 2018, 152, 21–28. [Google Scholar] [CrossRef]
  41. Pedrosa, G.V.; Batista, M.A.; Barcelos, C.A.Z. Image feature descriptor based on shape salience points. Neurocomputing 2013, 120, 156–163. [Google Scholar] [CrossRef]
  42. Li, Z.; Shu, H.; Zheng, C. Multi-Scale Single Image Dehazing Using Laplacian and Gaussian Pyramids. IEEE Trans. Image Process. 2021, 30, 9270–9279. [Google Scholar] [CrossRef] [PubMed]
  43. Chen, S.-M.; Kao, P.-H. Multiattribute decision making based on nonlinear programming methodology, the Euclidean distance between IVIFVs, and new score function of IVIFVs. Inf. Sci. 2023, 646, 119403–119428. [Google Scholar] [CrossRef]
  44. Ren, K.; Sun, W.; Meng, X.; Yang, G.; Peng, J.; Huang, J.; Li, J. CDFSL: Image Registration for Spaceborne Hyperspectral and Multispectral Data Having Large Spatial-Resolution Difference. IEEE Trans. Geosci. Remote Sens. 2023, 61, 5515415. [Google Scholar] [CrossRef]
  45. Chicho, B.T.; Bibo Sallow, A. A Comprehensive Survey of Deep Learning Models Based on Keras Framework. JSCDM 2021, 2, 49–62. [Google Scholar] [CrossRef]
  46. Conlin, R.; Erickson, K.; Abbate, J.; Kolemen, E. Keras2c: A library for converting Keras neural networks to real-time compatible C. Eng. Appl. Artif. Intel. 2021, 100, 104182–104188. [Google Scholar] [CrossRef]
  47. Jiang, Z.; Shen, G. Prediction of House Price Based on The Back Propagation Neural Network in The Keras Deep Learning Framework. In Proceedings of the 2019 6th International Conference on Systems and Informatics, Shanghai, China, 2–4 November 2019; pp. 1–5. [Google Scholar]
  48. Zhang, D.; Wang, S.; Liang, Y.; Du, Z. A novel combined model for probabilistic load forecasting based on deep learning and improved optimizer. Energy 2023, 264, 126172–126187. [Google Scholar] [CrossRef]
Figure 1. Froth flotation experimental setup and technical wiring diagram.
Processes 11 03425 g001
Figure 2. Froth velocity dynamic feature recognition extraction map (a) keypoints and characterizers, (b) trajectories, (c) velocity information).
Processes 11 03425 g002
Figure 3. The observed samples conform to a Gaussian distribution.
Processes 11 03425 g003
Figure 4. Kears deep neural network model structure diagram.
Processes 11 03425 g004
Figure 5. Bubble velocity identification and extraction of distribution maps.
Processes 11 03425 g005
Figure 6. Confusion matrix plot of bubble velocity versus coal ash content (a) histogram of ash content, (b) plot of froth velocity change versus ash value (c) plot of change in ash content versus froth velocity, (d) histogram of froth velocity.
Processes 11 03425 g006
Figure 7. Training results of froth flotation predicted value and actual ash value.
Processes 11 03425 g007
Figure 8. Froth flotation predicted values versus actual ash values validation results plots.
Processes 11 03425 g008
Table 1. Flotation machine operating parameters table.
Flotation Machine Operating ParametersSetting
Aeration Rate (m3/(m2·min)0.25
Impeller Rotation (r/min)1800
Impeller Diameter (mm)60
Table 2. Reagent dosage additions and initial bubble sizes.
GroupCollector (µL)Frother (µL)Initial Bubble NumberInitial Average Bubble Diameter (mm)
1110.6328.9856546
233.1231246
337.2653444
441.4176342
545.5564542
1119.8528.9870540
233.1261245
337.2662141
441.4171142
545.5547848
1129.0728.9856548
233.1278142
337.2674543
441.4196438
545.5593939
1138.2928.9853345
233.1251445
337.2647746
441.4177743
545.5575041
1147.5128.9826541
233.1237247
337.2620138
441.4126247
545.5522136
Table 3. Froth flotation image dataset segmentation.
Delineation CriteriaNumber of Pictures
Training set7500
Validation set1500
Table 4. Dynamic characterization parameter dataset for froth flotation images.
Collector (µL)Frother (µL)IdFroth Velocity (px/s)Ash Value (%)
110.6328.9800001.jpg8.6366.83
00002.jpg8.7236.83
00003.jpg8.6836.83
00004.jpg8.7856.83
00005.jpg12.6696.83
00299.jpg22.2216.83
00300.jpg18.4686.83
33.1200001.jpg24.3186.9
00002.jpg22.2616.9
00300.jpg11.0466.9
45.5500001.jpg19.316.65
00002.jpg17.4366.65
00300.jpg19.6916.65
147.5128.9800001.jpg23.4937.13
00002.jpg27.7627.13
00300.jpg12.2487.13
45.5500001.jpg10.6348.63
00002.jpg12.1518.63
00300.jpg19.6788.63
Table 5. Table of error between predicted ash value and actual ash value of each training set (%).
Evaluation CriteriaR2RMSEMAEMAPERRSEMAAPE
Training set0.999970.002180.001700.023290.009940.00067
Validation set0.999920.005570.003970.055520.008480.00055
Disclaimer/Publisher’s Note: The statements, opinions and data contained in all publications are solely those of the individual author(s) and contributor(s) and not of MDPI and/or the editor(s). MDPI and/or the editor(s) disclaim responsibility for any injury to people or property resulting from any ideas, methods, instructions or products referred to in the content.

