

Investigating the Impact of Operating Conditions on Relief Pressure Valve Flow through CFD and Statistical Analysis


Abstract
:1. Introduction
2. Materials and Methods
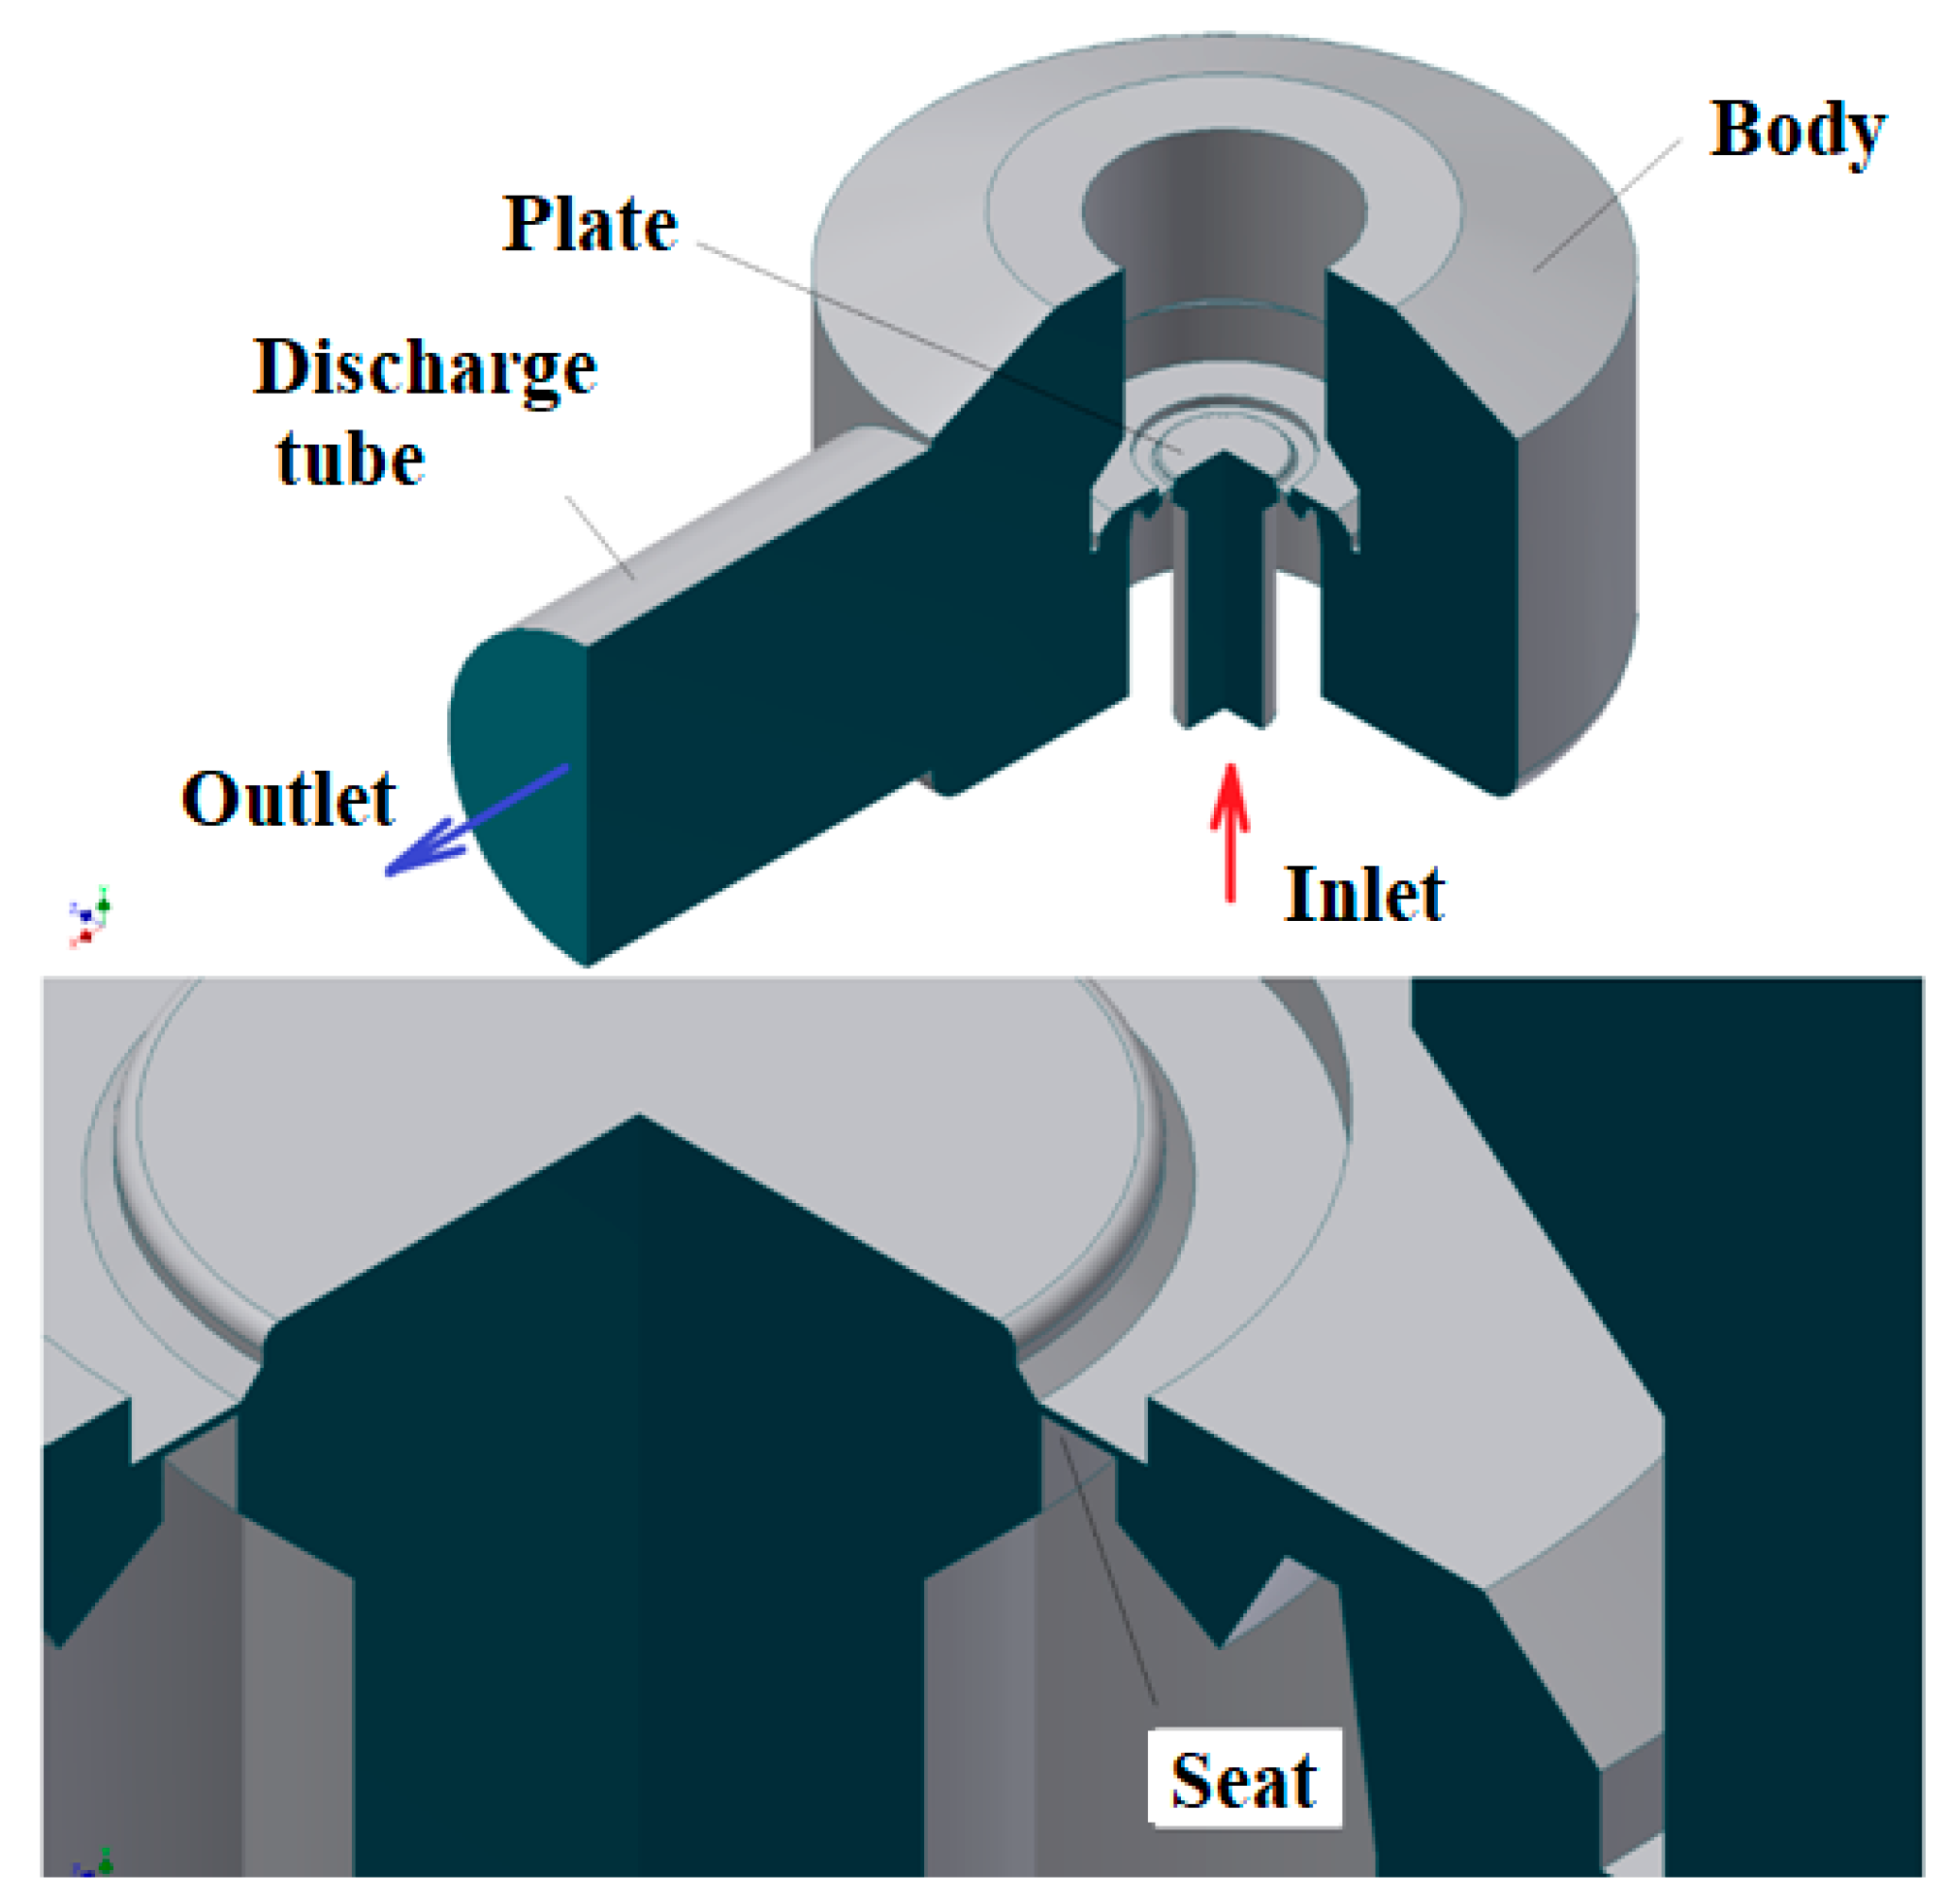
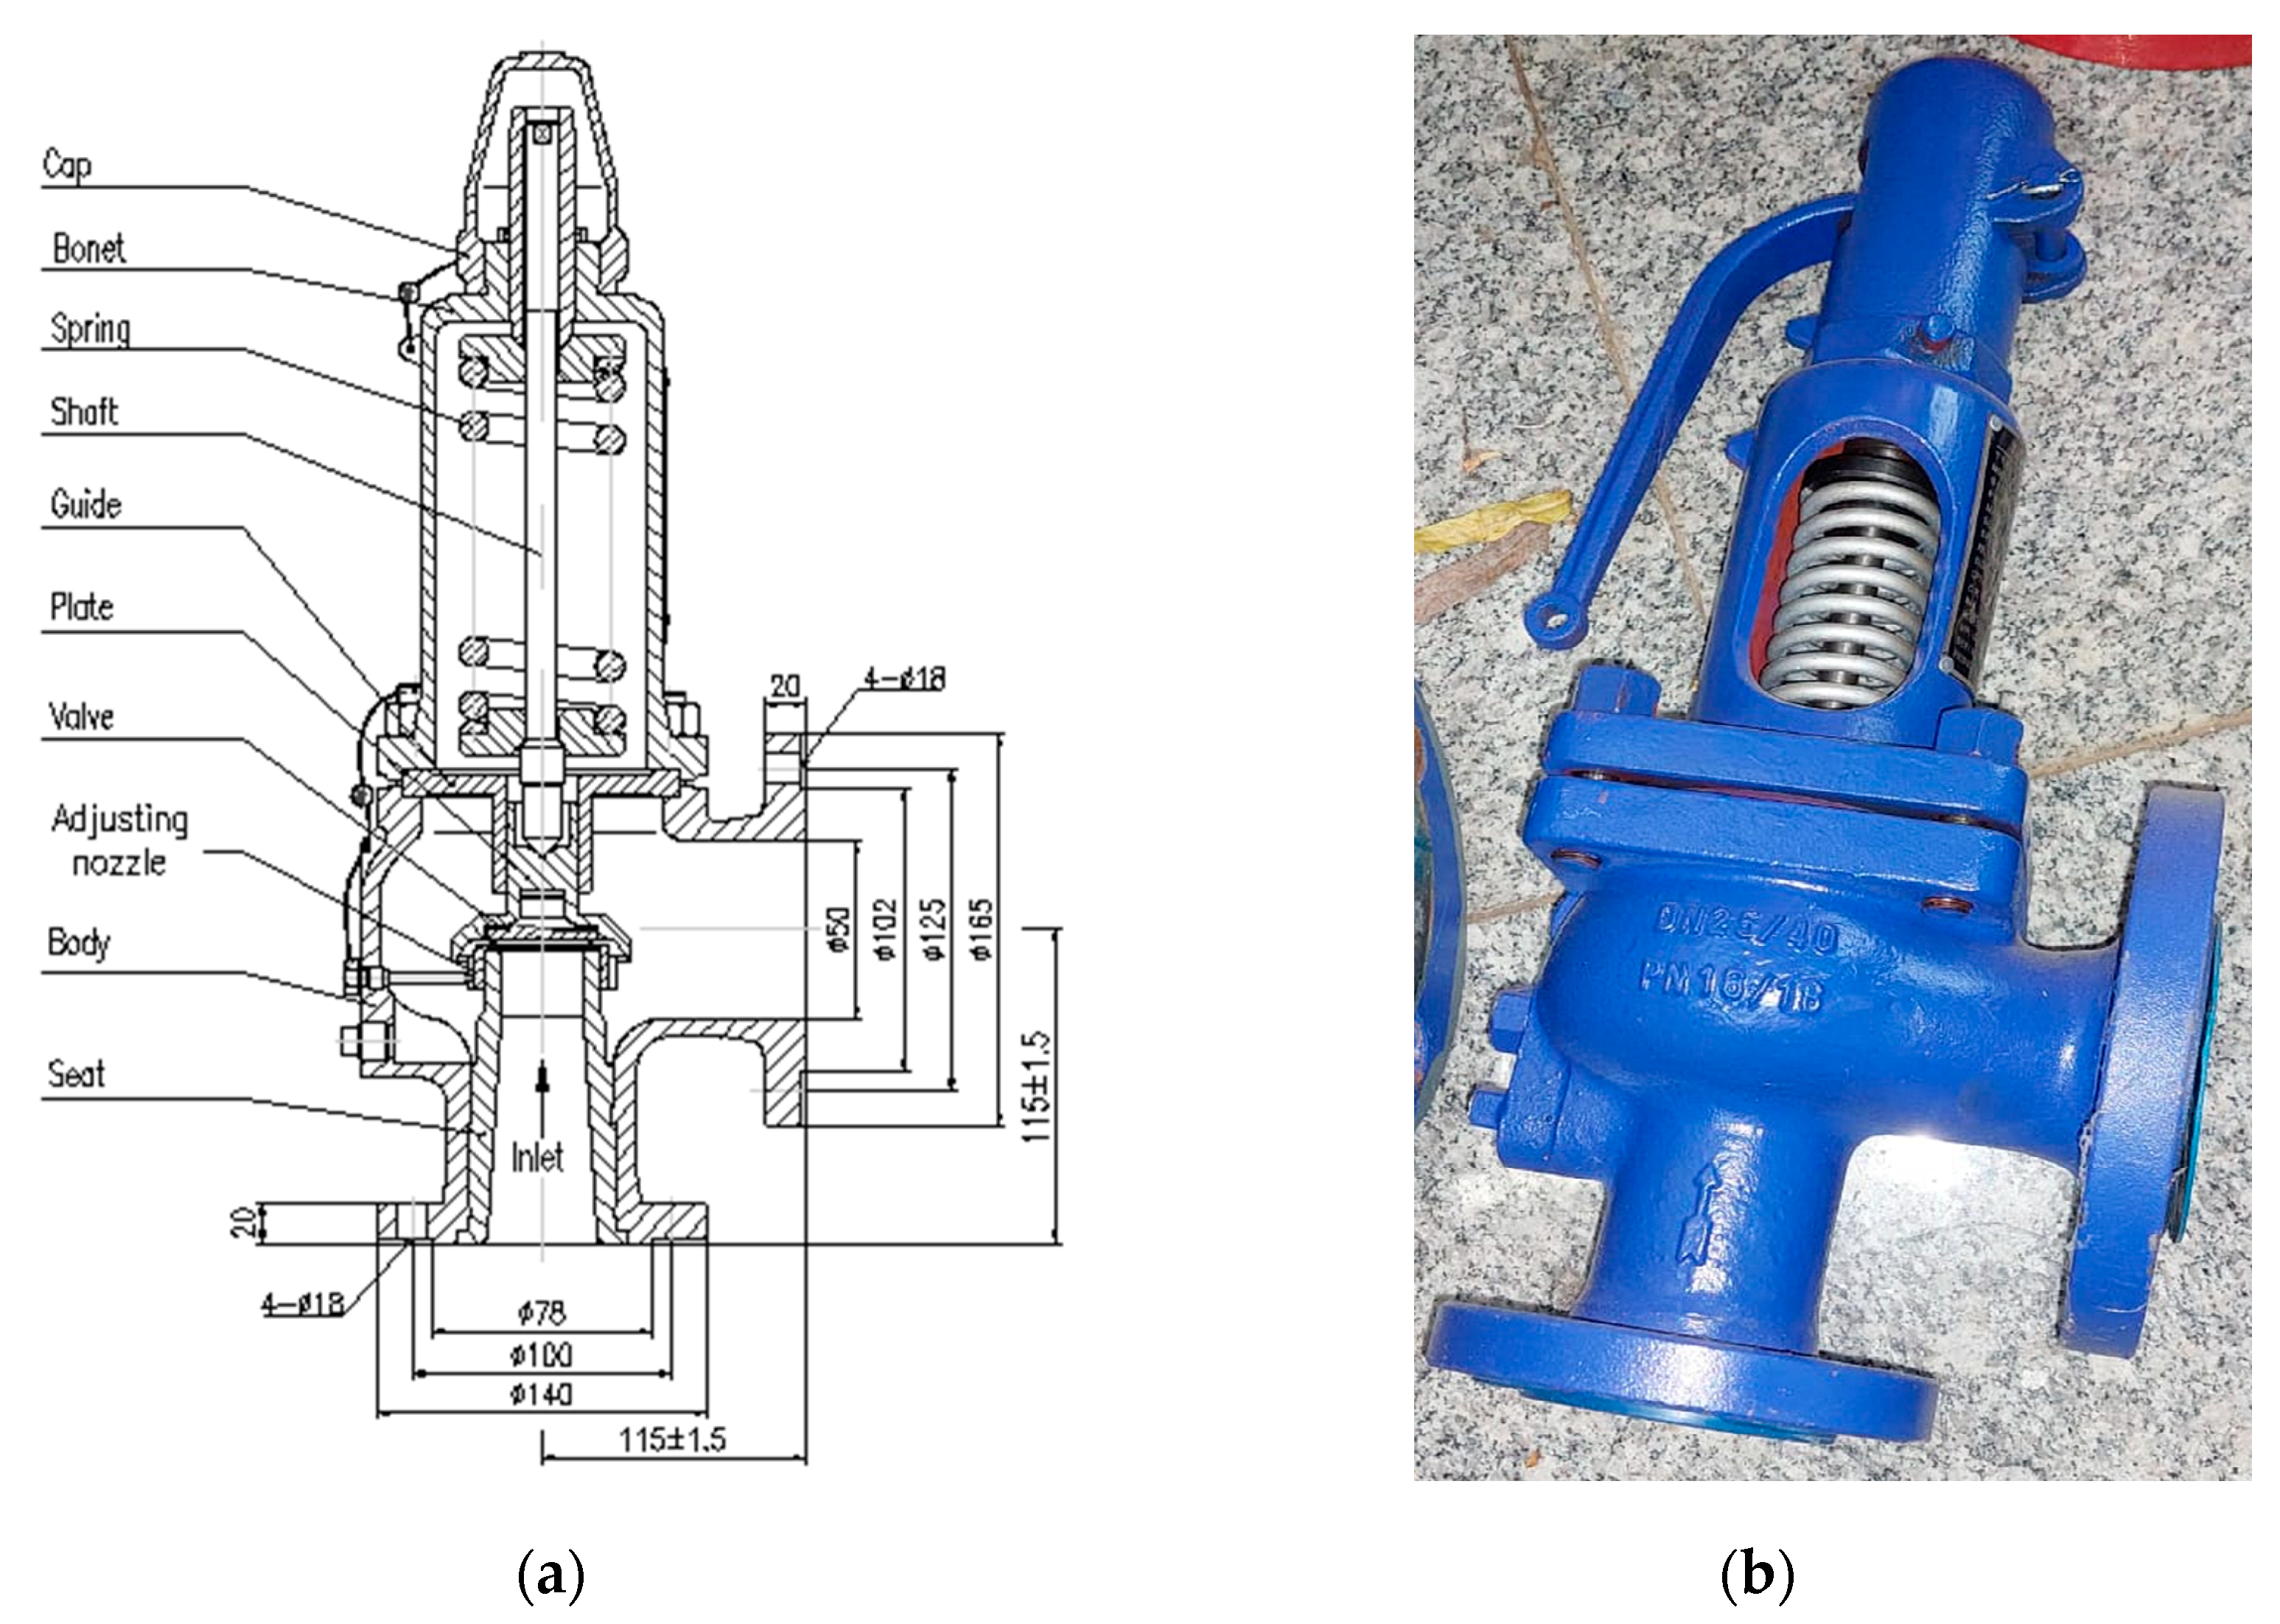
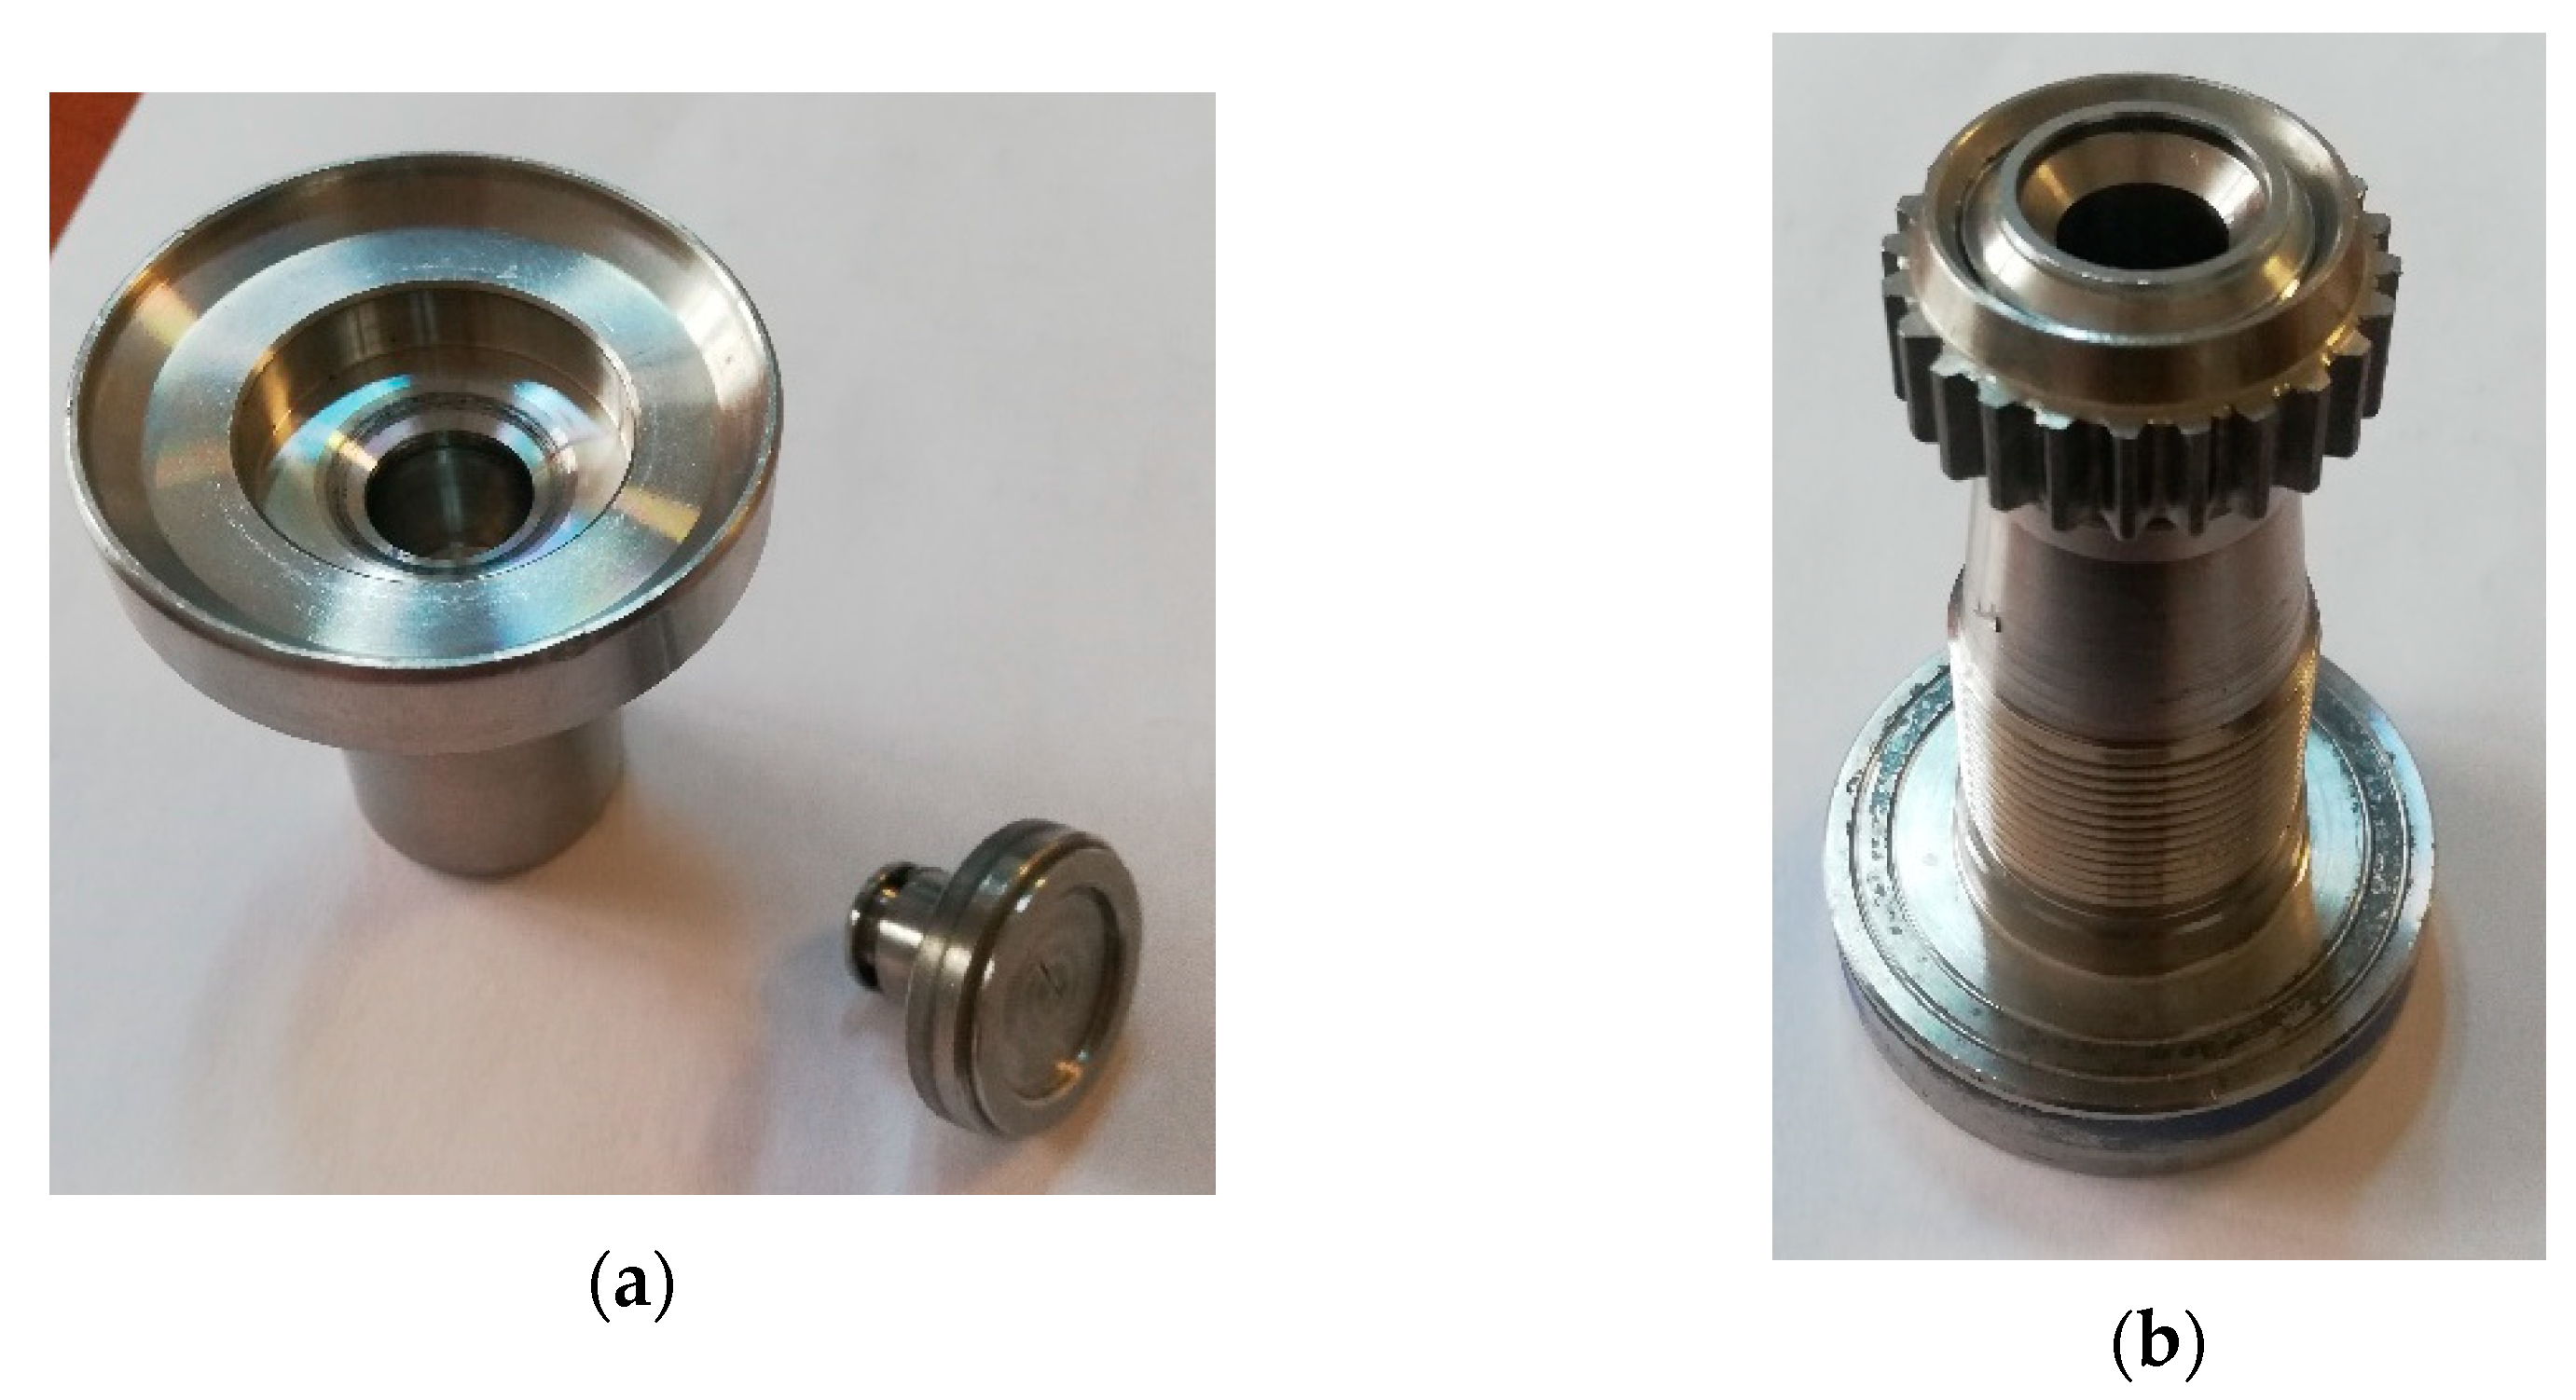
2.1. Characteristics of the Relief Pressure Valve
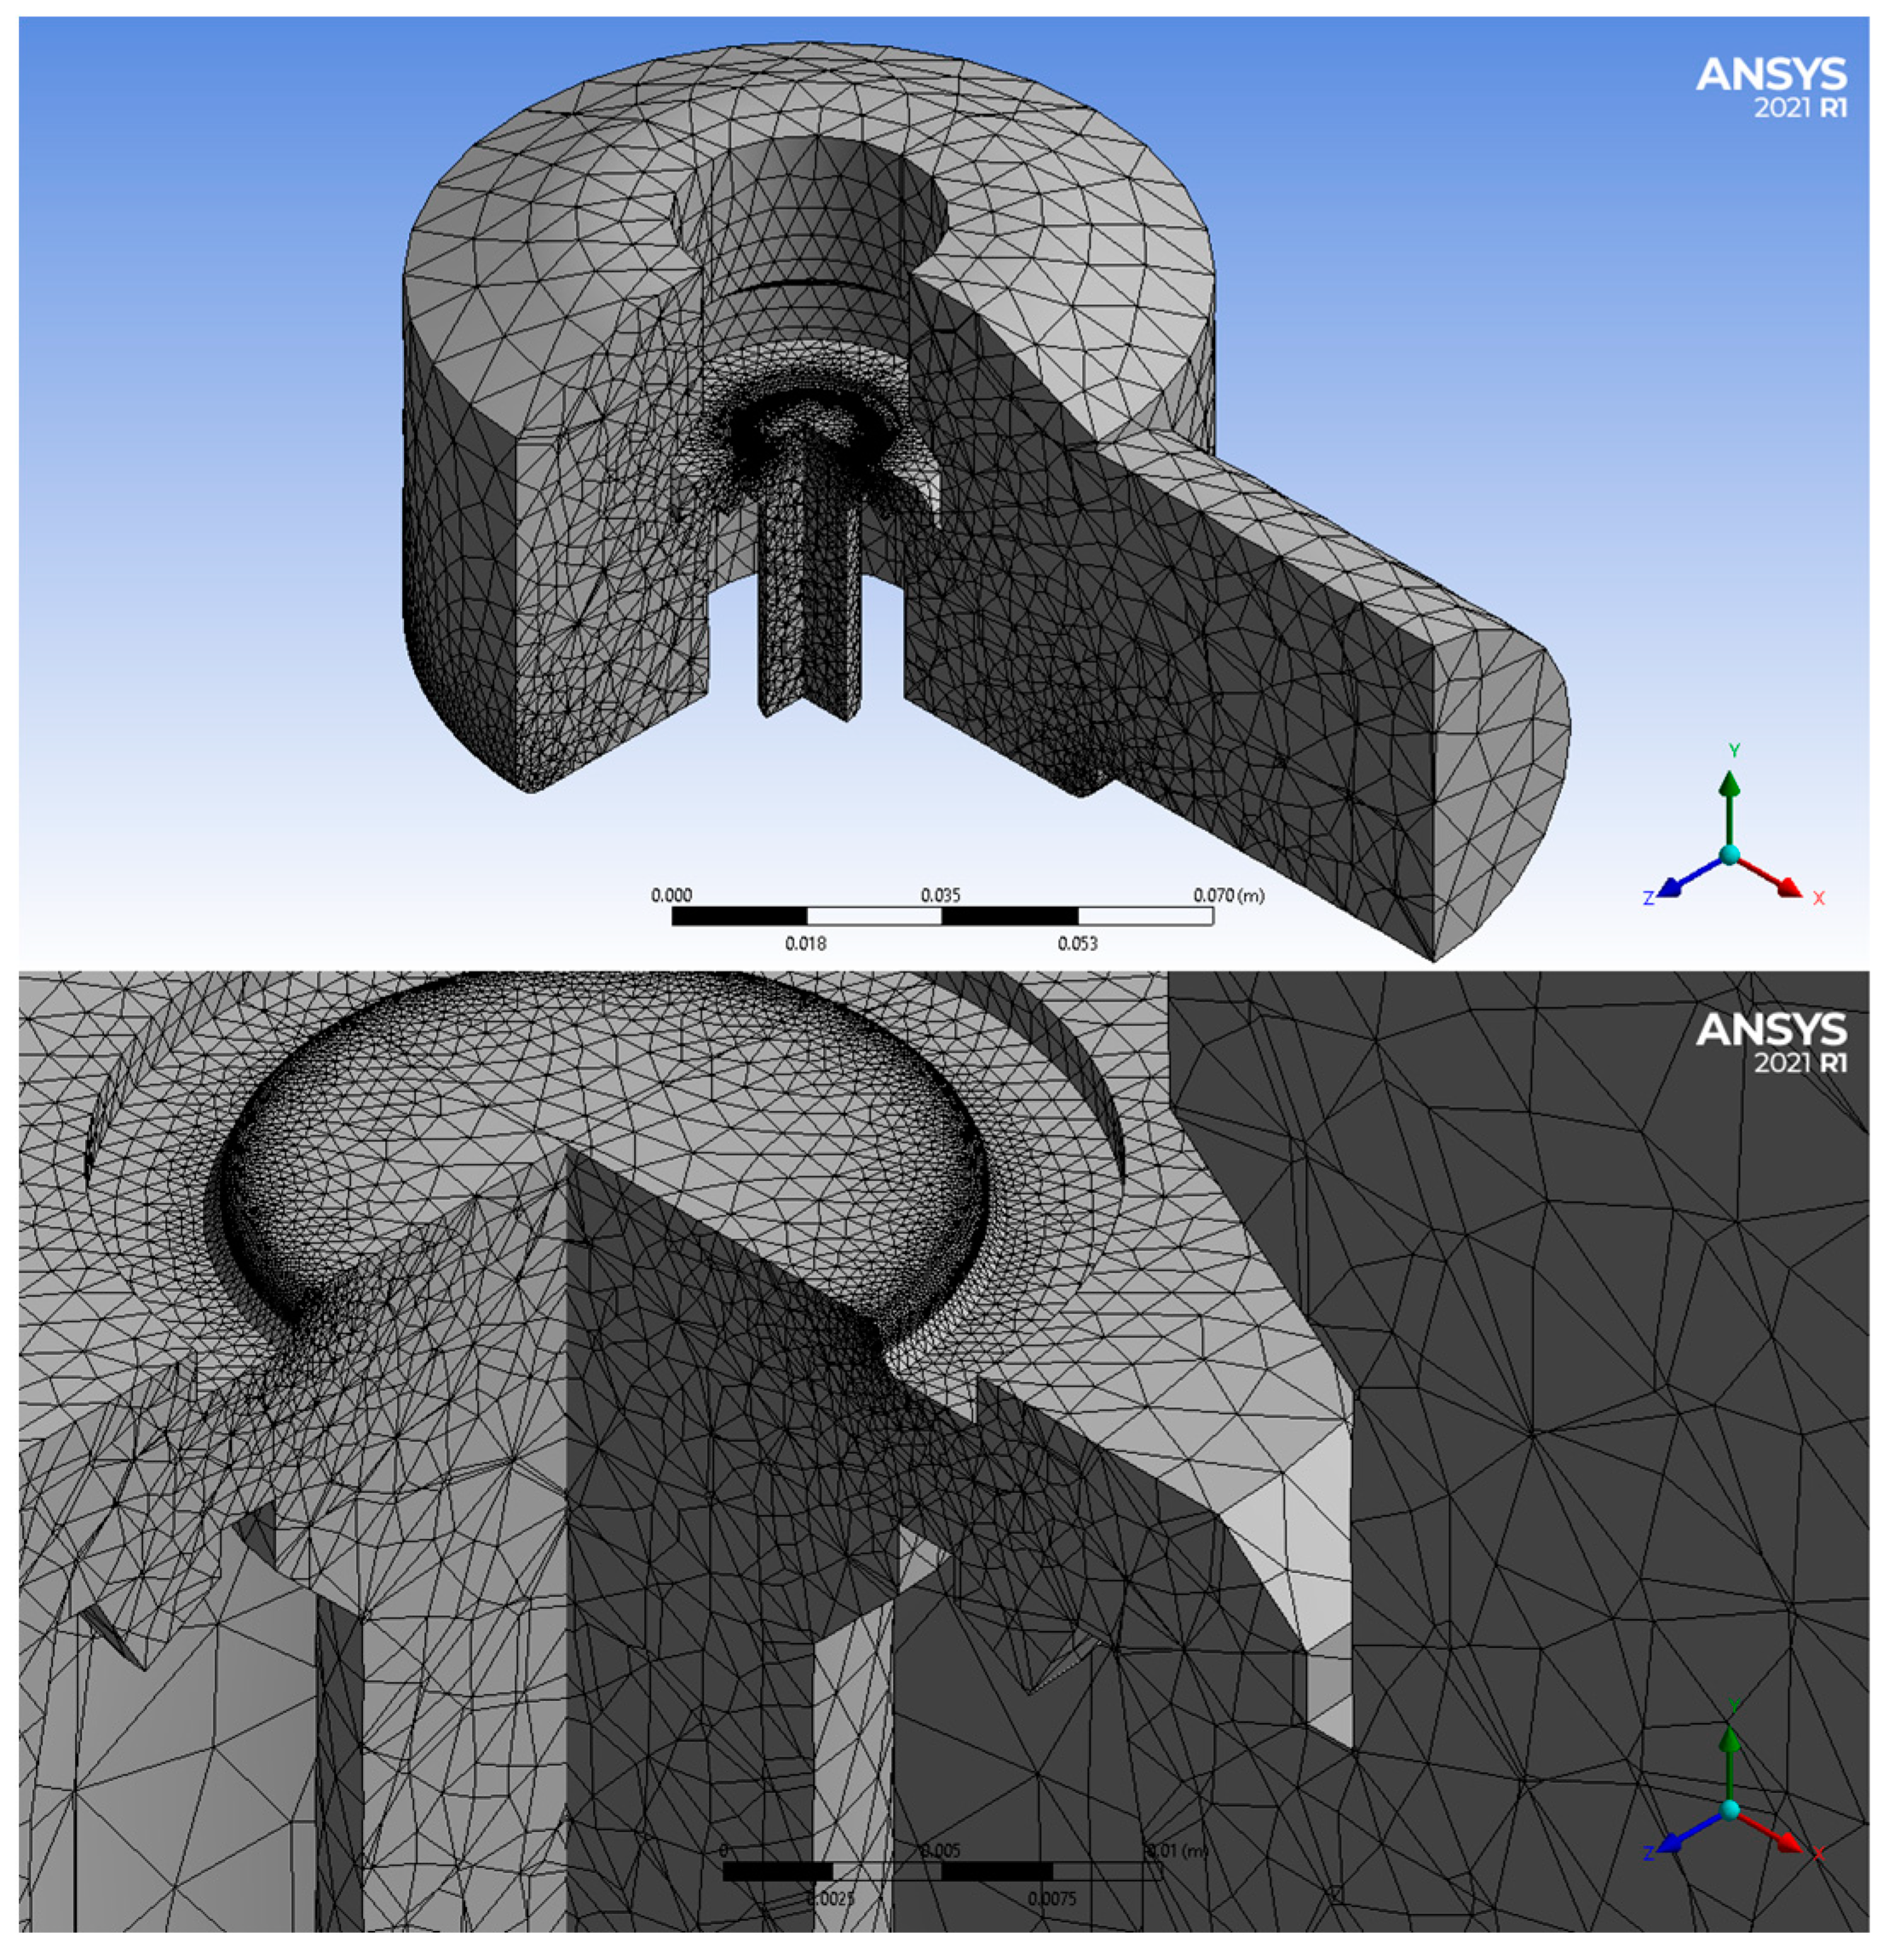
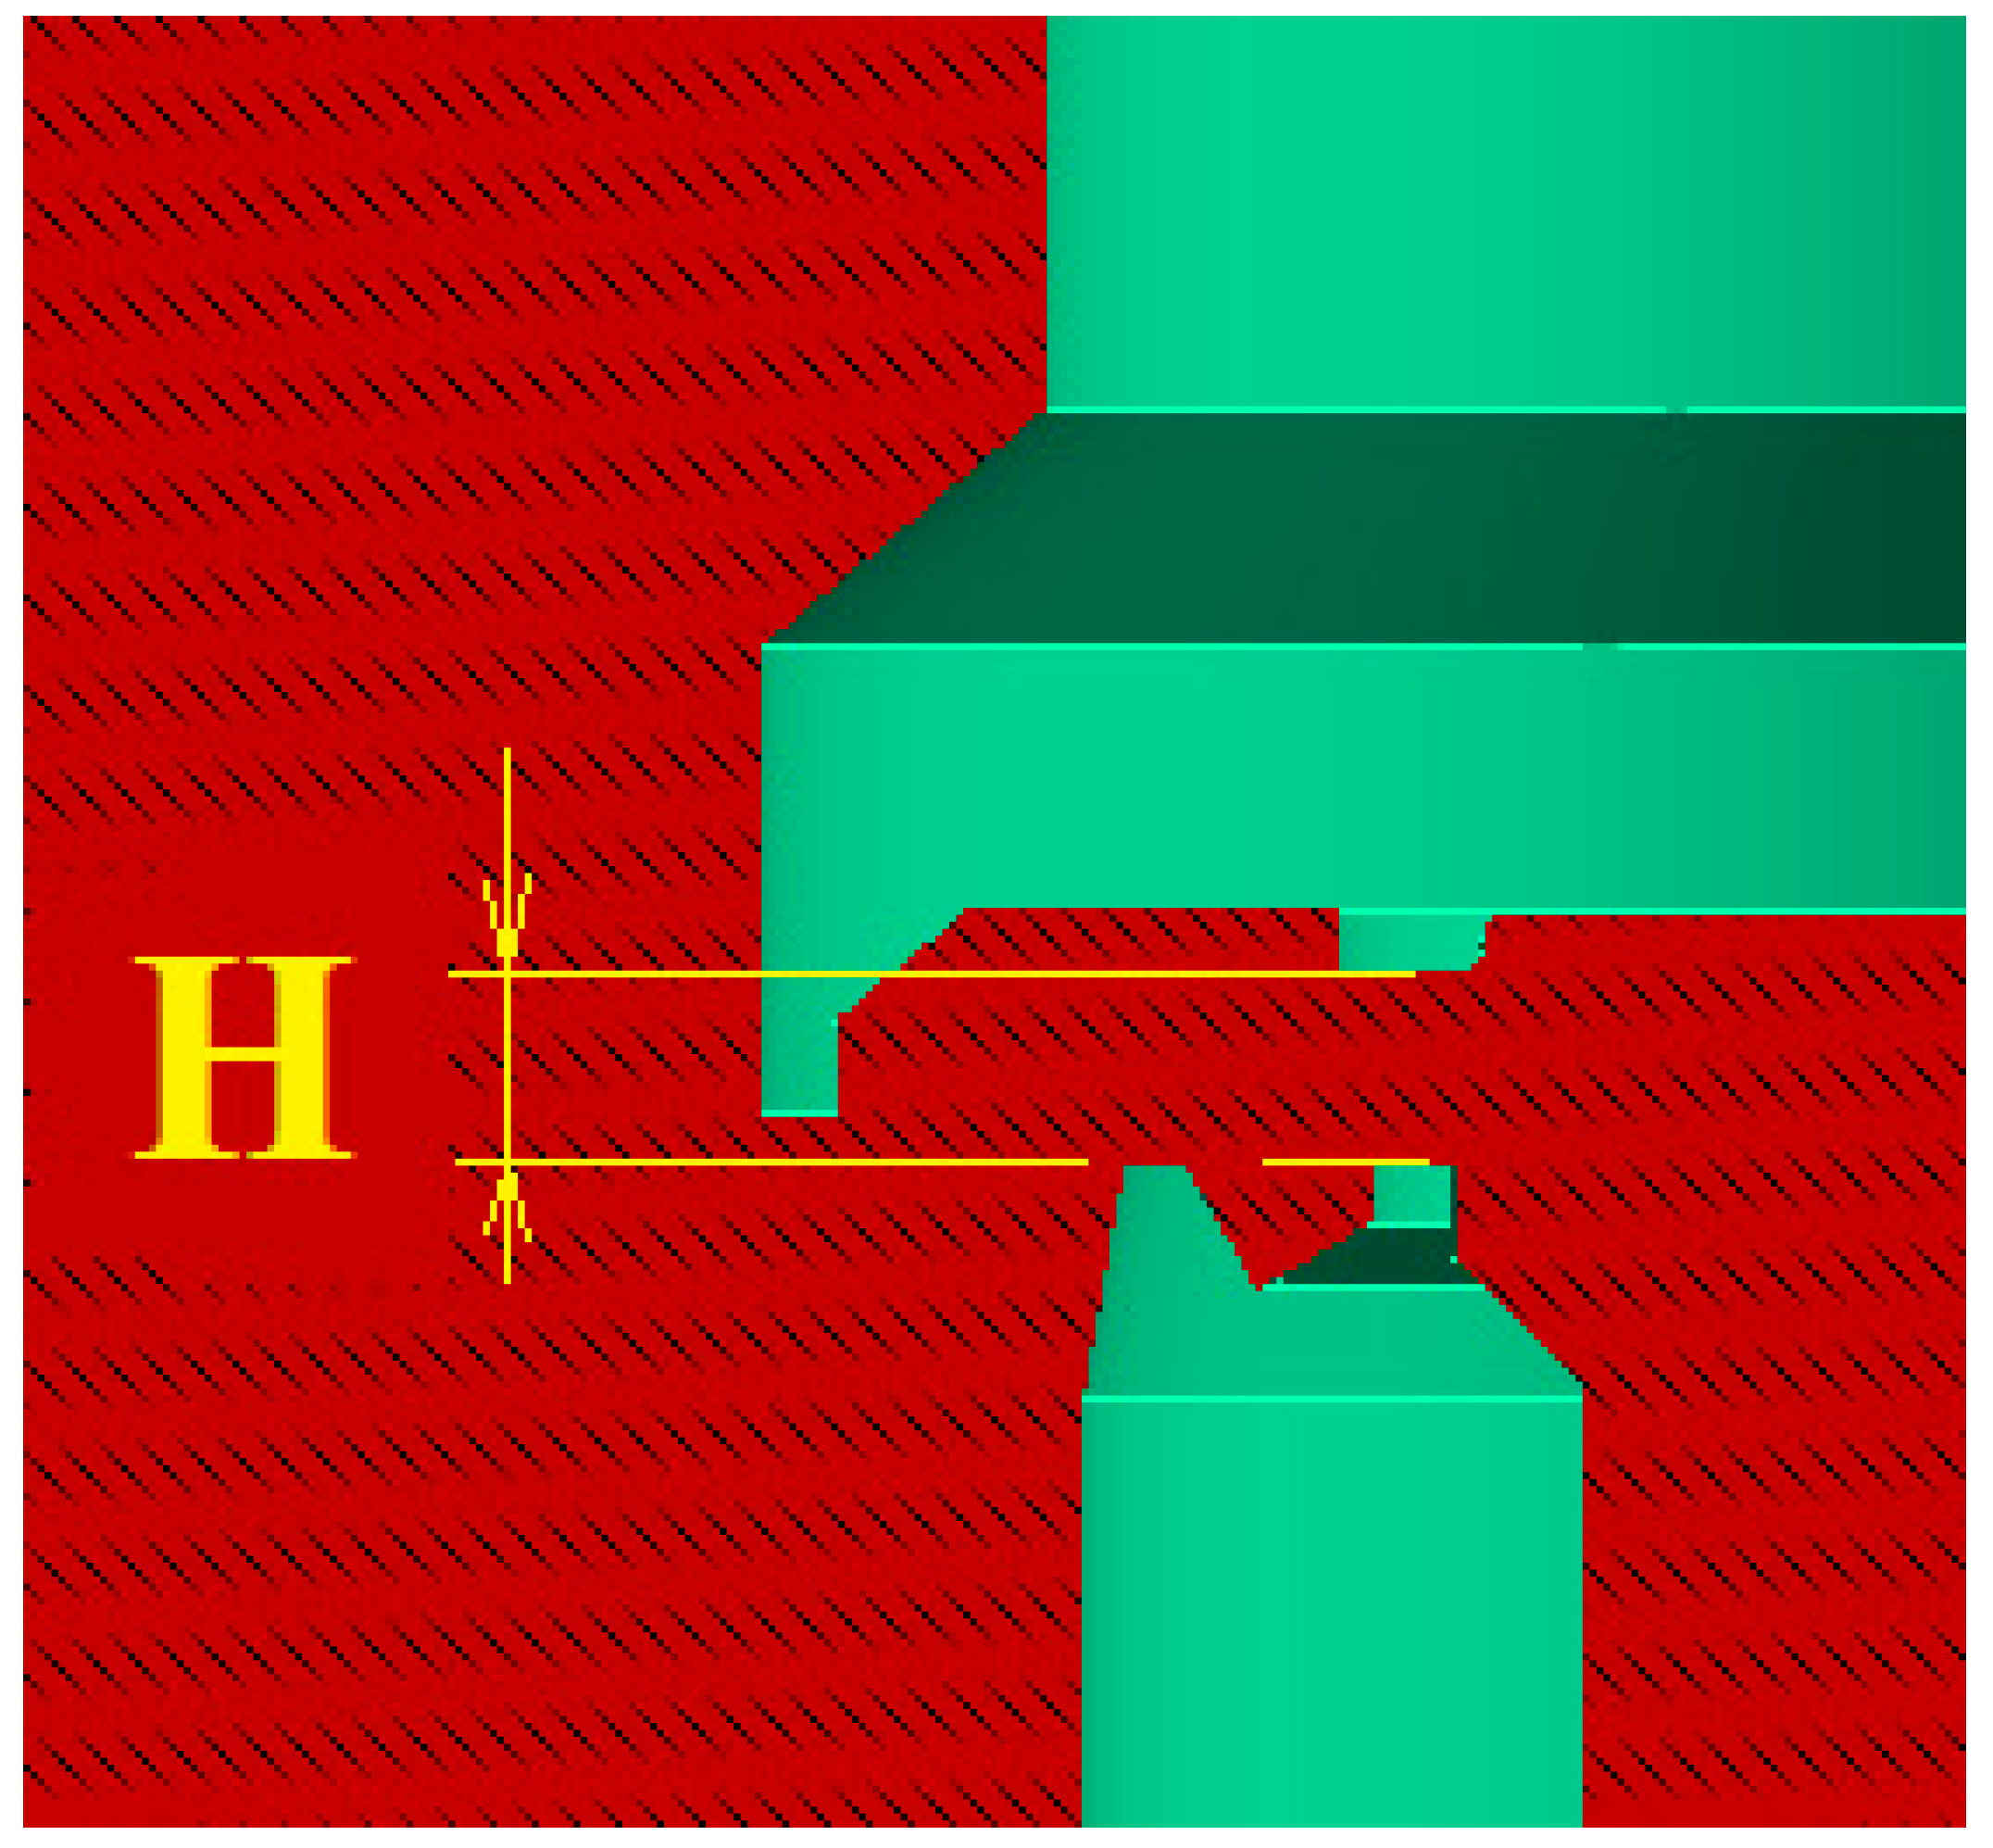
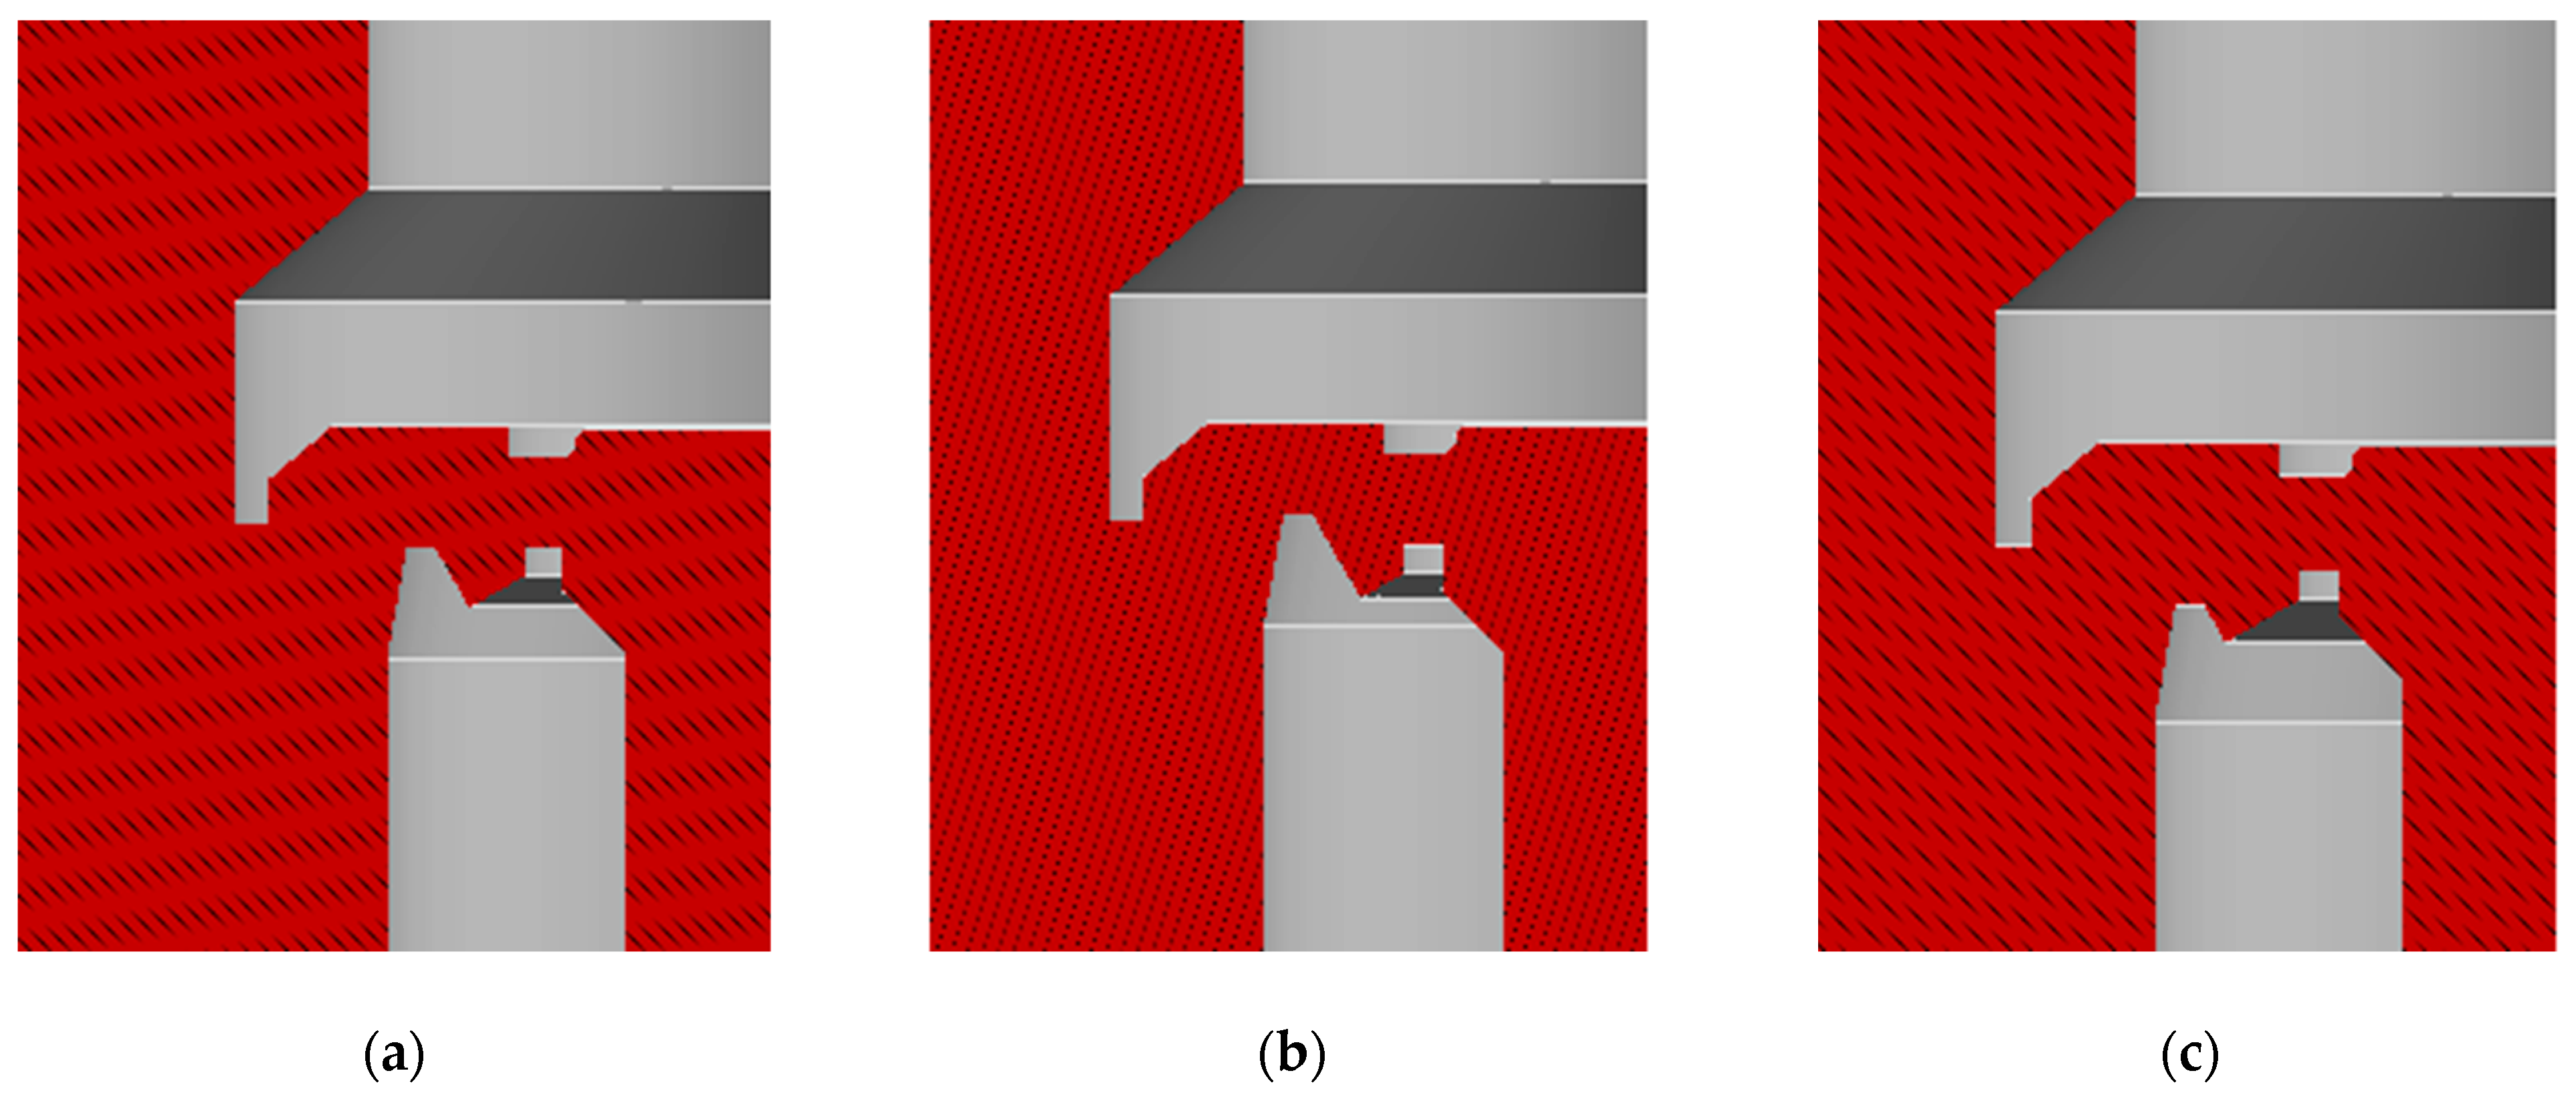
2.2. Calculation Model
2.2.1. The Forces Acting on the Plate
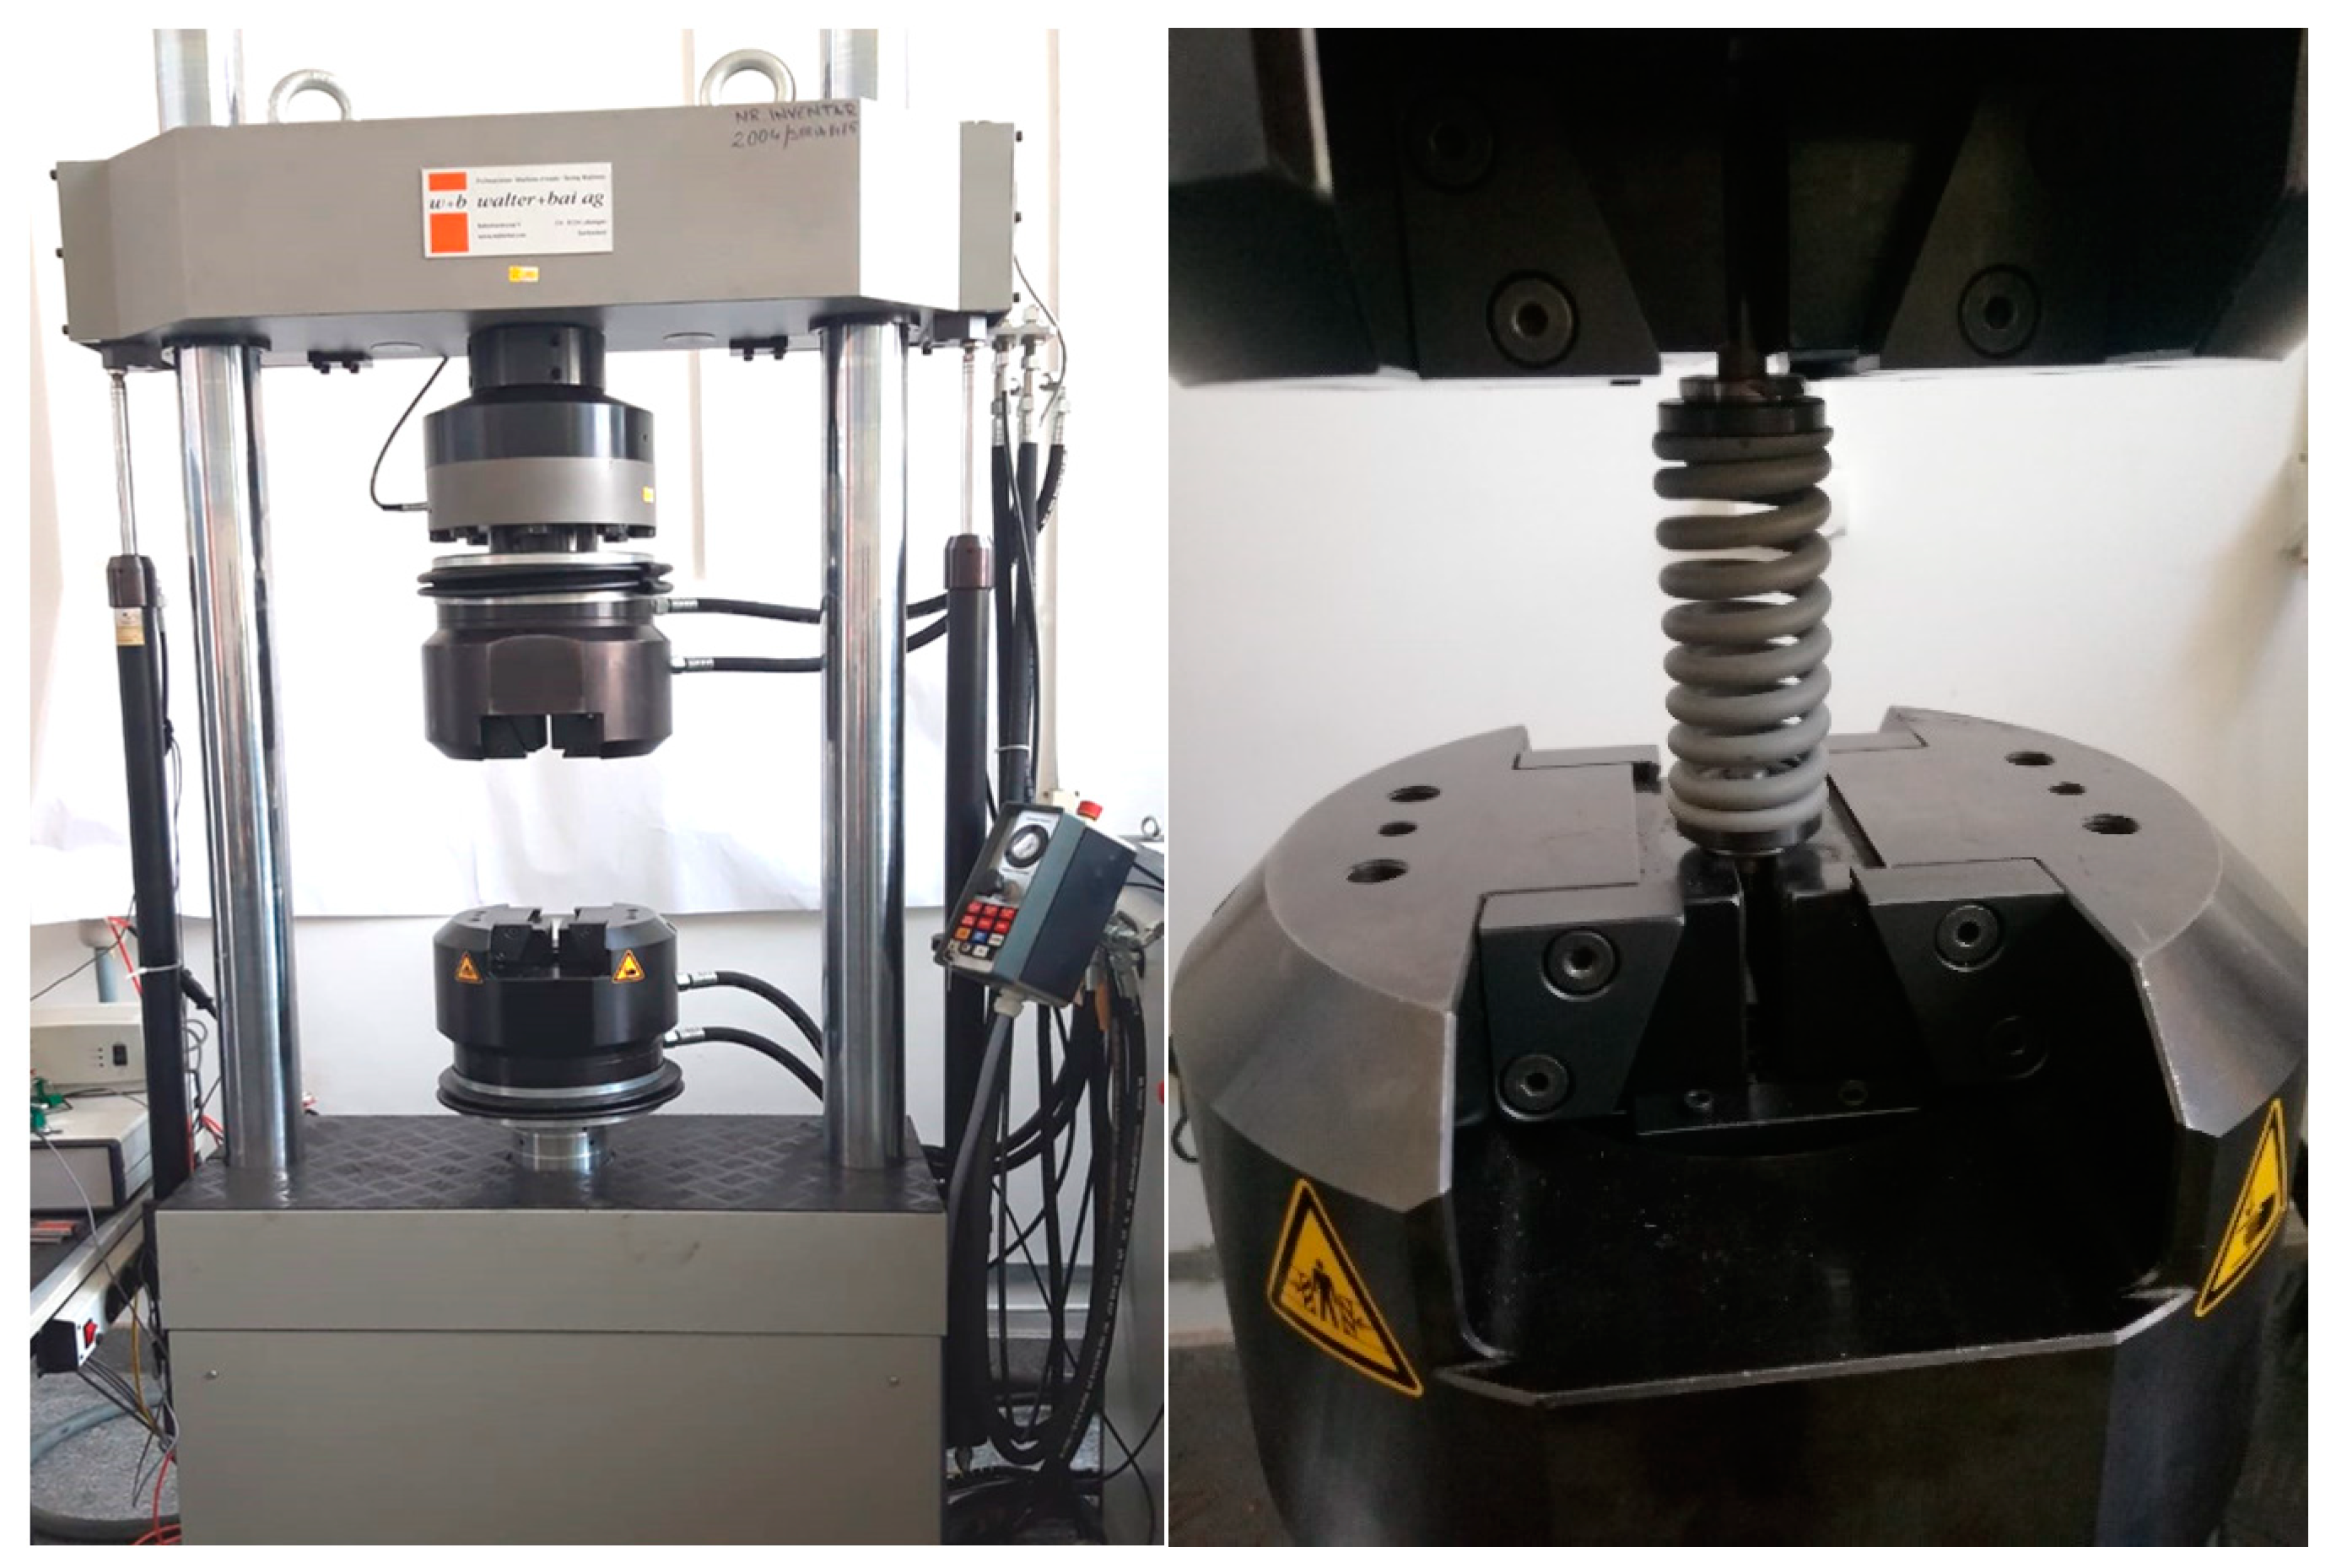
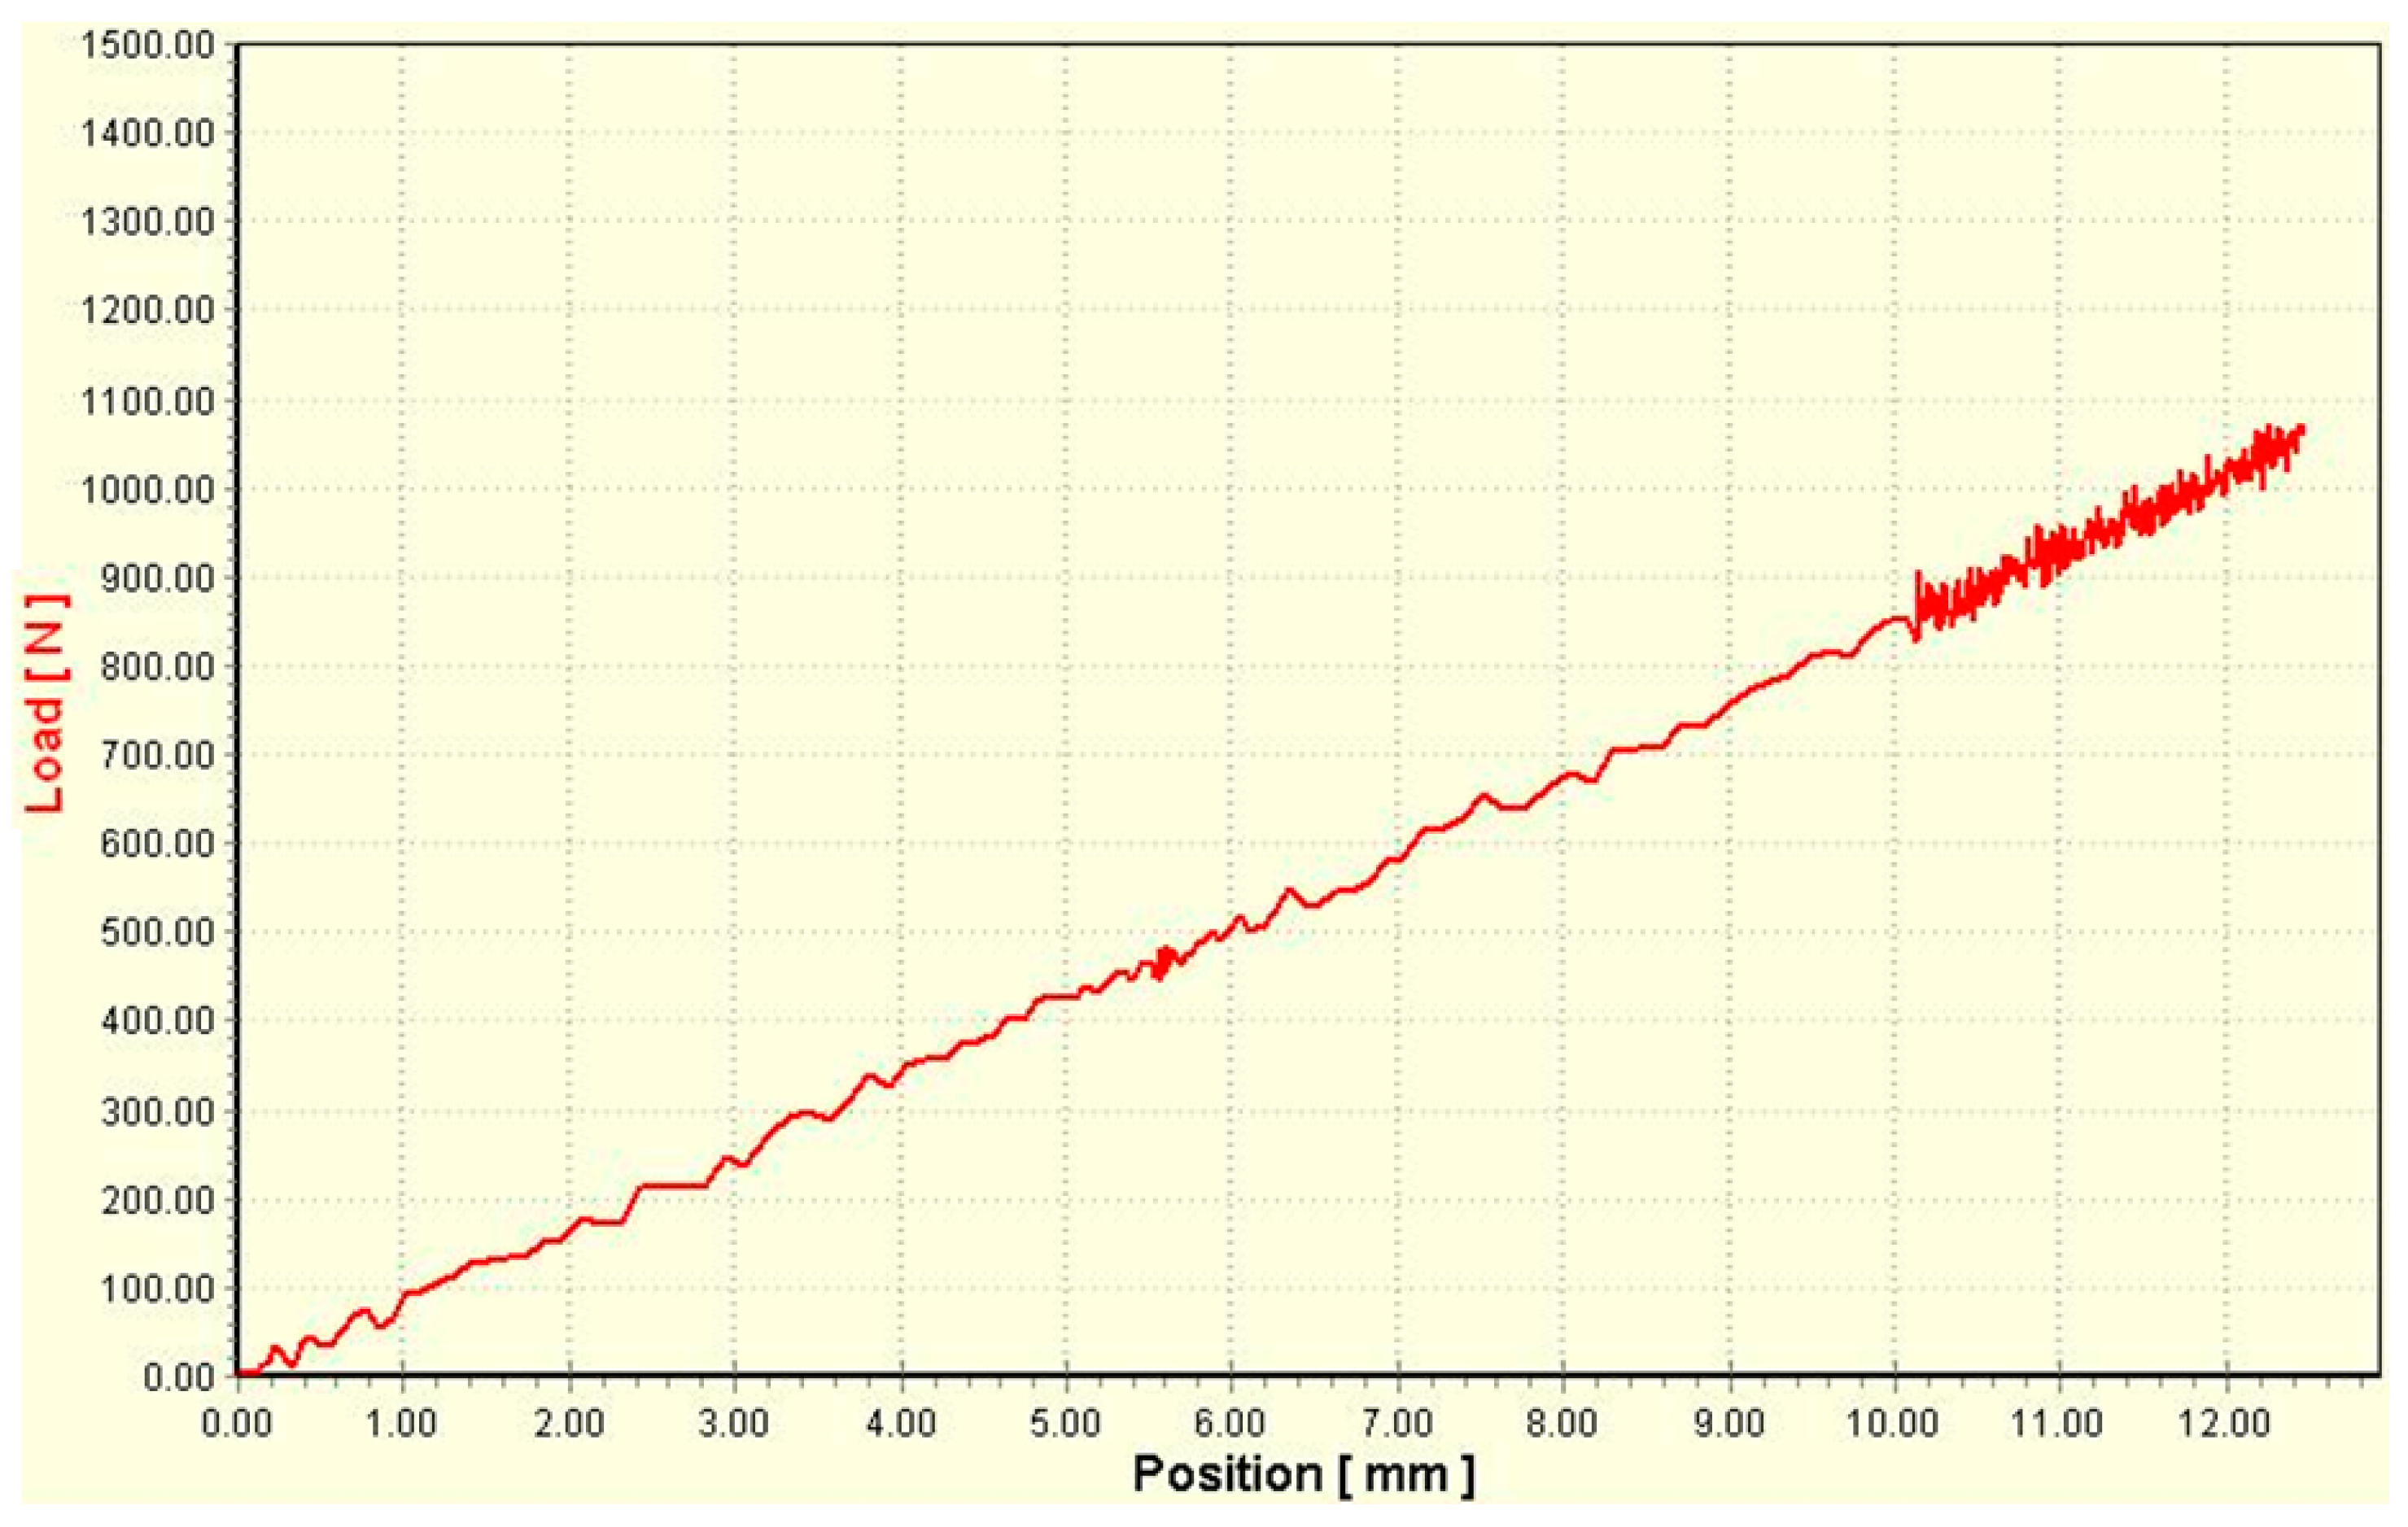
2.2.2. Establishing the Elastic Constant of the Spring
3. Results and Discussion
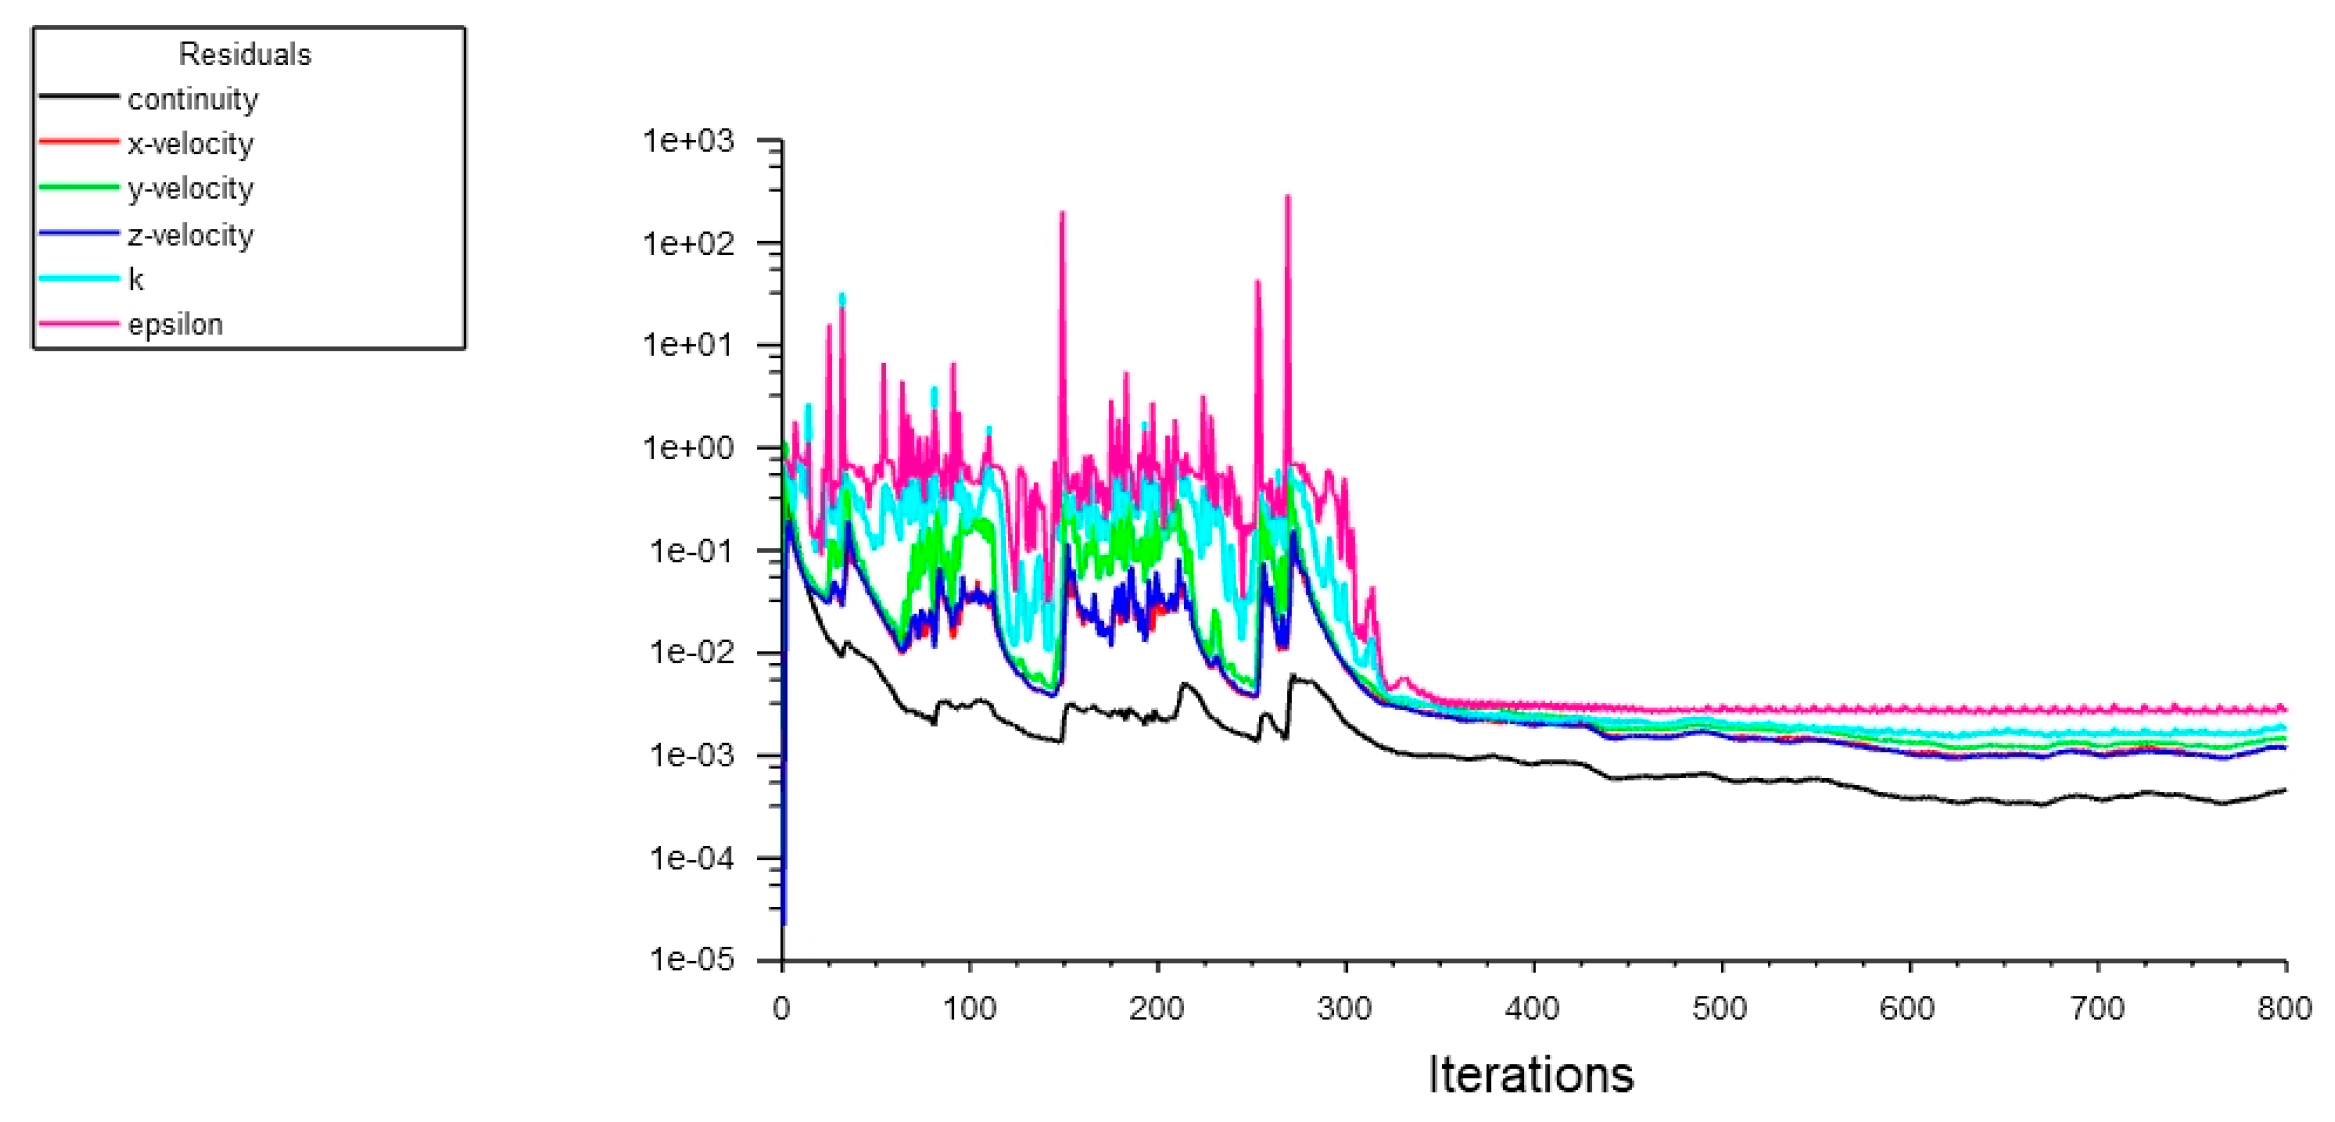
3.1. CFD Analysis
3.2. Statistical Analysis
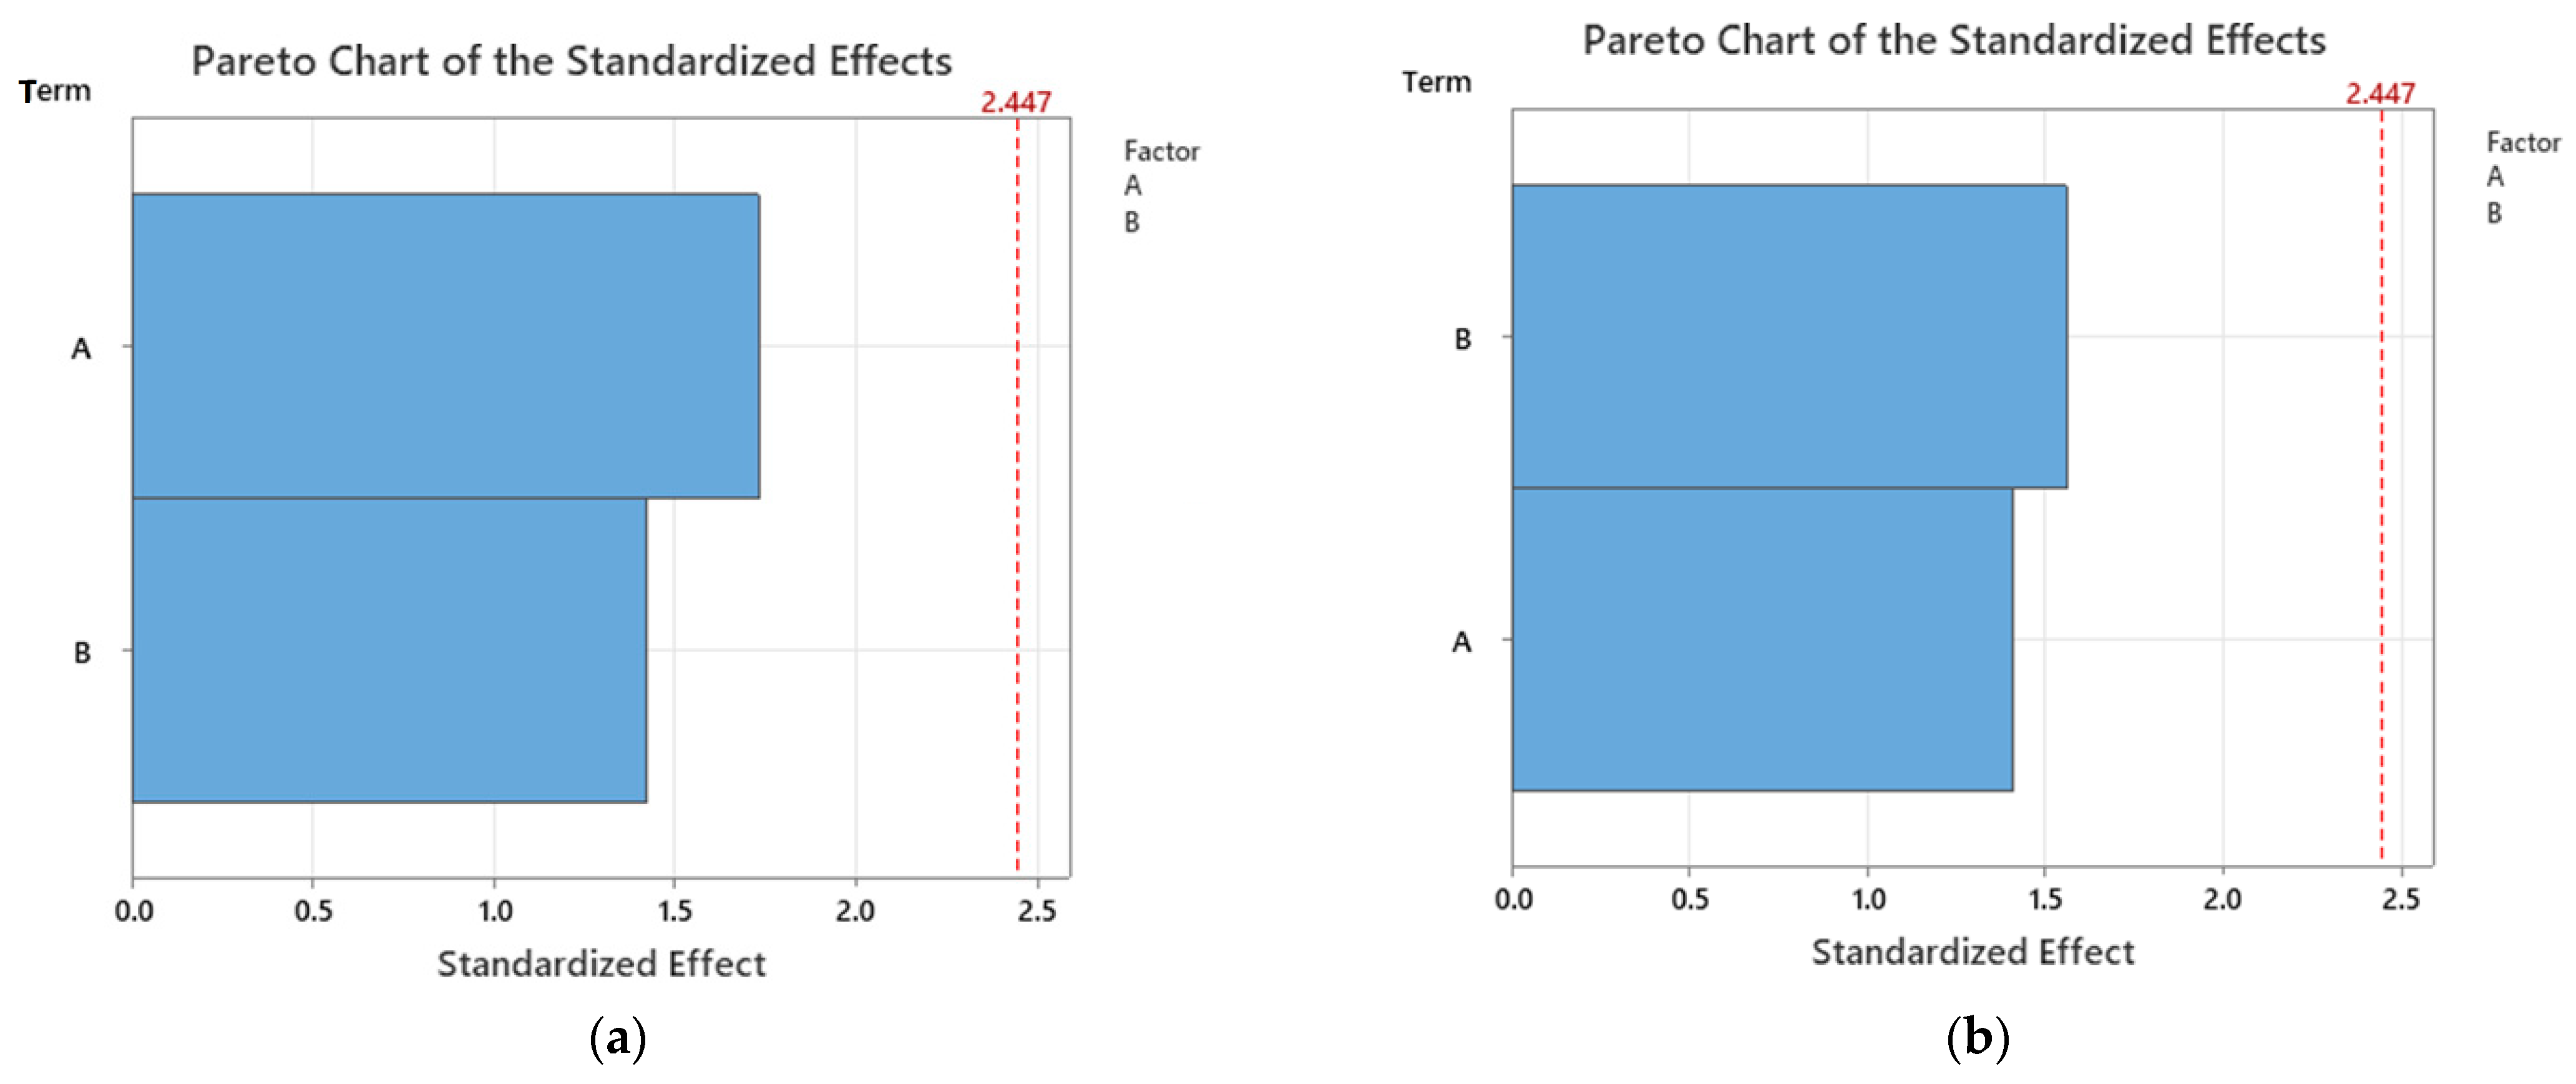
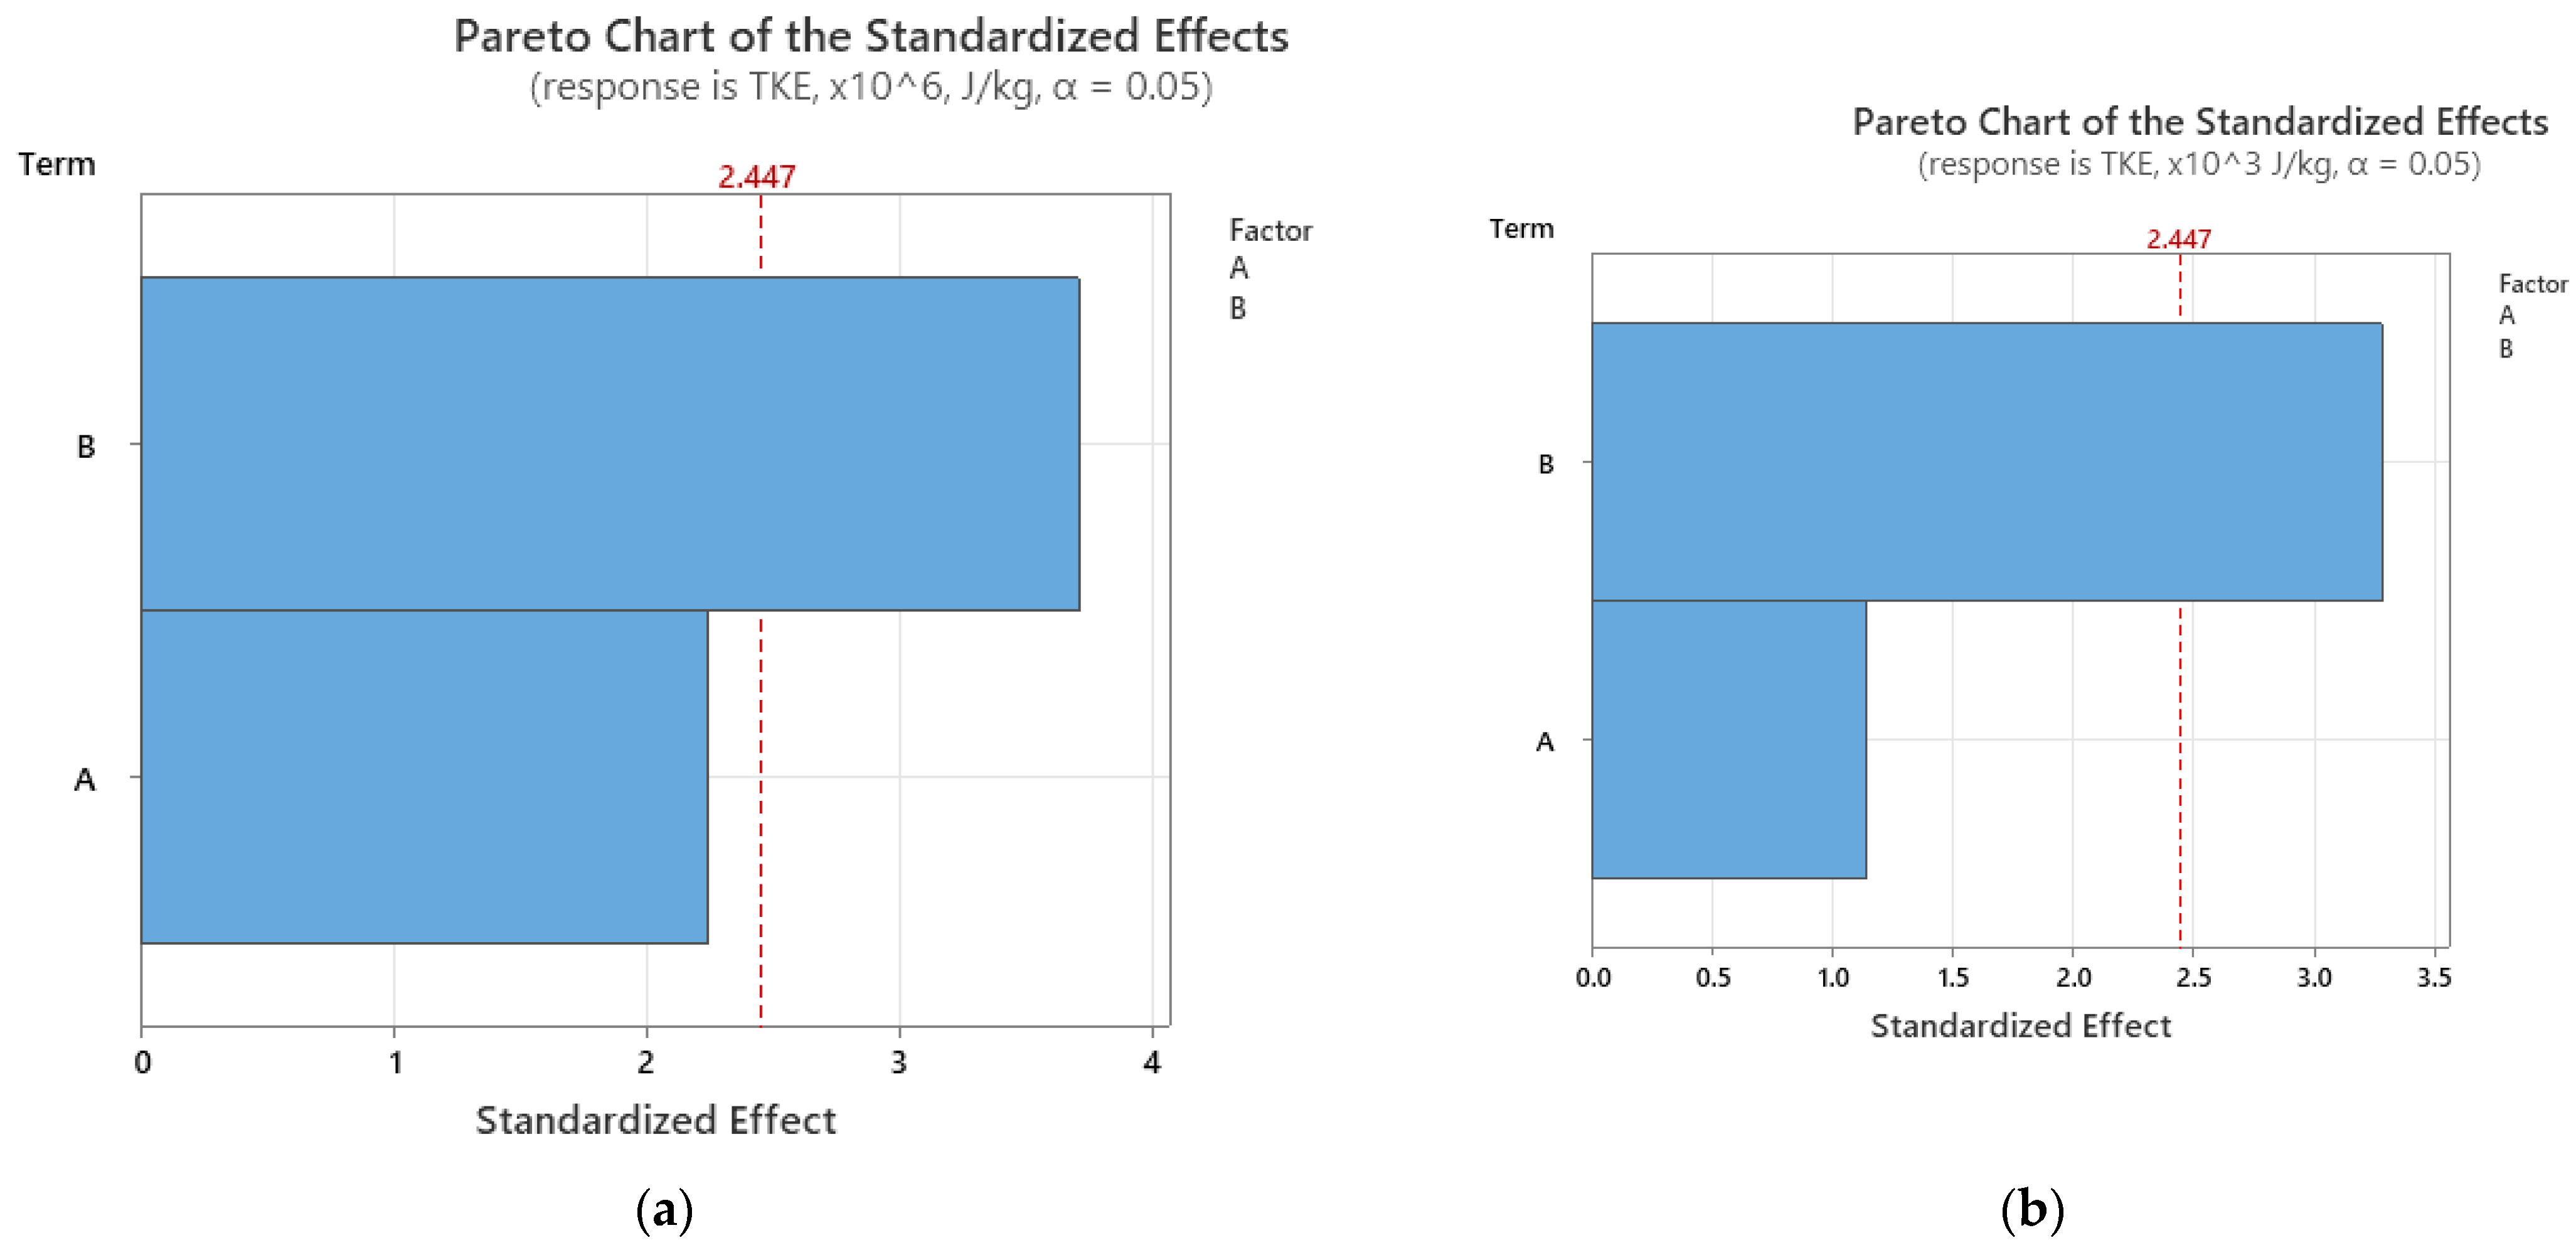
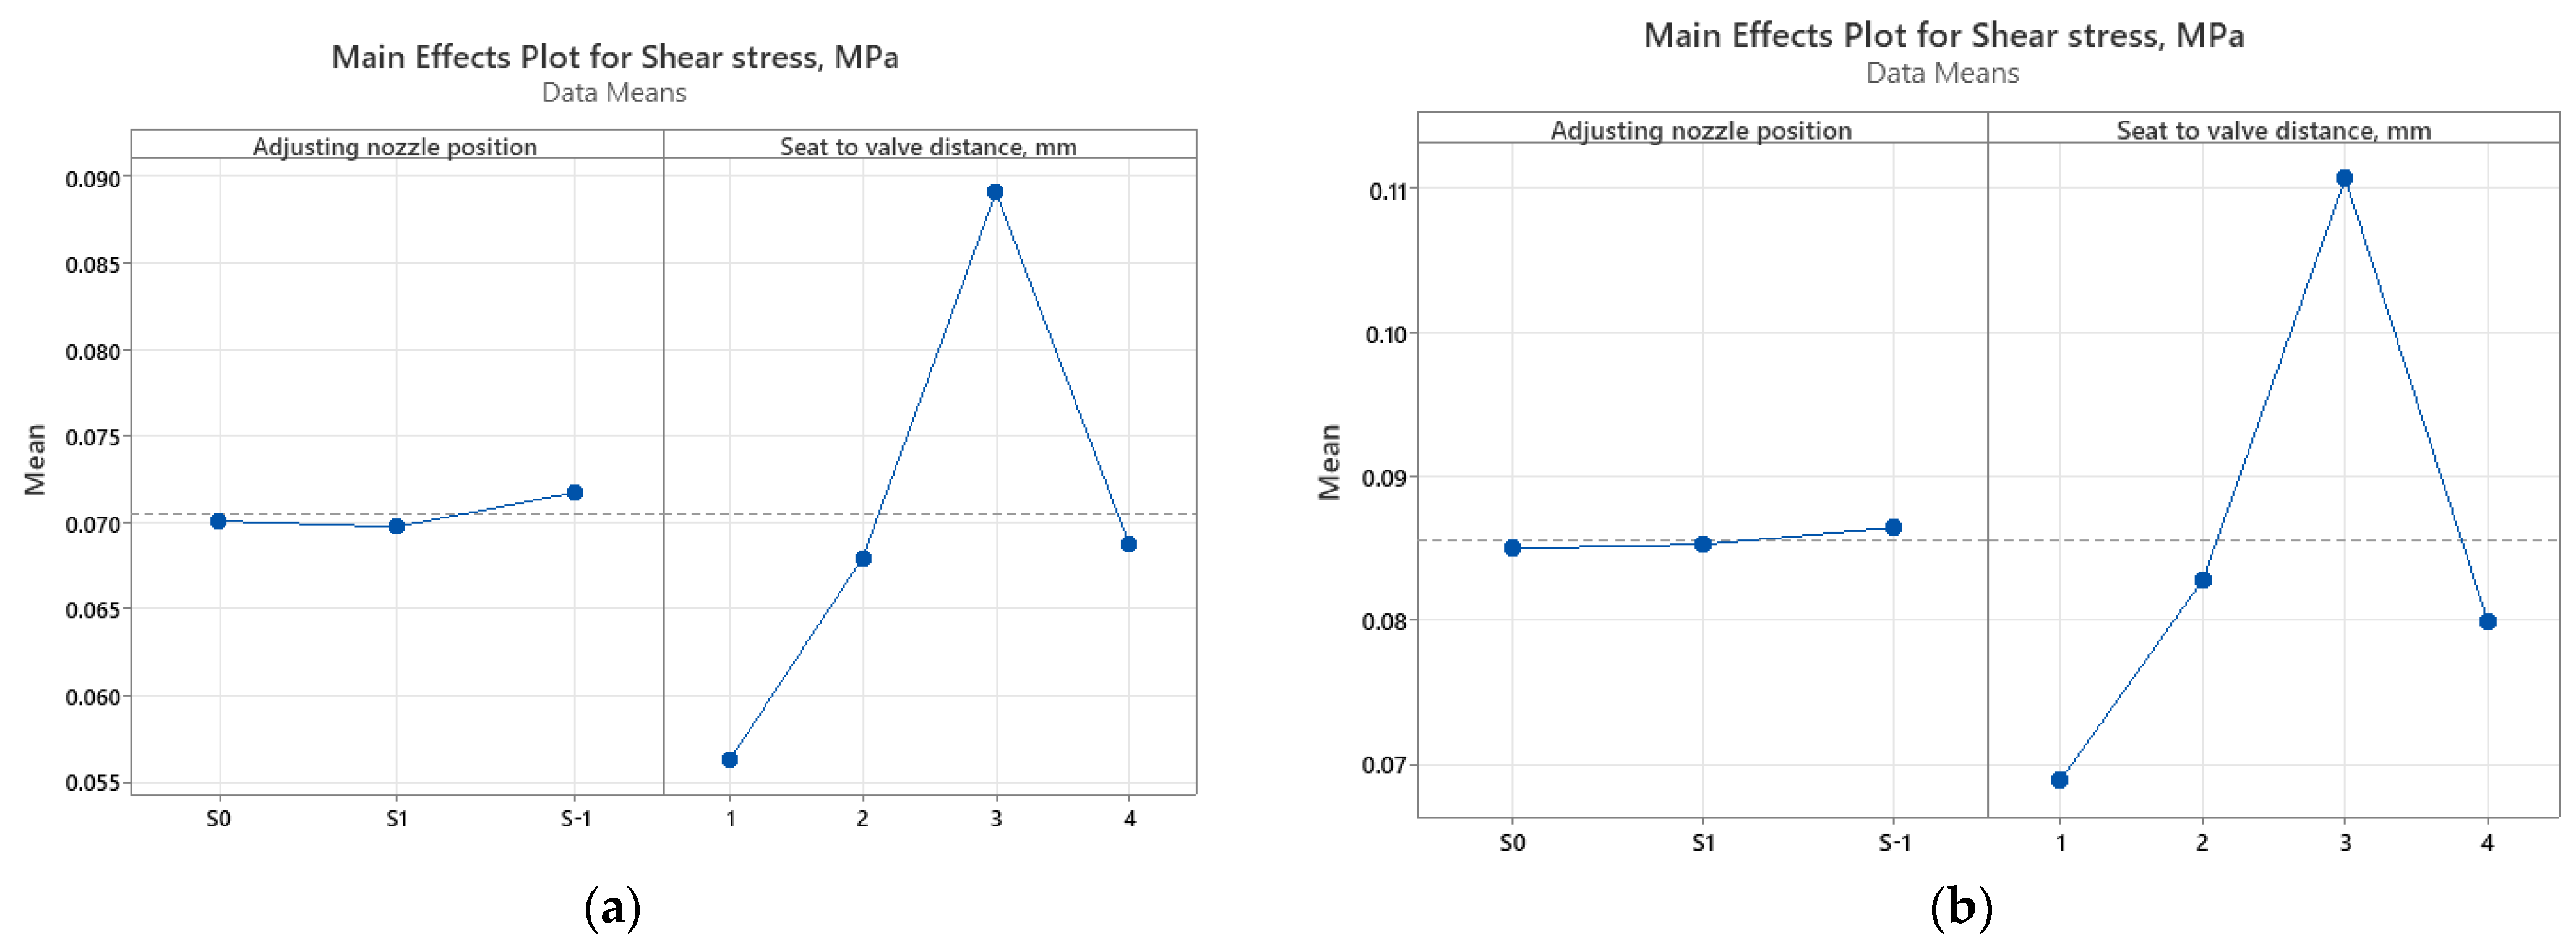
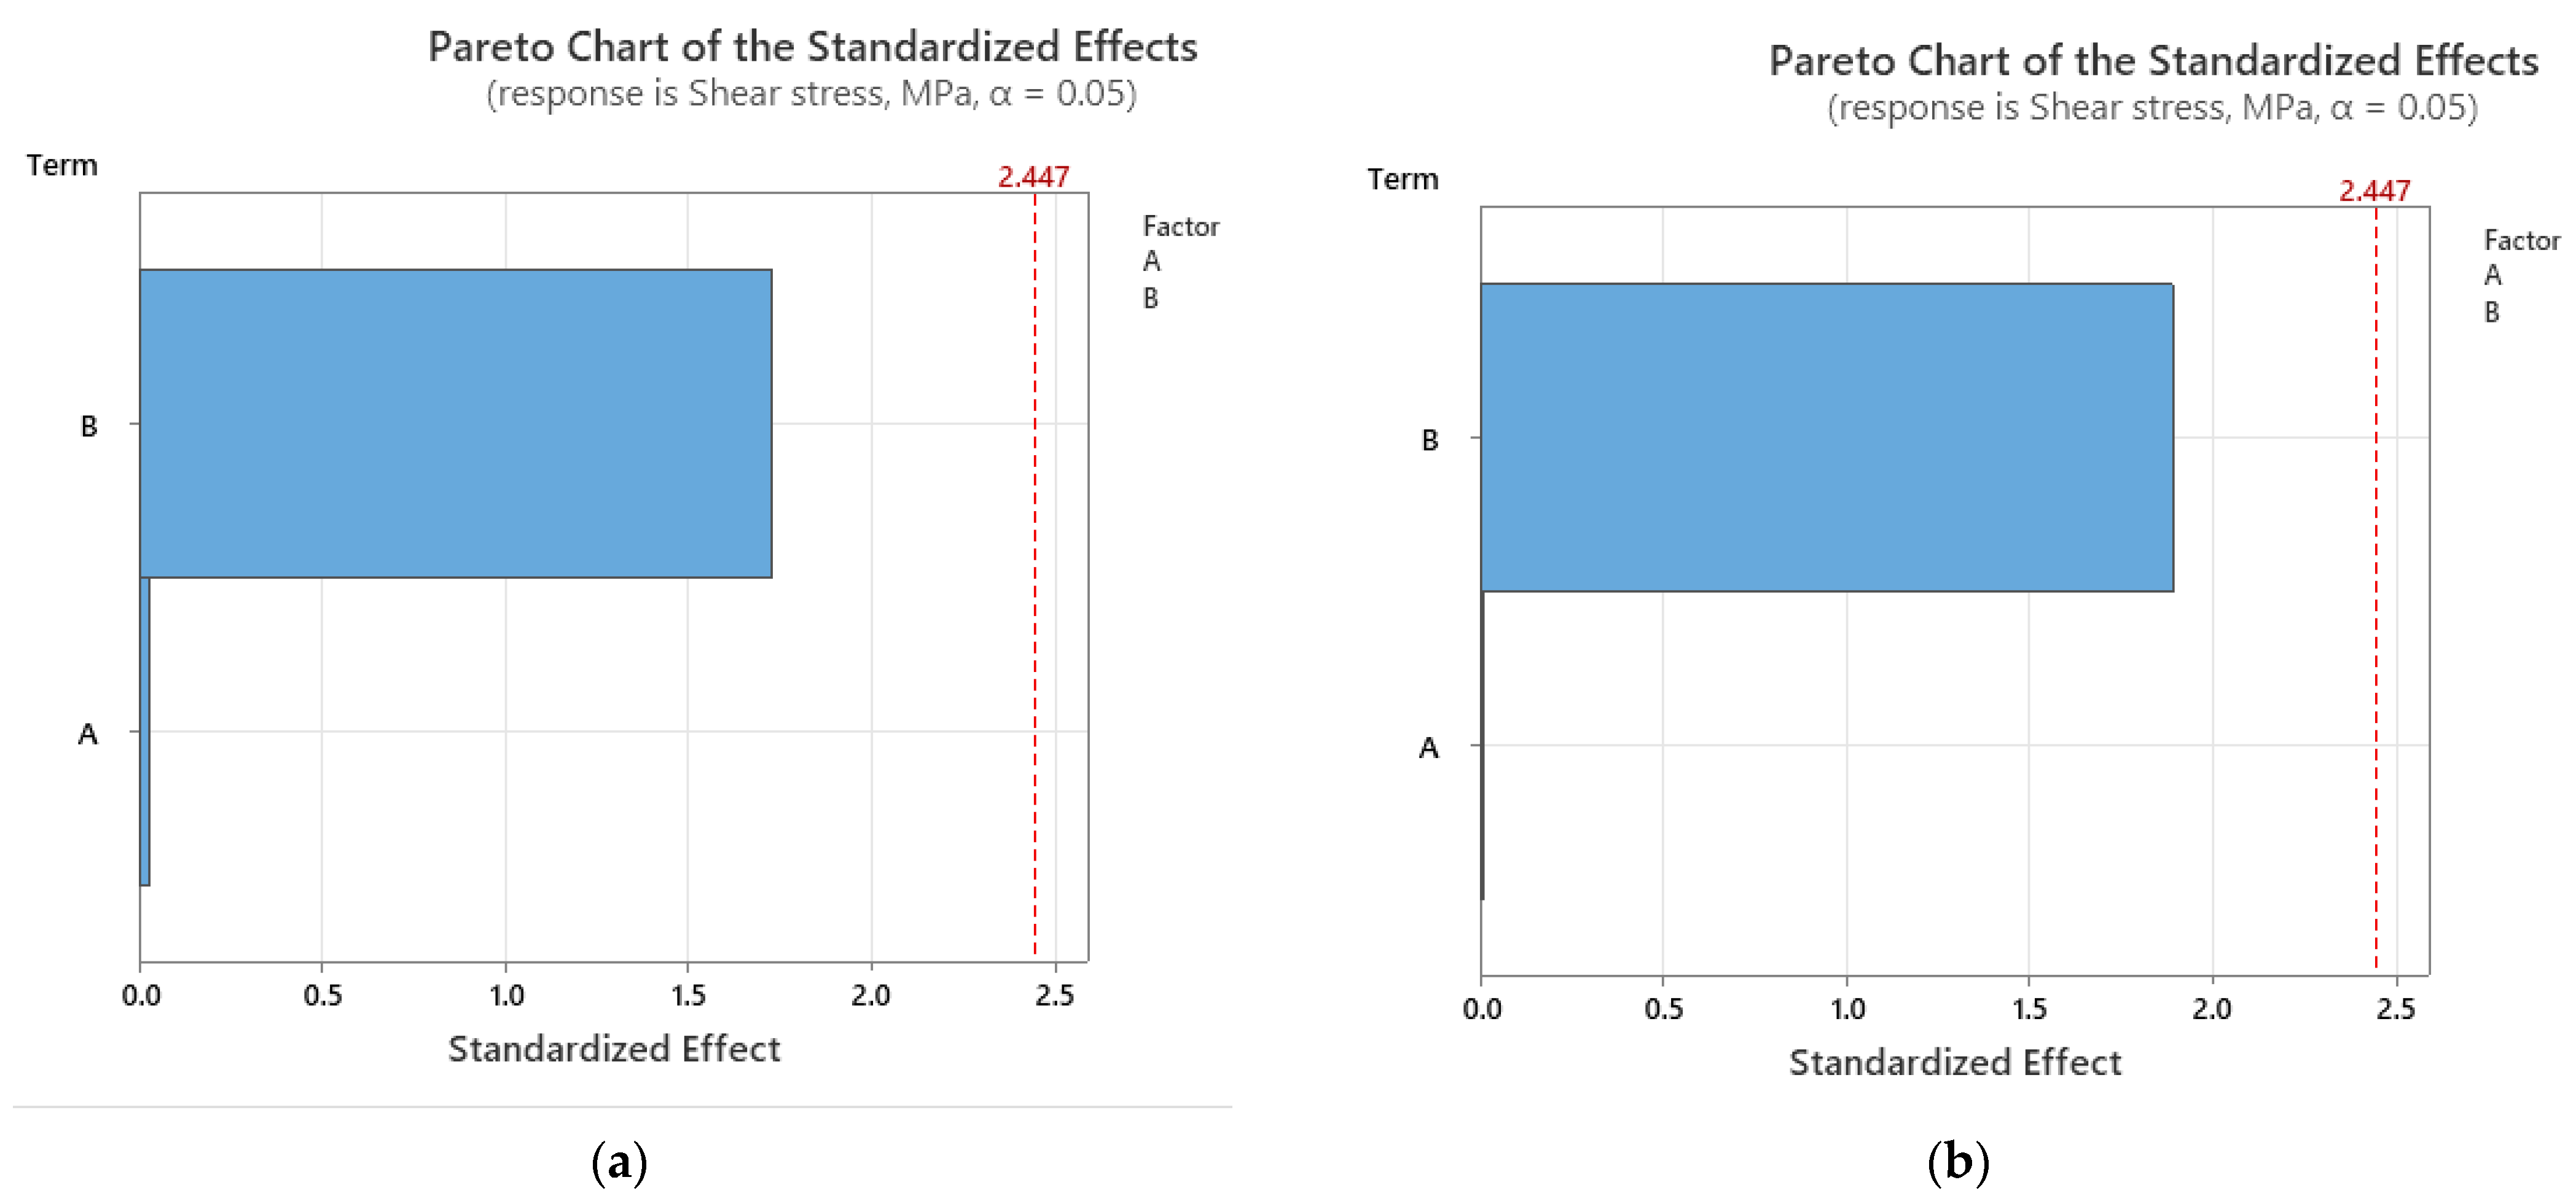
3.2.1. The Relative Significance of Input Parameters
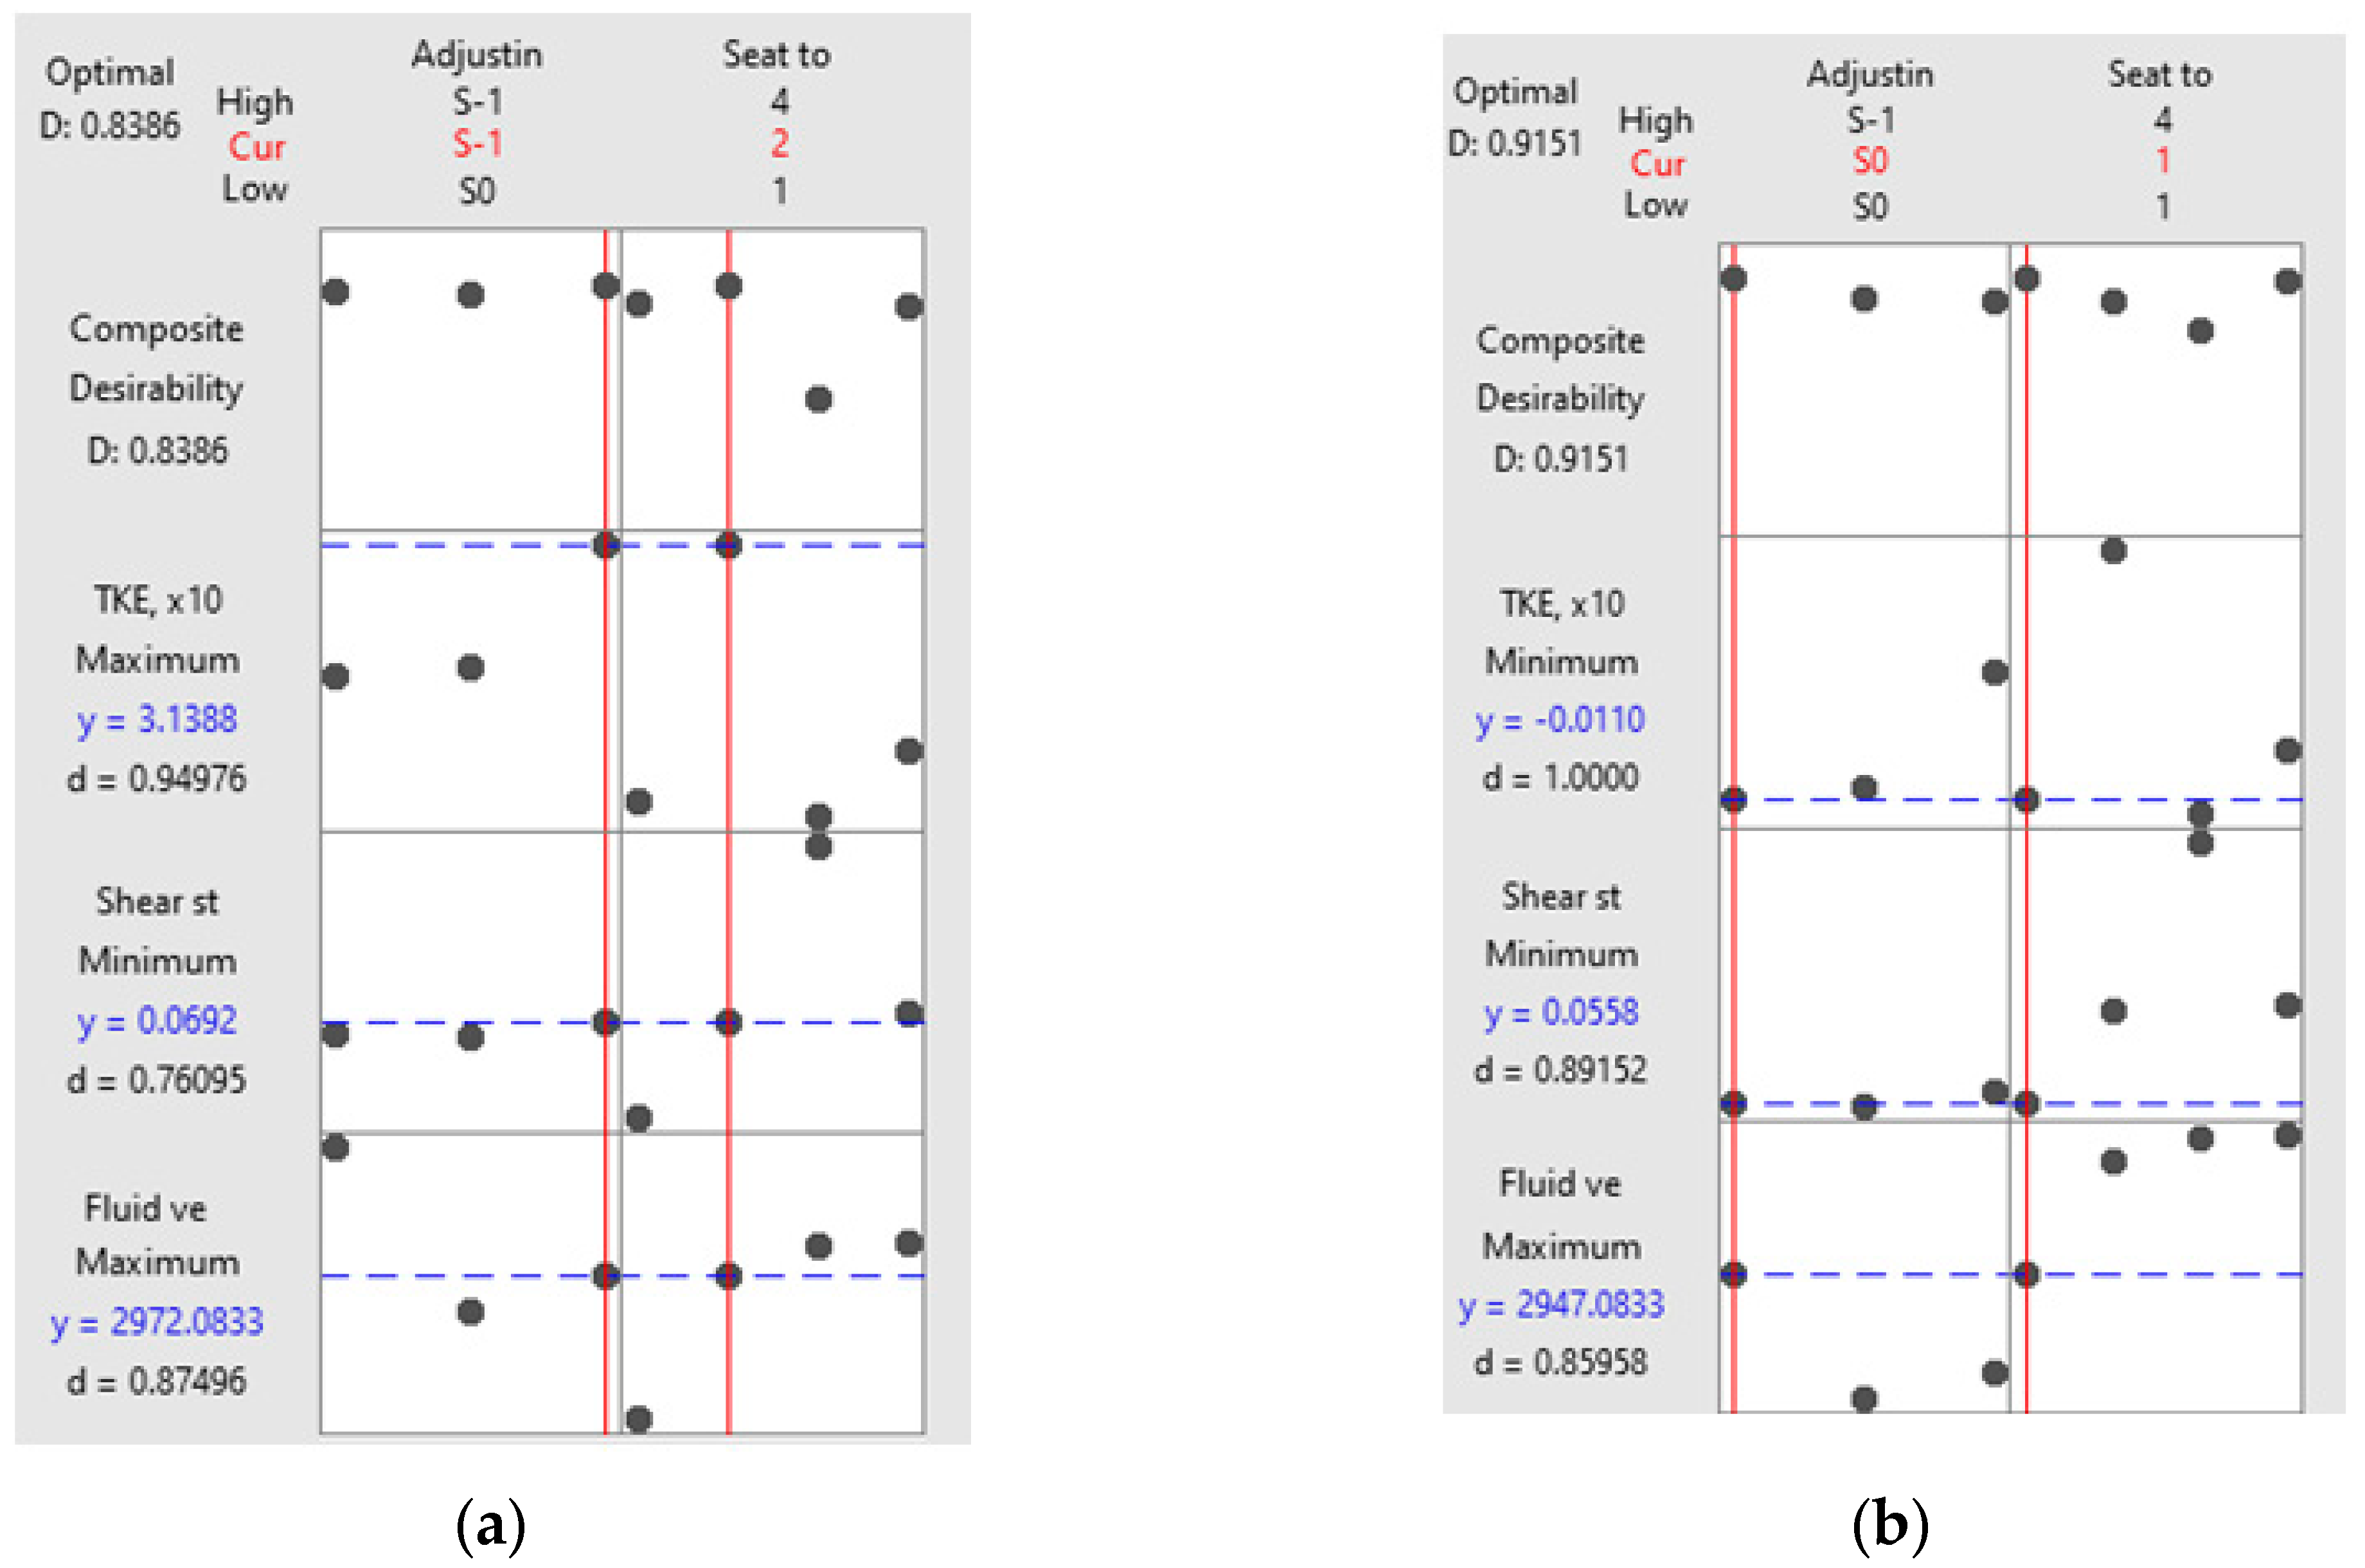
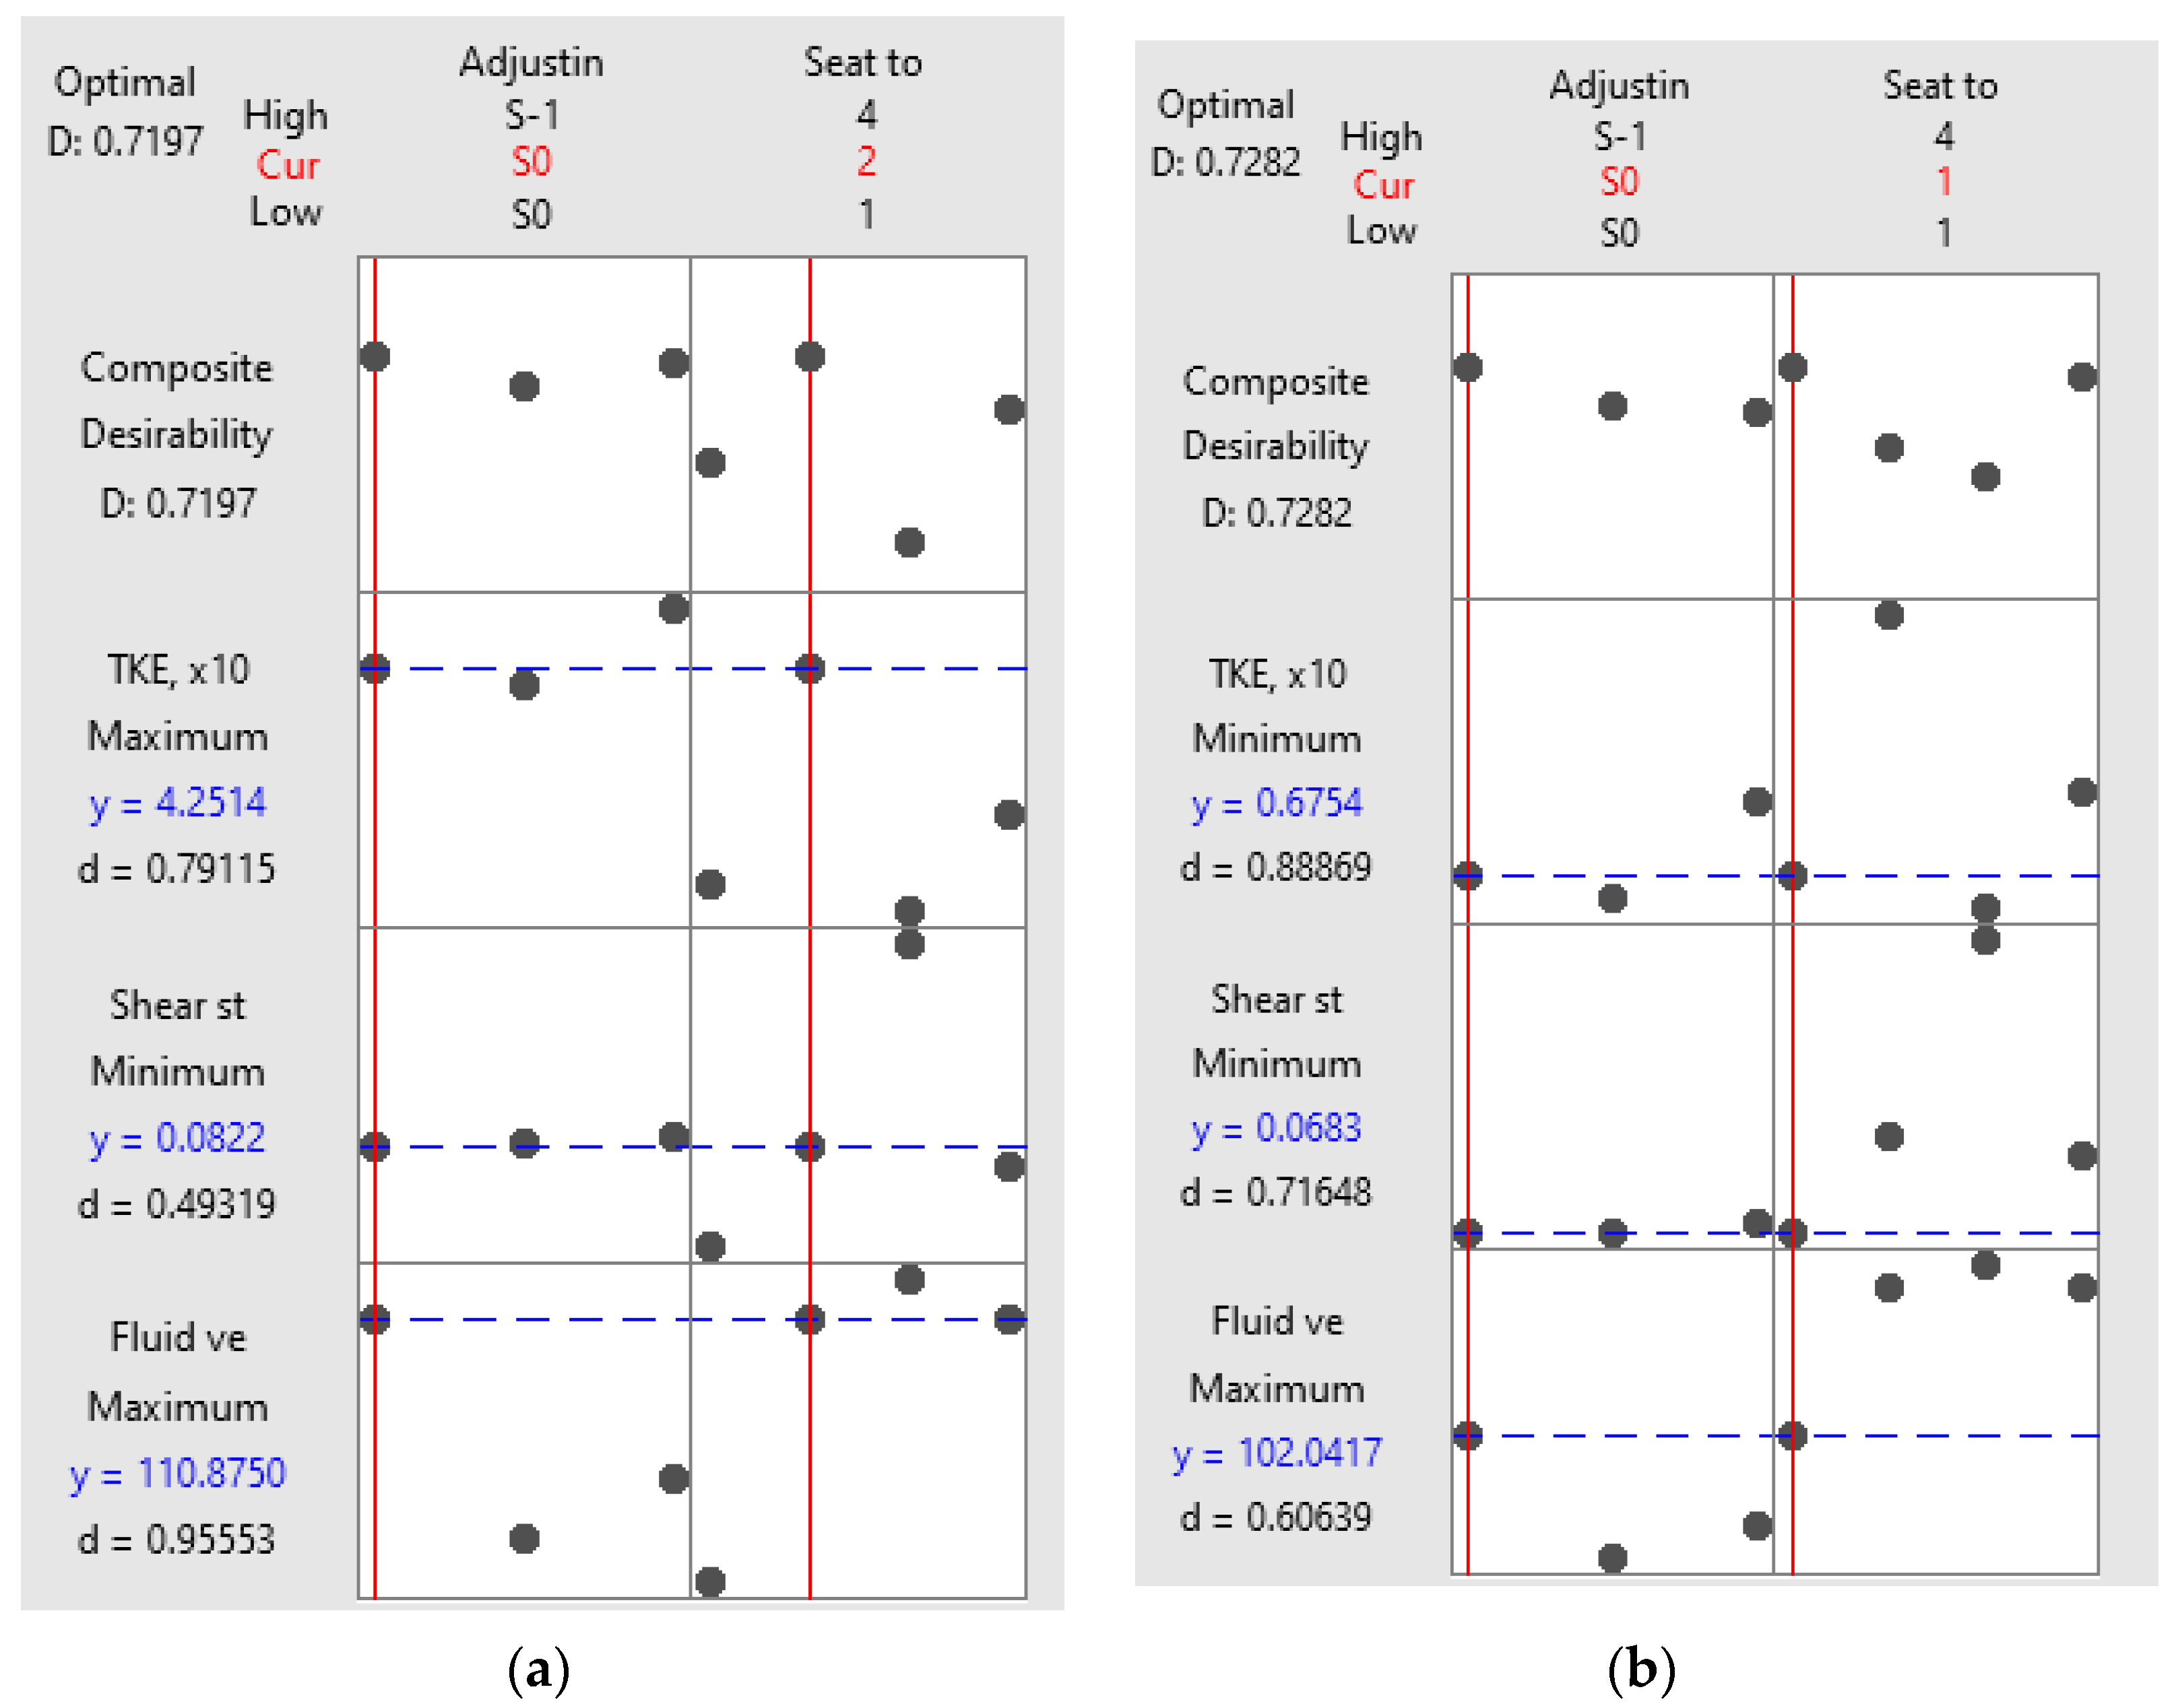
3.2.2. Multi-Response Optimization Using Desirability Function
- -
- when the goal is to maximize the response desirability:
- -
- when the goal is to minimize the response desirability:
- ✓
- for the air environment: S-1/H2 for “greater is better” option of turbulent kinetic energy and S0/H1 for “smaller is better” option of turbulent kinetic energy;
- ✓
- for the water environment: S0/H2 for “greater is better” option of turbulent kinetic energy and S0/H1 for “smaller is better” option of turbulent kinetic energy.
3.3. Synthesis of Results
- ✓
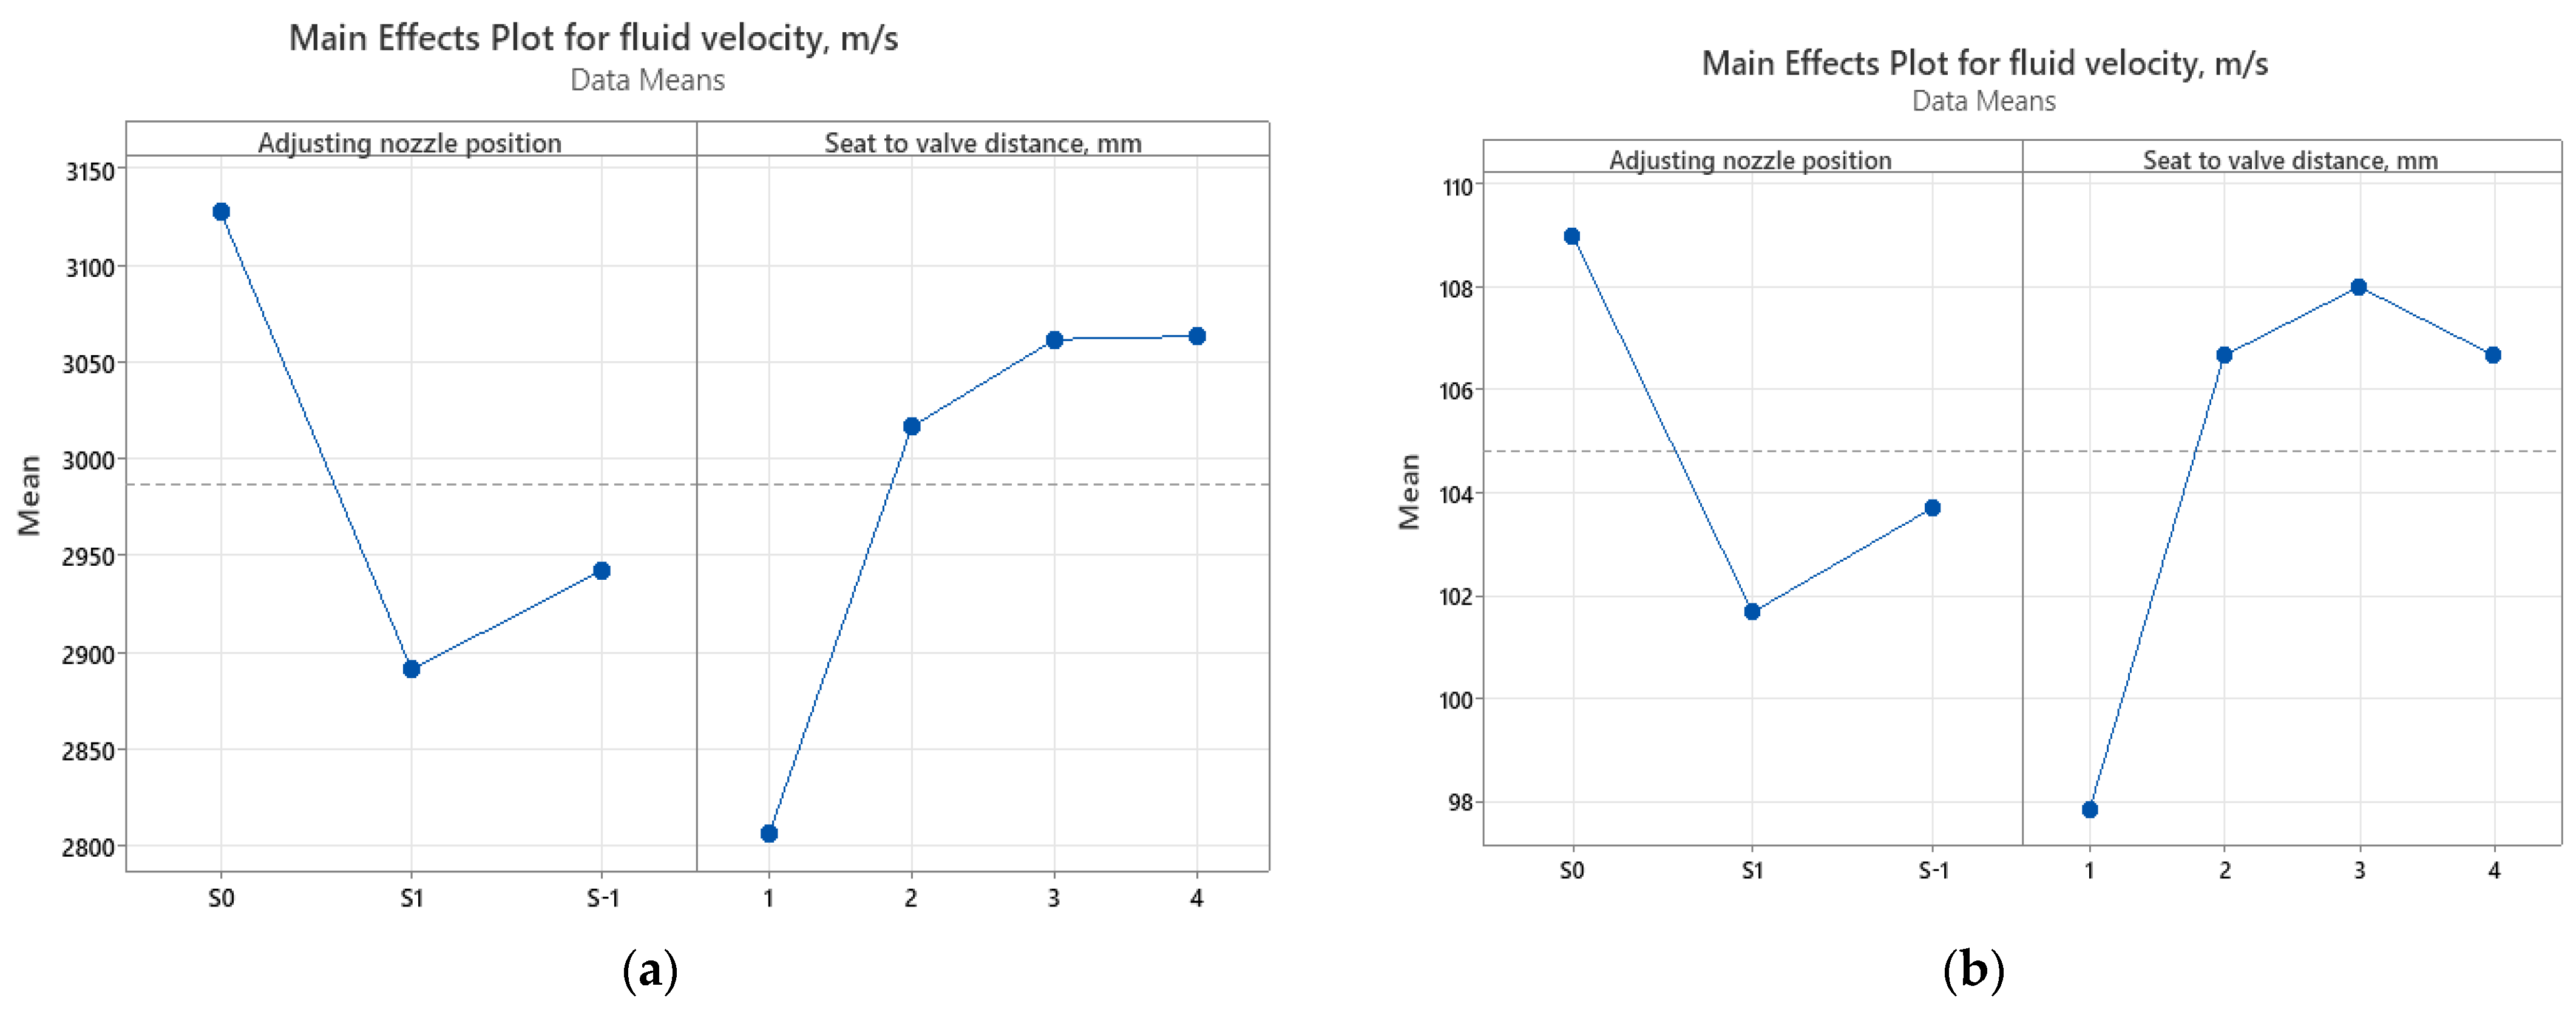
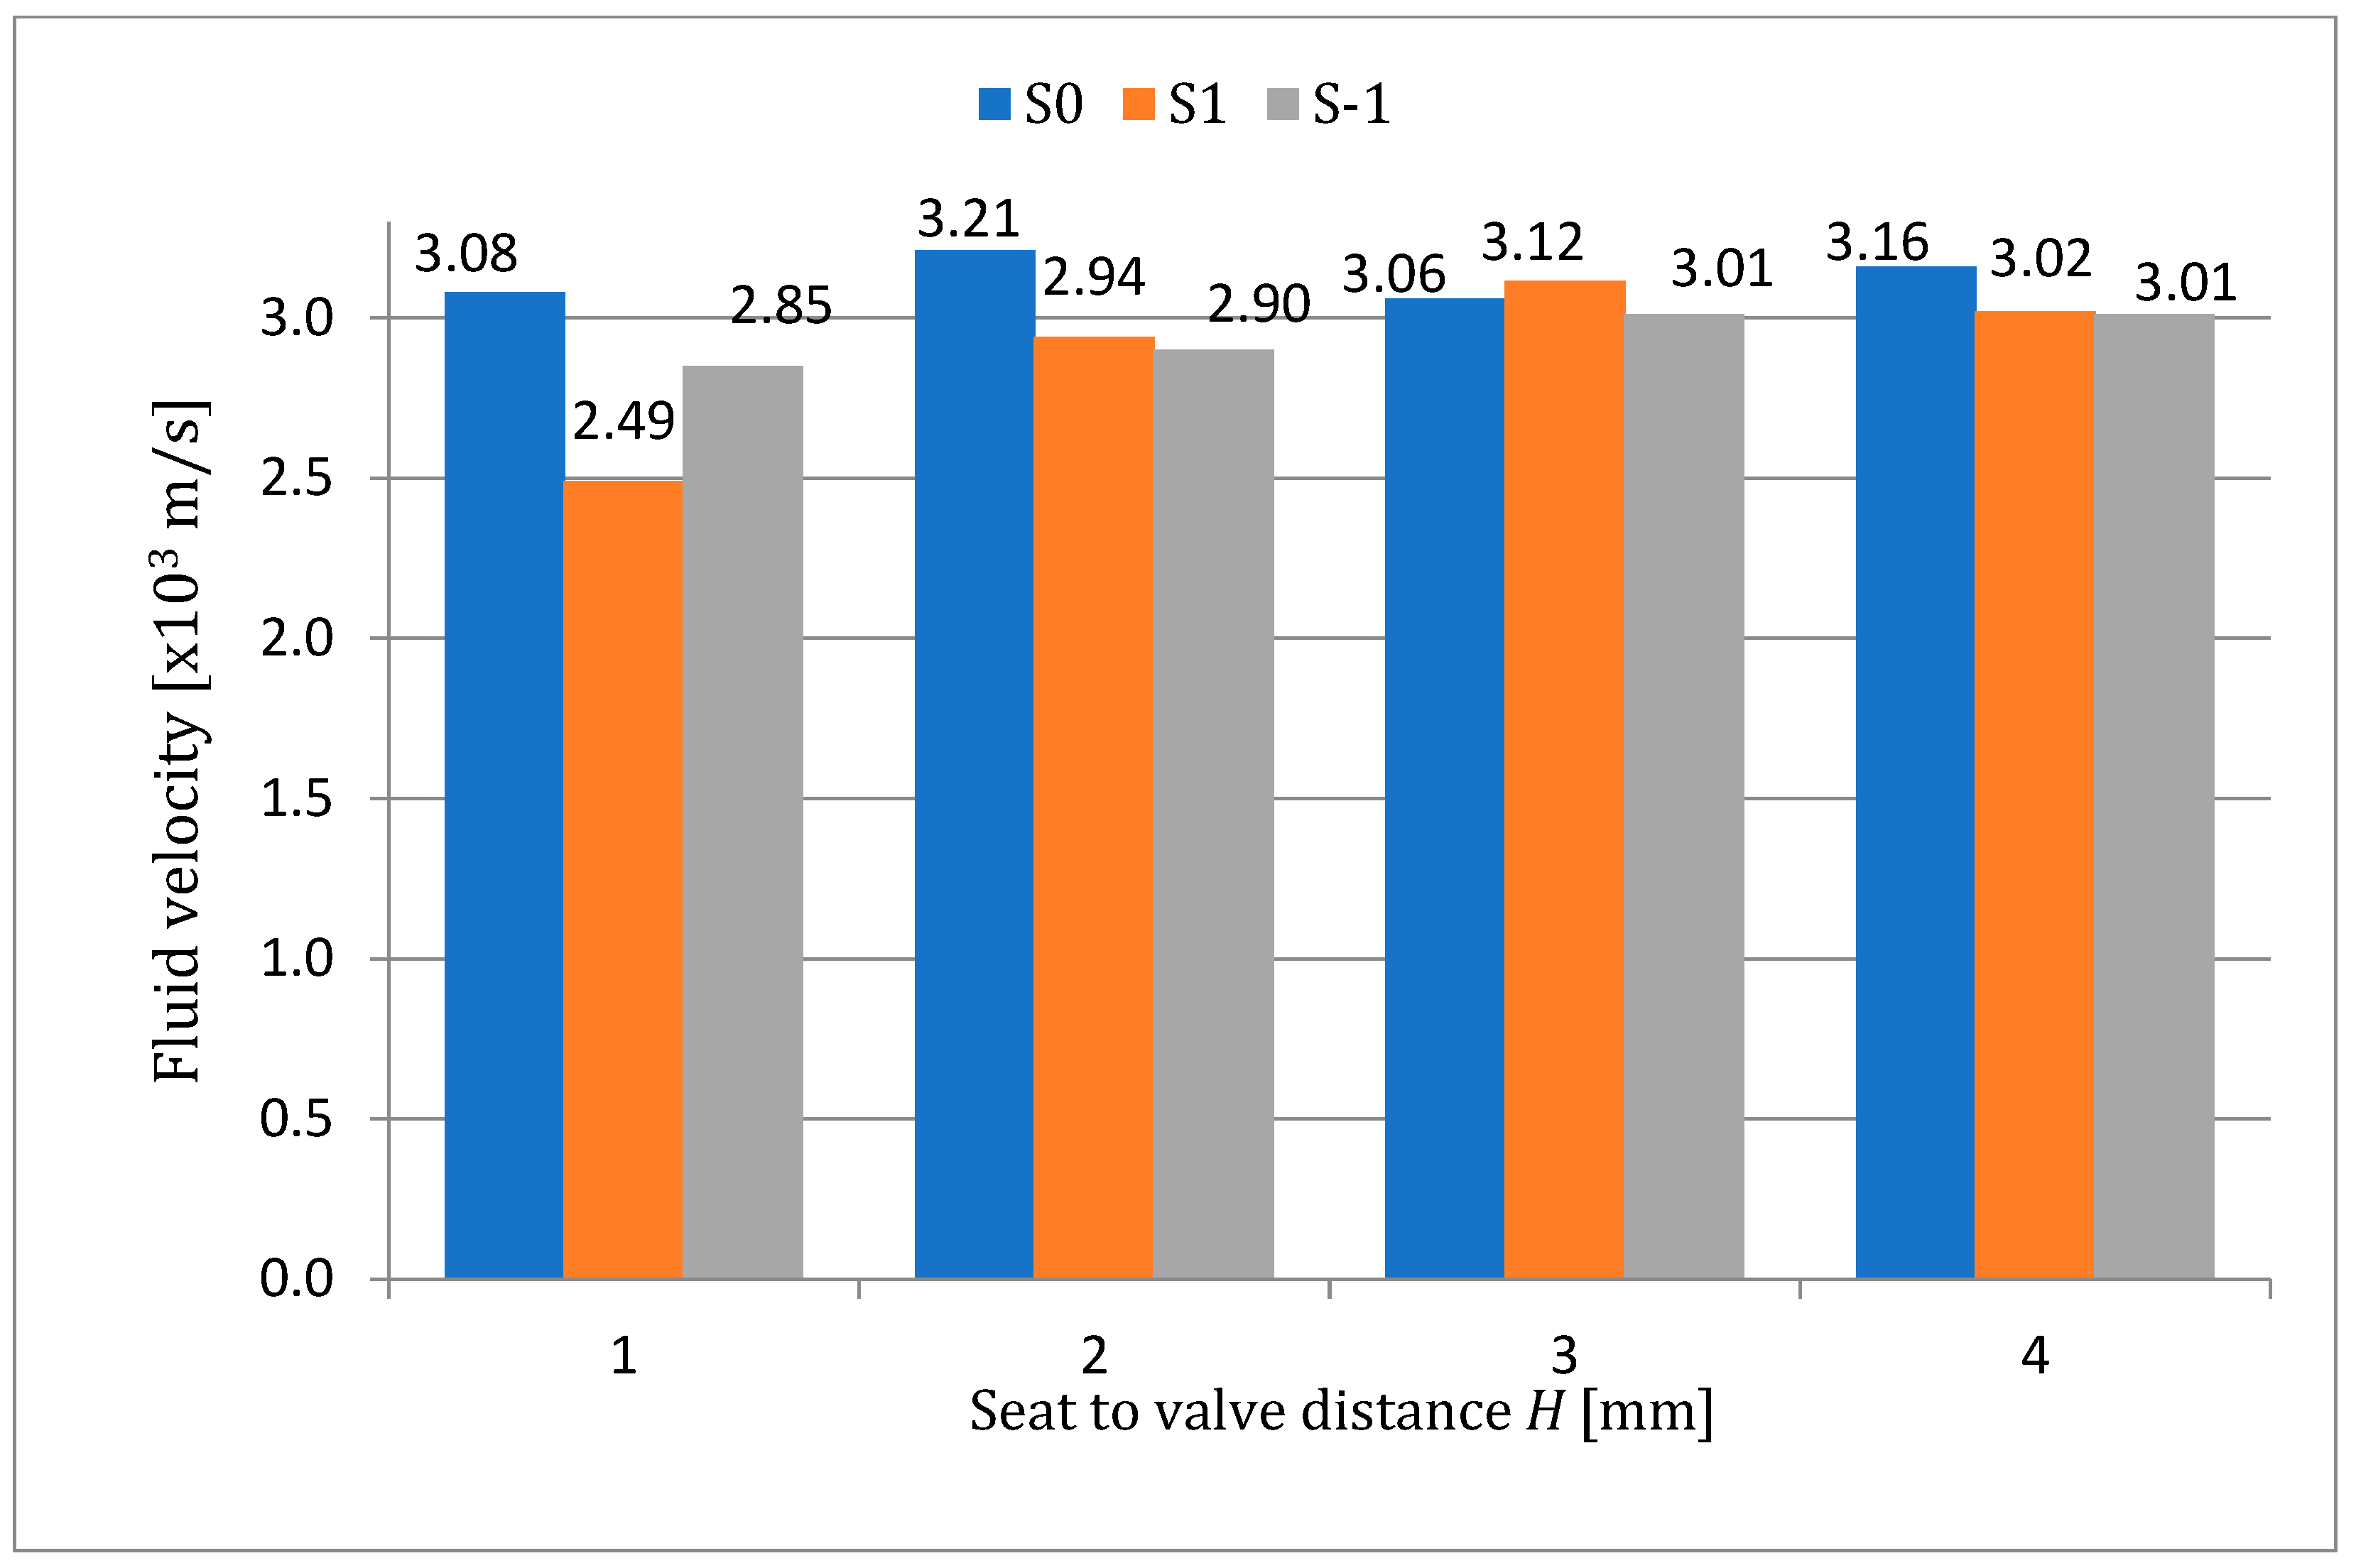
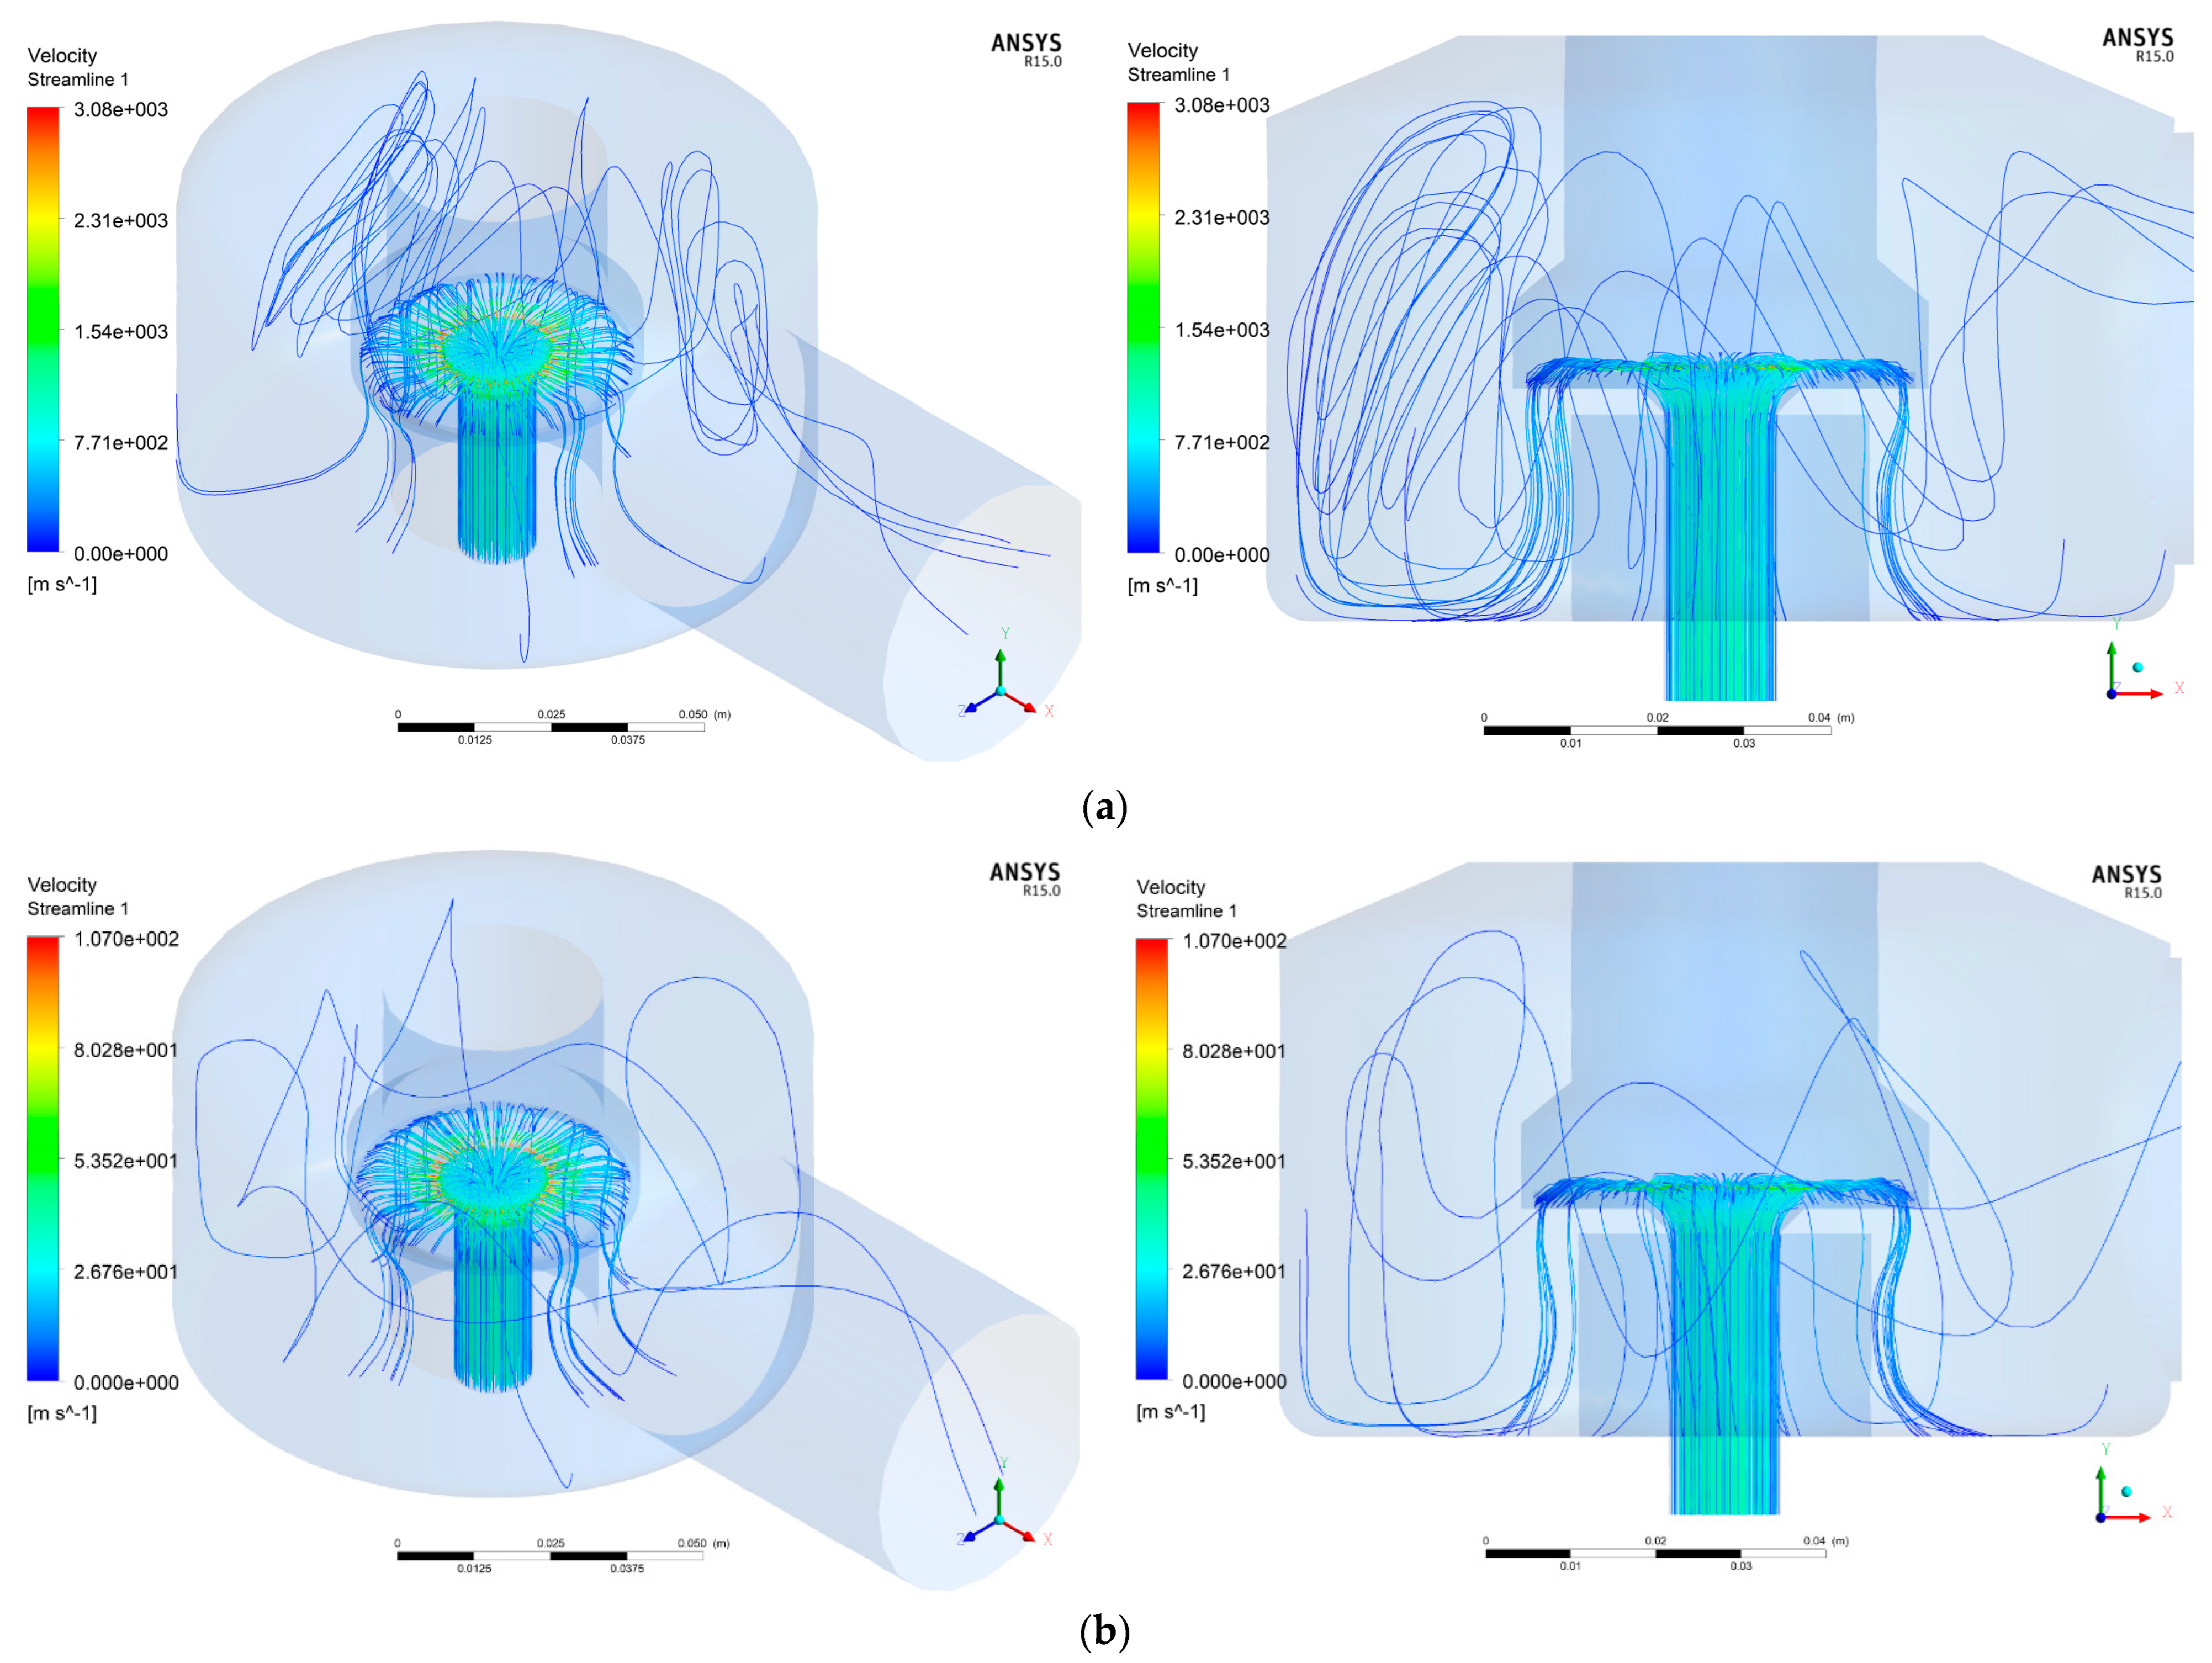
- In most of the analyzed cases, the maximum airspeed was obtained in the space between the seat and the valve, this having the value of 3210 m/s for the S0-H2 case. For cases where the adjusting nozzle is at or below the seat, the variation in air velocity is relatively small. The calculated velocity difference between the extreme values is 150m/s for position S0 and approximately 160m/s for S-1.
- ✓
- For nozzle position S1, the air velocity varies significantly compared to the other two, with the minimum value being 2490 m/s for H1. At high fluidvelocity, the vortices created inside the valve body are much more pronounced, but the streamlines respect its geometric configuration.
- ✓
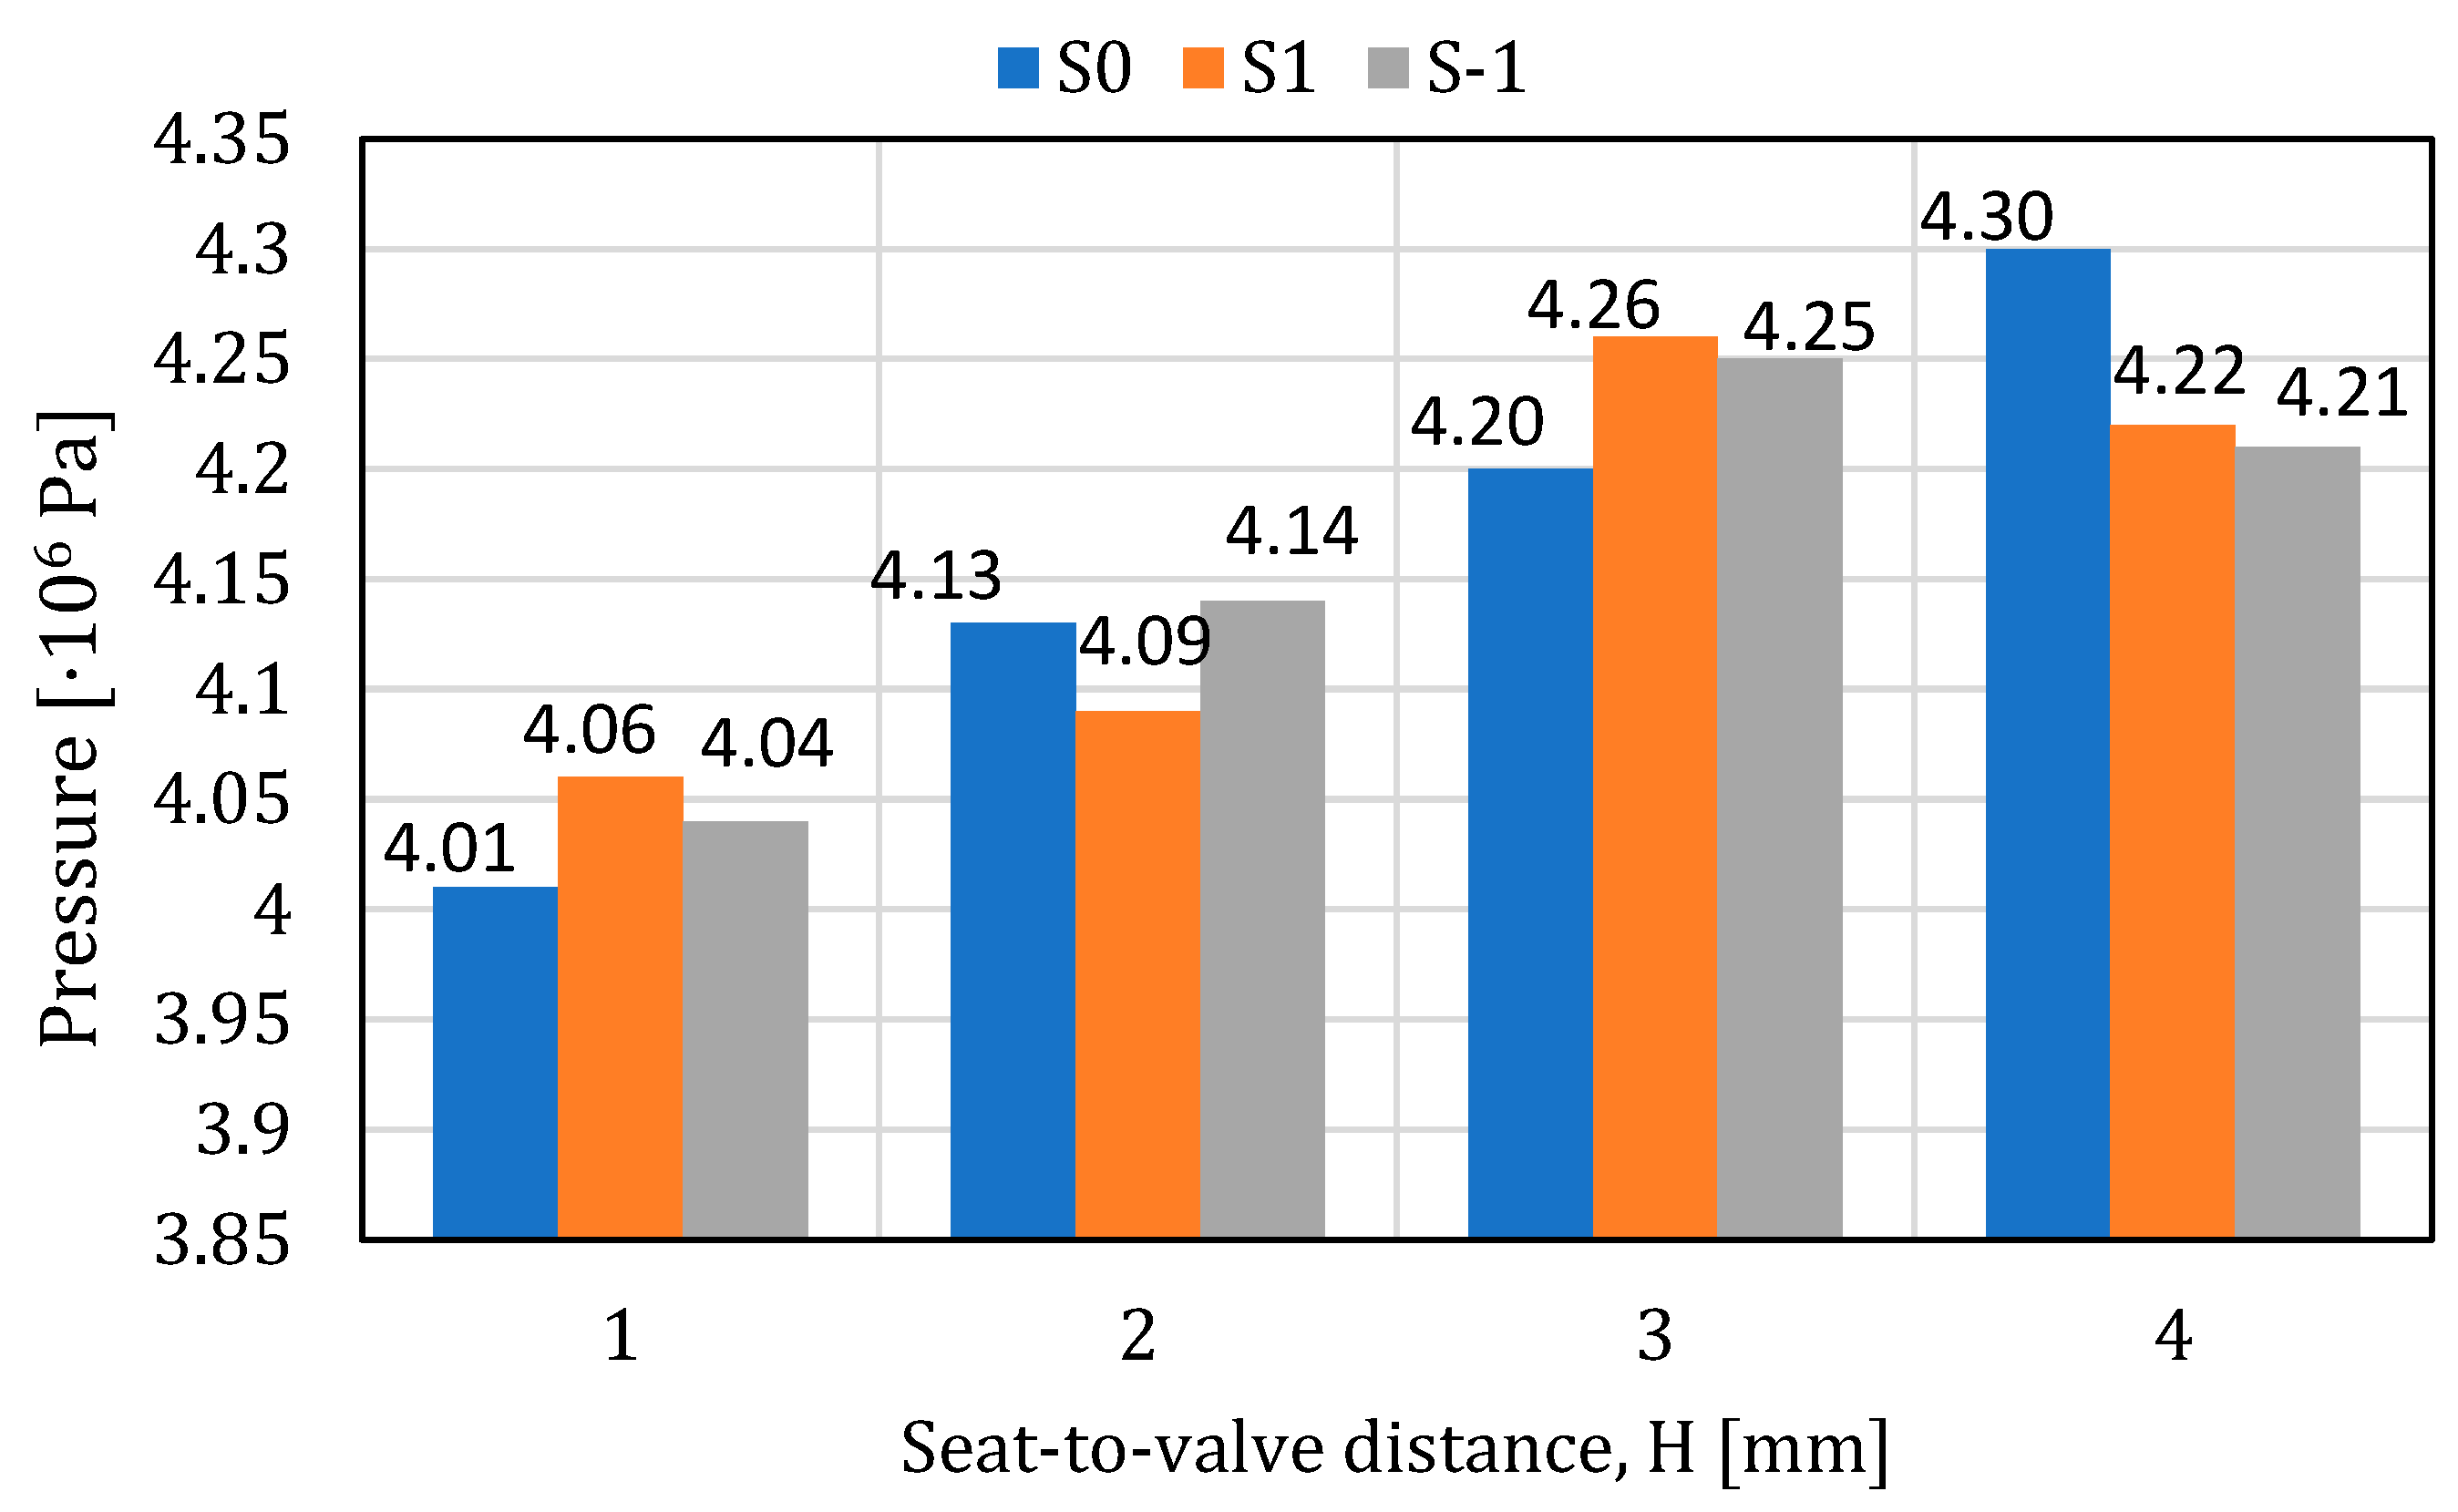
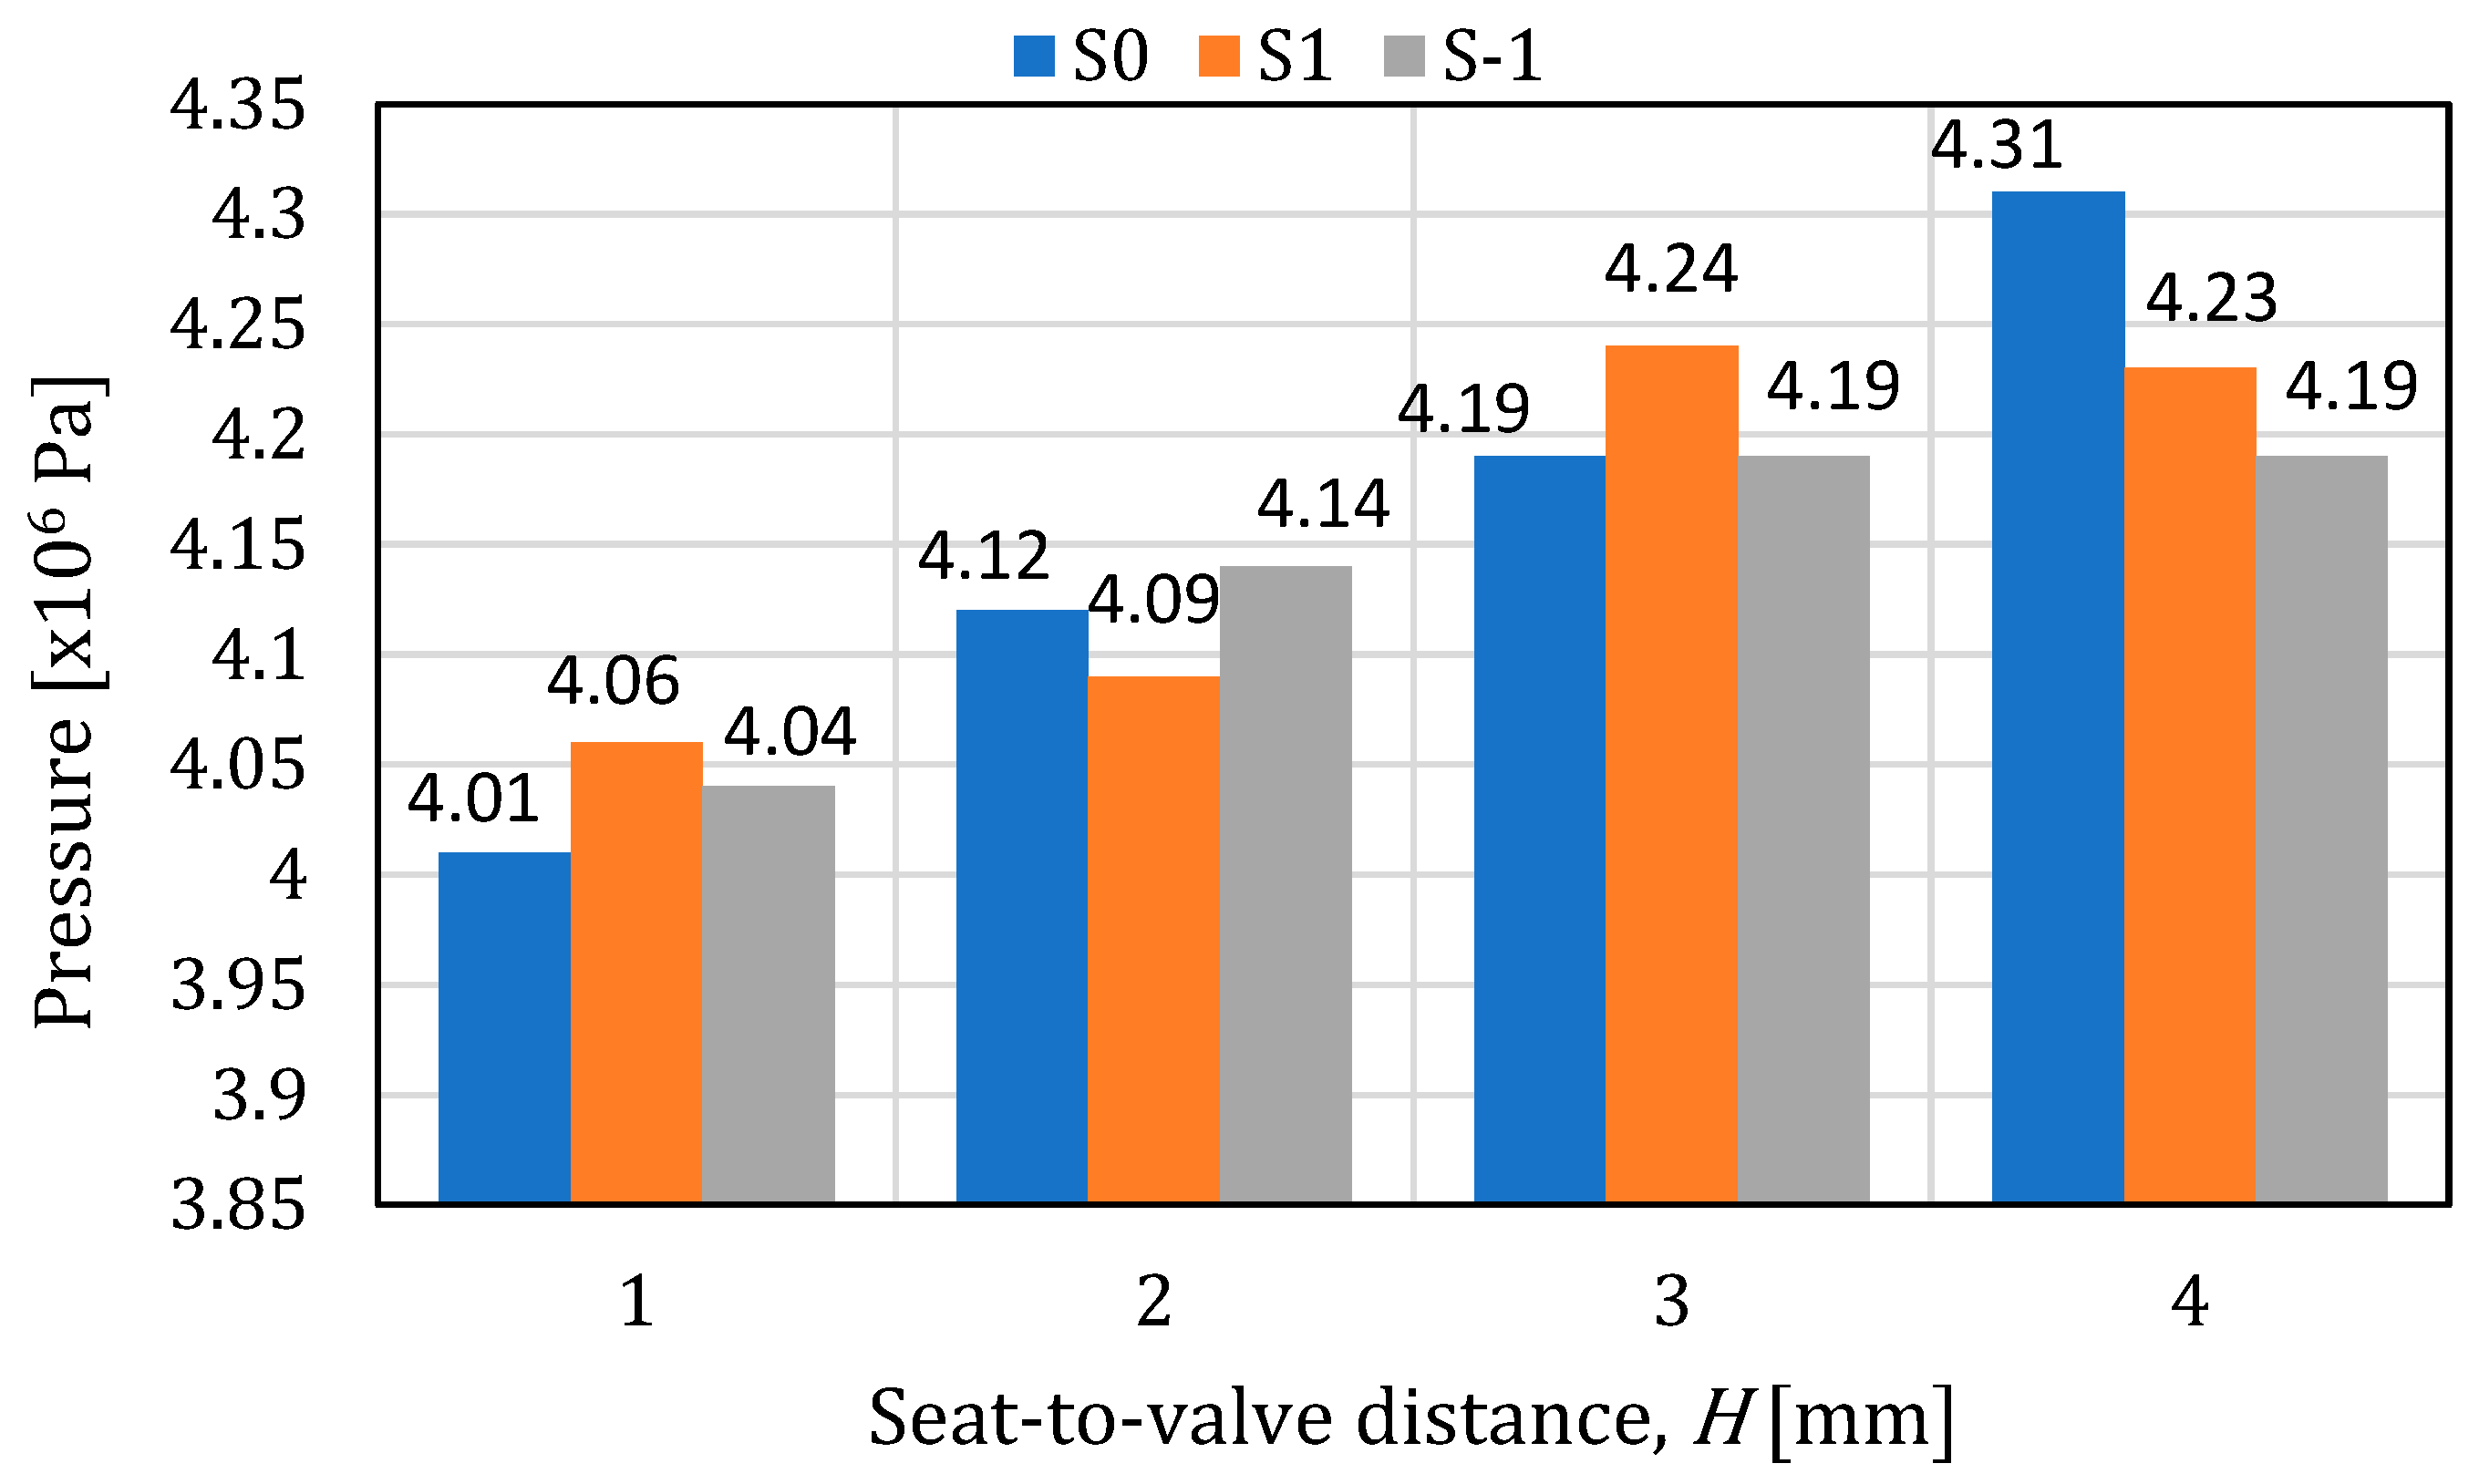
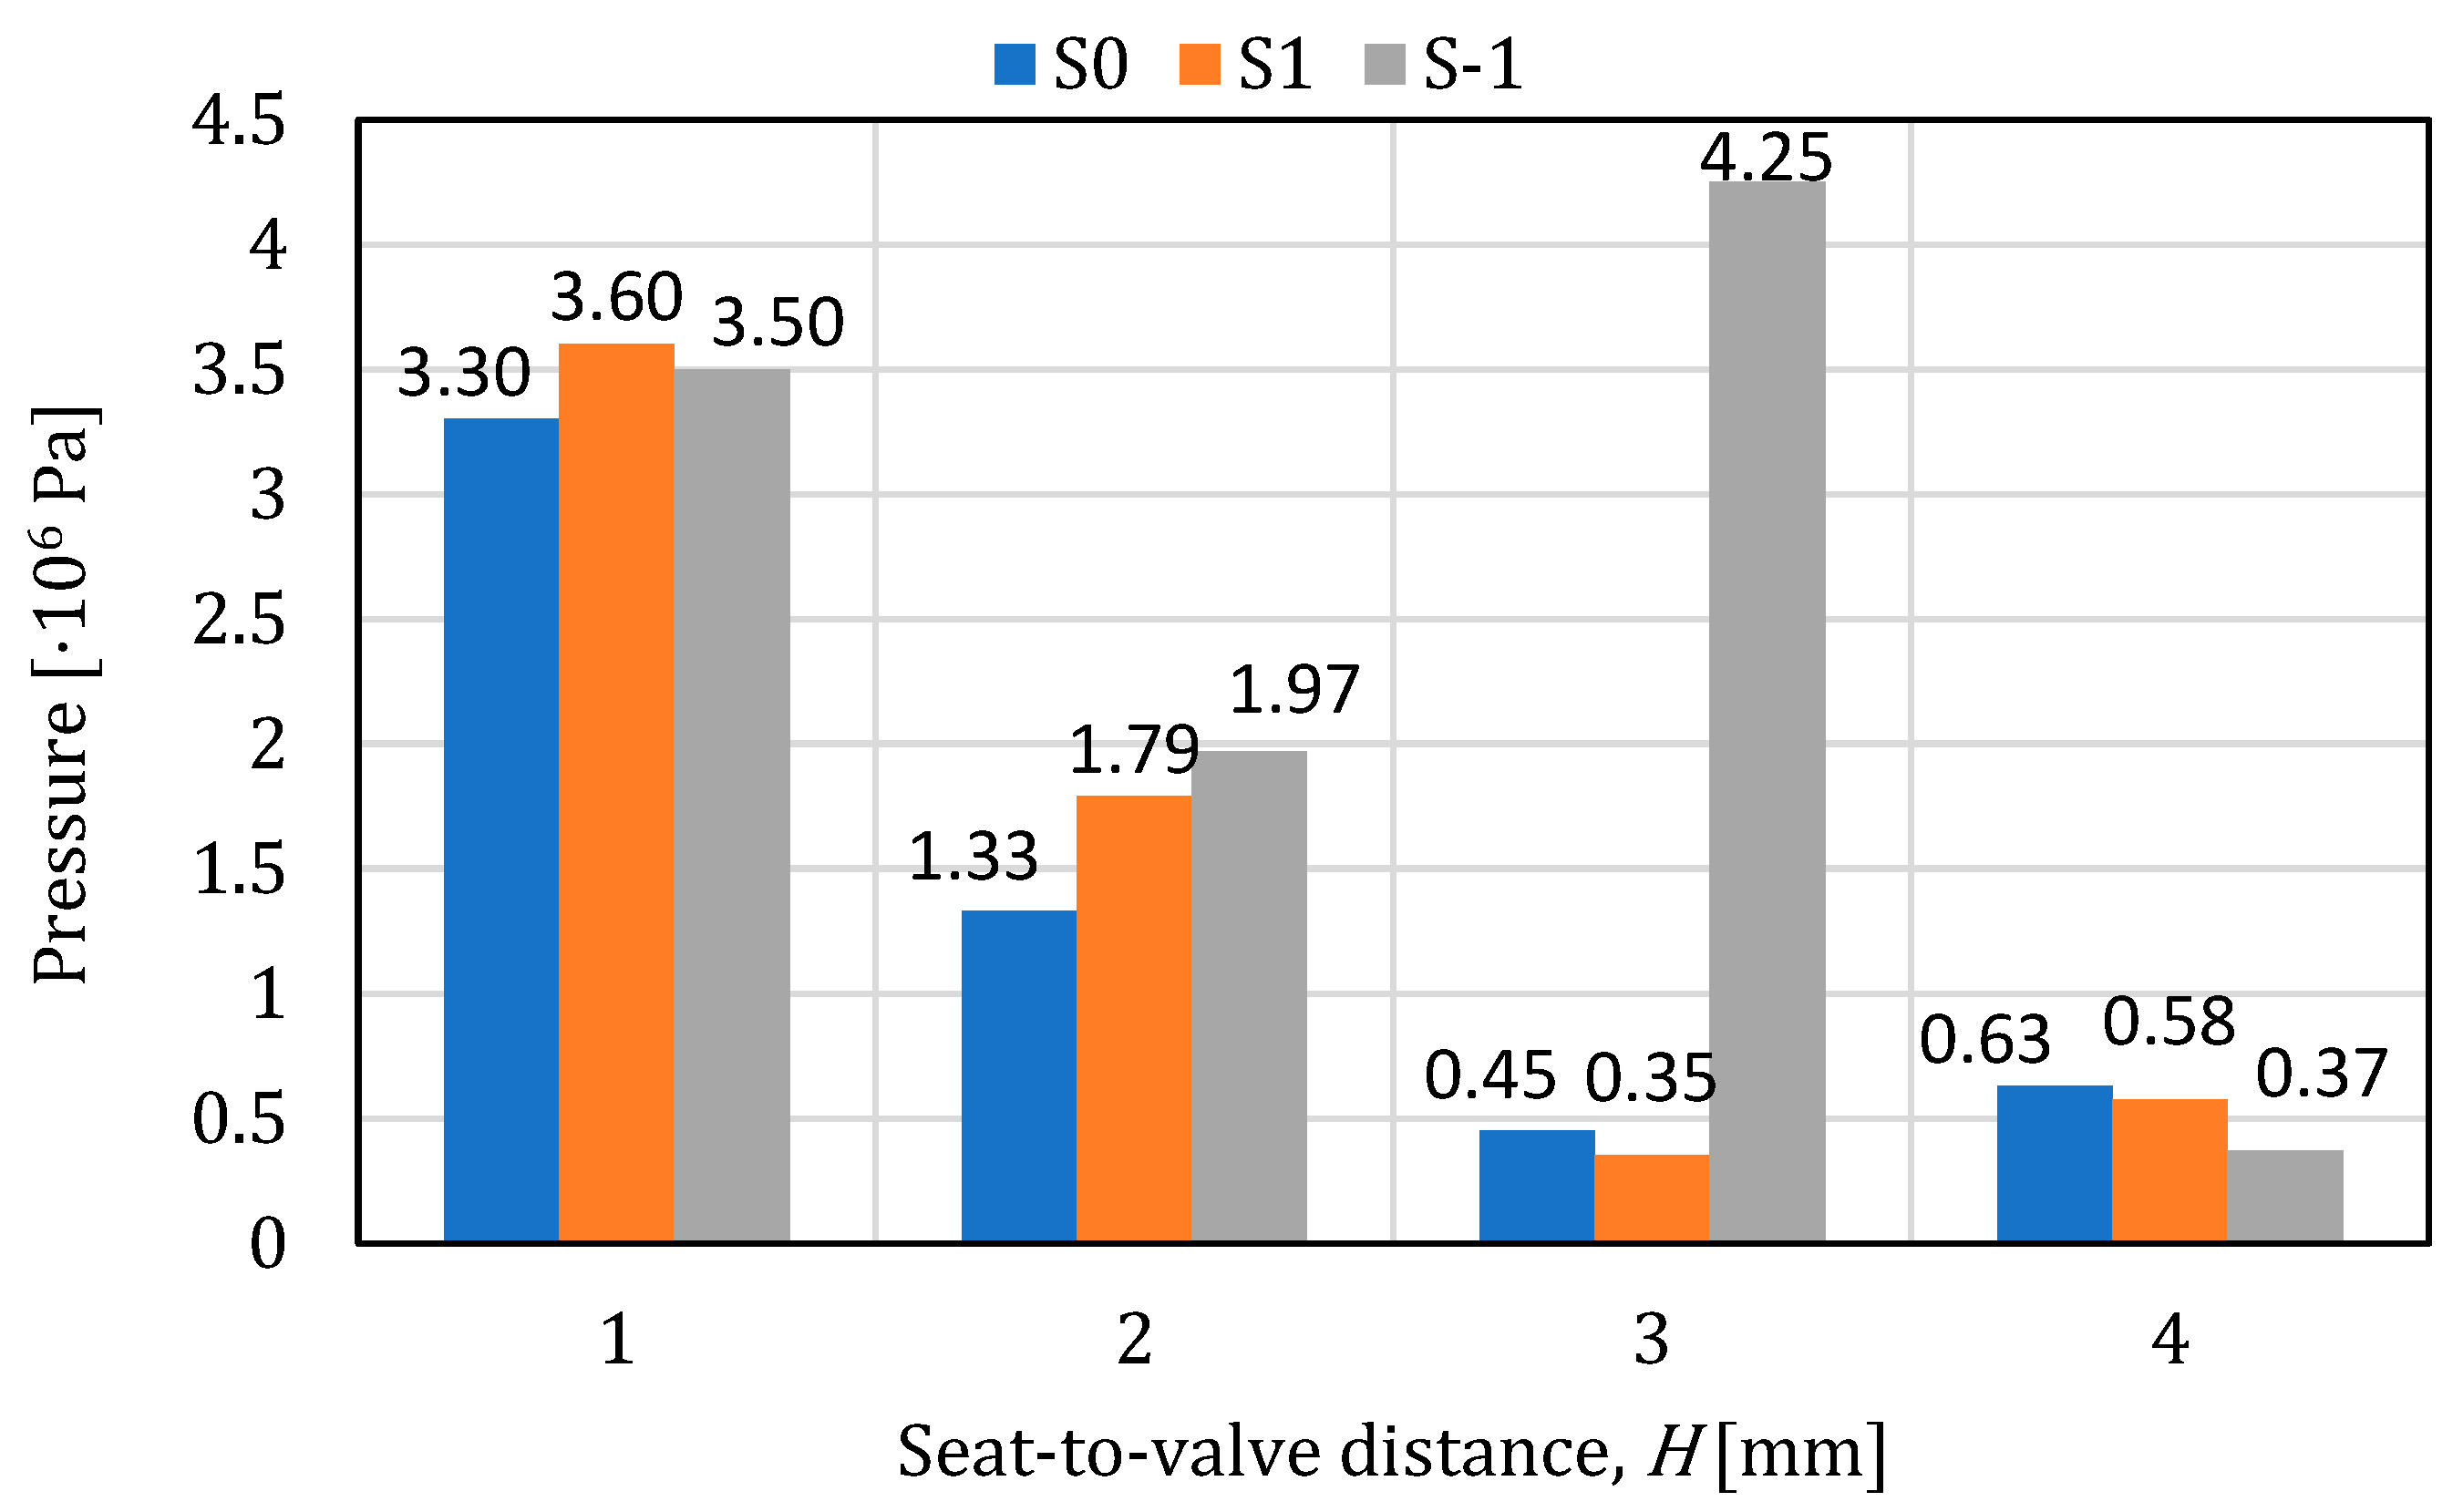
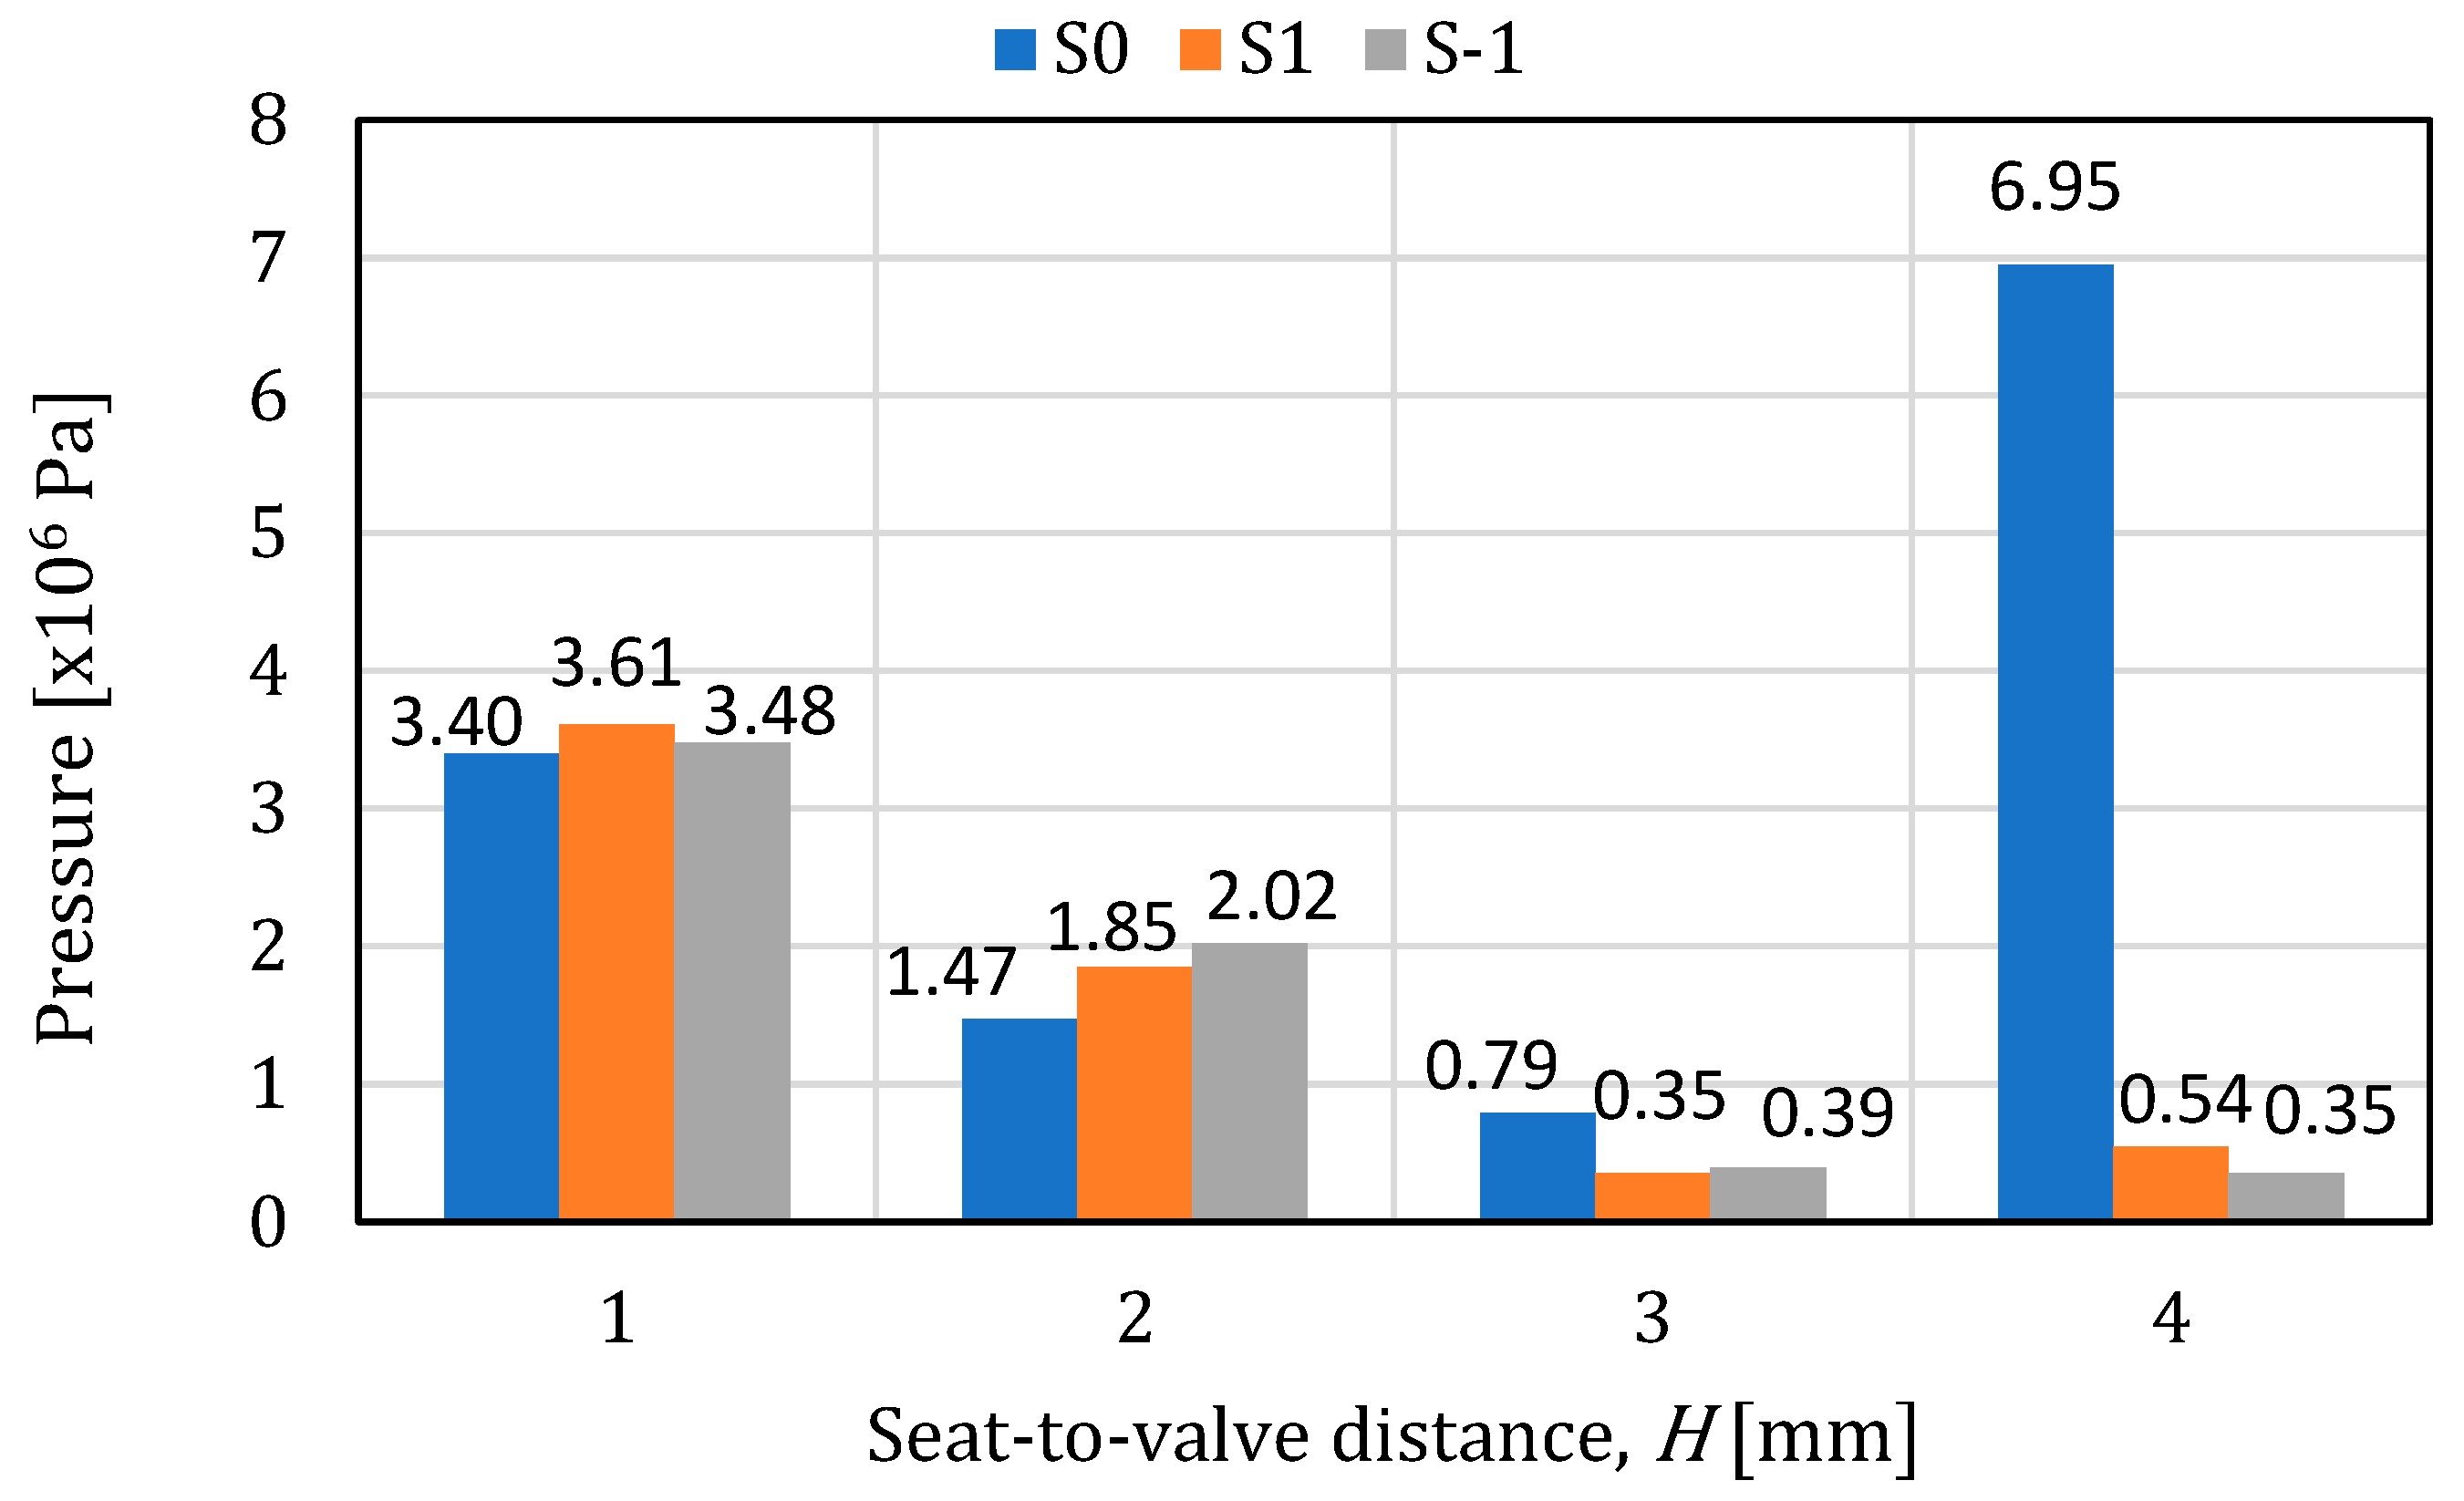
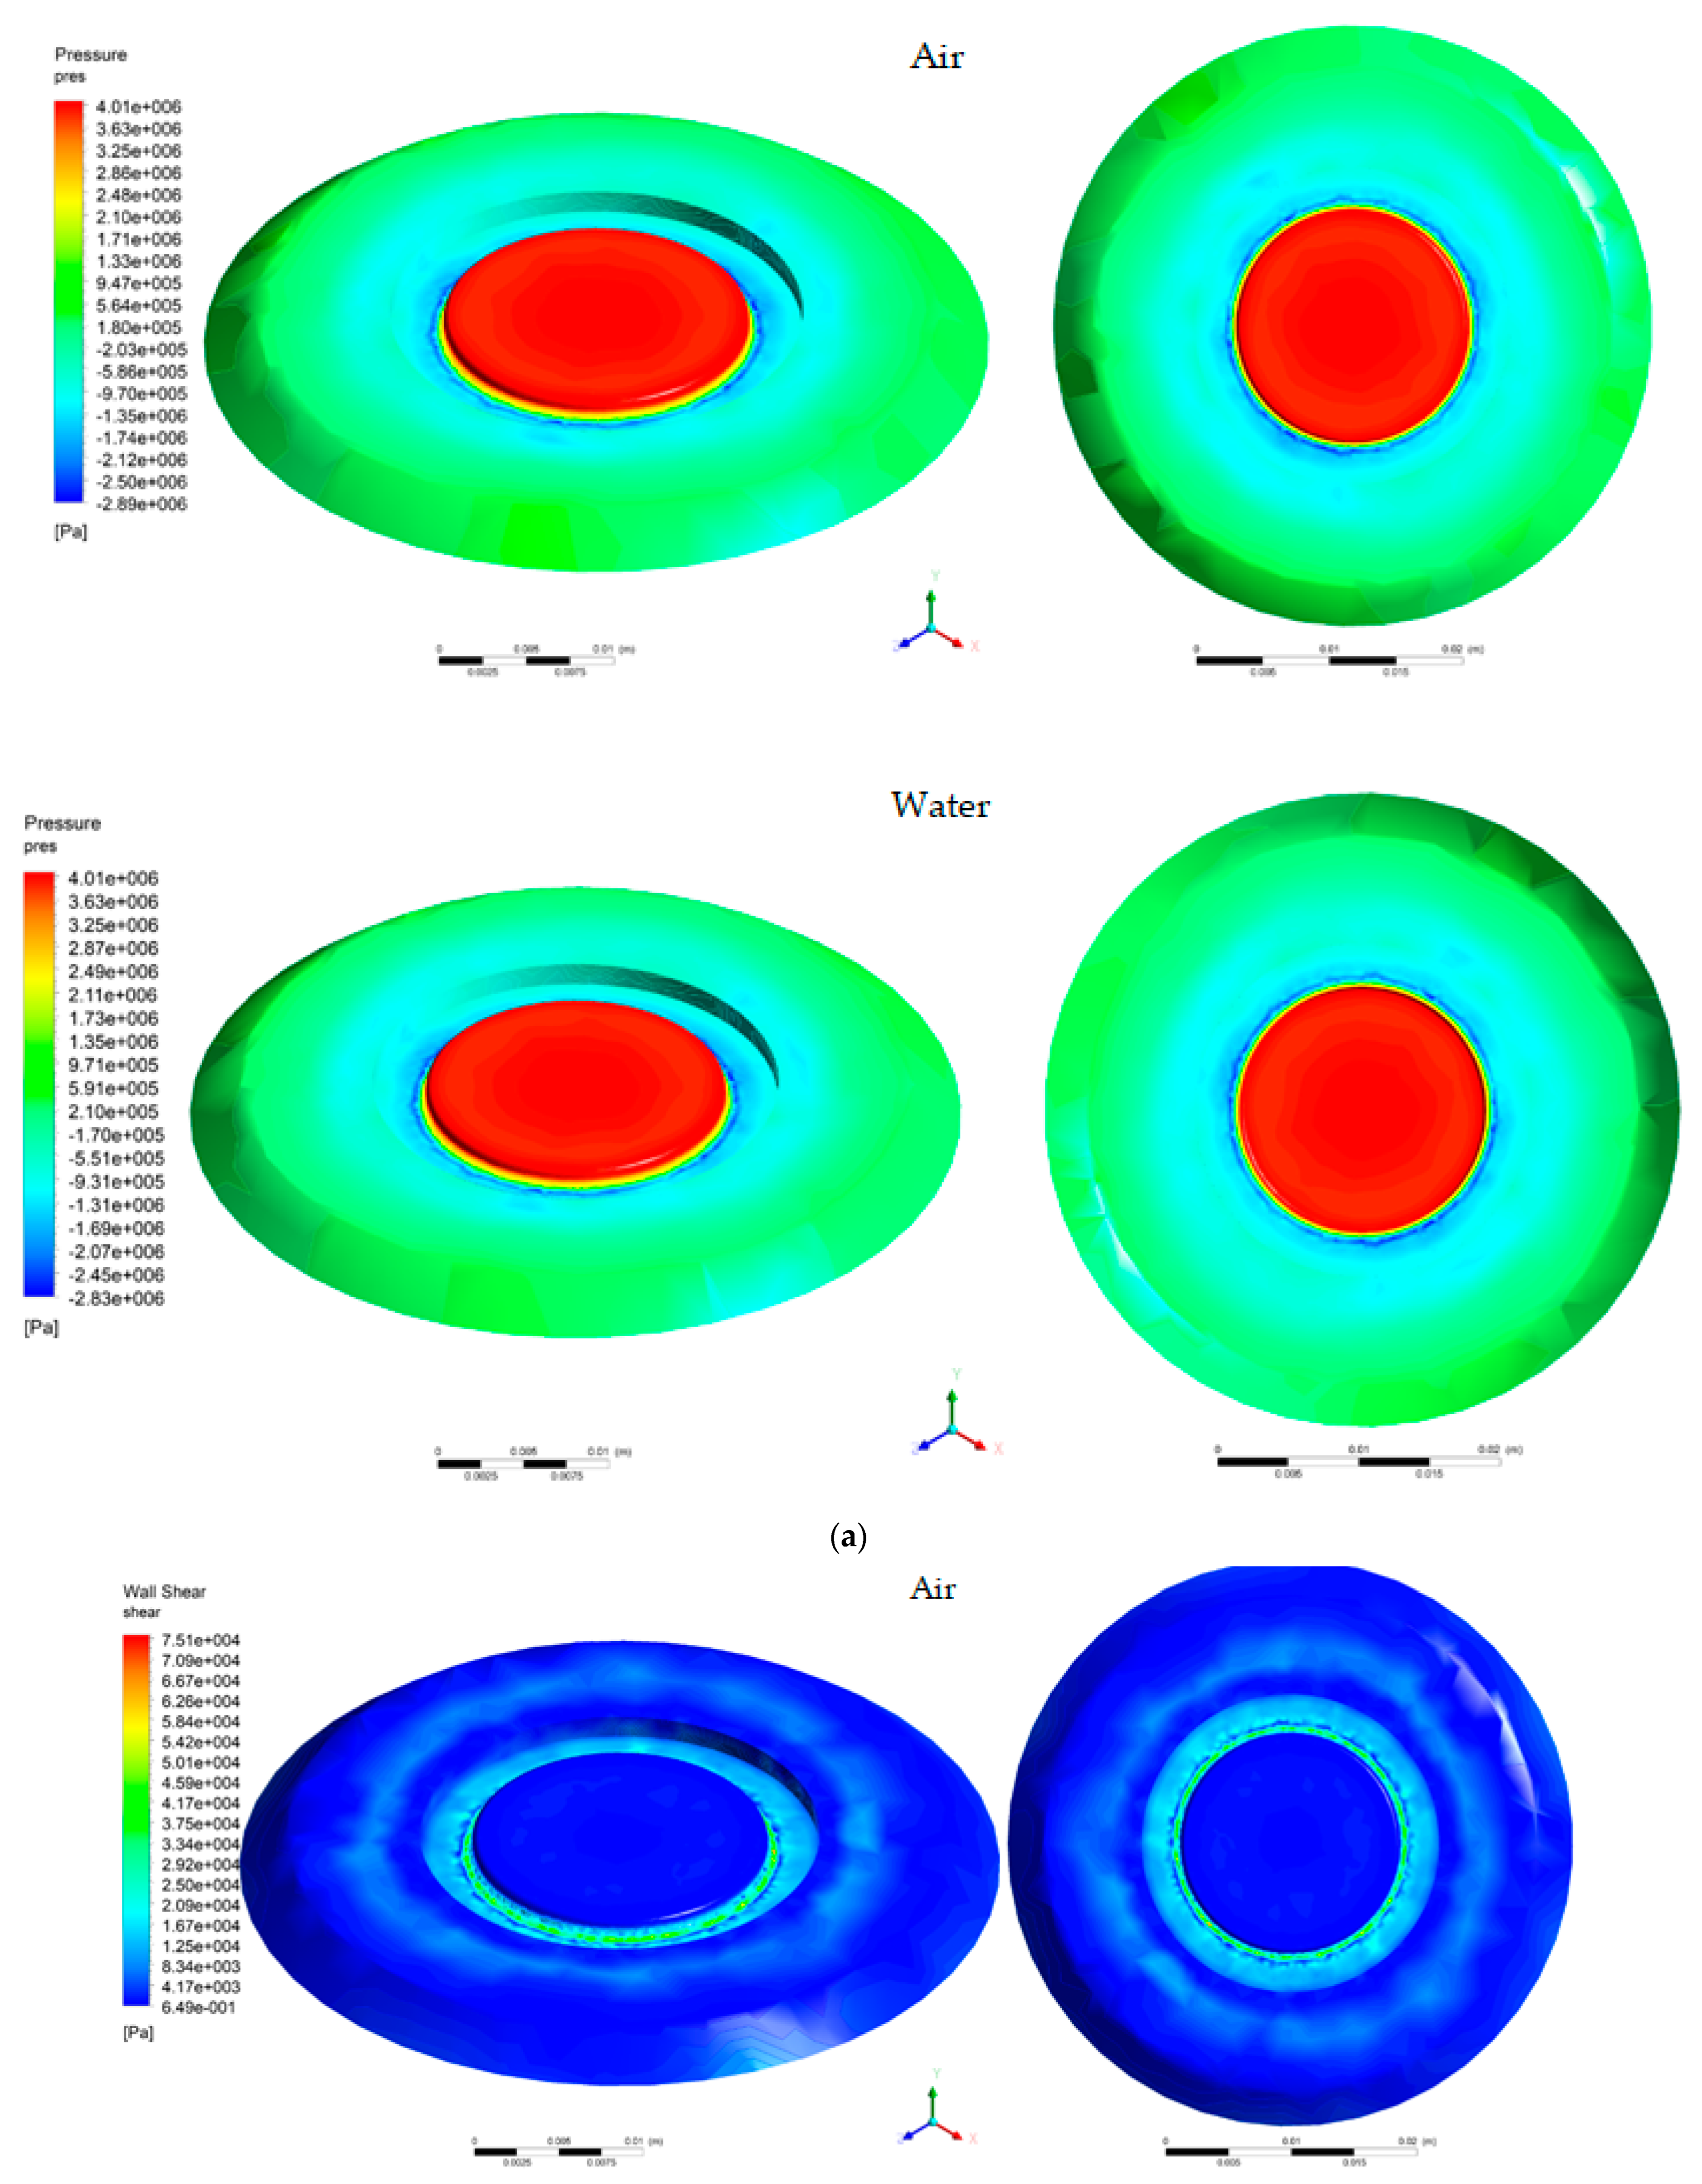
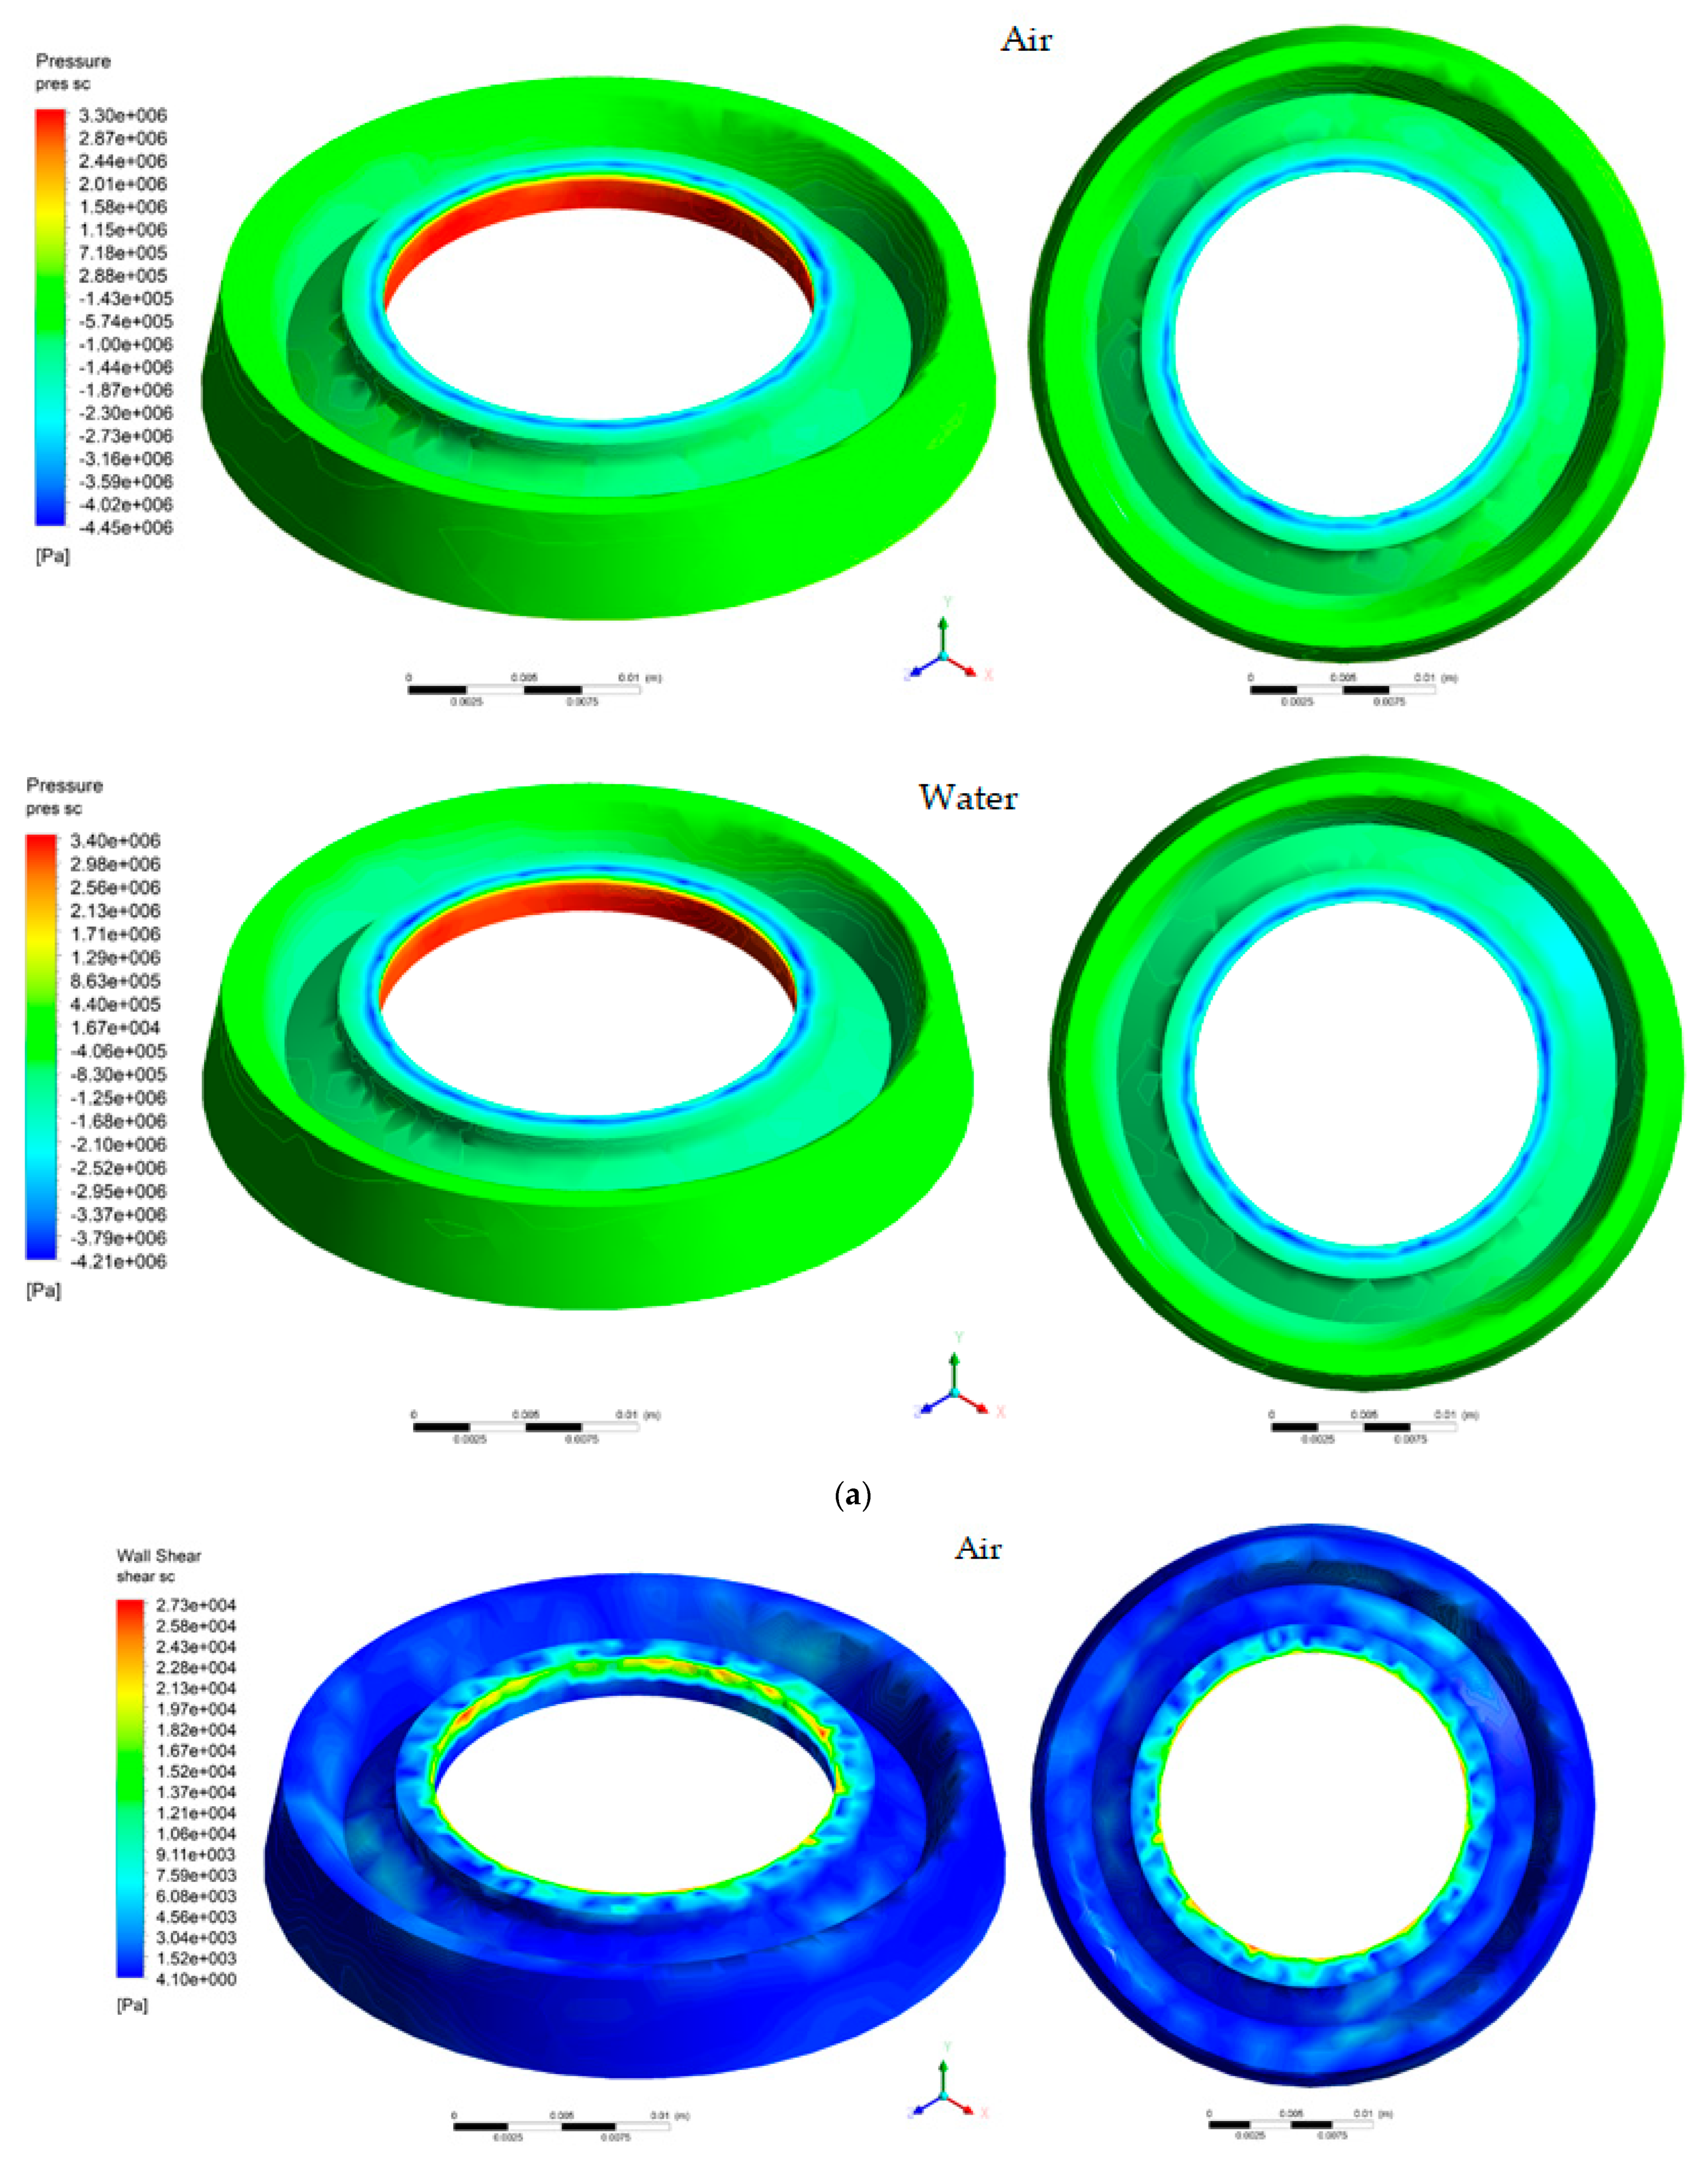
- In all analyzed cases, the extreme pressure values were obtained on the circular surface in the center of the plate. The highest value of the pressure is 4.3 MPa (air) and 4.31 MPa (water), being evenly distributed on the plate surface. In the case of the seat, the pressure drops with valve lift for all three positions of the adjusting nozzle except S-1-H3 (in air environment) and S0-H4 (in water environment).
- ✓
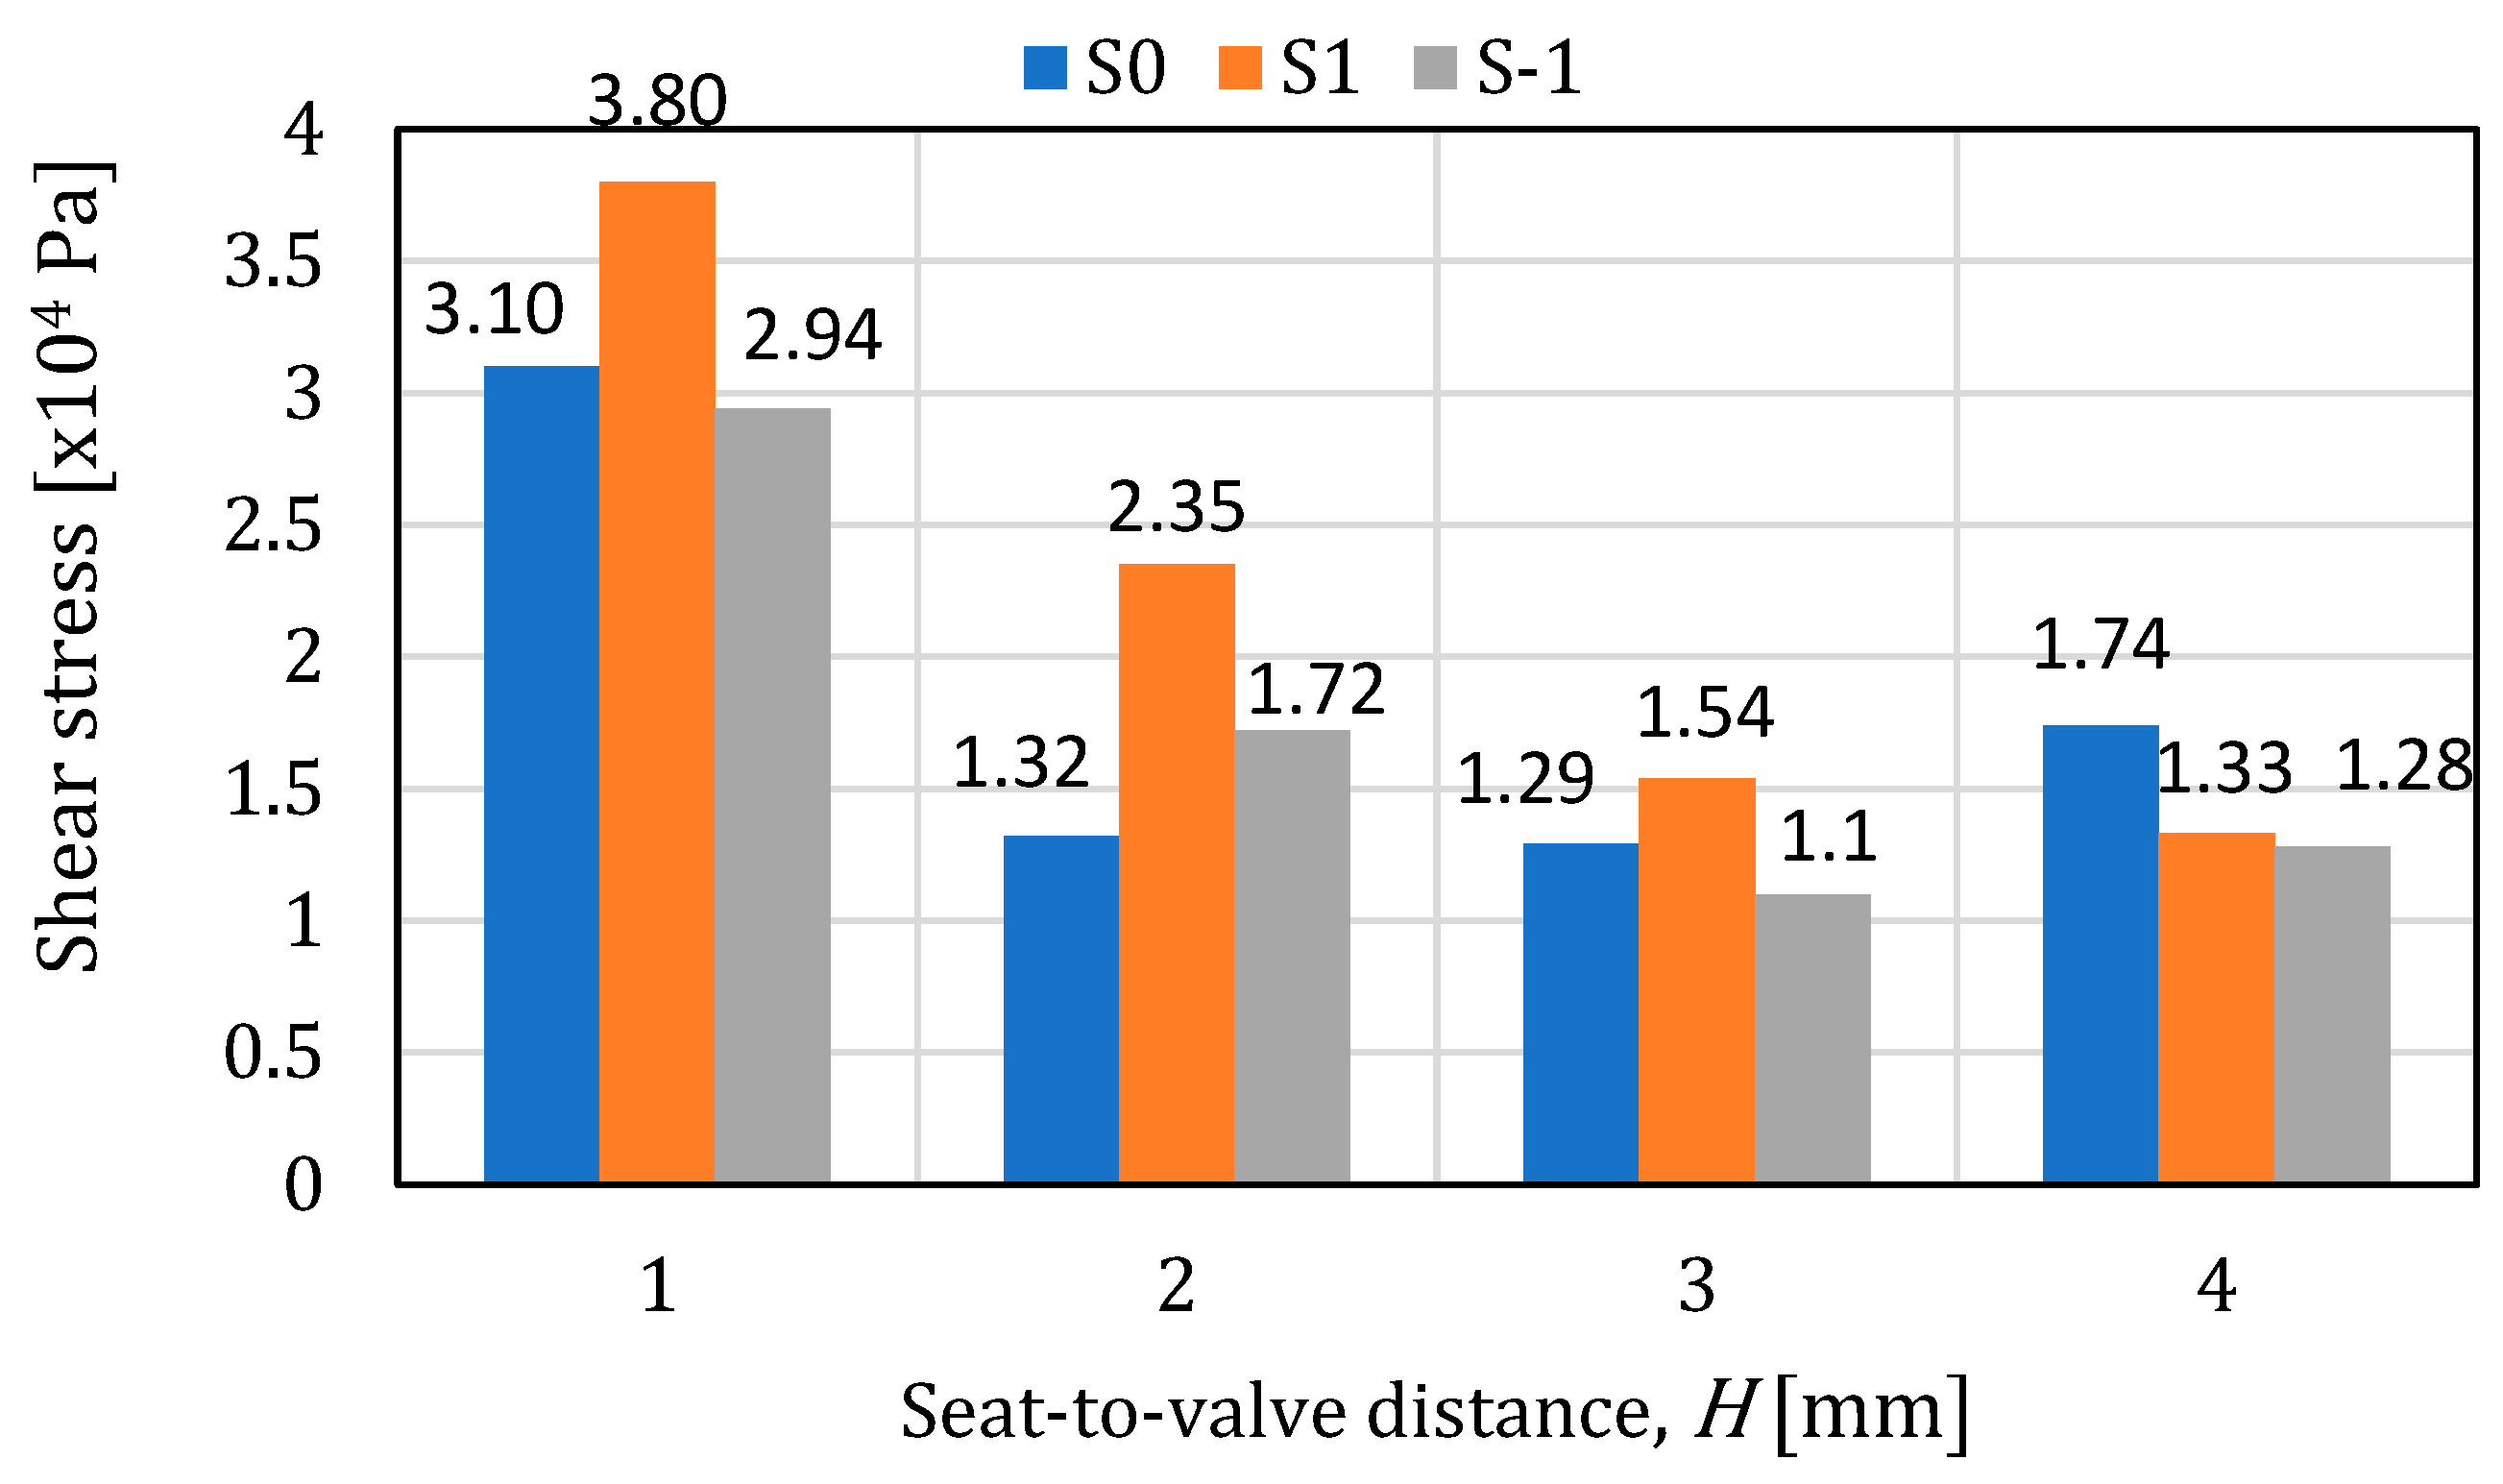
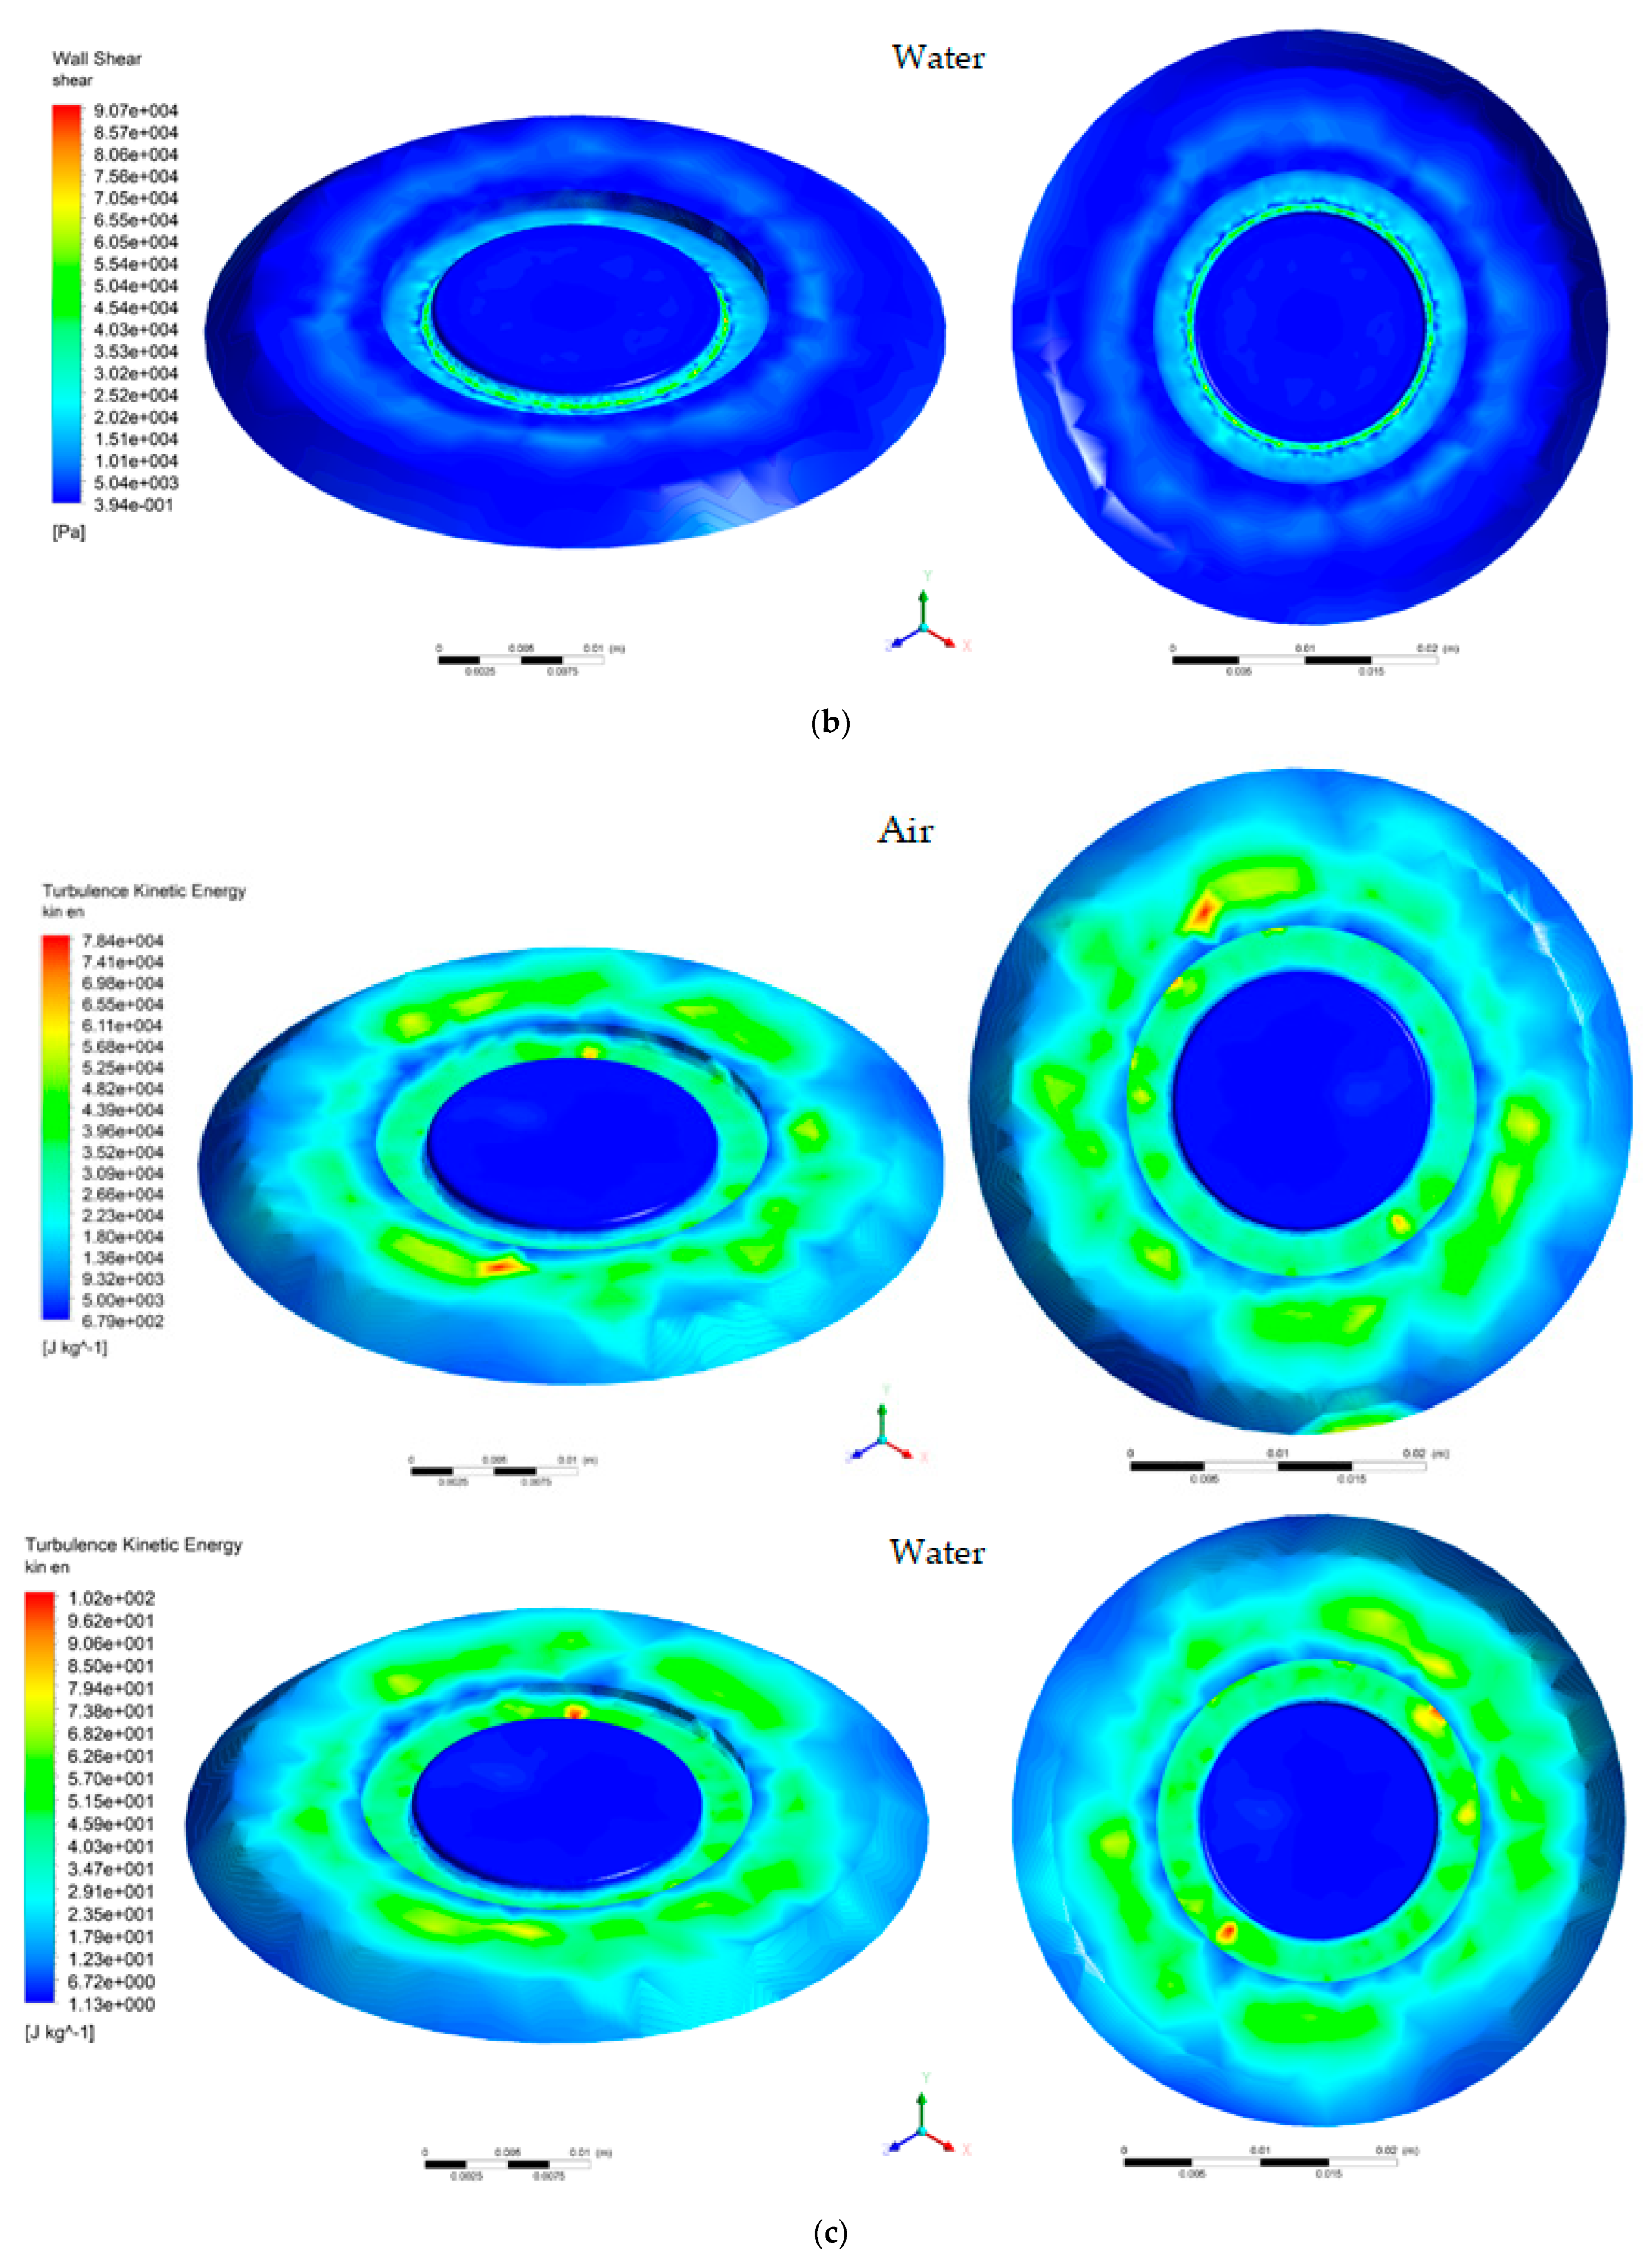
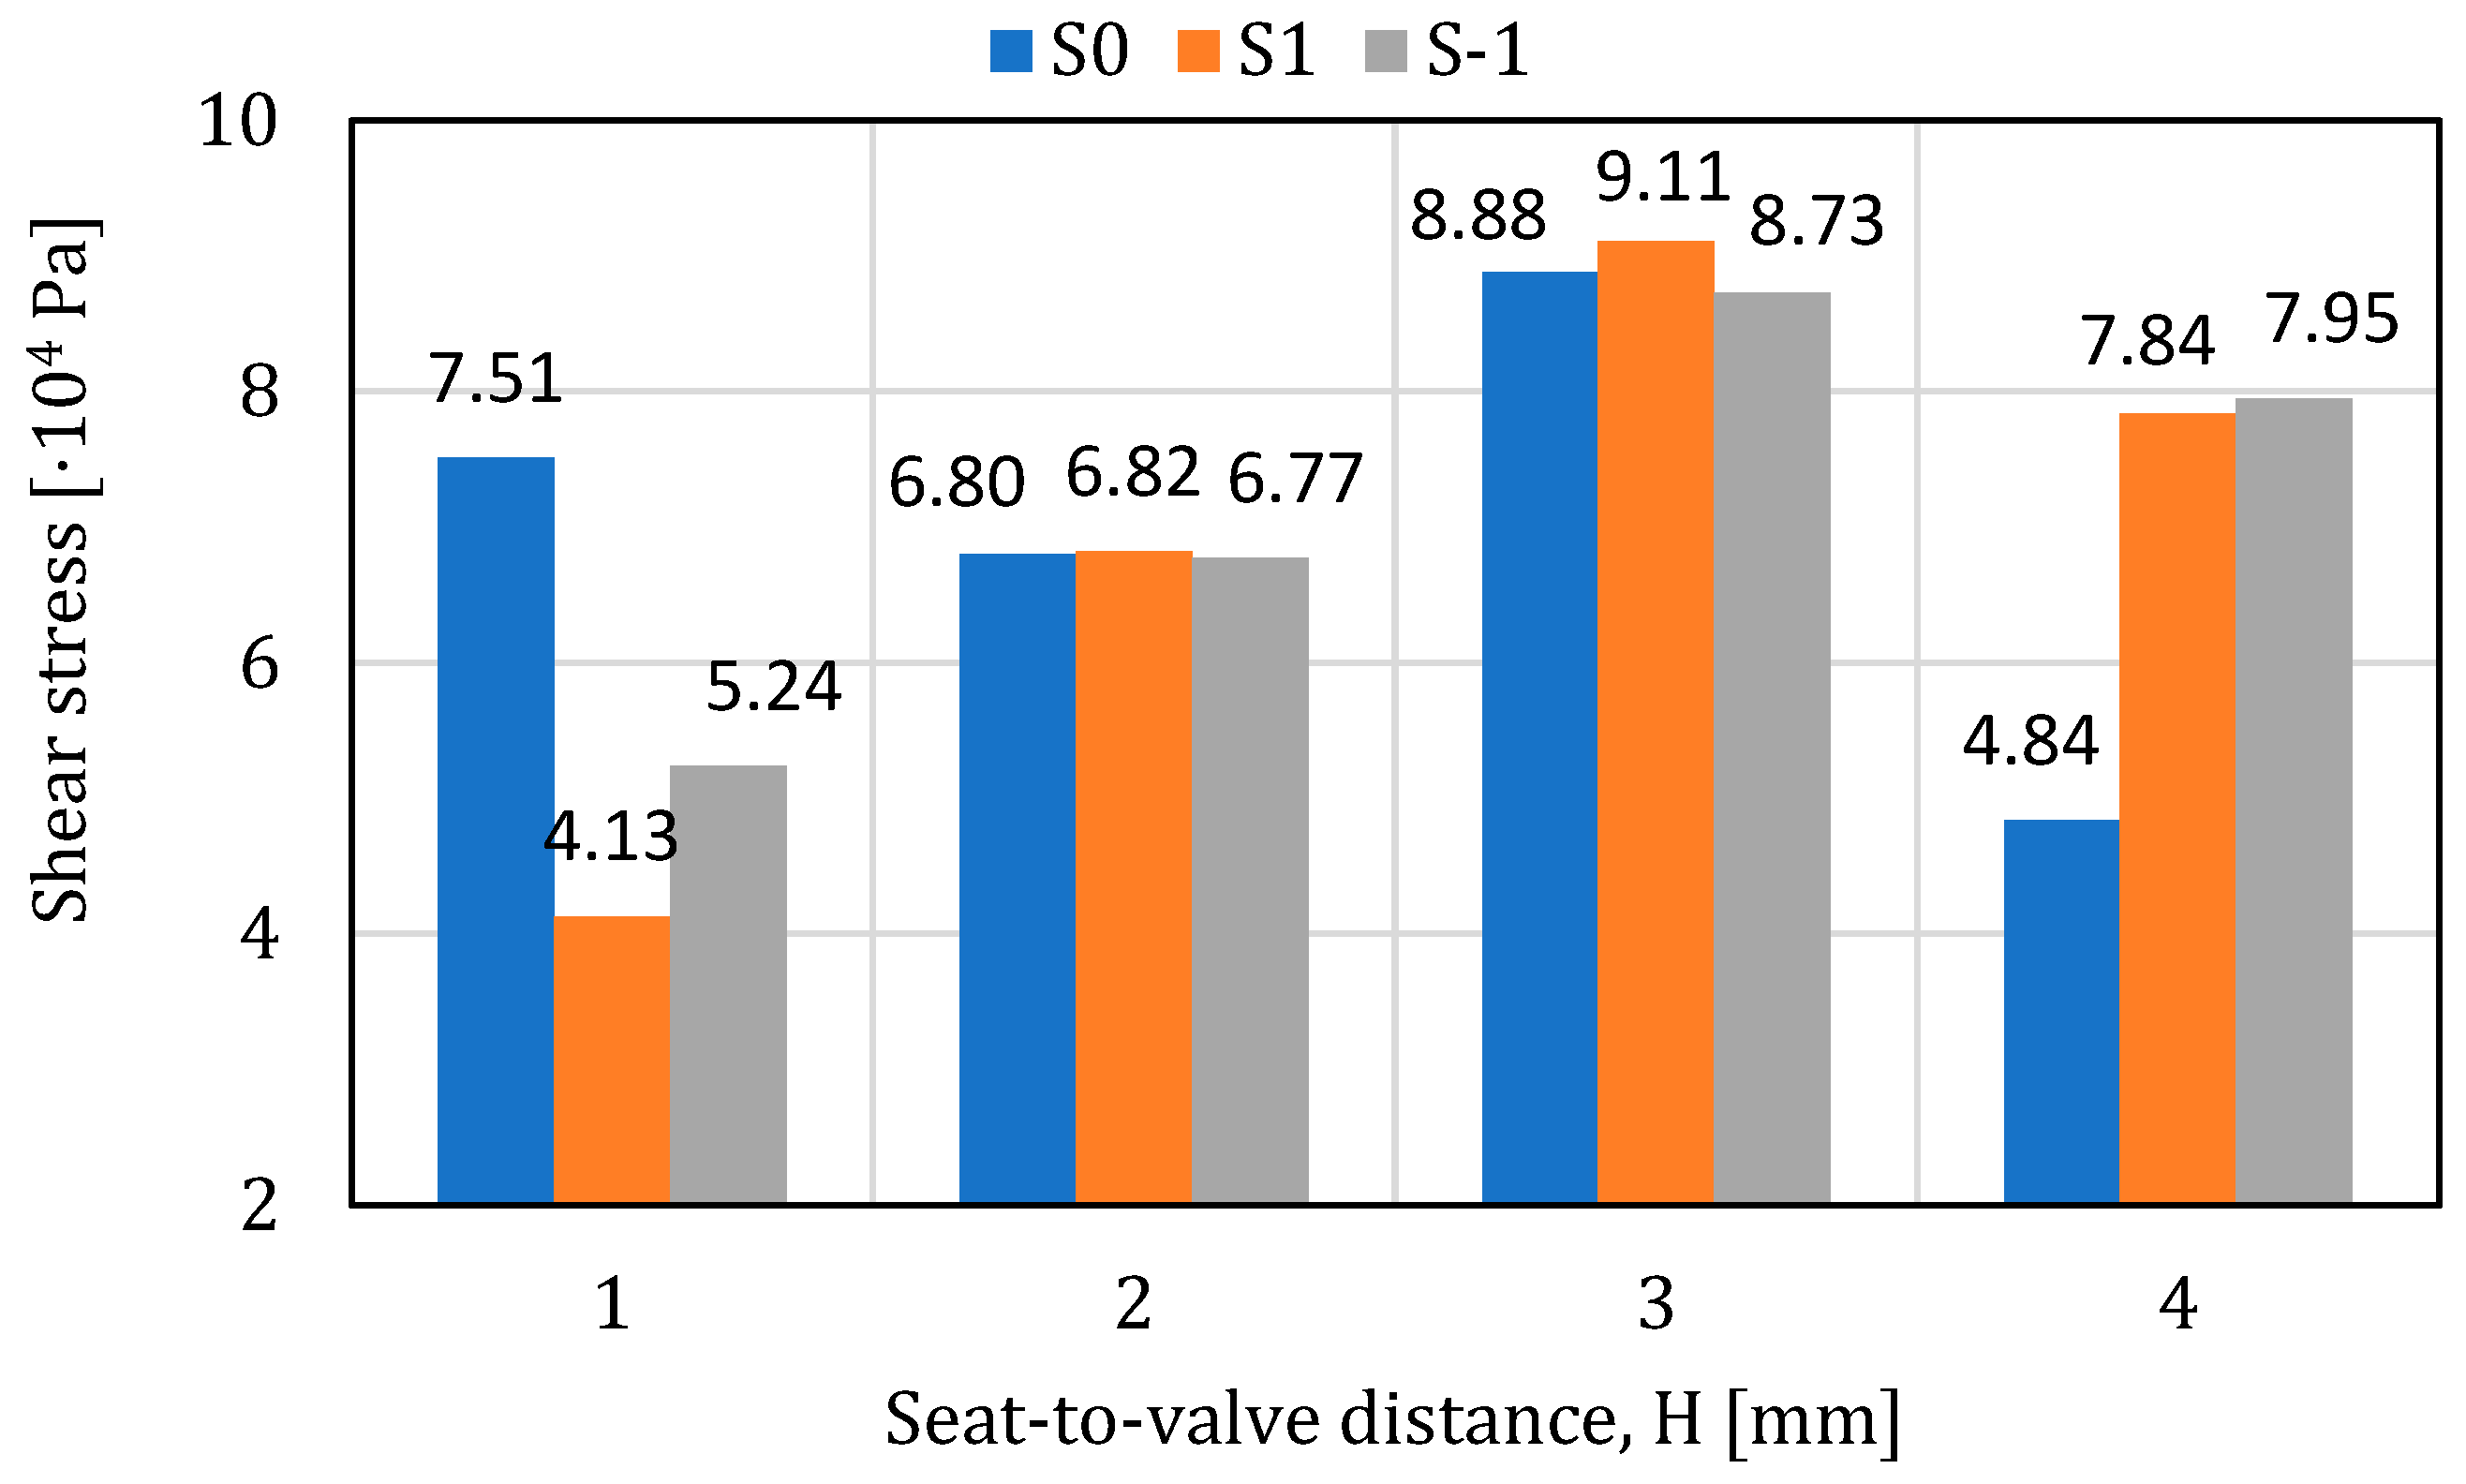
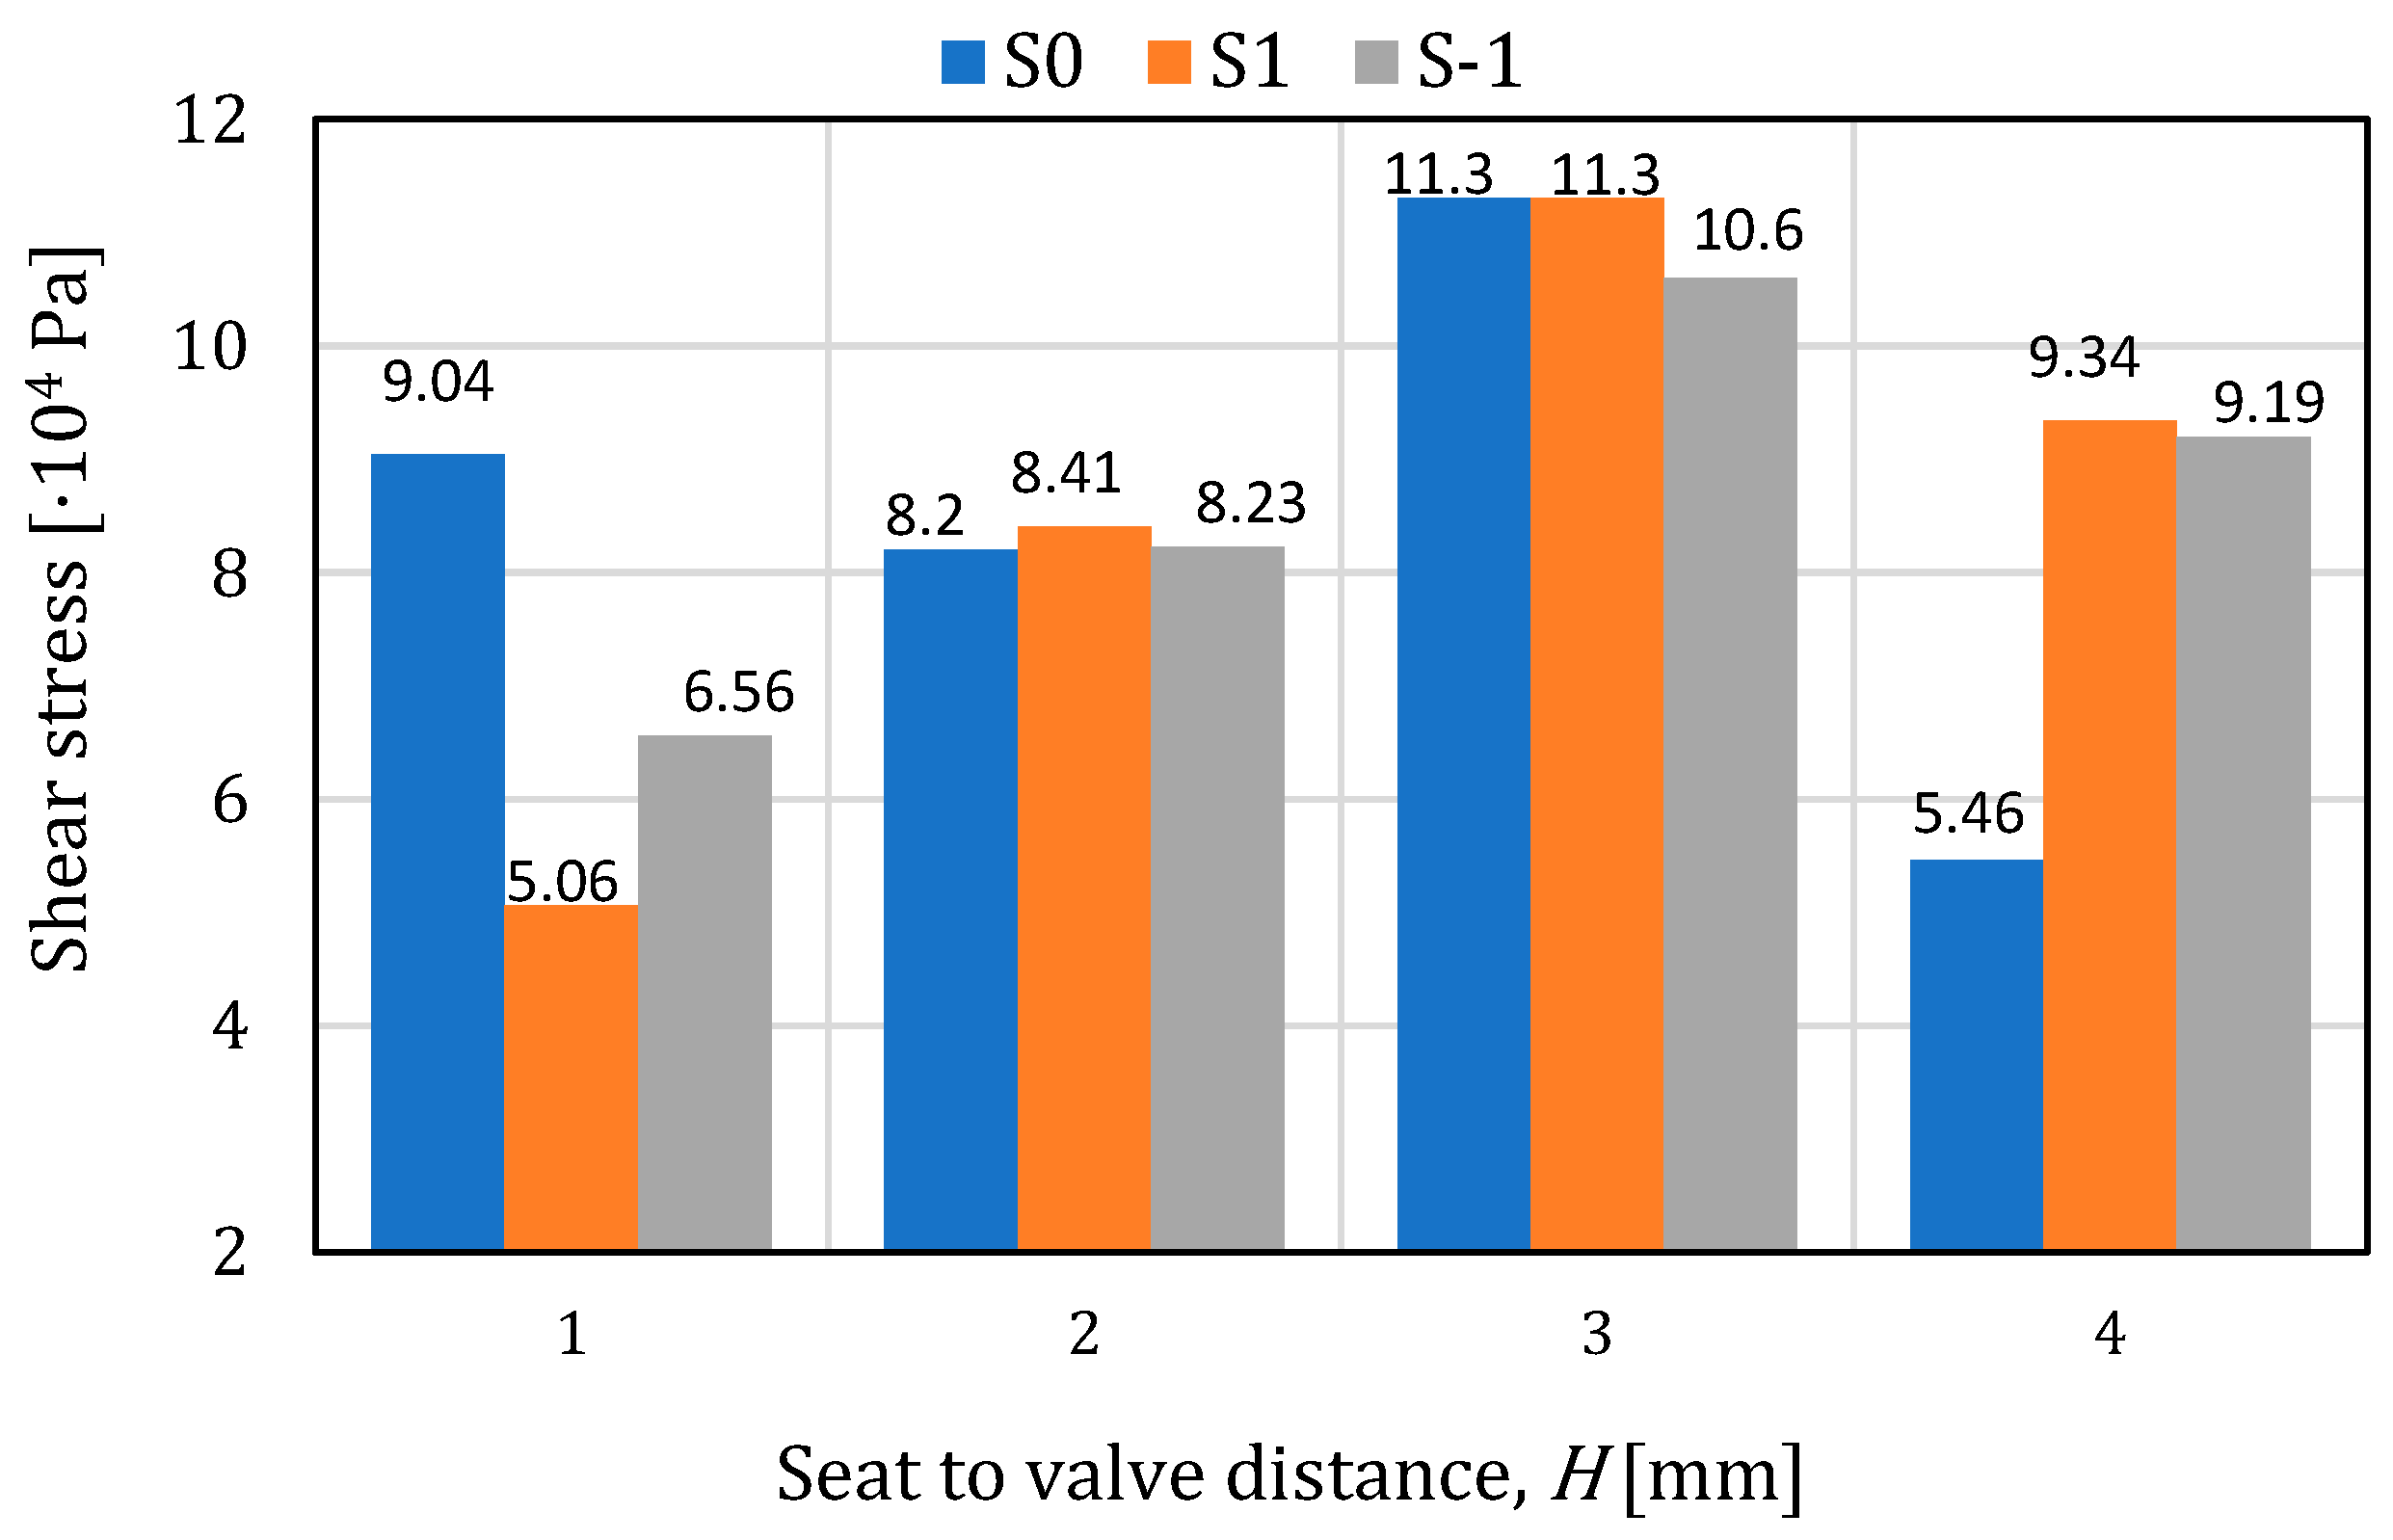
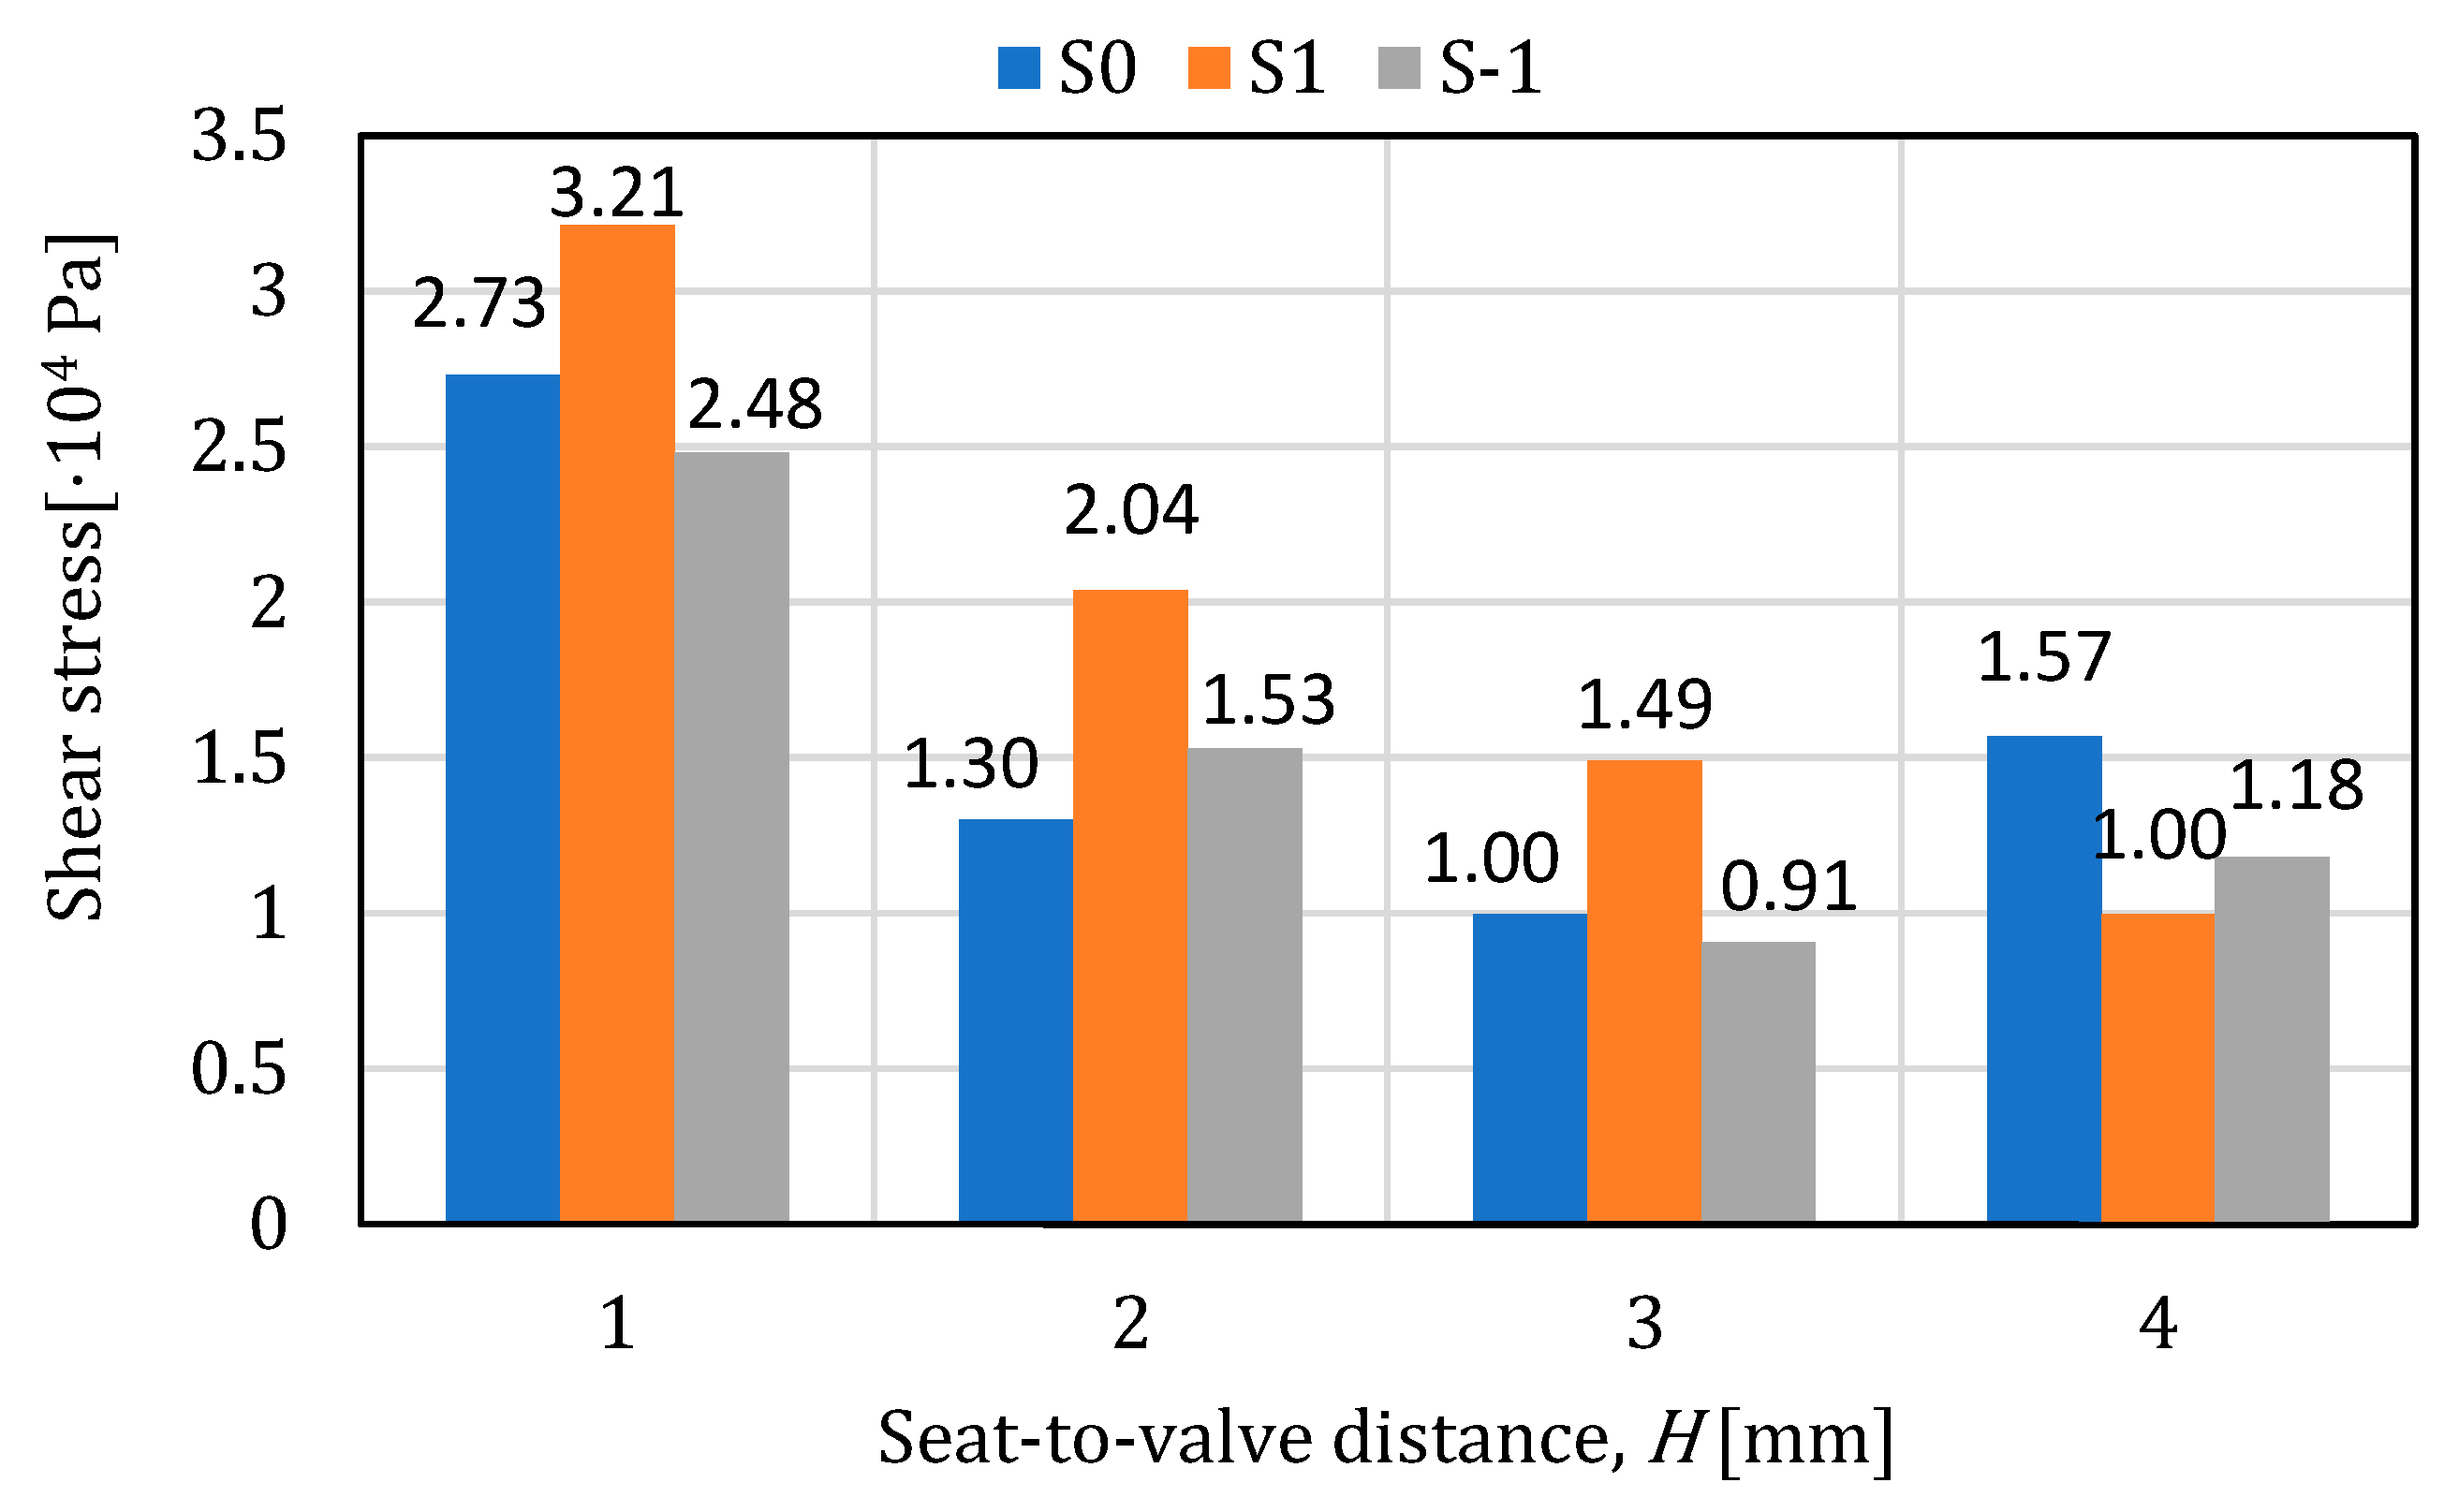
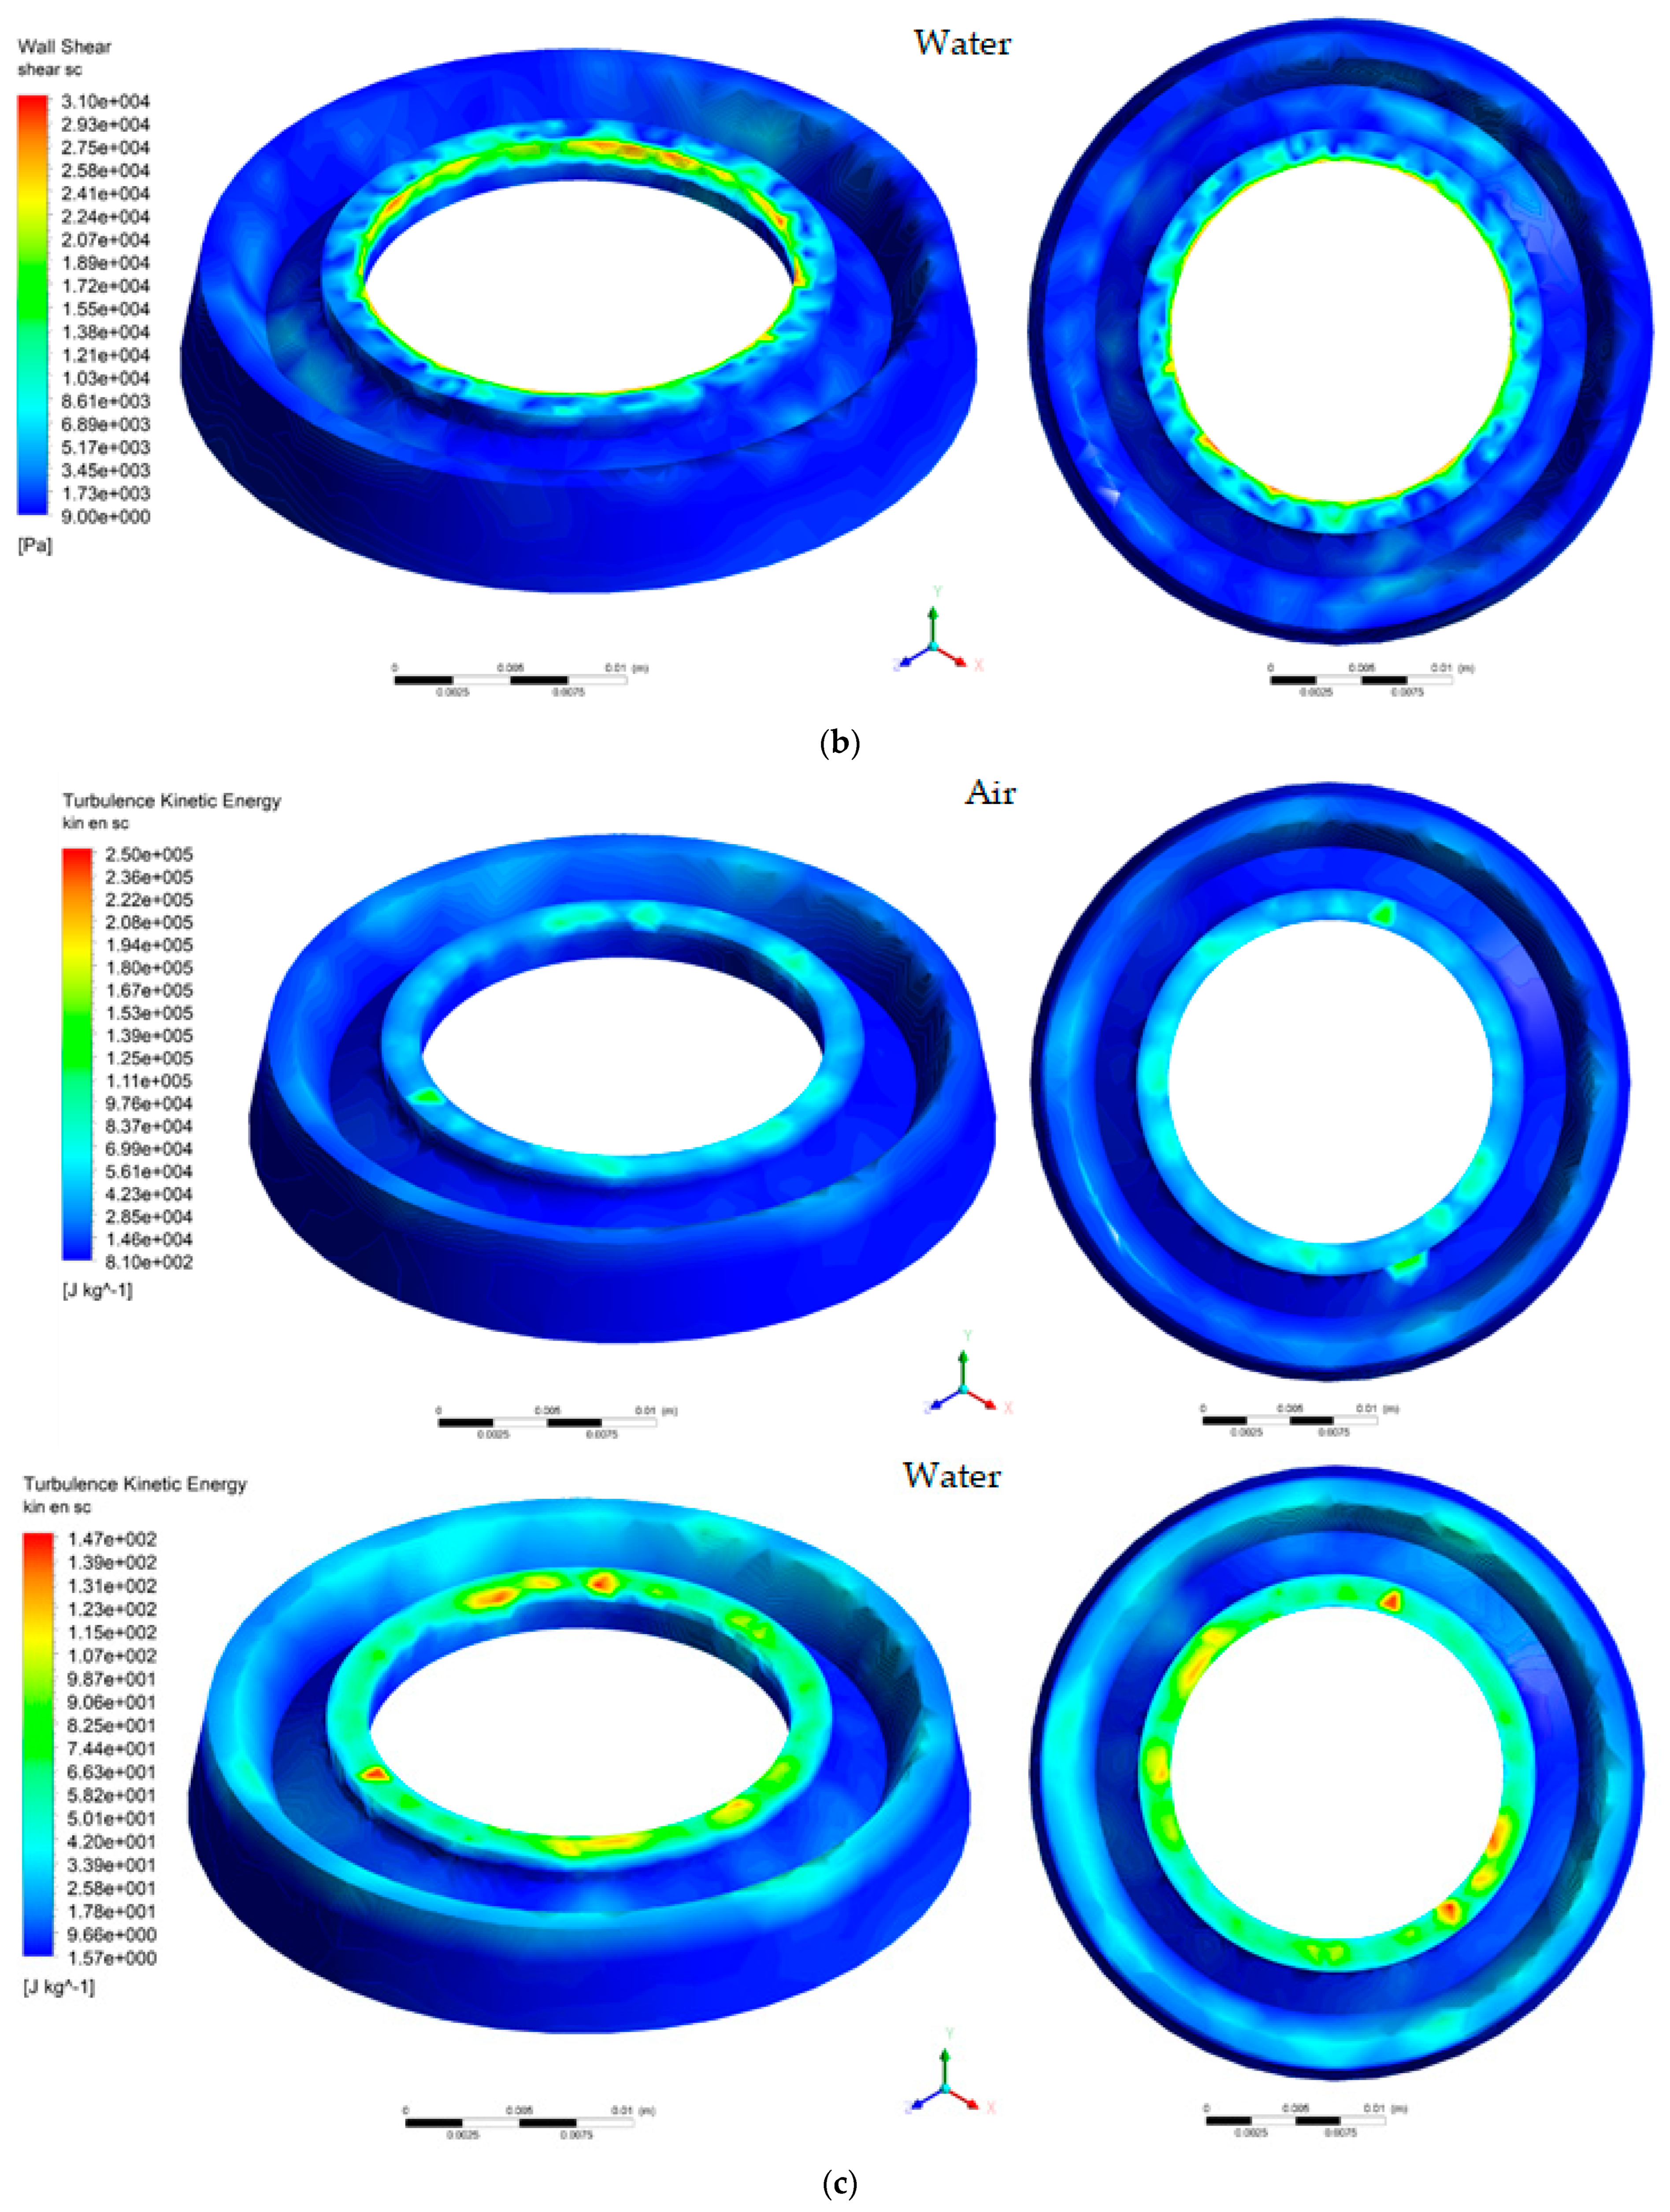
- The maximum values of the tangential stresses on the plate appear in most cases on the surface of the 0.4mm chamfer, and in the case of the seat, they vary randomly on its surface. The maximum value of the tangential stresses on the plate is 0.0911 MPa (air) and 0.113 MPa (water), and in the case of the seat, the maximum values were obtained at H1, having a decreasing variation depending on the seat–valve distance.
- ✓
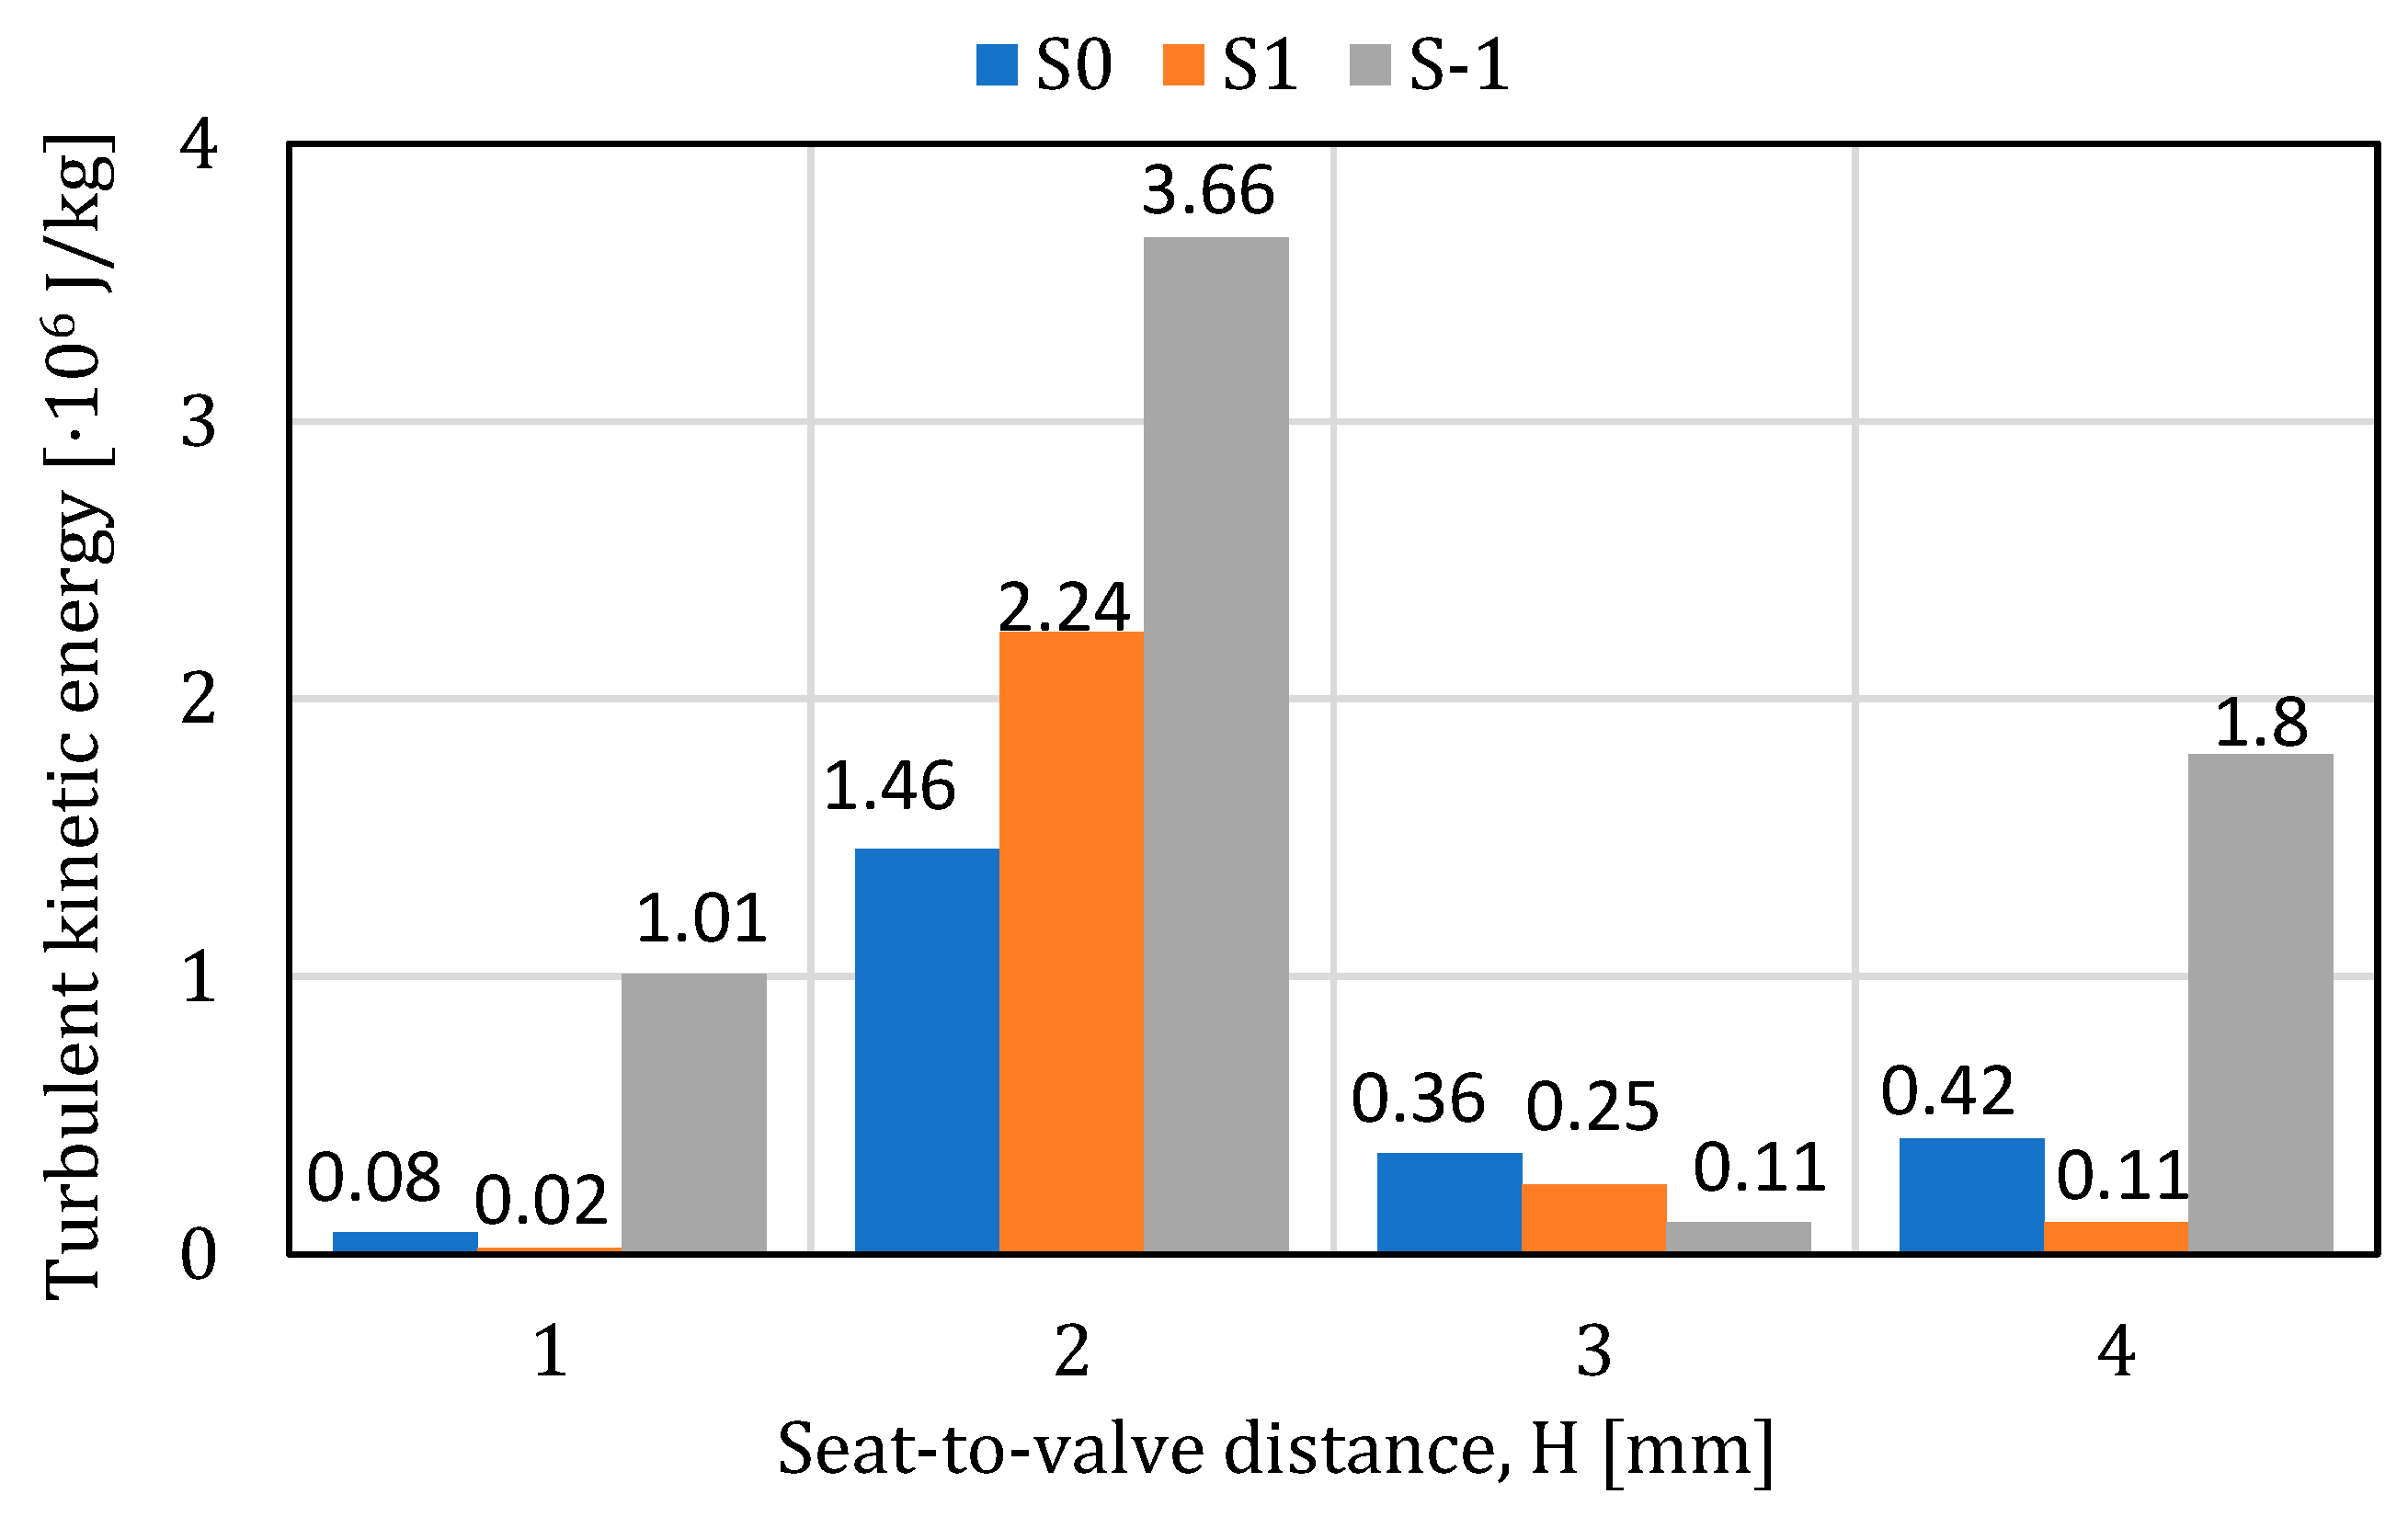
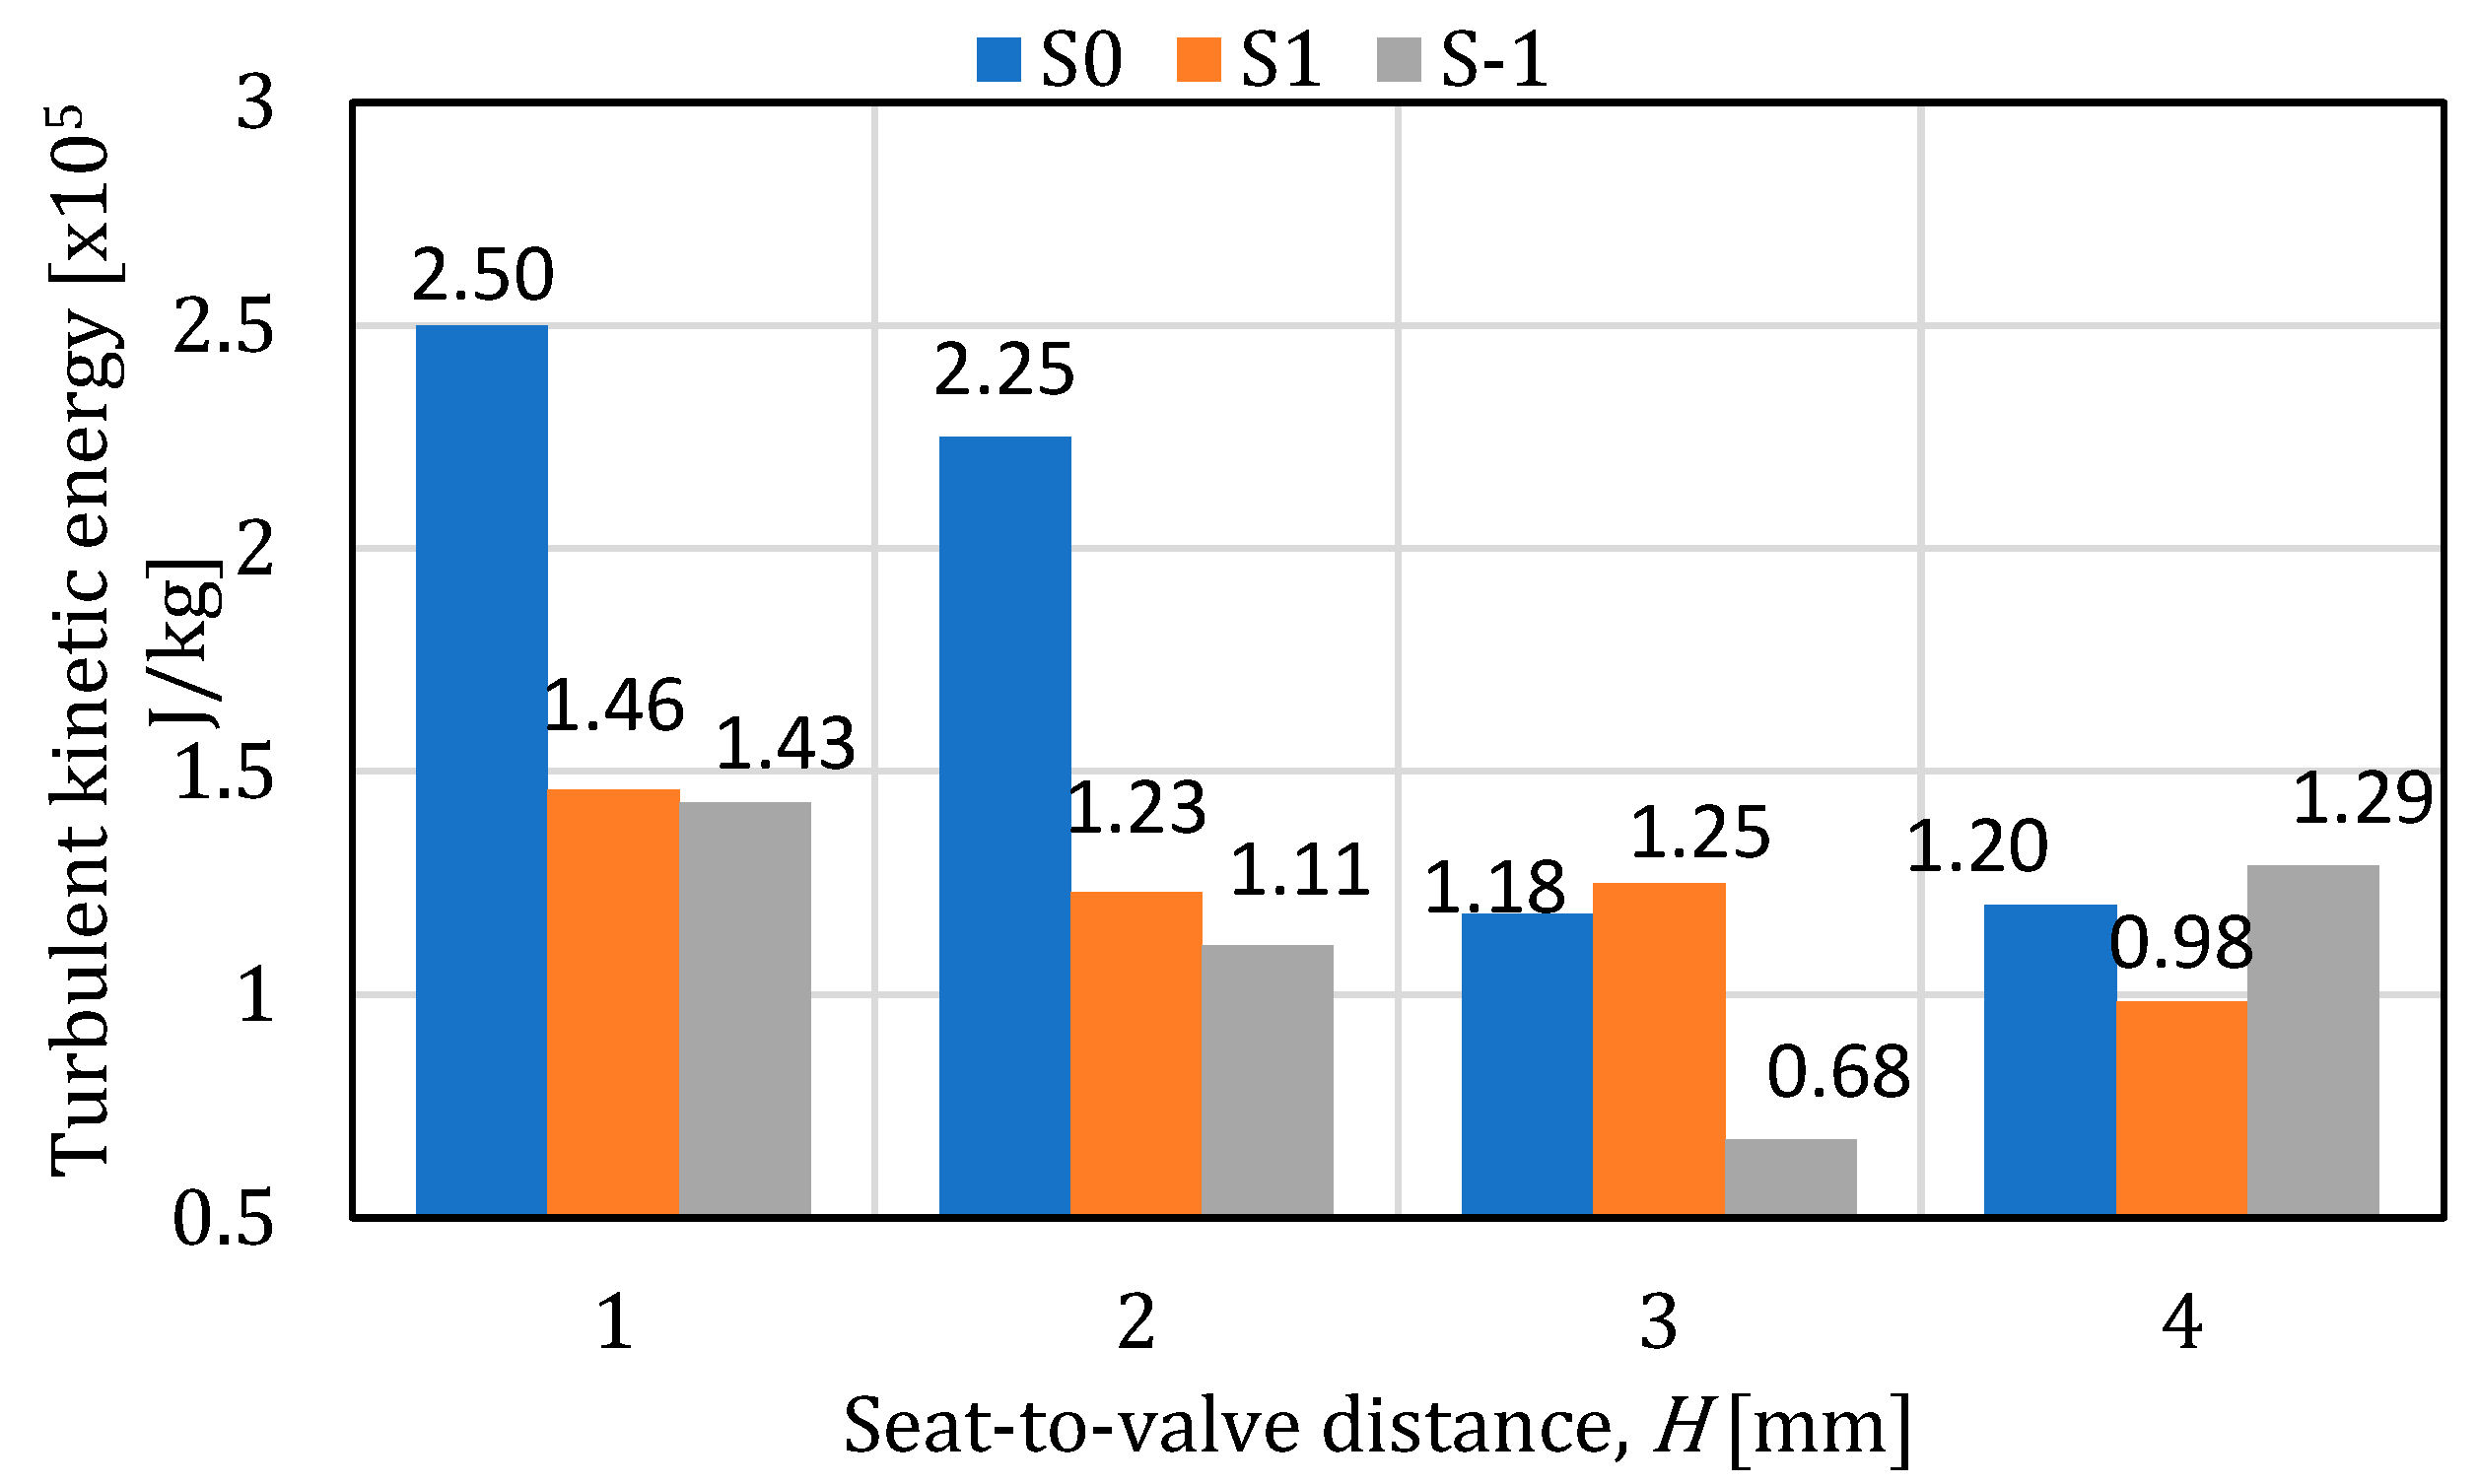
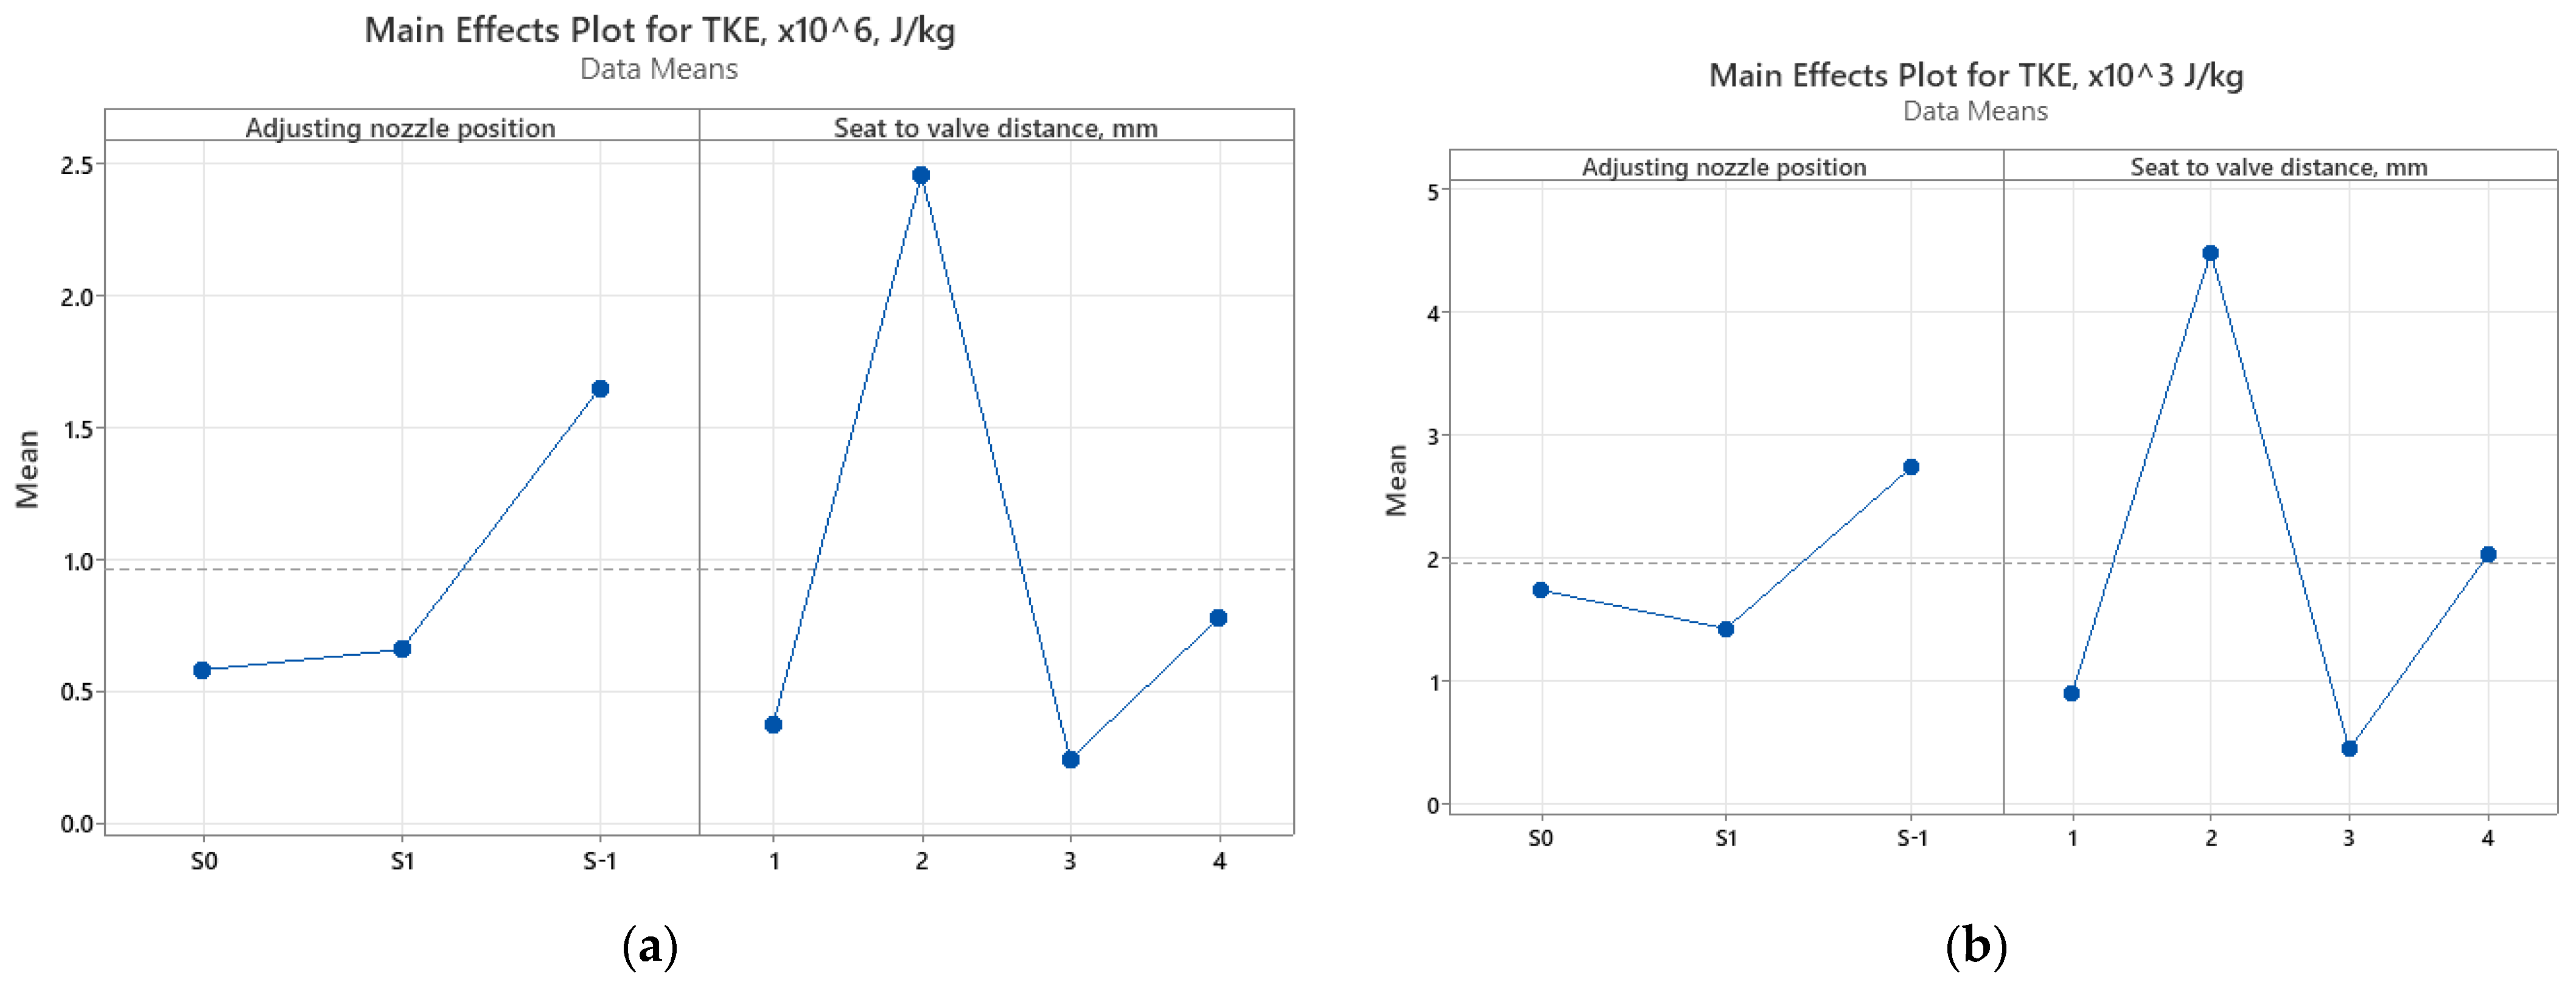
- In air environment, the turbulent kinetic energy has a random distribution over the surface of both the plate and the seat. In the case of the plate, the maximum value is 3660kJ/kg and was obtained in the S-1-H2 configuration. In the case of the seat, the turbulent kinetic energy has a relatively uniform variation for positions S1 and S-1, the highest value was obtained in the case of S0-H1, being 78.4kJ/kg.
- ✓
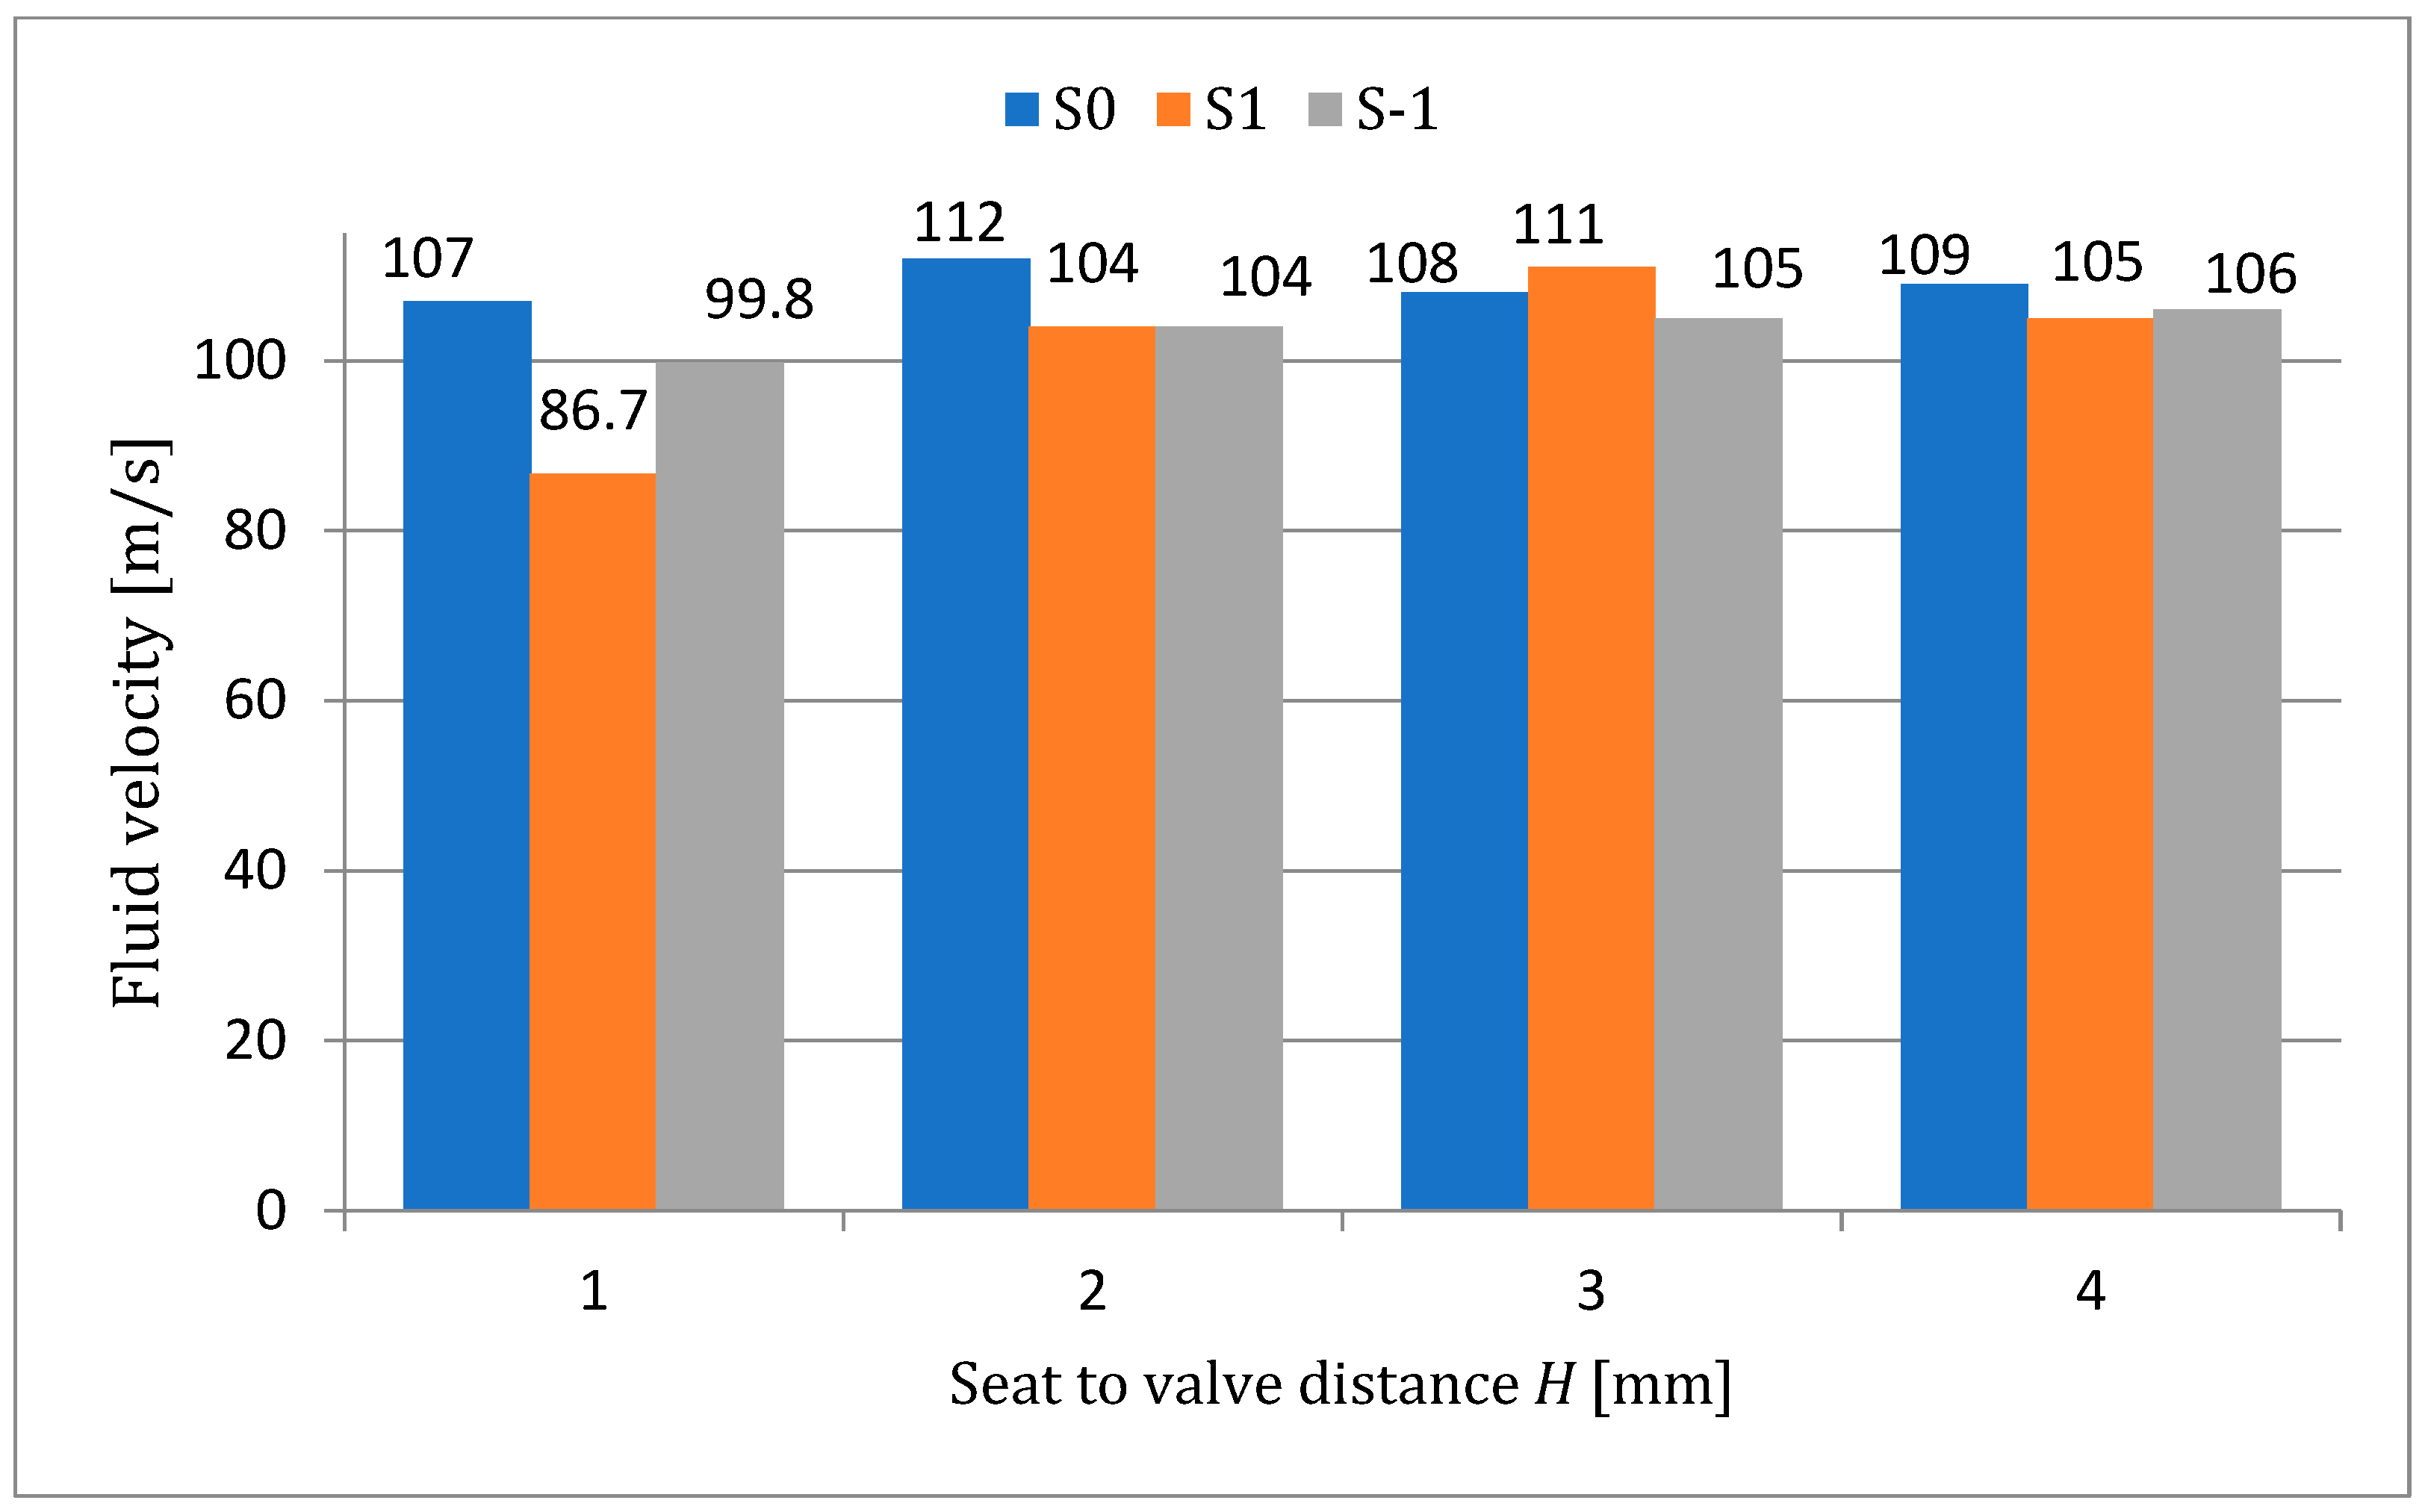
- In most of the analyzed cases, the maximum water speed was obtained in the space between the seat and the valve, this having the value of 112 m/s for the S0-H2 case. For cases where the adjusting nozzle is at or below the seat, the variation in water velocity is relatively small. The calculated difference between the extreme values is 5 m/s for the nozzle position S0 and about 6 m/s for S-1.
- ✓
- In the case of nozzle position S1, the watervelocity varies significantly compared to the other two, with the minimum value being 87 m/s for H1. At high fluid velocity, the turbulence created inside the valve body is much more pronounced, but the streamlines follow its configuration.
- ✓
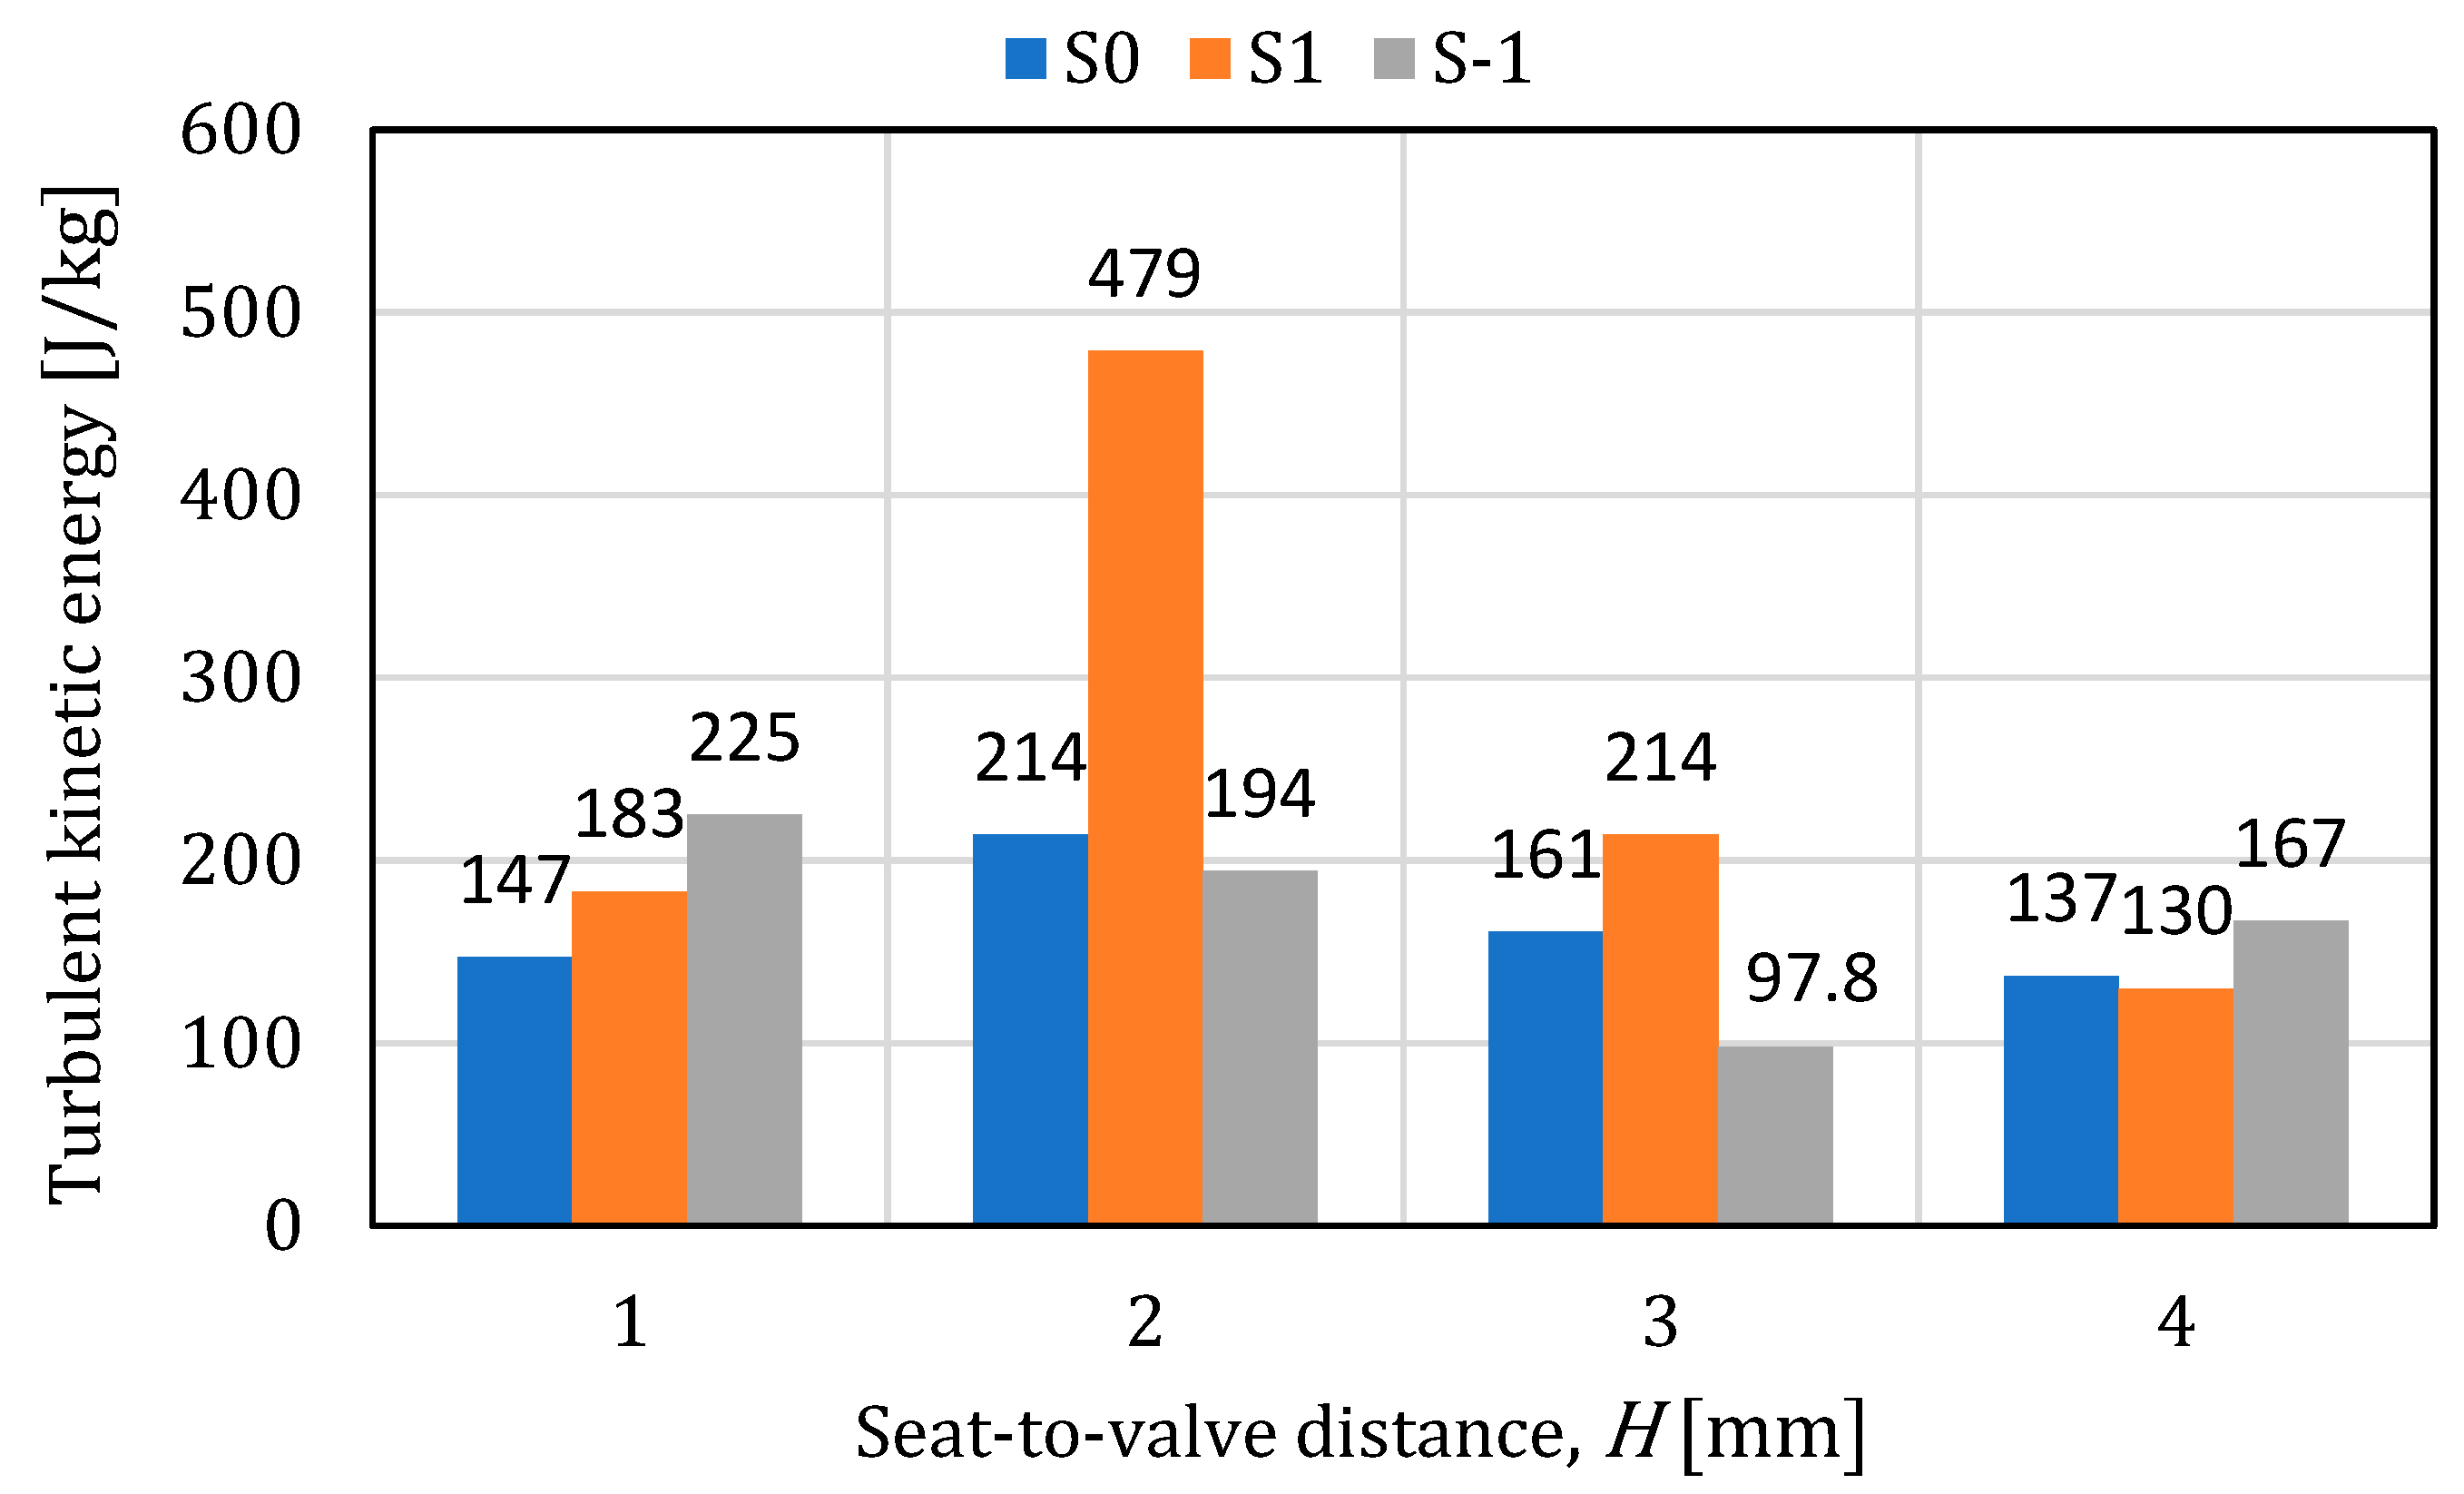
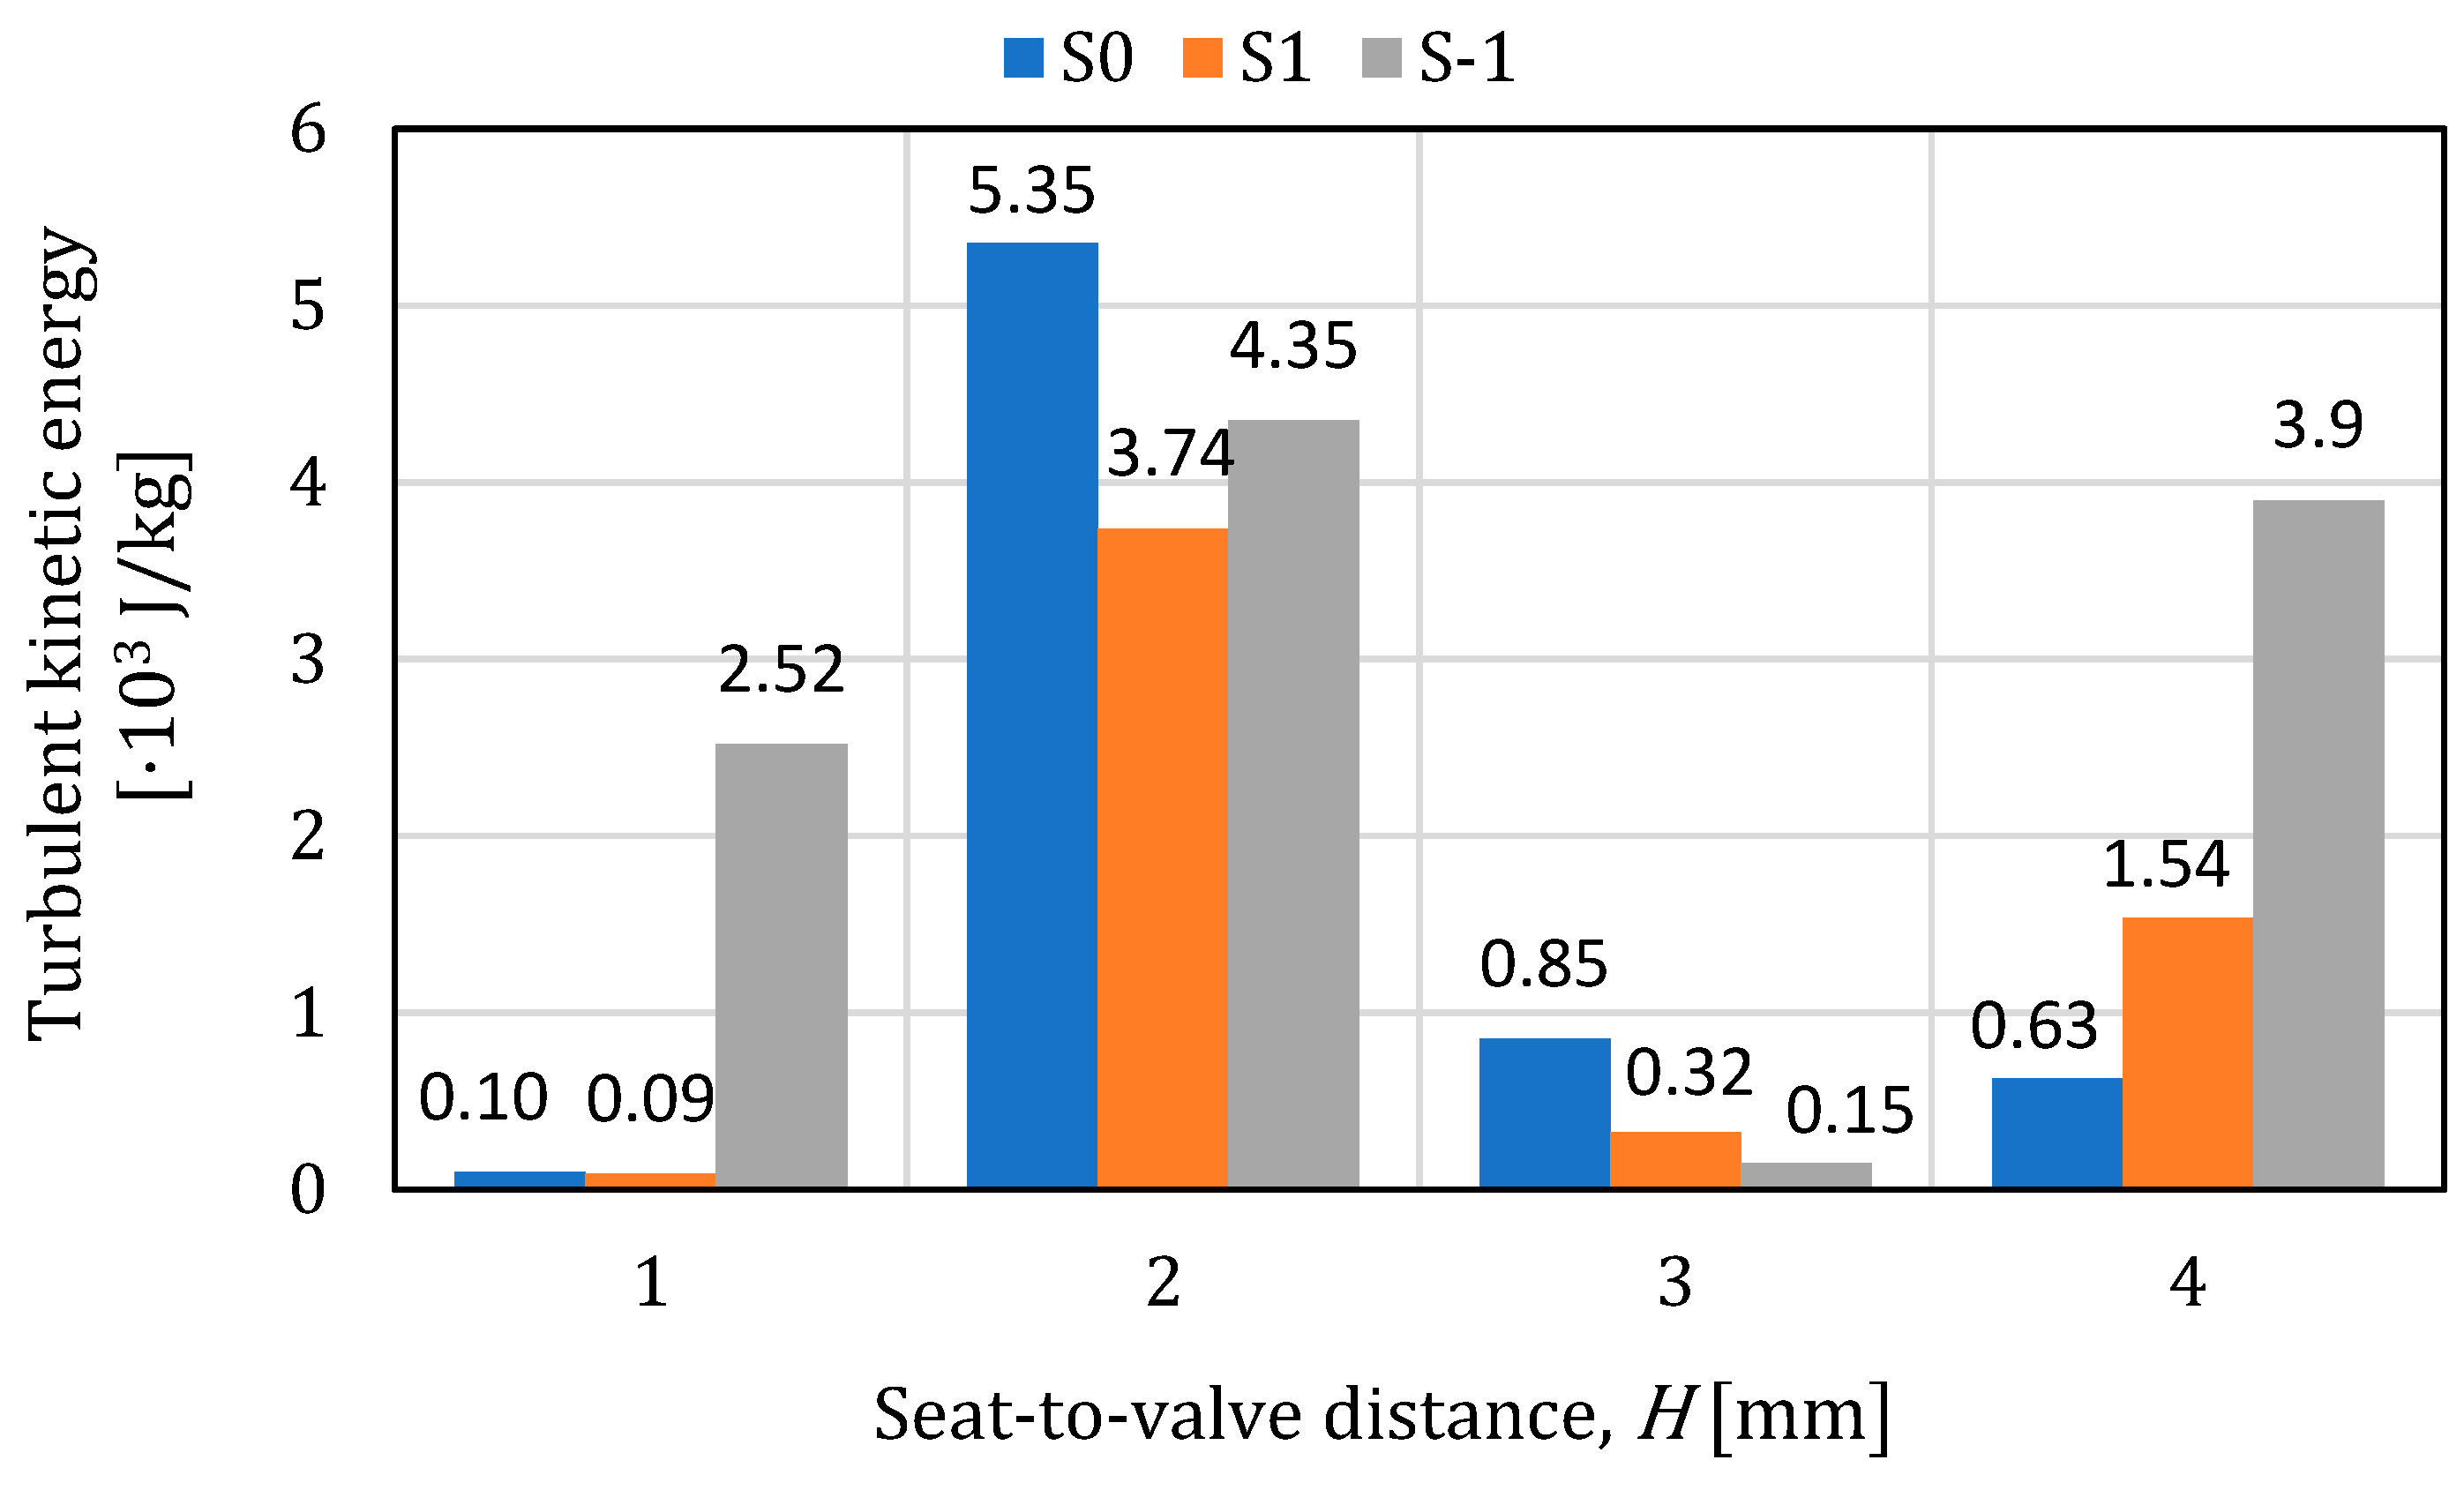
- In case of water, the turbulent kinetic energy has a random distribution over the surface of both the plate and the seat. In the case of the plate, the maximum value is 5350 J/kg and was obtained in the S0-H2 situation. In the case of the seat, the turbulent kinetic energy has a relatively uniform variation for positions S0 and S-1, the highest value was obtained in the case of S1-H2 and is 479 J/kg.
4. Conclusions
Author Contributions
Funding
Data Availability Statement
Conflicts of Interest
References
- Scuro, N.L.; Angelo, E.; Angelo, G.; Andrade, D.A. A CFD Analysis of the Flow Dynamics of a Directly-Operated Safety Relief Valve. Nucl. Eng. Des. 2018, 328, 321–332. [Google Scholar] [CrossRef]
- Dasgupta, K.; Karmakar, R. Dynamic Analysis of Pilot Operated Pressure Relief Valve. Simul. Model. Pract. Theory 2002, 10, 35–49. [Google Scholar] [CrossRef]
- Prescott, S.L.; Ulanicki, B. Dynamic Modeling of Pressure Reducing Valves. J. Hydraul. Eng. 2003, 129, 804–812. [Google Scholar] [CrossRef]
- Szpica, D.; Mieczkowski, G.; Borawski, A.; Leisis, V.; Diliunas, S.; Pilkaite, T. The Computational Fluid Dynamics (CFD) Analysis of the Pressure Sensor Used in Pulse-Operated Low-Pressure Gas-Phase Solenoid Valve Measurements. Sensors 2021, 21, 8287. [Google Scholar] [CrossRef]
- Lisowski, E.; Filo, G.; Rajda, J. Analysis of Energy Loss on a Tunable Check Valve through the Numerical Simulation. Energies 2022, 15, 5740. [Google Scholar] [CrossRef]
- Sun, Y.; Wu, J.; Xu, J.; Bai, X. Flow Characteristics Study of High-Parameter Multi-Stage Sleeve Control Valve. Processes 2022, 10, 1504. [Google Scholar] [CrossRef]
- Song, X.; Cui, L.; Cao, M.; Cao, W.; Park, Y.; Dempster, W.M. A CFD Analysis of the Dynamics of a Direct-Operated Safety Relief Valve Mounted on a Pressure Vessel. Energy Convers. Manag. 2014, 81, 407–419. [Google Scholar] [CrossRef]
- Alkhulaifi, K.; Alharbi, A.; Alardhi, M.; Alrajhi, J.; Almutairi, H.H. Comparative Analysis of the Performance Characteristics of Butterfly and Pinch Valves. Processes 2023, 11, 1897. [Google Scholar] [CrossRef]
- Yang, L.; Wang, Z.; Dempster, W.; Yu, X.; Tu, S.-T. Experiments and Transient Simulation on Spring-Loaded Pressure Relief Valve under High Temperature and High Pressure Steam Conditions. J. Loss Prev. Process Ind. 2017, 45, 133–146. [Google Scholar] [CrossRef]
- Makaryants, G.M. Fatigue Failure Mechanisms of a Pressure Relief Valve. J. Loss Prev. Process Ind. 2017, 48, 1–13. [Google Scholar] [CrossRef]
- Yuan, G.; Wang, Y.; Fang, Y.; Ma, R.; Ning, K.; Tang, Y. High-Temperature and Pressure Downhole Safety Valve Performance Envelope Curve Study. Processes 2023, 11, 2525. [Google Scholar] [CrossRef]
- Song, X.-G.; Park, Y.-C.; Park, J.-H. Blowdown Prediction of a Conventional Pressure Relief Valve with a Simplified Dynamic Model. Math. Comput. Model. 2013, 57, 279–288. [Google Scholar] [CrossRef]
- Erdődi, I.; Hős, C. Prediction of Quarter-Wave Instability in Direct Spring Operated Pressure Relief Valves with Upstream Piping by Means of CFD and Reduced Order Modelling. J. Fluids Struct. 2017, 73, 37–52. [Google Scholar] [CrossRef]
- Desai, S.; Desai, A.; Karande, V. Design and Weight Optimization of Buffer Relief Valve Using FEA with Experimental Validation. Mater. Today Proc. 2020, 27, 1466–1472. [Google Scholar] [CrossRef]
- Hős, C.J.; Champneys, A.R.; Paul, K.; McNeely, M. Dynamic Behavior of Direct Spring Loaded Pressure Relief Valves in Gas Service: Model Development, Measurements and Instability Mechanisms. J. Loss Prev. Process Ind. 2014, 31, 70–81. [Google Scholar] [CrossRef]
- Bazsó, C.; Hős, C.J. An Experimental Study on the Stability of a Direct Spring Loaded Poppet Relief Valve. J. Fluids Struct. 2013, 42, 456–465. [Google Scholar] [CrossRef]
- Darby, R. The Dynamic Response of Pressure Relief Valves in Vapor or Gas Service, Part I: Mathematical Model. J. Loss Prev. Process Ind. 2013, 26, 1262–1268. [Google Scholar] [CrossRef]
- Aldeeb, A.A.; Darby, R.; Arndt, S. The Dynamic Response of Pressure Relief Valves in Vapor or Gas Service. Part II: Experimental Investigation. J. Loss Prev. Process Ind. 2014, 31, 127–132. [Google Scholar] [CrossRef]
- Darby, R.; Aldeeb, A.A. The Dynamic Response of Pressure Relief Valves in Vapor or Gas Service. Part III: Model Validation. J. Loss Prev. Process Ind. 2014, 31, 133–141. [Google Scholar] [CrossRef]
- Karpenko, M.; Stosiak, M.; Šukevičius, Š.; Skačkauskas, P.; Urbanowicz, K.; Deptuła, A. Hydrodynamic Processes in Angular Fitting Connections of a Transport Machine’s Hydraulic Drive. Machines 2023, 11, 355. [Google Scholar] [CrossRef]
- Stosiak, M.; Karpenko, M.; Deptuła, A.; Urbanowicz, K.; Skačkauskas, P.; Deptuła, A.M.; Danilevičius, A.; Šukevičius, Š.; Łapka, M. Research of Vibration Effects on a Hydraulic Valve in the Pressure Pulsation Spectrum Analysis. JMSE 2023, 11, 301. [Google Scholar] [CrossRef]
- Stosiak, M.; Karpenko, M.; Prentkovskis, O.; Deptuła, A.; Skačkauskas, P. Research of Vibrations Effect on Hydraulic Valves in Military Vehicles. Def. Technol. 2023, in press. [Google Scholar] [CrossRef]
- Budziszewski, A.; Thorén, L. CFD Simulation of a Safety Relief Valve for Improvement of a One-Dimensional Valve Model in RELAP5. Master’s Thesis, Chalmers University of Technology, Gothenburg, Sweden, 2012. [Google Scholar]
- Singh, R.; Ahmed, R.; Karami, H.; Nasser, M.; Hussein, I. CFD Analysis of Turbulent Flow of Power-Law Fluid in a Partially Blocked Eccentric Annulus. Energies 2021, 14, 731. [Google Scholar] [CrossRef]
- Leutwyler, Z.; Dalton, C. A CFD Study of the Flow Field, Resultant Force, and Aerodynamic Torque on a Symmetric Disk Butterfly Valve in a Compressible Fluid. J. Press. Vessel. Technol. 2008, 130, 021302. [Google Scholar] [CrossRef]
- Leutwyler, Z.; Dalton, C. A Computational Study of Torque and Forces Due to Compressible Flow on a Butterfly Valve Disk in Mid-Stroke Position. J. Fluids Eng. 2006, 128, 1074–1082. [Google Scholar] [CrossRef]
- Nazif, H.R.; Basirat Tabrizi, H. Applying a Non-Equilibrium Wall Function in k–ε Turbulent Modelling of Hydrodynamic Circulating Flow. Appl. Math. Model. 2014, 38, 588–598. [Google Scholar] [CrossRef]
- Parente, A.; Gorlé, C.; van Beeck, J.; Benocci, C. Improved k–ε Model and Wall Function Formulation for the RANS Simulation of ABL Flows. J. Wind. Eng. Ind. Aerodyn. 2011, 99, 267–278. [Google Scholar] [CrossRef]
- Nazif, H.R.; Basirat Tabrizi, H.; Farhadpour, F.A. Comparative Analysis of the Boundary Transfer Method with Other Near-Wall Treatments Based on the—Turbulence Model. Eur. J. Mech.—B/Fluids 2014, 44, 22–31. [Google Scholar] [CrossRef]
- Nazif, H.R.; Tabrizi, H.B. Comparison of Standard Turbulent Wall Function with a Non-Equilibrium Wall Model. Inter. J. Fluid Mech. Res. 2011, 38, 499–508. [Google Scholar] [CrossRef]
- El Gharbi, N.; Absi, R. Effect of Different Near-Wall Treatments on Indoor Airflow Simulations. JAFM 2012, 5, 63–70. [Google Scholar] [CrossRef]
- Francis, J.; Betts, P.L. Modelling Incompressible Flow in a Pressure Relief Valve. Proc. Inst. Mech. Eng. Part E J. Process Mech. Eng. 1997, 211, 83–93. [Google Scholar] [CrossRef]
- D’Addona, D.M.; Raykar, S.J.; Singh, D.; Kramar, D. Multi Objective Optimization of Fused Deposition Modeling Process Parameters with Desirability Function. Procedia CIRP 2021, 99, 707–710. [Google Scholar] [CrossRef]
- Zisopol, D.G.; Tănase, M.; Portoacă, A.I. Innovative Strategies for Technical-Economical Optimization of FDM Production. Polymers 2023, 15, 3787. [Google Scholar] [CrossRef] [PubMed]


| Maximum distance seat–valve, [mm] | 4 |
| Adjustment pressure, [MPa] | 4 |
| Closing pressure, [MPa] | 3.4 |
| Discharge pressure, [MPa] | 4.4 |
| Pressure | PN40 |
| Material | G20Mn5 |
| Set pressure [MPa] | 4 |
| Spring range [MPa] | 3.2–4 |
| Maximum temperature [°C] | 300 |
| Rated coefficient of discharge | 0.7 |
| Applicable medium | Water, oil, gas etc. |
| Wire diameter, d [mm] | 7.5 |
| Mean radius, R [mm] | 18 |
| The number of turns, n | 8.5 |
| Pitch, p [mm] | 12.5 |
| Analytical determination | 85.77 [N/mm] |
| Experimental determination | 83.73 [N/mm] |
| The flow model | k-epsilon [1,8,23,24,25,26], Realizable, non-equilibrium wall function [23] |
| Environment: air/water | Air density: 1.204 kg/m3 Water density: 998.2 kg/m3 Air dynamic viscosity: 1.813·10−5 kg/(m·s) Water dynamic viscosity: 1.003·10−3 kg/(m·s) |
| Connection conditions | Inlet pressure: (4.1–4.4) MPa Outlet pressure: 0.1 MPa |
| Type of analysis | Steady, 300 iteration |
| Position of Adjusting Nozzle | Seat-to-Valve Distance, H [mm] | |||||||
|---|---|---|---|---|---|---|---|---|
| H1 | H2 | H3 | H4 | |||||
| Air | Water | Air | Water | Air | Water | Air | Water | |
| S0 | 3080 | 107 | 3210 | 112 | 3060 | 108 | 3160 | 109 |
| S1 | 2490 | 86.7 | 2940 | 104 | 3115 | 111 | 3020 | 105 |
| S-1 | 2850 | 99.8 | 2900 | 104 | 3010 | 105 | 3010 | 106 |
| Simulation No | Adjusting Nozzle Position | Seat to Valve Distance, mm | Greater Is Better | Smaller Is Better | ||
|---|---|---|---|---|---|---|
| Composite Desirability | Rank | Composite Desirability | Rank | |||
| 1 | S0 | 1 | 0.000 | 10 | 0.915 | 1 |
| 2 | S0 | 2 | 0.825 | 2 | 0.832 | 5 |
| 3 | S0 | 3 | 0.000 | 10 | 0.716 | 9 |
| 4 | S0 | 4 | 0.681 | 7 | 0.905 | 2 |
| 5 | S1 | 1 | 0.542 | 8 | 0.844 | 4 |
| 6 | S1 | 2 | 0.810 | 3 | 0.790 | 8 |
| 7 | S1 | 3 | 0.000 | 10 | 0.694 | 11 |
| 8 | S1 | 4 | 0.682 | 6 | 0.865 | 3 |
| 9 | S-1 | 1 | 0.772 | 4 | 0.828 | 7 |
| 10 | S-1 | 2 | 0.839 | 1 | 0.704 | 10 |
| 11 | S-1 | 3 | 0.425 | 9 | 0.594 | 12 |
| 12 | S-1 | 4 | 0.769 | 5 | 0.831 | 6 |
| Simulation No | Adjusting Nozzle Position | Seat to Valve Distance, mm | Greater Is Better | Smaller Is Better | ||
|---|---|---|---|---|---|---|
| Composite Desirability | Rank | Composite Desirability | Rank | |||
| 1 | S0 | 1 | 0.364 | 8 | 0.728 | 1 |
| 2 | S0 | 2 | 0.720 | 1 | 0.462 | 7 |
| 3 | S0 | 3 | 0.103 | 11 | 0.357 | 9 |
| 4 | S0 | 4 | 0.550 | 5 | 0.703 | 2 |
| 5 | S1 | 1 | 0.228 | 9 | 0.598 | 4 |
| 6 | S1 | 2 | 0.620 | 3 | 0.443 | 8 |
| 7 | S1 | 3 | 0.000 | 12 | 0.312 | 10 |
| 8 | S1 | 4 | 0.455 | 6 | 0.639 | 3 |
| 9 | S-1 | 1 | 0.436 | 7 | 0.577 | 5 |
| 10 | S-1 | 2 | 0.701 | 2 | 0.190 | 12 |
| 11 | S-1 | 3 | 0.158 | 10 | 0.245 | 11 |
| 12 | S-1 | 4 | 0.582 | 4 | 0.572 | 6 |
Disclaimer/Publisher’s Note: The statements, opinions and data contained in all publications are solely those of the individual author(s) and contributor(s) and not of MDPI and/or the editor(s). MDPI and/or the editor(s) disclaim responsibility for any injury to people or property resulting from any ideas, methods, instructions or products referred to in the content. |
© 2023 by the authors. Licensee MDPI, Basel, Switzerland. This article is an open access article distributed under the terms and conditions of the Creative Commons Attribution (CC BY) license (https://creativecommons.org/licenses/by/4.0/).
Share and Cite
Cană, P.; Ripeanu, R.G.; Pătîrnac, I.; Diniță, A.; Tănase, M. Investigating the Impact of Operating Conditions on Relief Pressure Valve Flow through CFD and Statistical Analysis. Processes 2023, 11, 3396. https://doi.org/10.3390/pr11123396
Cană P, Ripeanu RG, Pătîrnac I, Diniță A, Tănase M. Investigating the Impact of Operating Conditions on Relief Pressure Valve Flow through CFD and Statistical Analysis. Processes. 2023; 11(12):3396. https://doi.org/10.3390/pr11123396
Chicago/Turabian StyleCană, Petrică, Razvan George Ripeanu, Iulian Pătîrnac, Alin Diniță, and Maria Tănase. 2023. "Investigating the Impact of Operating Conditions on Relief Pressure Valve Flow through CFD and Statistical Analysis" Processes 11, no. 12: 3396. https://doi.org/10.3390/pr11123396
APA StyleCană, P., Ripeanu, R. G., Pătîrnac, I., Diniță, A., & Tănase, M. (2023). Investigating the Impact of Operating Conditions on Relief Pressure Valve Flow through CFD and Statistical Analysis. Processes, 11(12), 3396. https://doi.org/10.3390/pr11123396