Abstract
The effect of hollow glass beads on poly(ε-caprolactone) (PCL) oxidative degradation has been evaluated by the non-isothermal chemiluminescence (CL) method and thermogravimetry analysis (TGA). The main goal of the research and this publication was to reduce the production costs associated with the materials for 3D printing, which would also have a low mass, excellent biocompatibility and suitable thermal properties. Experiments have clearly shown the dual effect of a filler and its extent in terms of poly(ε-caprolactone). The chosen methods demonstrate the superposition of both the pro-degradation and stabilization effects of hollow glass beads on the polymer. The former was evident above the load of 10 wt.% of filler. The non-isothermal TGA records were analyzed as being composed of three temperature-dependent processes of the first-order kinetics. A massive compensation effect between the so-called activation energy and the logarithm of pre-exponential factors for heating rates of 2.5, 5 and 10 °C/min has been shown to be typical for similar non-isothermal thermogravimetry evaluation.
1. Introduction
A large number of thermoplastics are available with fillers that are mainly added to optimize material properties such as stiffness, fire resistance, thermo-oxidation stability, etc. Additionally, fillers in thermo-oxidation may act either as pro-degradants or stabilizers. Their effect is determined by the extent of the interaction between the filler and polymer, and by the filler load. The morphology of the polymer and the flow behavior of the polymer melt containing filler during its processing can impact the sample’s mechanical response and resistance to oxidative stress.
Glass beads are high-strength, low-density hollow glass microspheres made from soda–lime silicate glass. They are chemically stable and provide excellent water and oil resistance. If they are porous, they may serve as an encapsulation substrate of some other additive, e.g., a stabilizer, and thus provide larger flexibility in preparing “tailor-made” polymers. They are incorporated into a wide range of polymers, usually for density reduction of a polymer product. Glass beads are also preferred as fillers, especially when composite properties such as isotropy or a low melt viscosity are essential [1]. At the same time, the orientation effects associated with molding in the presence of such fillers should be minimal.
Poly(ε-caprolactone) (PCL) is a biodegradable polymer that may potentially be used as a replacement for synthetic polymers in biomedical applications and environmentally acceptable packaging. Long-time properties determined by the ease of PCL degradation do not seem to have been largely investigated, although some aspects such as the conditions of its synthesis, end-group influence, initial molar mass, and its distribution, crystallinity before and after-melt processing appear to be documented, at least qualitatively.
The chemiluminescence and thermogravimetry methods were used for the quantitative estimation of the oxidizability of PCL in the presence of hollow glass microspheres. While the potential of thermogravimetry to study polymer degradation has been known for a relatively long time, the potential relation of chemiluminescence from polymers to their oxidizability may be found in the literature from 1961. This was when Ashby [2] announced that polymers heated in air emit the light typical for the quality of a polymer and the presence of stabilizers. He thought that it might be used as a new tool for testing the stability of polymers, and he studied the role of oxygen concentration and the effect of antioxidants. A few years later, Schard and Russell [3] complemented this paper with proposals on the origin of the emitted light and used the term chemiluminescence instead of oxyluminescence. Since then, numerous series of articles have appeared from the groups of N. Billingham, G. George, L. Matisova-Rychla, etc. [4,5,6]. Also, Kometani et al. clearly showed that the degradation of polymers is in progress during the extrusion too. The main degradation factors are the presence of oxygen and temperature [7]. The thermal degradation kinetics of PCL under different conditions revealed different degradation mechanisms [8]. This process can be significantly changed by the addition of fillers, e.g., hollow glass microspheres [9]. This paper is a continuation of our previous study, in which we prepared polymer composites of PCL with hollow glass beads for application in 3D printing [10]. In this study, we determined the thermal properties and oxidative stability of prepared composite filaments, parameters essential from the point of view of materials used for 3D printing.
2. Experimental
2.1. Materials
The poly(ɛ-caprolactone) (CAPA 6800, PCL), with Mw = 80,000 g mol−1, melting point = 60 °C and melt flow index = 2.4 g/10 min (2.16 kg, 160 °C), was obtained from Solvay (UK). As a filler, hollow glass beads 3M K15 had an average size of 60 μm and density of 0.15 g·cm−3. The chemical composition was as follows: SiO2—min. 65%, Na2O—min. 14.0%, CaO—min. 8%, MgO—min. 2.5%, Al2O3—min. 0.5—2%, Fe2O3—min. 0.15%, and others—max. 2 %.
Polyethylene (PE) powder, free of stabilizers, was the product of Slovnaft, Bratislava.
2.2. PCL Filament Preparation
Preparation of composite materials was carried out in an Xplore Micro Compounder twin screwdriver (Xplore Instruments BV, Sittard, The Netherlands) with a mixing chamber (volume of 15 mL) at 65 °C. The mixture of polymer matrix with filler was loaded at 50 rpm. Subsequently, the rate was increased to 100 rpm for 15 min and the material was drained at 50 rpm as a filament. Pure PCL and PCL/glass beads were prepared in concentrations of 5, 10, 20, 30 and 40 wt%.
The composite was compressed into the shape of a circular plate with a diameter of 20 mm on a Fontijne Holland SRA 100ECO 225 × 320 NA press (Fontijne Holland BV, Vlaardingen, The Netherlands) to test its properties. The form with the sample was placed between two metal plates and then into a press machine heated to 65 °C. In the press machine, the sample was thermostated for 4 min. at a distance of 30 mm. Then, the sample was treated with a force of 100 kN for 2 min at 65 °C. Finally, the press plates were cooled to room temperature.
For chemiluminescence and thermogravimetry testing of the thermo-oxidation stability, the filaments were cut into several-milligram pieces.
2.3. Thermogravimetry
Each thermogravimetric analysis (TGA) was performed in two parallel measurements. The measurement was performed at a temperature range of 25–550 °C on a Mettler Toledo TGA/SDTA 851e (Mettler-Toledo, Greifensee, Switzerland) instrument under an air atmosphere (80 mL/min) and heating rates of 2.5, 5 and 10 °C/min. Indium and aluminum were used as the standards to calibrate the temperature. The mass of the applied samples was ~4 mg. The parallel runs did not differentiate at the temperature axis by more than 1 °C. The temperature scale of the instrument was calibrated using indium, zinc and aluminum.
2.4. Chemiluminescence
Chemiluminescence (CL) analysis was carried out on a luminometer Lumipol 3 (commercial product of the Polymer Institute of Slovak Academy of Sciences, Bratislava, Slovakia). The intensity of emitted light (in counts/s) was recorded under both non-isothermal and isothermal conditions, and divided by the sample’s weight. Under non-isothermal conditions, the heating rate was 1 °C/min. This heating rate enables easier registration of maxima on the chemiluminescence–temperature ramps. The maximum temperature set was 250 °C, at which point the thermal heat emission from the heating oven is still negligible compared to the chemiluminescence intensity from the sample degradation. For some samples at this ramp temperature, the measurement continued isothermally. That was particularly important when no maximum under non-isothermal conditions was achieved. The instrument’s dark count rate was 2 to 3 counts/s.
The cuts of samples of the initial weight of several milligrams were placed in an aluminum pan with a diameter of 9 mm and put into the oven of the CL apparatus; the oxygen or air flow above the sample was 50 mL/min.
3. Results and Discussion
3.1. Chemiluminescence and Thermogravimetry Characterization of Hollow Glass Microspheres
If we follow the mass changes in the hollow spherical micro-spheres, we may notice a loss of at least 25% of the original mass during the first heating cycle from room temperature to 550 °C in air (Figure 1). This loss was attributed to antioxidant moieties bound either physically or chemically to spherical microspheres. Generally, it is known that the glass beads have a surface treatment comprising silanes. This treatment is usually used to improve adhesion to the polymer matrix [11]. We assume that the main degradation of the glass beads was caused by the presence of humidity and silanes. On the other hand, chemiluminescence in oxygen continuously increases until the ramp temperature of 250 °C has been reached. Shortly after reaching the maximum in continuing isothermal measurement (Figure 2) at the temperature of 250 °C, the light intensity from hollow glass beads attains the maximum.
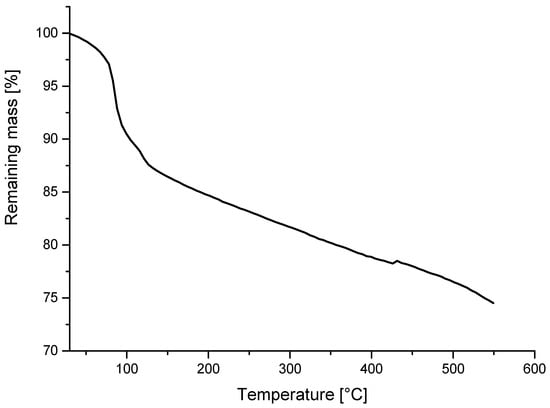
Figure 1.
Mass loss from hollow glass beads in non-isothermal TGA run in air. The rate of heating was 10 °C/min.
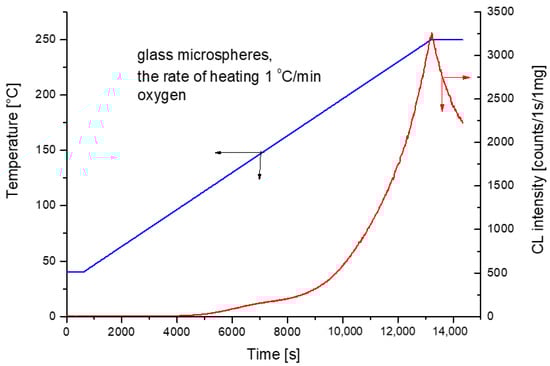
Figure 2.
Non-isothermal ramp CL measurements of spherical hollow microspheres under oxygen atmosphere with the rate of heating 1 °C/min.
The prevailing portion of the mass loss may be ascribed to water sorbed by the hollow glass beads (Figure 1). On the other hand, the chemiluminescence measurement reveals that the beads themselves are oxidized with a maximum light release rate after some duration of isothermal measurement at 250 °C when the ramp temperature (1 °C/min) has been achieved (Figure 2).
3.2. Oxidative Degradation of PCL in the Presence of Hollow Glass Beads
3.2.1. Chemiluminescence
Chemiluminescence–temperature measurements for PCL with hollow glass beads within 40 to 250 °C are shown in Figure 3. A maximum chemiluminescence of around 230 °C is observed only for the pure PCL sample and for the sample with 5 wt.% filler. The maximum shifts to higher temperatures outside the measured range from 40 to 250 °C for higher filler concentrations are impossible for us to reach. However, for higher filler concentrations, it is possible to trace the maxima when continuing at 250 °C isothermally (Figure 3, parts A and B). The reduction in the maximum intensity and shift to higher periods of measurement is effectively in accordance with the inhibition effect of hollow glass beads on PCL thermo-oxidation. On the other hand, the increase in the CL intensity with high filler loads better corresponds with the filler’s pro-degradation effect.
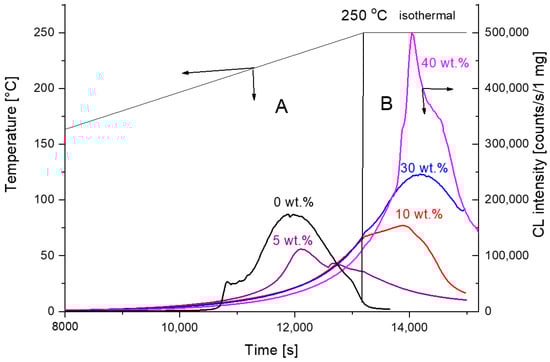
Figure 3.
Chemiluminescence intensity—time/temperature runs for PCL filled with hollow glass beads. The rate of heating 1 °C /min. Part A represents non-isothermal and part B isothermal regime of PCL oxidation at 250 °C.
An interesting part of the graphs of Figure 3 may be observed when enlarging the very beginning of the experiments. The well-developed maxima of chemiluminescence intensity can be found, as seen in Figure 4. The temperature of this maximum is shifted to higher values with an increasing percentage of filler in PCL (numbers in brackets in wt.%), namely 74 (0) > 82 (5) > 94 (10) > 97 (20) > 103 (30) > 108 (40) °C. We ascribe these maxima to the low-temperature oxidation of PCL, which becomes easier when polymer crystallites have already been melted. The addition of filler obviously changes the crystallization behavior and also the mechanical properties of the polymer matrix [12].
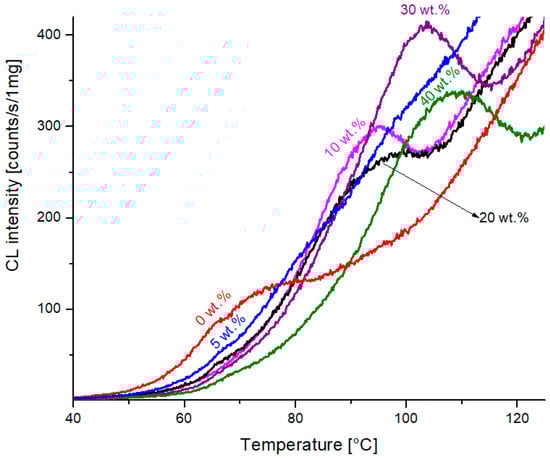
Figure 4.
The enlarged initial parts of chemiluminescence–temperature measurements from Figure 3.
Schematically, poly(ε-caprolactone) is a copolymer of ethylene and carbon dioxide in the ratio of 1:1 (Scheme 1). Carbons are most vulnerable to oxygen attack in the ester group’s vicinity, where hydroperoxides, intermediate by-products of oxidation, are expected to be formed. A particular feature of non-isothermal CL from the thermal oxidation of PCL itself is a sharp peak appearing within several degrees around 210 °C (Figure 3); in systems with a filler, this disappears. Zlatkevich and Burlett observed a similar effect [13]. As we know from TGA measurements, the original PCL undergoes a transformation.
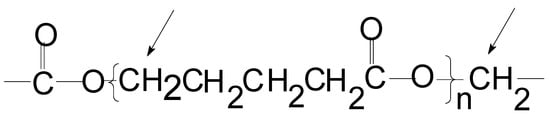
Scheme 1.
Poly(ɛ-caprolactone) or polyethylene-co-carbon dioxide.
In Figure 5, we compare the chemiluminescence measurements of poly(ε-caprolactone) and polyethylene. In the beginning, the intensity is higher for PCL and steadily increases with temperature. This is probably because of the early melting of PCL crystallites (60 °C). The increase in PE is interrupted by melting, which occurs around 125 °C. After a further increase in the temperature, the gradient of the CL intensity increases. At 170 °C CL, the intensity of PE equals that of PCL, and with a further increase in temperature, the CL intensity is higher for PE. Above 210 °C, both lines become similar, which made us speculate that polyethylene sequences in PCL become larger by the splitting out of carbon dioxide.
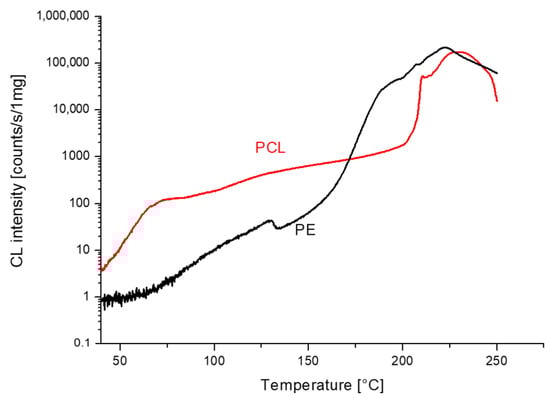
Figure 5.
Comparison of non-isothermal chemiluminescence measurements in oxygen for PCL and PE at the rate of heating 1 °C/min.
3.2.2. Thermogravimetry
The mass changes with an increased temperature for PCL and PCL containing 5 wt.% of hollow glass beads in air at the heating rates of 2.5, 5 and 10 °C/min may be seen in Figure 6.
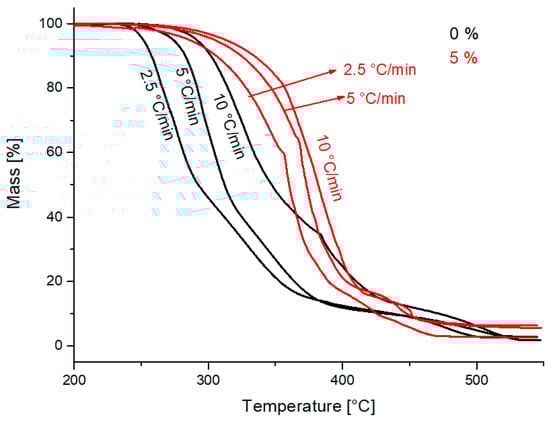
Figure 6.
Non-isothermal TG lines for PCL and PCL with 5 wt.% of hollow glass beads at the rate of heating 2.5, 5 and 10 °C/min.
The concentration of hollow glass beads of 5 wt.% shifts the maximum mass loss temperature to higher values, compared to the sample without an additive. For example, the temperature corresponding to the mass loss of 50% for the sample without an additive and with 5 wt.% and the rate of heating of 10 °C/min was at 309 °C and 345 °C, respectively. In contrast, that for the concentration of 10 wt.% was at 323 °C. Compared with the control sample without an additive, the sample with 5 wt.% showed a higher maximum mass loss temperature than the sample with a 10 wt.% concentration. The decrease in maximum mass loss temperature suggests a pro-degradation effect. It appears that the lower loads of the filler act as a PCL stabilizer, while at higher loads, there predominates the pro-degradation effect [14,15,16,17]. This may also be seen for temperatures corresponding to the remaining masses of 85 and 70% in Table 1.

Table 1.
Temperatures for 85, 70 and 50% of residual mass for samples of PCL with hollow glass beads (0, 5, 10, 20, 30 and 40 wt.%), the rate of heating 2.5, 5 and 10 °C/min, in air.
When presenting the non-isothermal thermogravimetry experiments with different heating rates, it is often usual to plot the logarithm of the heating rate vs. the reciprocal of absolute temperature when straight lines may be obtained, characterized by a certain activation energy. In our experience, it appears to be justified when a uniform mechanism of the formation of volatiles from the degrading sample is operative. This may be demonstrated for temperatures corresponding to 85% of the remaining mass (Figure 7). The activation energy from such a plot is, however, rather low (72 kJ/mol for line 1).
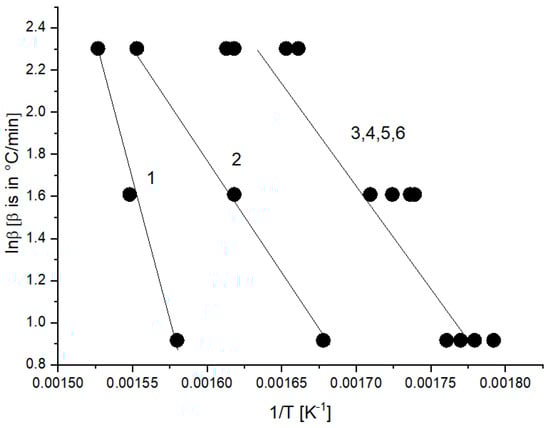
Figure 7.
Plot of logarithm of heating rate vs. reciprocal of absolute temperature at 85% of the remaining mass at the rate of heating 2.5, 5 and 10 °C/min of PCL samples with hollow glass beads (samples 1–6 correspond to PCL with 0, 5, 10, 20, 30 and 40 wt.% of hollow glass beads—Table 1).
In this paper, we have therefore analyzed non-isothermal thermogravimetry measurements using the scheme that we used in several of our previously published papers [18]. We imagine that the polymer P is decomposed into volatiles V and products S remaining in the reaction pan, according to Scheme 2.
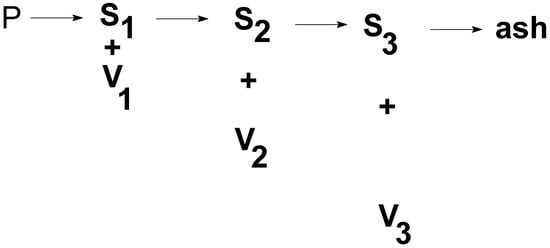
Scheme 2.
The decomposition of polymer (P) to respective fractions of volatile products (V) ending in a relatively stable carbon residue.
Scheme 2 can be replaced by Scheme 3 if the respective steps of Scheme 2 are effectively separated. By choosing the right temperature program, the simpler Scheme 3 can be used for the deconvolution of experimental data from the point of formed volatiles. We assumed that the decomposition of the polymer occurs in three independent steps. The subscript numbers (1, 2 and 3) in Scheme 2 and Scheme 3 correspond to these three temperature-dependent steps.
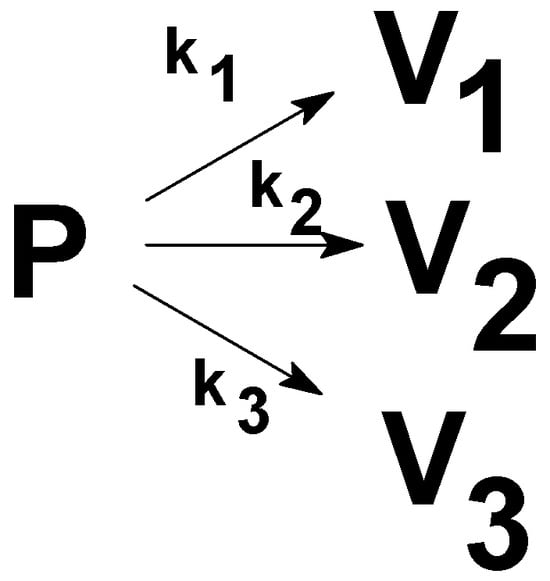
Scheme 3.
The working scheme for non-isothermal thermogravimetry runs.
The complex non-isothermal thermogravimetry curve may then be described as being composed of three temperature-dependent processes. Assuming the first-order kinetics for each process, the change in mass (m) with temperature (T) can be described as:
In a non-isothermal mode,
where m is an actual mass, T is a temperature (K), R is a universal gas constant, A is a pre-exponential factor, E is an activation energy and is a linear heating rate.
From Equation (2), we also see why Arrhenius coordinates may be used for the heating-rate dependence on temperature. For a given conversion, i.e., constant mass, the rate of mass should also be constant. For TGA measurements, when one line is composed of several subsequent processes, this is usually not valid.
After the integration of Equation (2), we obtain:
For the process composed of three temperature–dependent components (j = 3)—“waves”, we obtain a final equation:
where αi is the contribution of the respective process composing the initial mass m0 and (α1 + α2 + α3) = 1.
Provided that mass changes are expressed as a percentage of the original mass, m0, parameters αi, Ai and Ei may be found by a nonlinear regression analysis (Levenberg–Marquardt algorithm) applied to curves of the experimental mass m vs. temperature T, from the initial temperature T0 to a final temperature T of the experiment. The rate constant, ki, corresponding to a given temperature is expressed as .
The respective parameters belonging to the first, second and third waves are shown in Table 2. The agreement with the theoretical fitting model constructed from the parameters of Table 2 may be seen as points on the experimental lines of mass vs. temperature (Figure 8). This is according to Equation (4) for the sample containing 0 (lines denoted as 1), 5 (lines denoted as 2) and 10 wt.% (lines denoted as 3) filler and the rate of heating of 2.5 °C/min. In Figure 8, we also see the corresponding component processes 1a, 1b, 1c, 2a, 2b, 2c, 3a, 3b and 3c, composing the resulting theoretical fit. We see there that line 1a represents the mass loss from the decomposition of PCL itself, line 1b is the decomposition of the PCL transformation products of PCL and line 1c represents their interaction with hollow glass beads. The rate constants for 250 °C corresponding to line 1 change according to the sequence of PCL stability in the presence of glass beads, as seen in Table 2.
Table 2.
Set of parameters from deconvolution of non-isothermal thermogravimetry runs (Equation (1)) for samples of PCL with and without hollow glass beads, with the rate of heating 2.5, 5, and 10 °C/min.
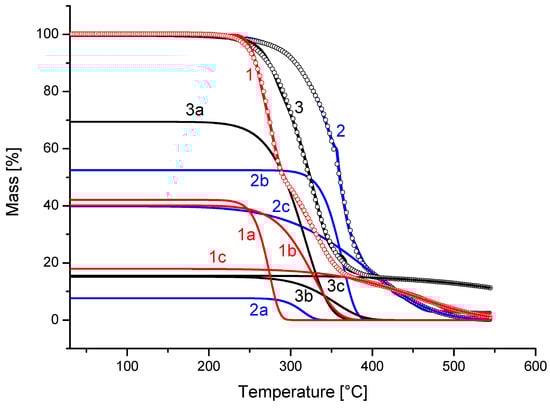
Figure 8.
Deconvolution of non-isothermal thermogravimetry run for PCL with hollow glass microspheres under the heating rate 2.5 °C/min. PCL—lines 1, 1a, 1b and 1c; PCL with 5 wt.%—lines 2, 2a, 2b and 2c; PCL with 10 wt.%—lines 3, 3a, 3b and 3c.
In the past 50 years, numerous papers on different systems’ kinetics have appeared describing an observation of compensation between activation energy and the logarithm of the pre-exponential factor (kinetic compensation effect) [19,20,21]. Figure 9 concerns the data from Table 2 where the values of the so-called isokinetic temperatures, and the corresponding rate constant form the pole around which Arrhenius graphs rotate, thus creating the “compensation”. The straight lines 1, 2 and 3 describe such compensation for respective waves 1, 2 and 3 of samples 1–6. The numerical characterization of these straight lines with isokinetic temperature are given in Table 3. Unfortunately, the practical impact of such compensation has not been known until now.
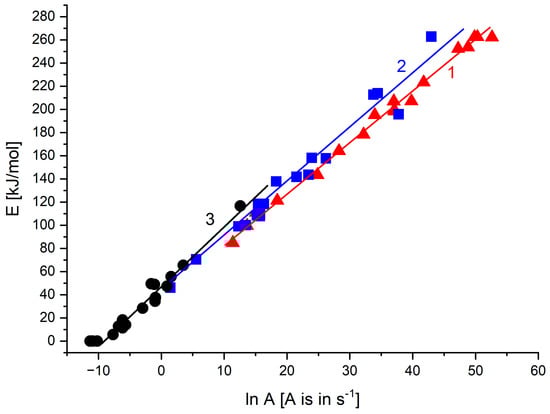
Table 3.
The characterization of compensation graphs from Figure 9 and isokinetic temperatures for the first, the second and the third deconvolution components composing the experimental non-isothermal thermogravimetry runs.
The comparison of non-isothermal chemiluminescence and thermogravimetry records in air and the rate of heating of 10 °C/min is shown in Figure 10. The CL intensity starts to increase approximately at the beginning of the mass loss. The curves are compared on the time axis.
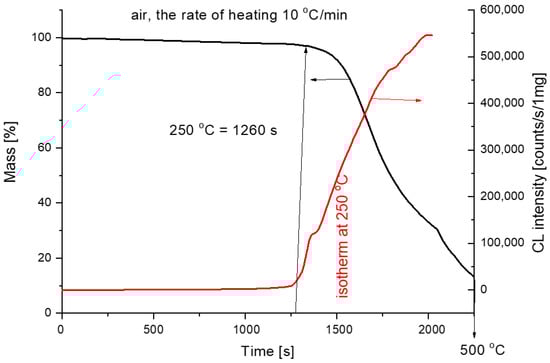
Figure 10.
Comparison of chemiluminescence and thermogravimetry for pure PCL measurements (air, 10 °C/min).
4. Conclusions
The non-isothermal thermogravimetry and chemiluminescence experiments of poly(ε-caprolactone) with a filler (hollow glass beads) help to differentiate the essential features of hollow glass filler in the polymer.
It was ascertained that the hollow glass microspheres used in our experiments act by a dual mechanism in the oxidation of PCL: (a) stabilizing due to volatiles that could be released from microspheres during heating (at a lower load of microspheres (<10%)), and (b) pro-degrading due to the direct interaction between the glass and polymer.
Non-isothermal chemiluminescence indicated that in the hollow microspheres, the oxidation of bound structures themselves acting as antioxidants occurs. Isothermal measurements at the temperature of 250 °C exhibited the maximum oxidation rate for all samples. The combination of both thermogravimetry and chemiluminescence, where the first records the mass loss due to the splitting of volatiles, while the latter describes the peroxidation of the polymer in the first steps of oxidation, which is followed eventually by the mass loss, has not been used in practice until now.
The experimental non-isothermal thermogravimetric curves were reconstructed to be composed of three independent processes with the first kinetic order, enabling determination of the rate constant of the decomposition of PCL alone at 250 °C and, if necessary, other temperatures. Thermogravimetry measurements on PCL with loads of 5 and 10 wt.% of hollow glass microspheres confirm the stabilizing effect, while higher loads produce a pro-degrading pronounced impact. On non-isothermal chemiluminescence temperature ramp experiments, the pro-degrading effect may be clearly seen when continuing isothermally at 250 °C.
The kinetic compensation effect was observed for kinetic parameters E and lnA, indicating that Arrhenius’ graphs rotate around the pole determined by the isokinetic temperature and corresponding rate constant.
Author Contributions
Writing—original draft preparation, methodology and investigation, A.V.; writing—original draft preparation and investigation, J.R.; writing—review and editing, M.K.; writing—review and editing, funding acquisition, Z.Š. All authors have read and agreed to the published version of the manuscript.
Funding
The authors are grateful for the financial support of Grant VEGA 2/0051/20 and 2/0161/20 from The Ministry of Education, Science, Research and Sport of the Slovak Republic.
Data Availability Statement
Data are contained within the article.
Conflicts of Interest
The authors declare no conflict of interest.
References
- Sánchez-Soto, M.; Gordillo, A.; Maspoch, M.L.L.; Velasco, J.I.; Santana, O.O.; Martí, A.B. Glass bead filled polystyrene composites: Morphology and fracture. Polym. Bull. 2002, 47, 587–594. [Google Scholar] [CrossRef]
- Ashby, G.E. Oxyluminescence from polypropylene. J. Polym. Sci. 1961, 50, 99–106. [Google Scholar] [CrossRef]
- Schard, M.P.; Russell, C.A. Oxyluminescence of polymers. II. Effect of temperature and antioxidants. J. Appl. Polym. Sci. 1964, 8, 997–1006. [Google Scholar] [CrossRef]
- Matisová-Rychlá, L.; Rychlý, J.; George, G.A. Chemiluminescence from thermal oxidation of poly (2,6-dimethyl-1,4-phenylene oxide). Polym. Degrad. Stab. 2002, 75, 385–396. [Google Scholar] [CrossRef]
- Billingham, N.C.; Then, E.T.H.; Gijsman, P.J. Chemiluminescence from peroxides in polypropylene. Part I: Relation of luminescence to peroxide content. Polym. Degrad. Stab. 1991, 34, 263–277. [Google Scholar] [CrossRef]
- George, G.A.; Egglestone, G.T.; Riddell, S.Z. Chemiluminescence studies of the degradation and stabilization of polymers. Polym. Eng. Sci. 1983, 23, 412–418. [Google Scholar] [CrossRef]
- Kometani, H.; Matsumura, T.; Suga, T.; Kanai, T. Quantitative analysis for polymer degradation in the extrusion process. Int. Polym. Process. 2006, 21, 24–31. [Google Scholar] [CrossRef]
- Sivalingam, G.; Madras, G. Thermal degradation of poly (ε-caprolactone). Polym. Degrad. Stab. 2003, 80, 11–16. [Google Scholar] [CrossRef]
- Vignali, A.; Iannace, S.; Falcone, G.; Utzeri, R.; Stagnaro, P.; Bertini, F. Lightweight poly(ε-caprolactone) composites with surface modified hollow glass microspheres for use in rotational molding: Thermal, Rheological and Mechanical Properties. Polymers 2019, 11, 624. [Google Scholar] [CrossRef]
- Kovácová, M.; Vykydalová, A.; Spitálsky, Z. Polycaprolactone with glass beads for 3D printing filaments. Processes 2023, 11, 395. [Google Scholar] [CrossRef]
- Moghadam, S.G.; Pazokifard, S.; Mirabedini, S. Silane treatment of drop-on glass-beads and their performance in two-component traffic paints. Prog. Org. Coat. 2021, 156, 106235. [Google Scholar] [CrossRef]
- Liu, X.; Wang, T.; Chow, L.C.; Yang, M.; Mitchell, J.W. Effects of inorganic fillers on the thermal and mechanical properties of poly(lactic acid), Hindawi Publishing Corporation. Int. J. Polym. Sci. 2014, 2014, 827028. [Google Scholar] [CrossRef]
- Zlatkevich, L.; Burlett, D.J. Chemiluminescence in studying the thermal oxidation of rubber compounds. Polym. Degrad. Stab. 1999, 65, 53–58. [Google Scholar] [CrossRef]
- Tarrío-Saavedra, J.; López-Beceiro, J.; Naya, S.; Artiaga, R. Effect of silica content on thermal stability of fumed silica/epoxy composites. Polym. Degrad. Stab. 2008, 93, 2133–2137. [Google Scholar] [CrossRef]
- Nikkhah, S.J.; Ramazani, S.A.; Baniasadi, H.; Tavakolzadeh, F. Investigation of properties of polyethylene/clay nanocomposites prepared by new in situ Ziegler–Natta catalyst. Mater. Des. 2009, 30, 2309–2315. [Google Scholar] [CrossRef]
- Suraci, S.V.; Fabiani, D.; Roland, S.; Colin, X. Multi scale aging assessment of low-voltage cables subjected to radio-chemical aging: Towards an electrical diagnostic technique. Polym. Test. 2021, 103, 107352. [Google Scholar] [CrossRef]
- Zuo, J.; Yao, Z.; Zhou, J. Mechanical and thermal properties of phenolic foams reinforced by hollow glass beads. Adv. Mater. Res. 2014, 988, 13–22. [Google Scholar] [CrossRef]
- Rychlý, J.; Matisová-Rychlá, L.; Csomorová, K.; Janigová, I.; Schilling, M.; Learner, T. Non˗isothermal thermogravimetry, differential scanning calorimetry and chemiluminescence in degradation of polyethylene, polypropylene, polystyrene and poly(methyl metacrylate). Polym. Degrad. Stab. 2011, 96, 1573–1581. [Google Scholar] [CrossRef]
- Agrawal, R.K. The compensation effect: A fact or a fiction. J. Therm. Anal. 1989, 35, 909–917. [Google Scholar] [CrossRef]
- Agrawal, R.K. The compensation effect. J. Therm. Anal. Calorim. 1988, 34, 1141–1149. [Google Scholar] [CrossRef]
- Liu, L.; Guo, Q.-X. Isokinetic relationship, isoequilibrium relationship, and Enthalpy˗Entropy compensation. Chem. Rev. 2001, 101, 673–696. [Google Scholar] [CrossRef] [PubMed]
Disclaimer/Publisher’s Note: The statements, opinions and data contained in all publications are solely those of the individual author(s) and contributor(s) and not of MDPI and/or the editor(s). MDPI and/or the editor(s) disclaim responsibility for any injury to people or property resulting from any ideas, methods, instructions or products referred to in the content. |
© 2023 by the authors. Licensee MDPI, Basel, Switzerland. This article is an open access article distributed under the terms and conditions of the Creative Commons Attribution (CC BY) license (https://creativecommons.org/licenses/by/4.0/).