Article

Effects of Surface-Wave-Sustained Argon Plasma Torch Interaction with Liquids

1
Faculty of Forest Industry, University of Forestry, 10 Kliment Ohridski Blvd., 1797 Sofia, Bulgaria
2
Clean & Circle Center of Competence, Sofia University, 15 Tzar Osvoboditel Blvd., 1504 Sofia, Bulgaria
3
Faculty of Biology, Sofia University, 8 Dragan Tsankov Blvd., 1164 Sofia, Bulgaria
4
Medical Faculty, Medical University of Sofia, 1 Georgi Sofiiski Boul., 1431 Sofia, Bulgaria
5
Faculty of Physics, Sofia University, 5 James Bourchier Blvd., 1164 Sofia, Bulgaria
6
Faculty of Chemistry, Brno University of Technology, Purkyňova 118, 612 00 Brno, Czech Republic
*
Author to whom correspondence should be addressed.
Processes 2023, 11(12), 3313; https://doi.org/10.3390/pr11123313
Submission received: 30 October 2023 / Revised: 18 November 2023 / Accepted: 24 November 2023 / Published: 28 November 2023
(This article belongs to the Special Issue Atmospheric Pressure Plasma Technologies and Applications)

Abstract

:
In this paper, an investigation of the interaction of a surface-wave-sustained argon plasma torch with liquids is presented. The plasma is produced by an electromagnetic wave traveling along the plasma–dielectric interface, and at the same time, the plasma is a part of this waveguide structure. Because the interaction of the plasma torch with water (liquid) results in modifications of the properties of both the treated water and the plasma itself, a detailed study of the effects in both media is required. The results of the experimental investigation of a surface-wave-sustained argon plasma torch interaction with liquids show significant changes in the plasma parameters, such as the electron excitation temperature Te and the average rotation temperature Trot. In addition, mechanical waves are produced both in the meniscus surface and in the plasma torch by the interaction between the plasma torch (ionized gas with charged particles and electric field) and the liquid surface, which is different from the effects produced by a neutral gas jet on a liquid surface. As a result of the plasma–water interaction, the water’s chemical and physical characteristics, such as the water conductivity, pH, and H2O2 concentration, are modified. As a possible application for water purification, the performed SWD treatment of model wastewater shows a significant variation in nitrate, ammonium, phosphate, and COD (chemical oxygen demand) concentration as a result of the treatment.

1. Introduction

The field of plasma technologies is rapidly growing, together with the invention of new plasma sources and the development of existing ones. The progress of finding new cooperation between plasma physics and other fields of science has reached an advanced stage, and at the same time, plasma devices have been optimized and new ones developed to meet the requirements of plasma parameters for these new applications. Nowadays, gas discharges find their place in interdisciplinary applications in areas such as ecology [1,2], medicine [3,4,5], and agriculture [6,7]. The direct treatment of tissues, biological systems, and fluids without damaging them is of great interest to scientists from all related fields. This comes as a successful outcome of the development of new plasma sources, which have the ability to produce cold plasma at atmospheric pressure (called cold atmospheric plasma, CAP). The development of suitable and reliable low-temperature plasma sources operating at atmospheric pressure allows the plasma to operate in the open space and have a sufficiently low temperature to interact with living organisms and temperature-sensitive materials. Treatment of water for purification [8,9,10] or activation [11,12] (plasma-activated water, PAW), treatment of bacteria for disinfection [13,14,15], and direct wound healing [3,16] are only part of the interdisciplinary applications of CAP now. Detailed studies of plasma’s physical and chemical parameters in various discharge conditions are required. The main mechanisms of plasma interaction with other materials and the influence of plasma on their different characteristics need to be studied in complexity using various diagnostic techniques [17].
Plasma with characteristics fulfilling the above requirements, developed and used in recent years for these applications, is mainly produced in dielectric barrier discharge (DBD) and various plasma torch configurations. A summary of the main features of CAP and their biomedical applications is presented in [2]. In order to achieve a low gas temperature, the post-discharge is usually used for the treatment of biological systems [3,4,5].
Microwave discharges of various types [18,19], operating at atmospheric pressure, usually produce non-equilibrium plasma with a gas temperature of 1000–5000 K (see Figure 1 in [20]). Surface-wave-sustained discharges (SWDs) can operate at atmospheric pressure and can produce stable plasma at a wave frequency of 2.45 GHz, where, in these conditions, they are a type of microwave discharge. This kind of discharge is produced by an electromagnetic wave traveling along the plasma–dielectric interface and has the big advantage of being electrodeless, so there is not any contamination of the plasma from the electrodes. The commonly used wave power ranges from 50 to 100 W to more than 1 kW, and the gas temperature in these discharge conditions is about 1000–4000 K [21,22,23]. However, in many cases, the treatment should be carried out without thermal damage while providing a highly active particle concentration and UV radiation to have, for example, an efficient bactericidal effect.
In order to avoid thermal damage, the widely used plasma jet systems apply the afterglow region for the treatment of thermosensitive materials. In contrast, in the surface-wave-sustained plasma torch, the treatment can also be carried out in the active discharge zone in suitable discharge conditions that provide a low gas temperature, i.e., producing CAP. Using the active discharge region for treatment results in high concentrations of short-lived active particles, together with electromagnetic field and UV radiation at the plasma–liquid interface. This is not the case in the afterglow region, where only long-lived particles are present. The synergetic effect of all these particular processes leads to a significantly shorter treatment time and decreases operational costs.
The SWDs are specific plasma sources for which the plasma properties depend not only on the applied electrical power, operating frequency, and the working gas but also on such conditions like the discharge tube inner radius, tube thickness, and dielectric permittivity. For these discharges, the tube is not just a container for the plasma sustaining. The tube and the plasma are parts of the waveguide structure for electromagnetic wave propagation, and, at the same time, the plasma is produced by the wave; because of this, the plasma properties depend on the discharge tube’s geometric parameters and its dielectric permittivity. When, at the end of the discharge tube, the wave power is sufficient (high enough) for plasma sustaining, the wave continues its propagation along the plasma–air interface, and a plasma torch in the open air is produced. Increasing the wave power leads to an increase in the plasma torch length (the length of plasma out of the discharge tube), which is important in order to use it for the treatment of samples. At the same time, the applied power increases the gas temperature of the plasma torch, which is an unwanted effect. The gas temperature also depends on the working gas and the gas flow rate, and it decreases when the gas flow increases. But there are limits in the gas flow variation—it cannot be too small (or zero, as it is possible at low-pressure SWD), nor too high. The properties of the surface-wave-sustained plasma torch and their dependence on the discharge conditions are studied in detail in [24]. The situation becomes more complicated when the surface-wave-sustained plasma torch interacts with liquids [25].
The interaction of the non-equilibrium plasma produced in the gaseous phase with liquids is important for understanding the background of the processes in many plasma technologies, such as environmental, bio-medical, and surface treatment applications. Usually, it is assumed that the plasma with given parameters reacts with the liquid at the plasma–liquid interface, producing a wide variety of chemically active particles resulting in changes in the liquid reactivity [26]. When the plasma torch is produced by an electromagnetic wave traveling along the plasma–dielectric (air) interface, it has been shown that some plasma characteristics (like the plasma torch length) also change due to the plasma–liquid interaction [27]. For plasma sources based on SWD in contact with liquids, the changes in two directions have to be studied: (i) changes of the plasma characteristics during the interaction with the liquid, and (ii) liquid physical and chemical characteristic modification as a result of the plasma treatment.
The plasma source for investigations presented in this paper is surface-wave-sustained discharge operating at 2.45 GHz produced by a surfatron-type electromagnetic wave launcher in argon at atmospheric pressure (plasma torch). This plasma is strongly non-equilibrium: the electron energy distribution function (EEDF) is non-Maxwellian, and the temperature of the heavy particles (so-called gas temperature Tg) is much lower than the electron temperature Te defined as 2/3rd of the mean electron energy obtained by the actual EEDF): Tg << Te. Usually, for these plasmas Te~1–2 eV, while Tg~1000–4000 K. In our case, we have produced an argon plasma torch with Tg < 1000 K and, in some conditions, even close to the room temperature. Treatment of water for purification, disinfection, or activation is only a part of the interdisciplinary applications of CAP nowadays. Using the surface-wave-sustained discharge (SWD) for this purpose requires a detailed study of the effects, both inside the plasma and in the treated liquid, caused by the plasma–liquid interaction.
In this paper, we present the experimental results of surface-wave-sustained argon plasma torch interaction with distilled and model wastewater. The modifications of both plasma and water characteristics as a result of the plasma–liquid interaction are obtained and presented under various discharge conditions, including different discharge tube diameters, input powers, and gas flows.

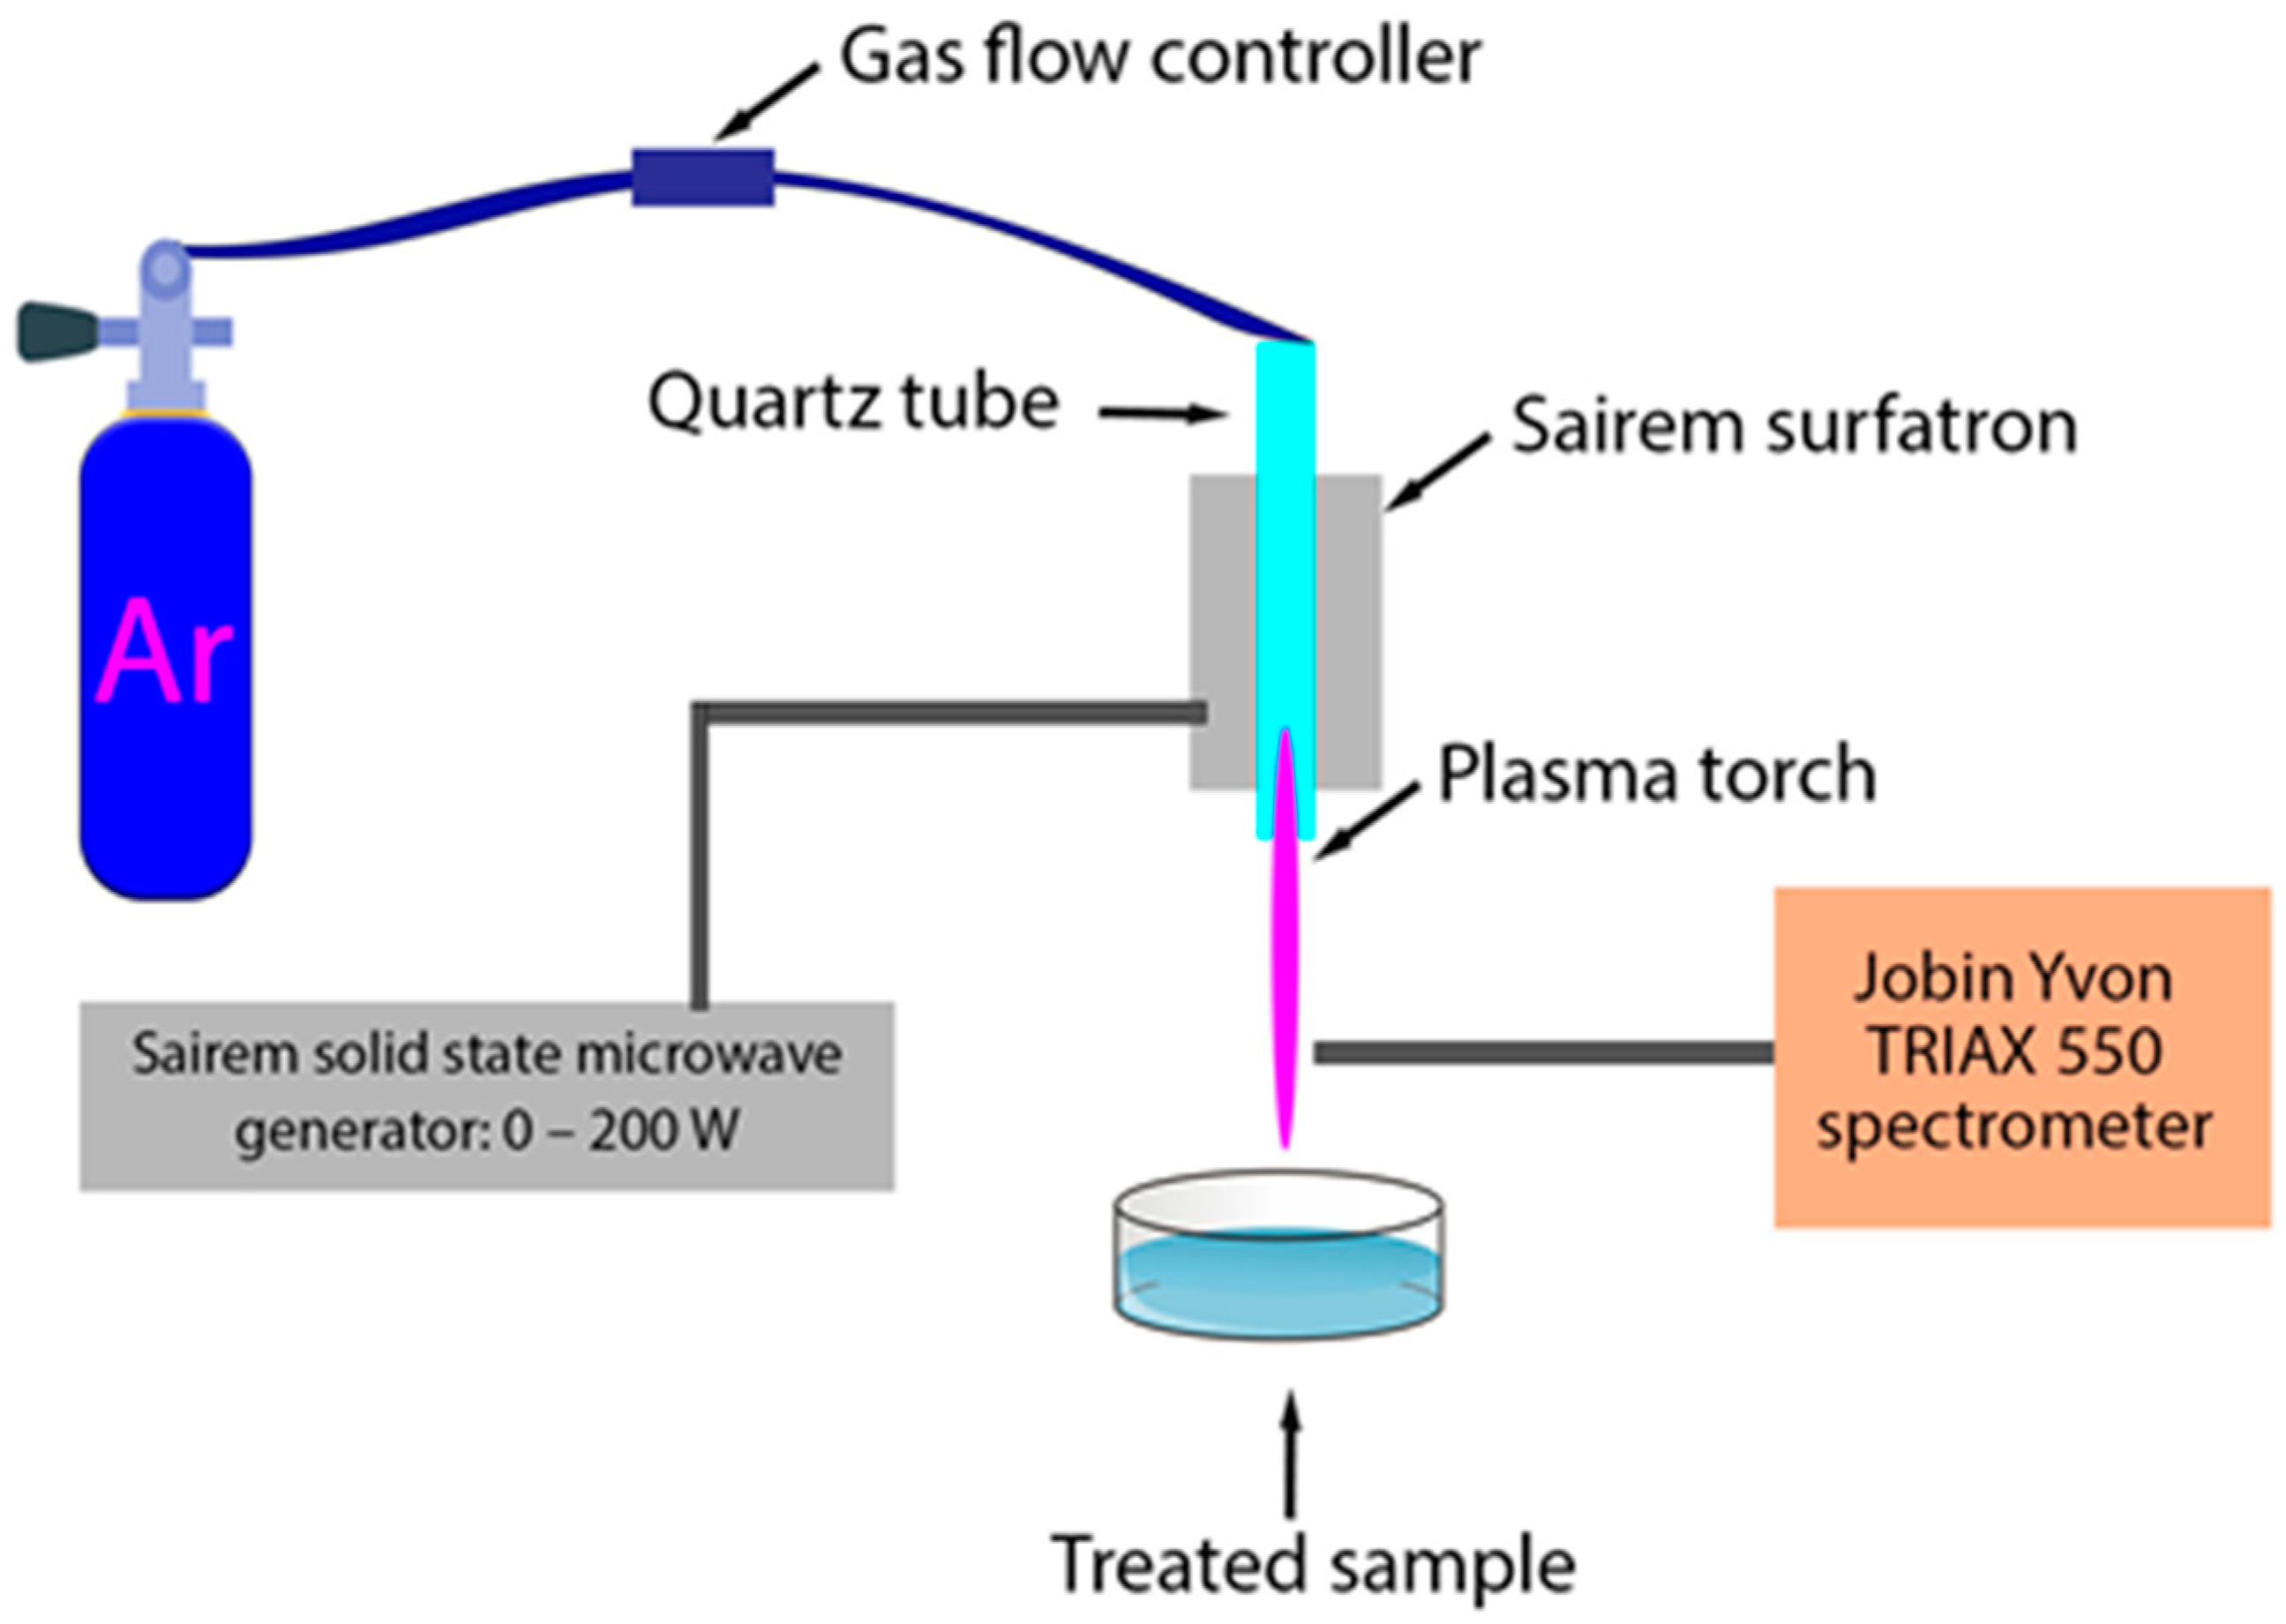
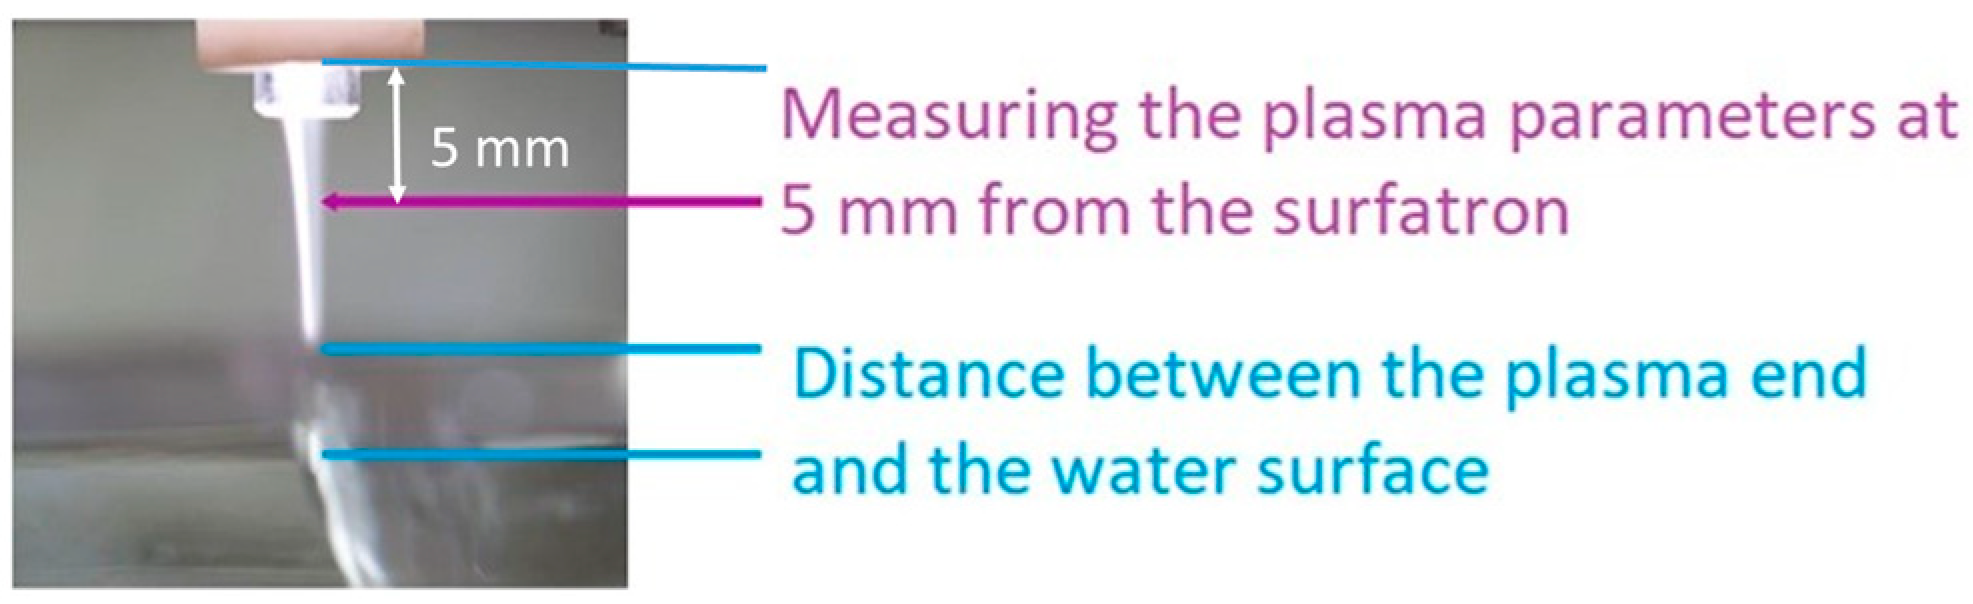
2. Materials and Methods

The experimental setup used is schematically presented in Figure 1. The surface-wave-sustained plasma torch was produced by a surfatron-type electromagnetic wave launcher [28,29,30] connected to a solid-state microwave generator (Sairem, GMS 200 W, SAIREM—FRANCE, 82 rue Elisée Reclus, Décines-Charpieu, France) operating at 2.45 GHz. The input wave power varied from 12 to 20 W, and the reflected power was below 1 W.
The plasma is sustained inside a quartz tube placed in the surfatron coaxially to its axis. One end of the discharge tube is connected to the mass flow controller (Bronkhorst FMA 201 series, Bronkhorst USA LLC, 57 South Commerce Way, Suite 120, Bethlehem, PA, USA), controlling the argon flow. The argon purity was 99.996%, and the flow varied from 0.1 L/min to 5 L/min in the experiments presented. The other end of the discharge tube was 1 mm out of the surfatron end. The electromagnetic wave traveling along the discharge tube’s inner wall produces plasma inside the tube. It continues its propagation after the end of the tube along the plasma-air interface, sustaining the plasma torch in the open space. In this way, the whole plasma torch is an active plasma-sustaining region with energy transfer from the wave to the plasma but not an afterglow.
Several quartz discharge tubes with relative dielectric permittivity of εd = 3.8 were used. Their dimensions are, respectively, thin wall tubes with outer radius Rout = 2 mm and inner radius Rin = 1 mm, 2 mm, and 3 mm, and thick wall tube with Rout = 3.5 mm and Rin = 1 mm.
For the liquid’s treatment, the plasma source is in a vertical position with the plasma torch going down (Figure 2).
Optical emission spectrometry was used for the determination of rotational and electron excitation temperatures. The light emitted by the discharge was focused by a quartz lens (diameter of 25 mm, focal length of 35 mm) to the entrance of a multimode optical cable connected to the spectrometer. Infinity-to-point imaging was applied in the present case to avoid potential radial fluctuations of the plasma torch. The black rectangular non-reflecting light guide (25 × 0.6 mm2) was installed at the optical axis horizontally in front of the lens to keep the best axial resolution. Its entrance was 2 mm from the discharge; the exit was fixed just at the lens. The whole optical setup was mounted on an xyz movable holder completely covered by black paper (160 g/m2) to avoid any possible reflections of light emitted by the active discharge.
Visual observations of the plasma torch in dependence on the configuration were carried out using the Nikon D7500 camera (Tokyo, Japan) with the AF-S Micro NIKKOR 85 mm 1:3.5 G ED macro-objective. The camera was not calibrated with respect to its spectral response.
The Jobin Yvon TRIAX 550 spectrometer (Edison, NJ, USA) with an LN2-cooled, back-illuminated CCD (1025 × 256, pixel size of 26 × 26 µm2) was used for the spectra acquisition. The whole spectra acquisition system was calibrated with respect to its spectral response using the standard Ocean Optics DT-MINI-2-GS (Ocean Insight, Orlando, FL—Headquarters, 3500 Quadrangle Blvd., Orlando, FL USA) source, and measured spectra were corrected with respect to the system spectral response. The OH (A→X) 0-0 band (using 3600 gr/mm holographic grating blazed for 150–450 nm range) and argon atomic lines (using ruled using 1200 gr/mm grating blazed at 550 nm) were determined in spectra. The rotational temperatures were calculated using Boltzmann plot methods from the lowest OH (A→X) lines [31]. The excitation temperature of argon atoms was calculated from integral intensities of argon lines (603.21, 667.73, 675.28, 687.13, and 714.70 nm using constants given at NIST [32]. Details can seen in [33].
The discharge operation was monitored by an ultra-fast camera, Photron FASTCAM SA-X2, perpendicular to the discharge axis. The frame exposure time was 78 μs at 12,500 frames per second, and a full chip image (1024 × 1024) was used. The discharge time evolution was visualized with a high space resolution of 50 microns per pixel.
The hydrogen peroxide concentration in plasma-treated water was determined using the titanium reagent [34].

3. Results

As was shown in [25], the surface-wave-sustained plasma torch operating at 2.45 GHz cannot penetrate inside the water at the low wave power used in our experiments. This is possible at much higher wave power [35], but then the gas temperature of the plasma torch is above 1000 K. The electromagnetic wave attenuates very fast because of the very high relative dielectric permittivity of the water at this wave frequency (εw~80 at 2.45 GHz). Nevertheless, the plasma can interact with the liquid below it so that both the plasma and the treated liquid parameters change during the interaction. This means that two aspects of the plasma–liquid interaction need to be discussed: (i) modification of the plasma characteristic and (ii) modification of the liquid properties.

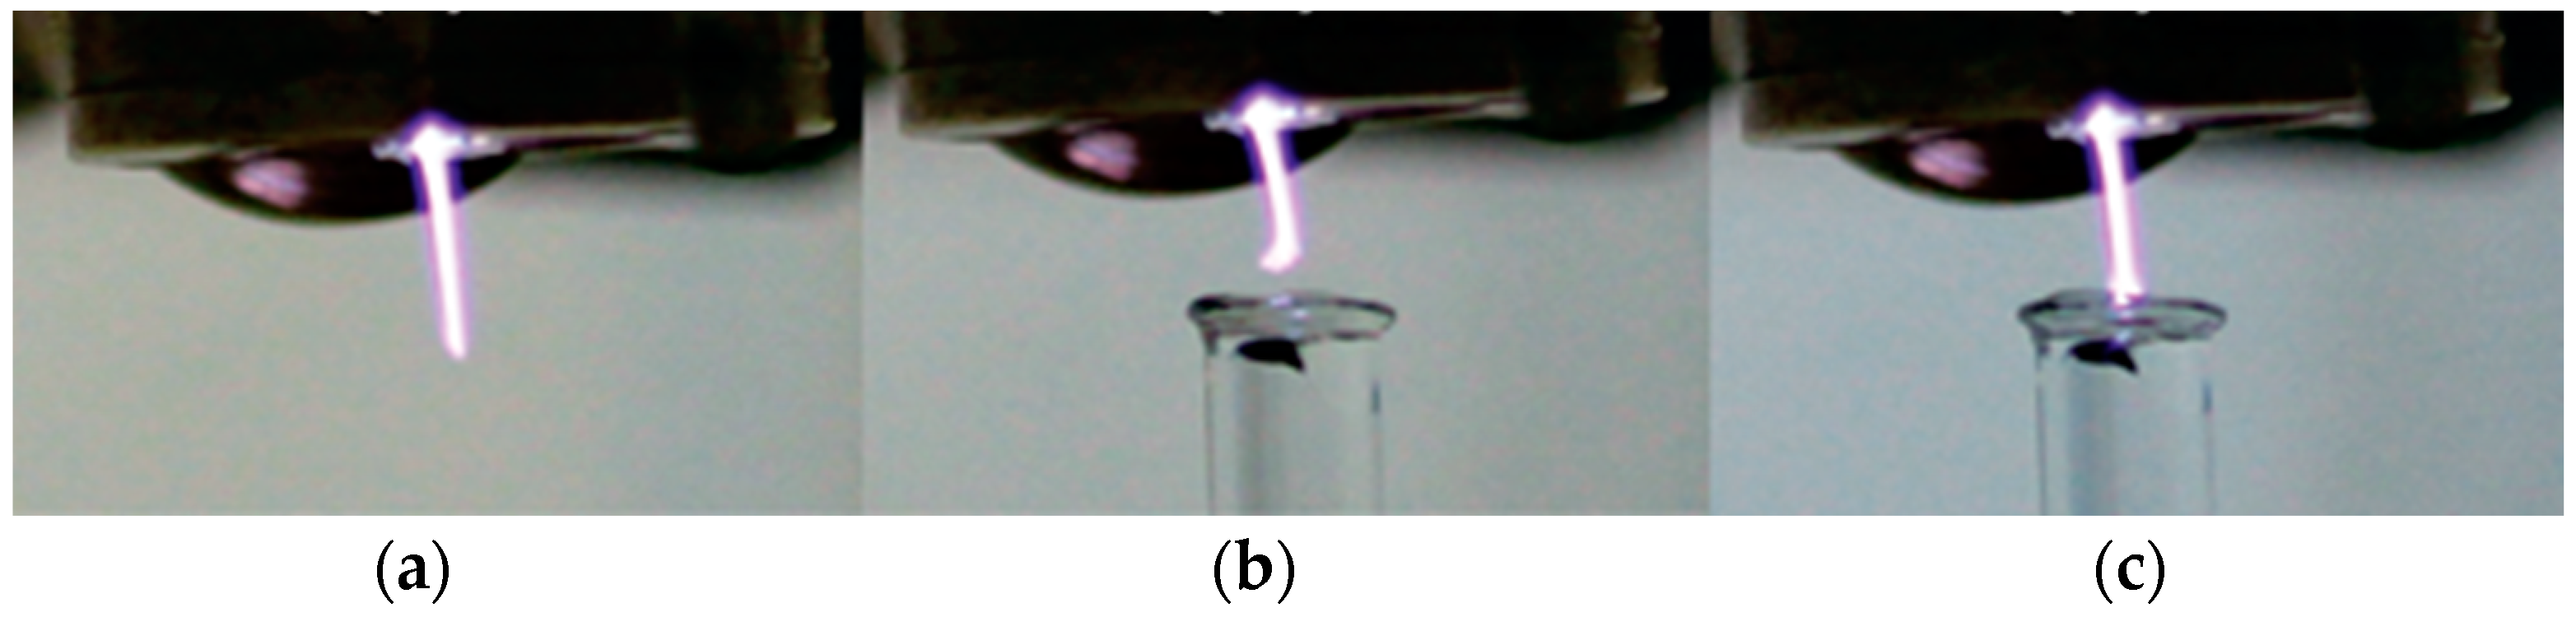
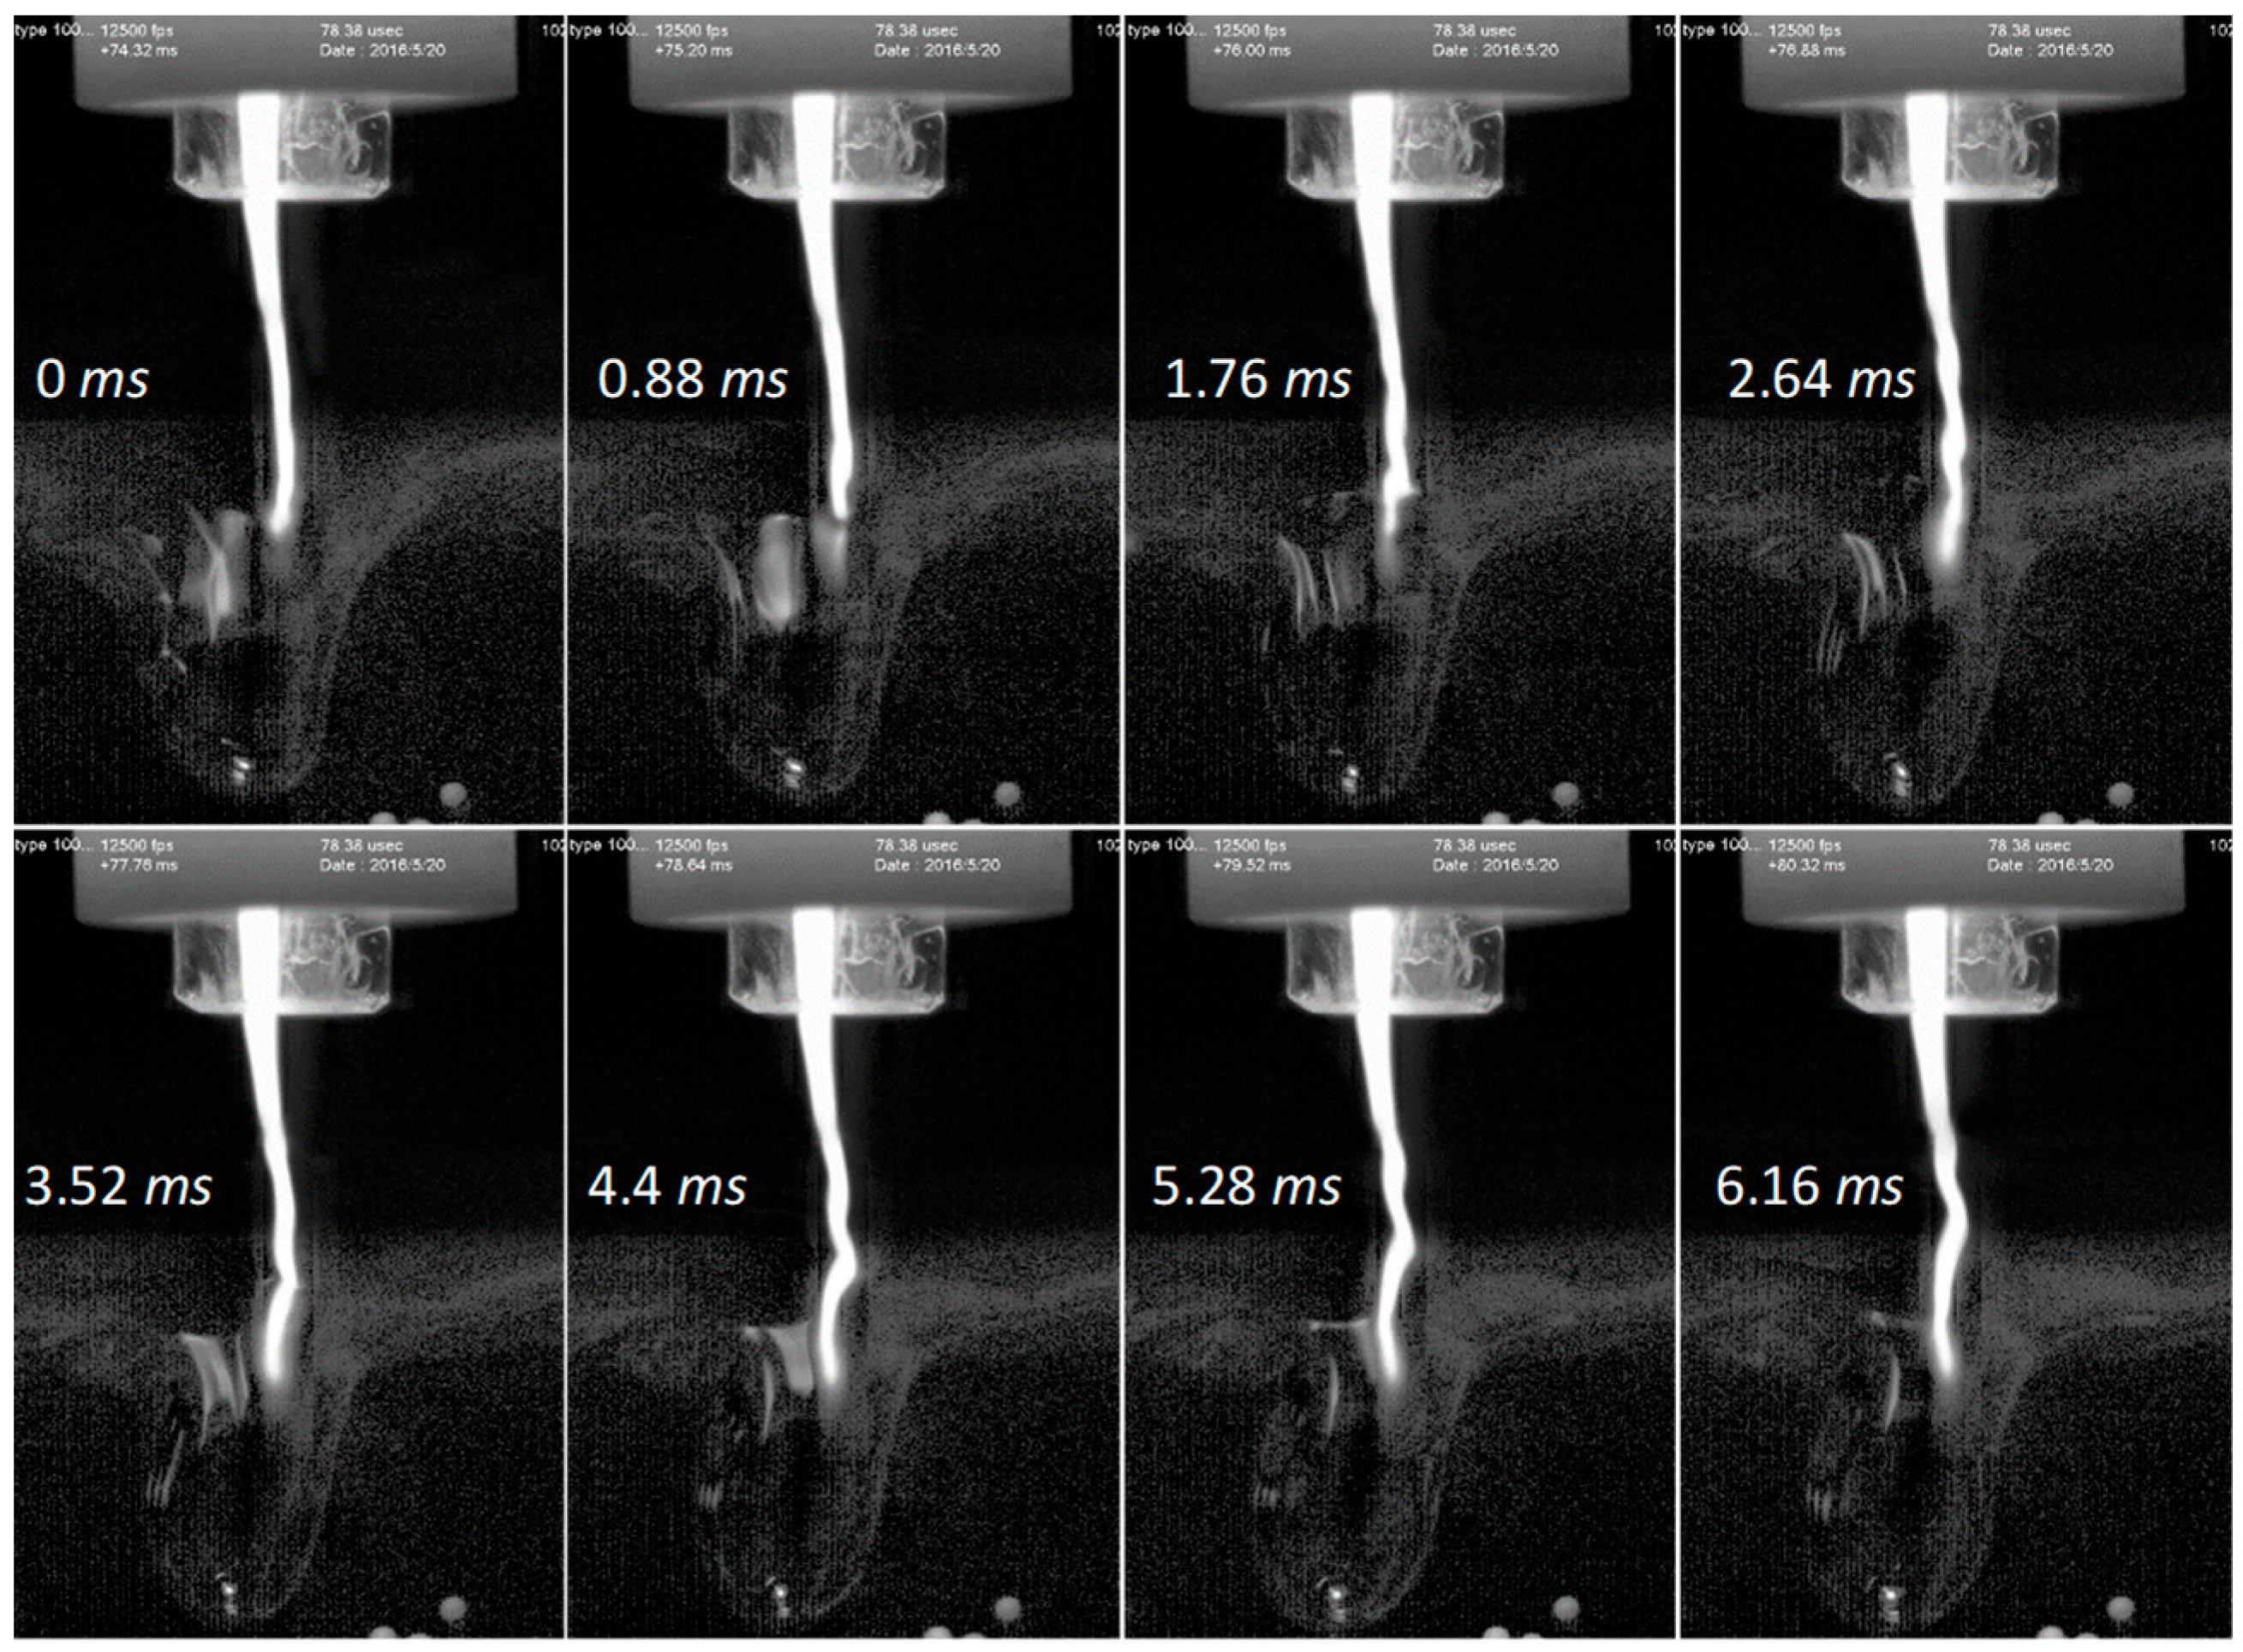
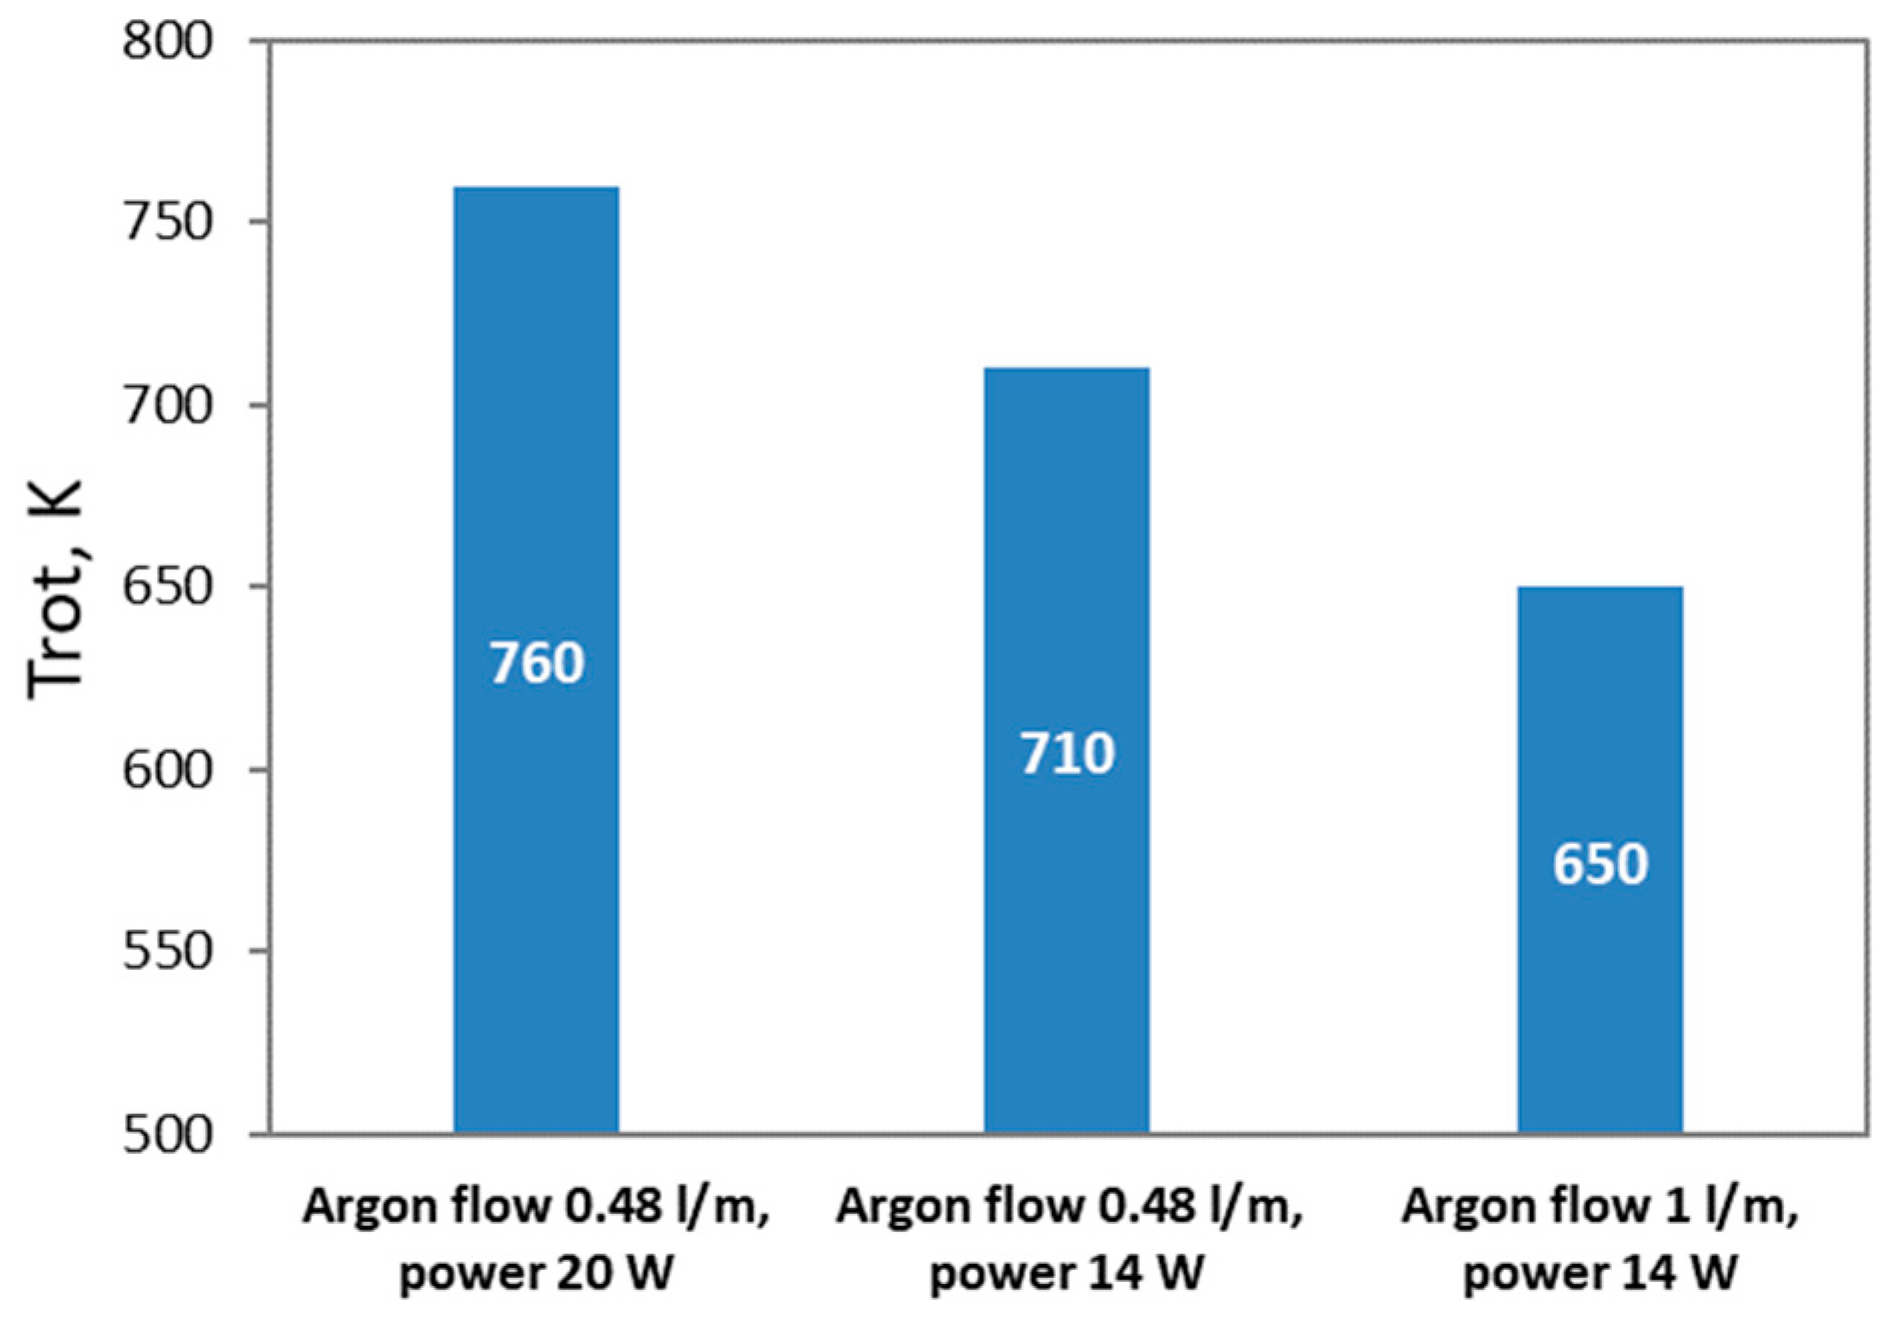
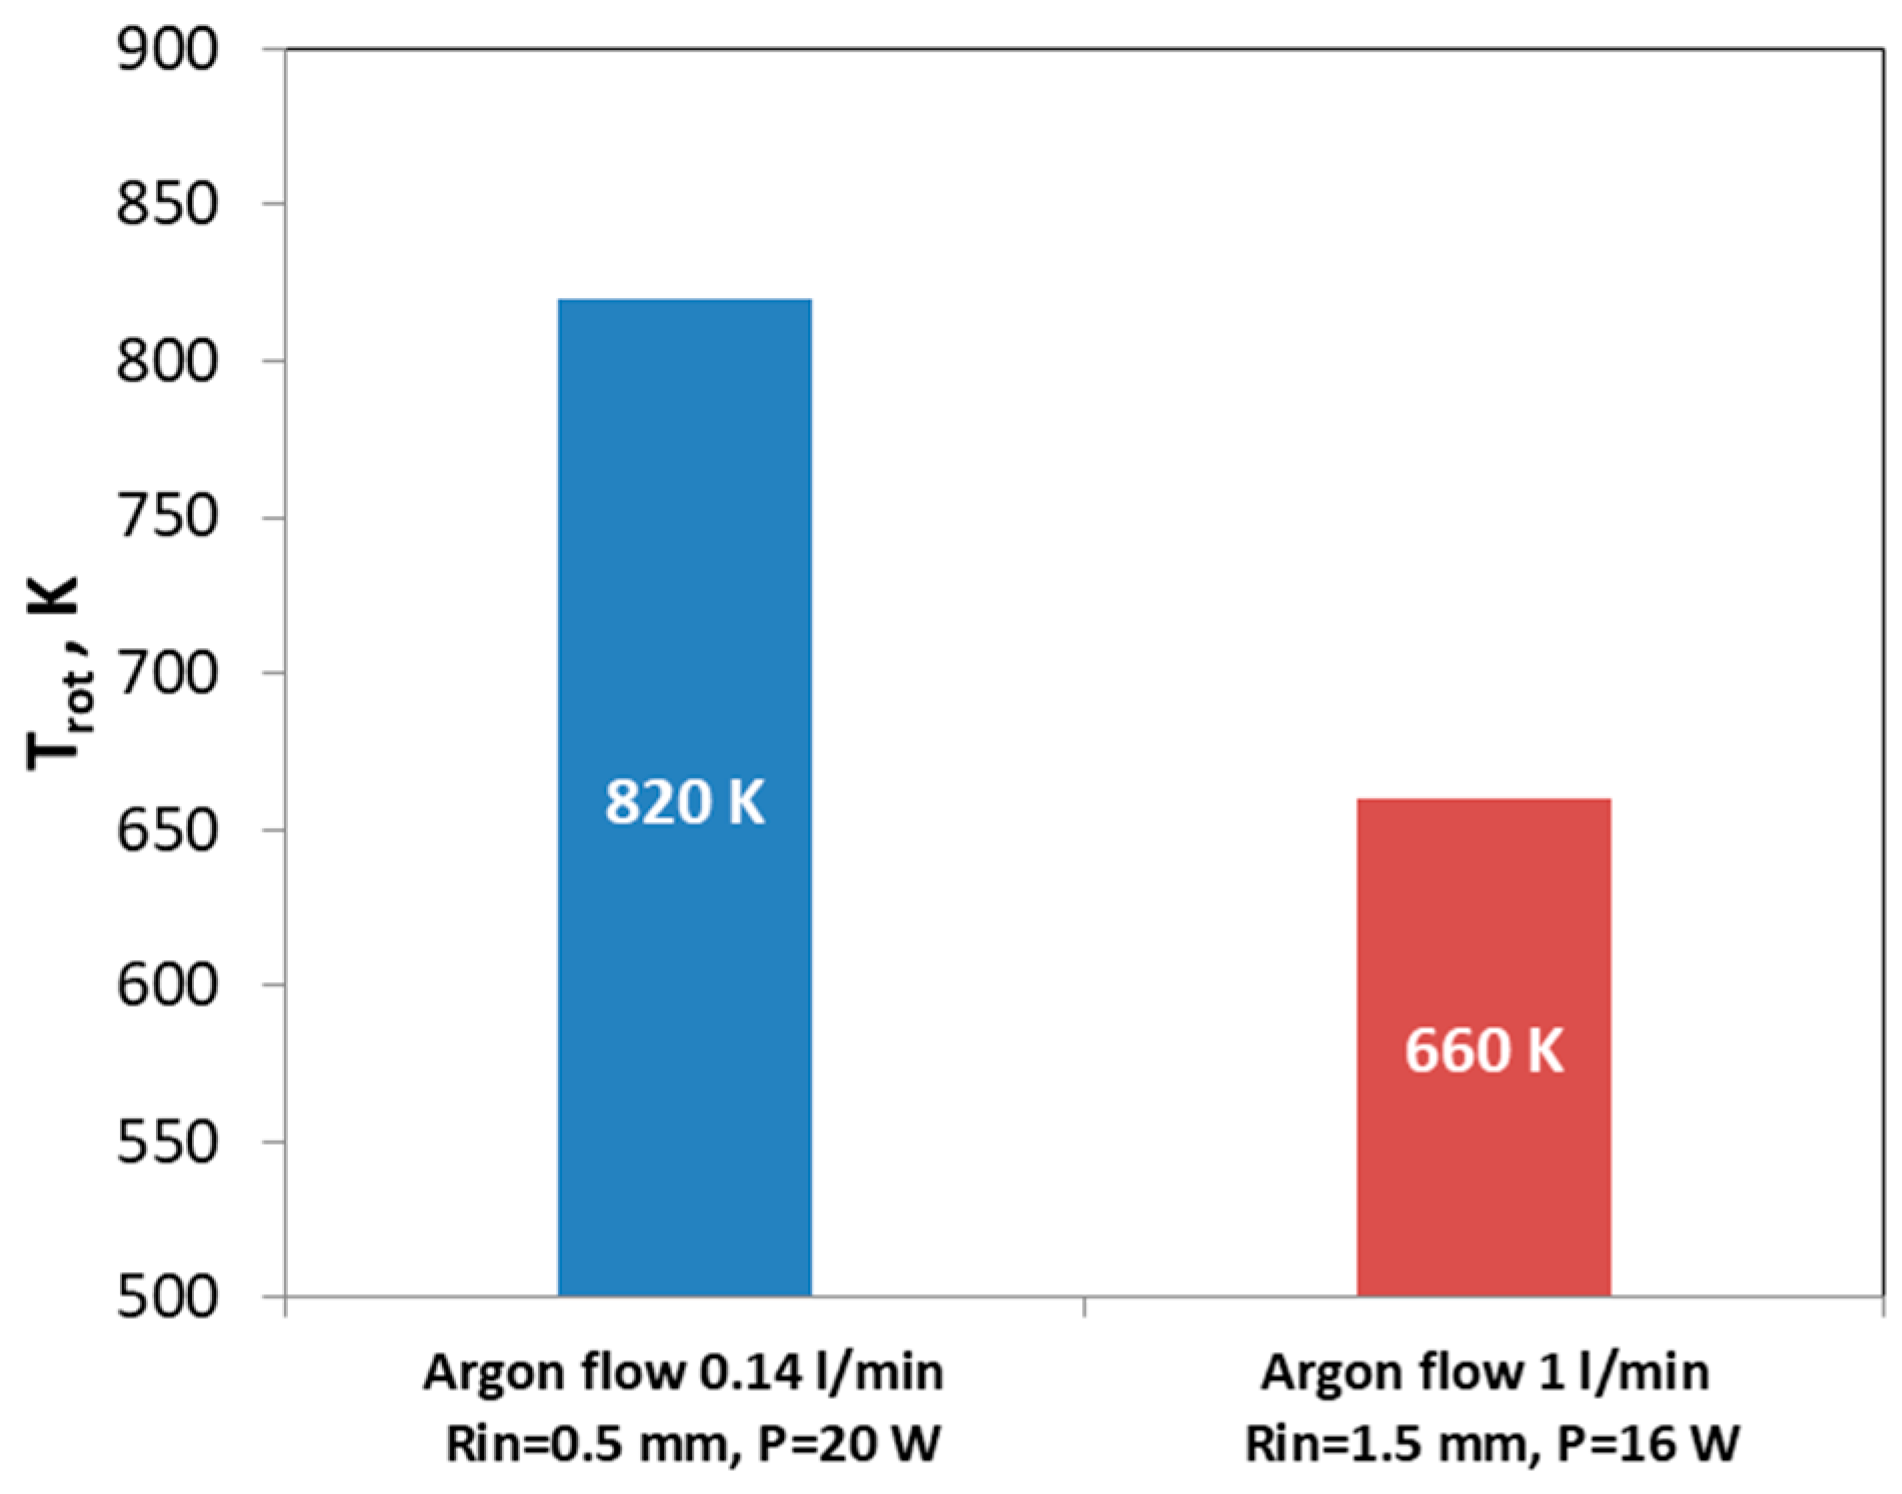
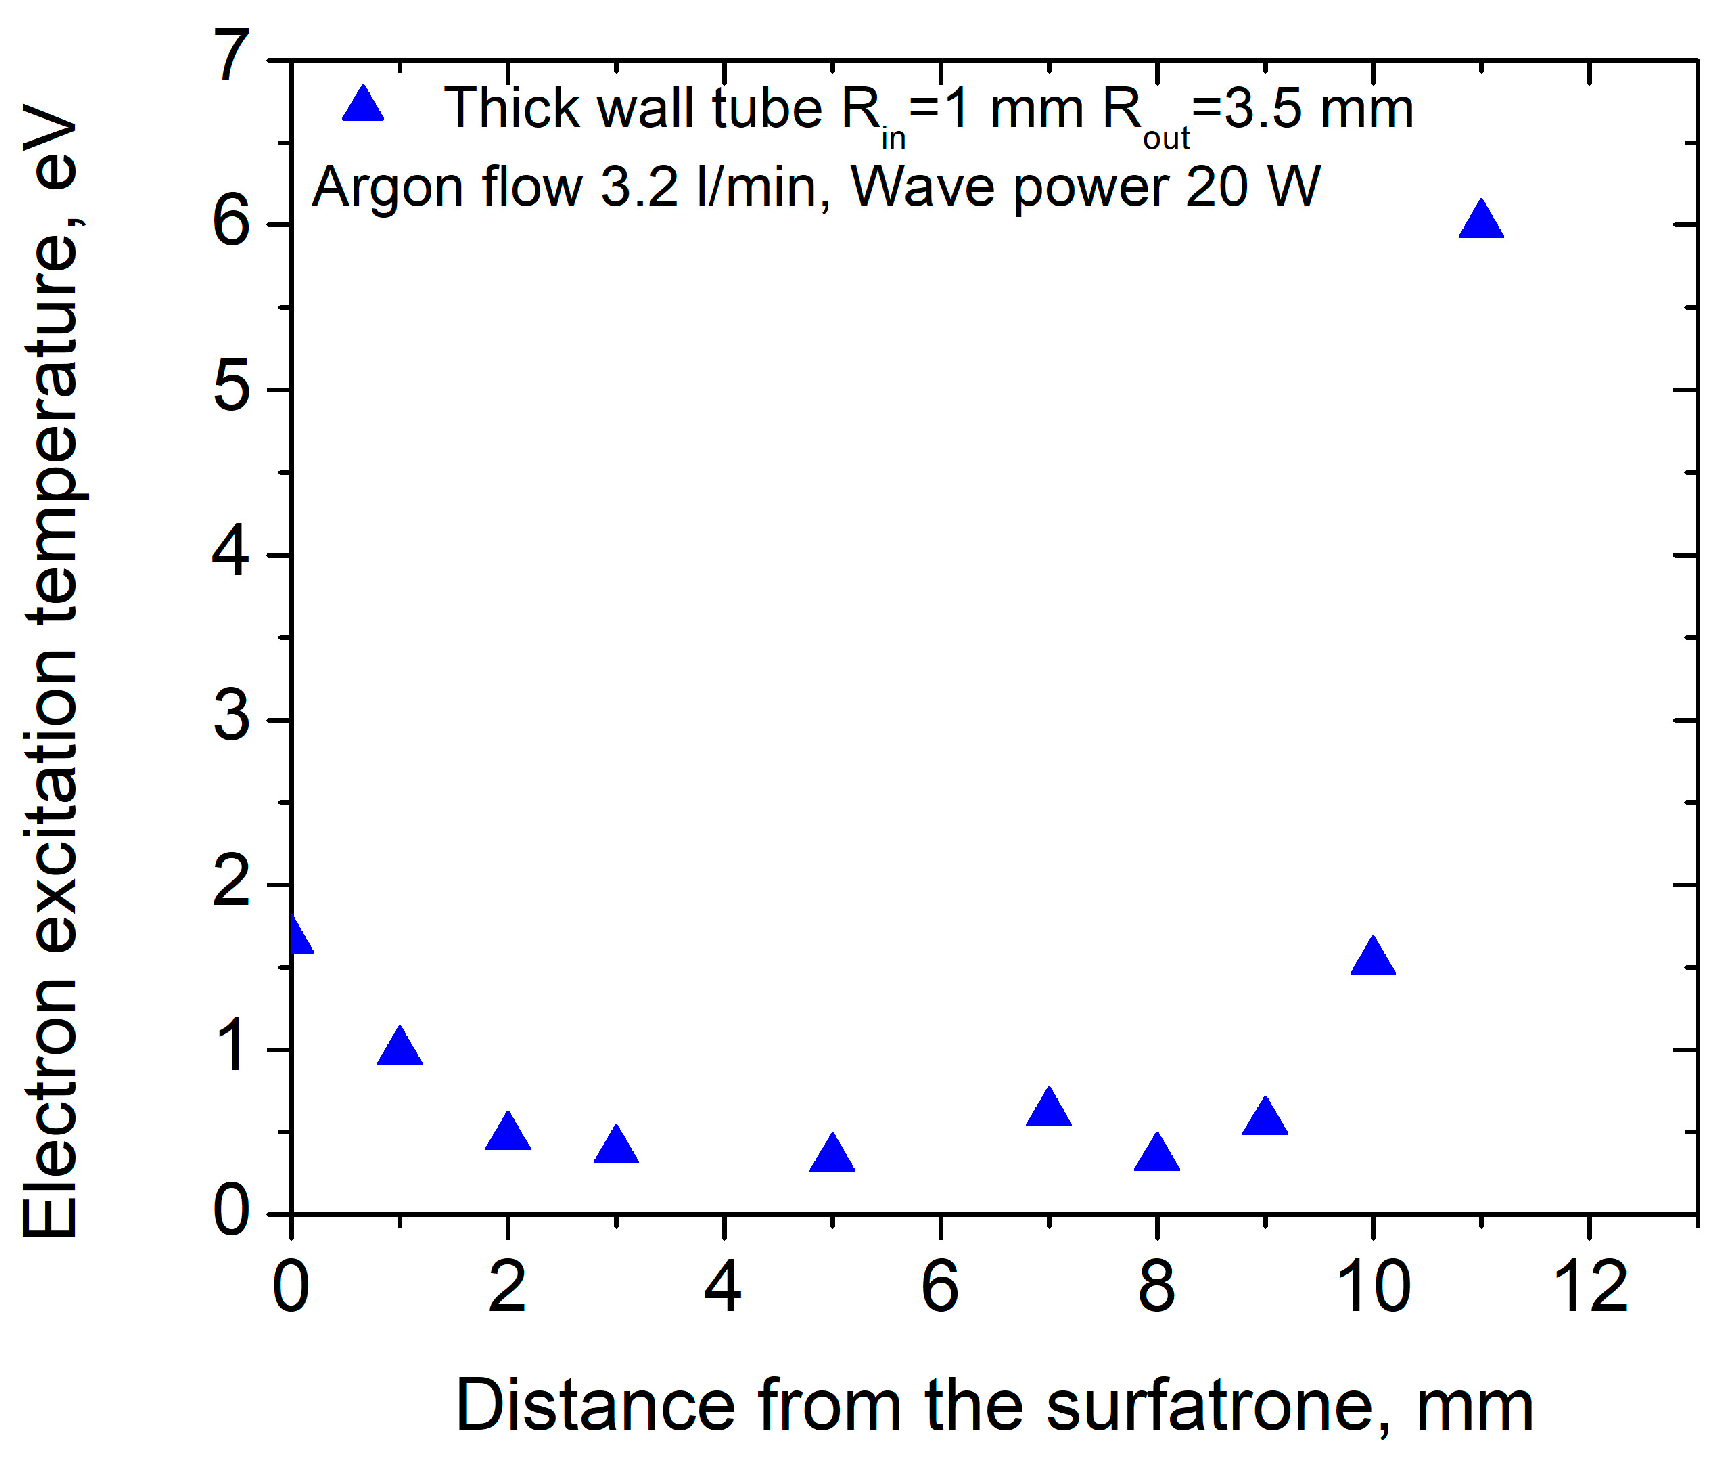
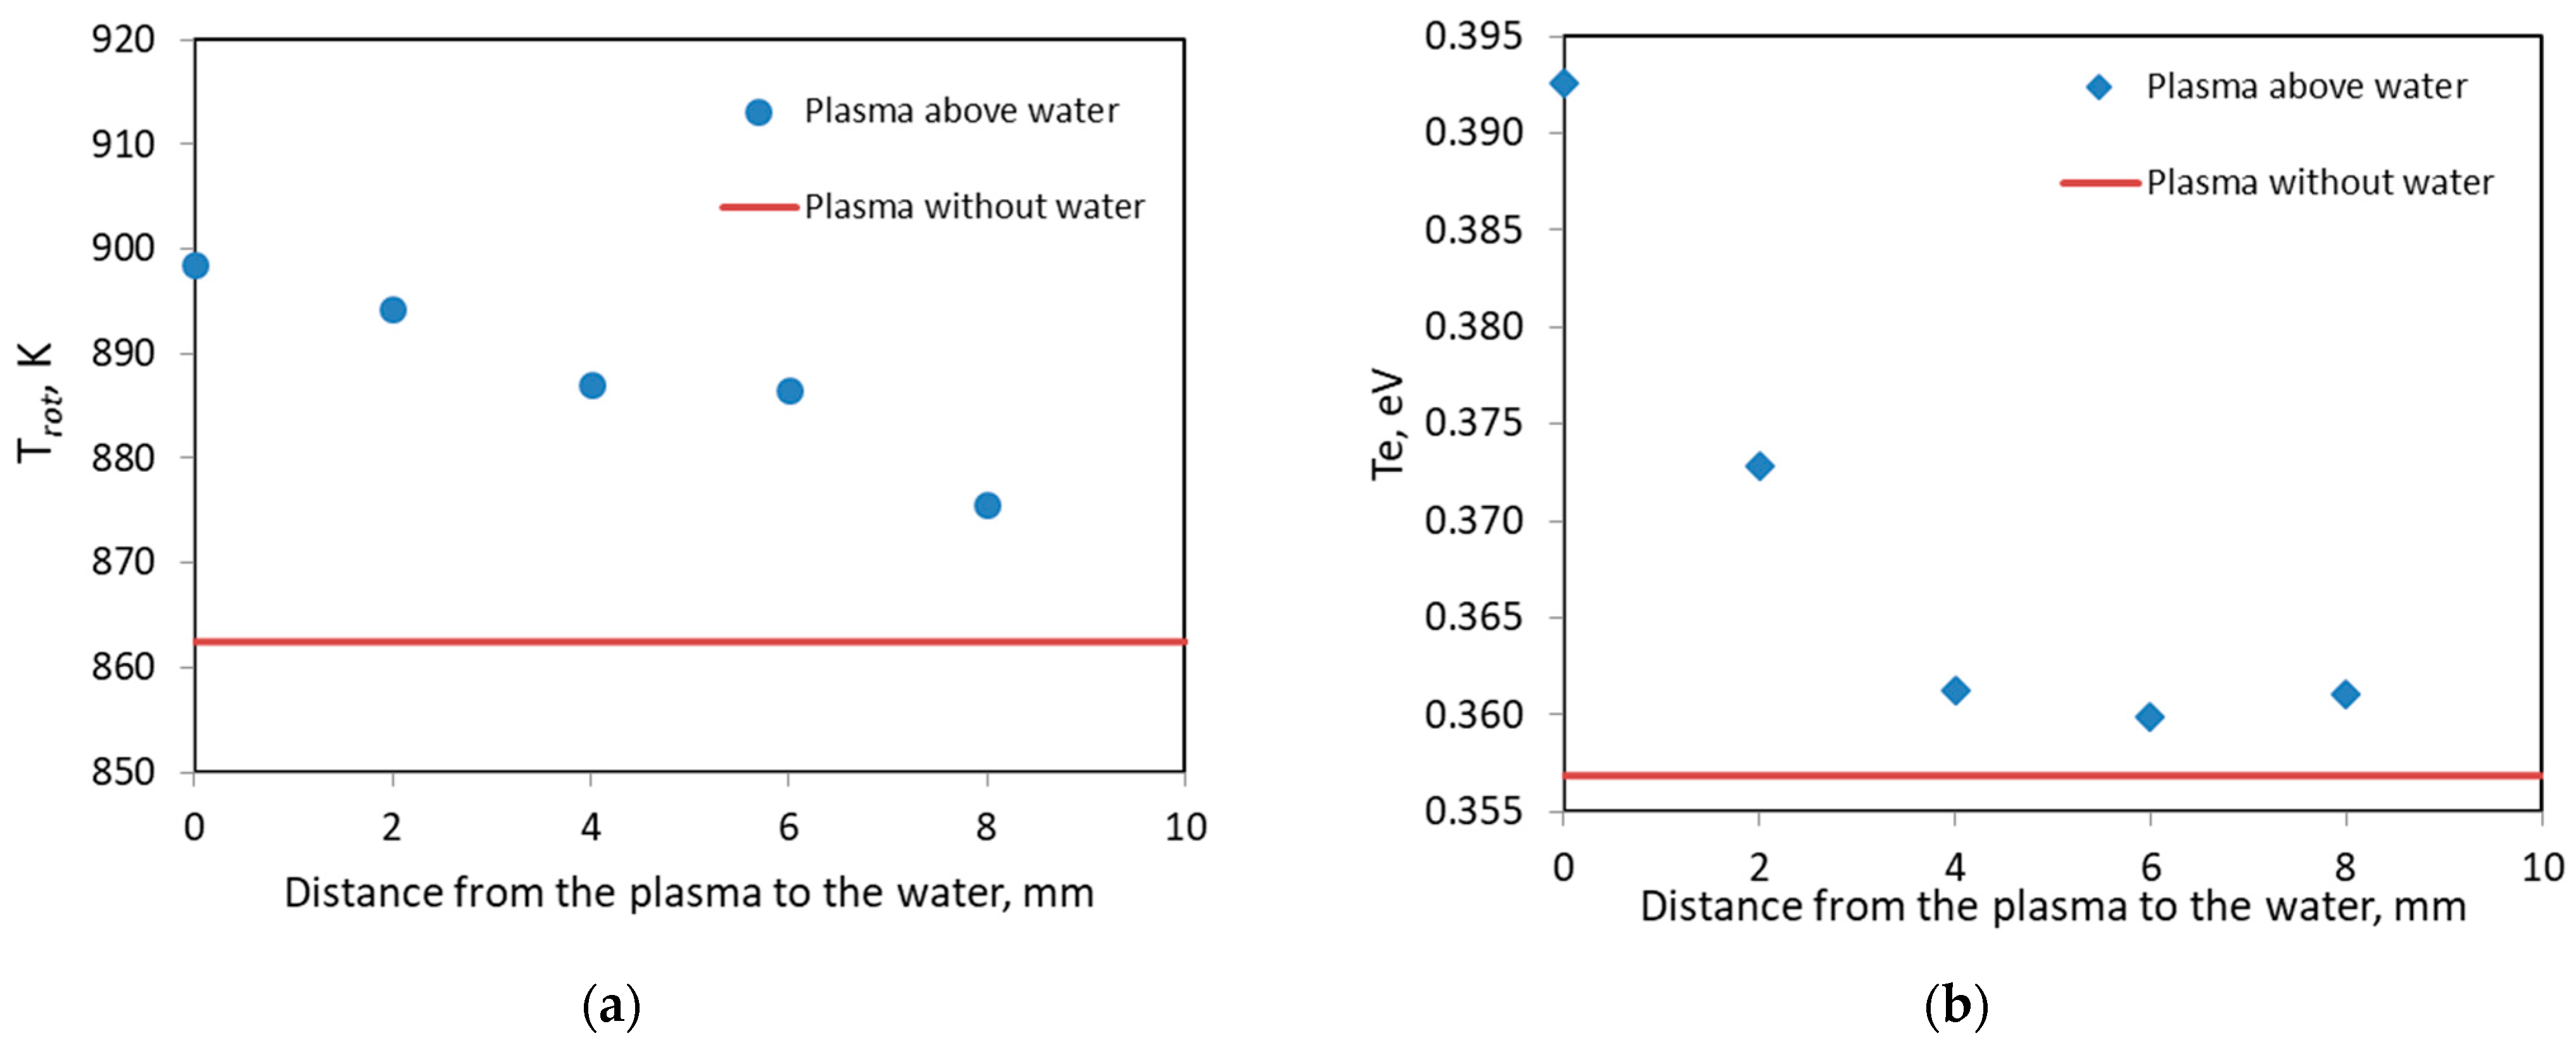
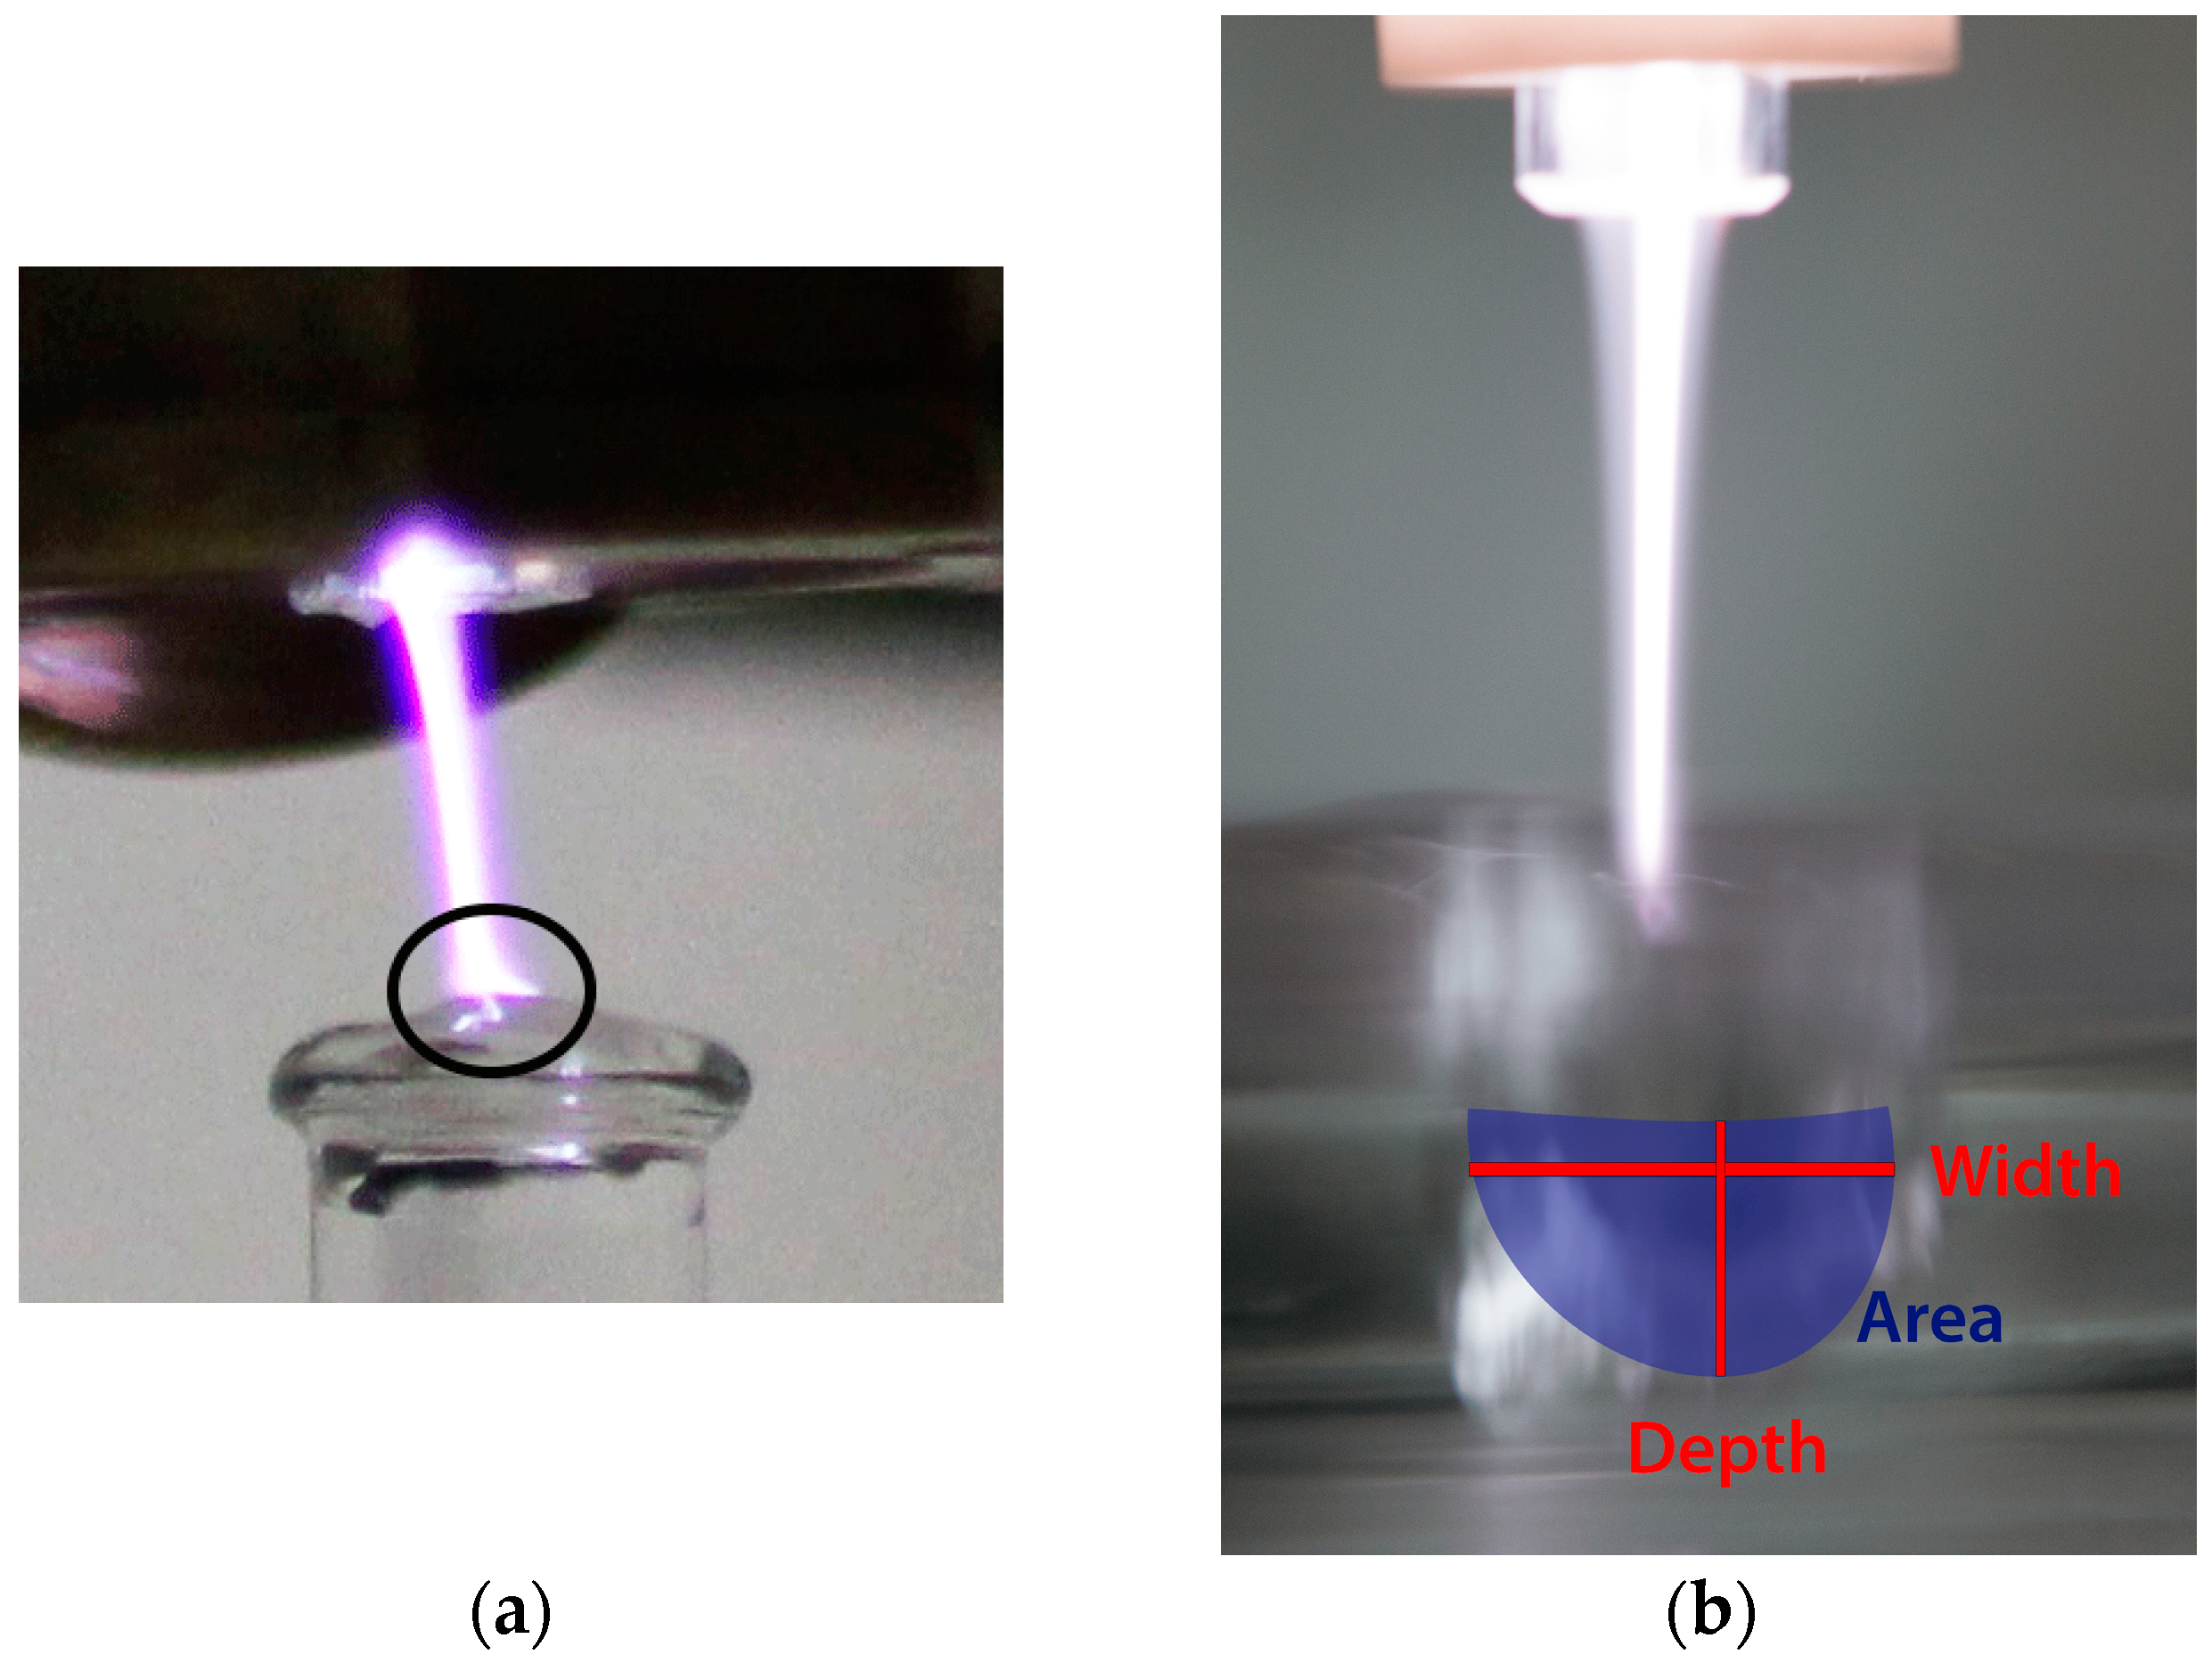
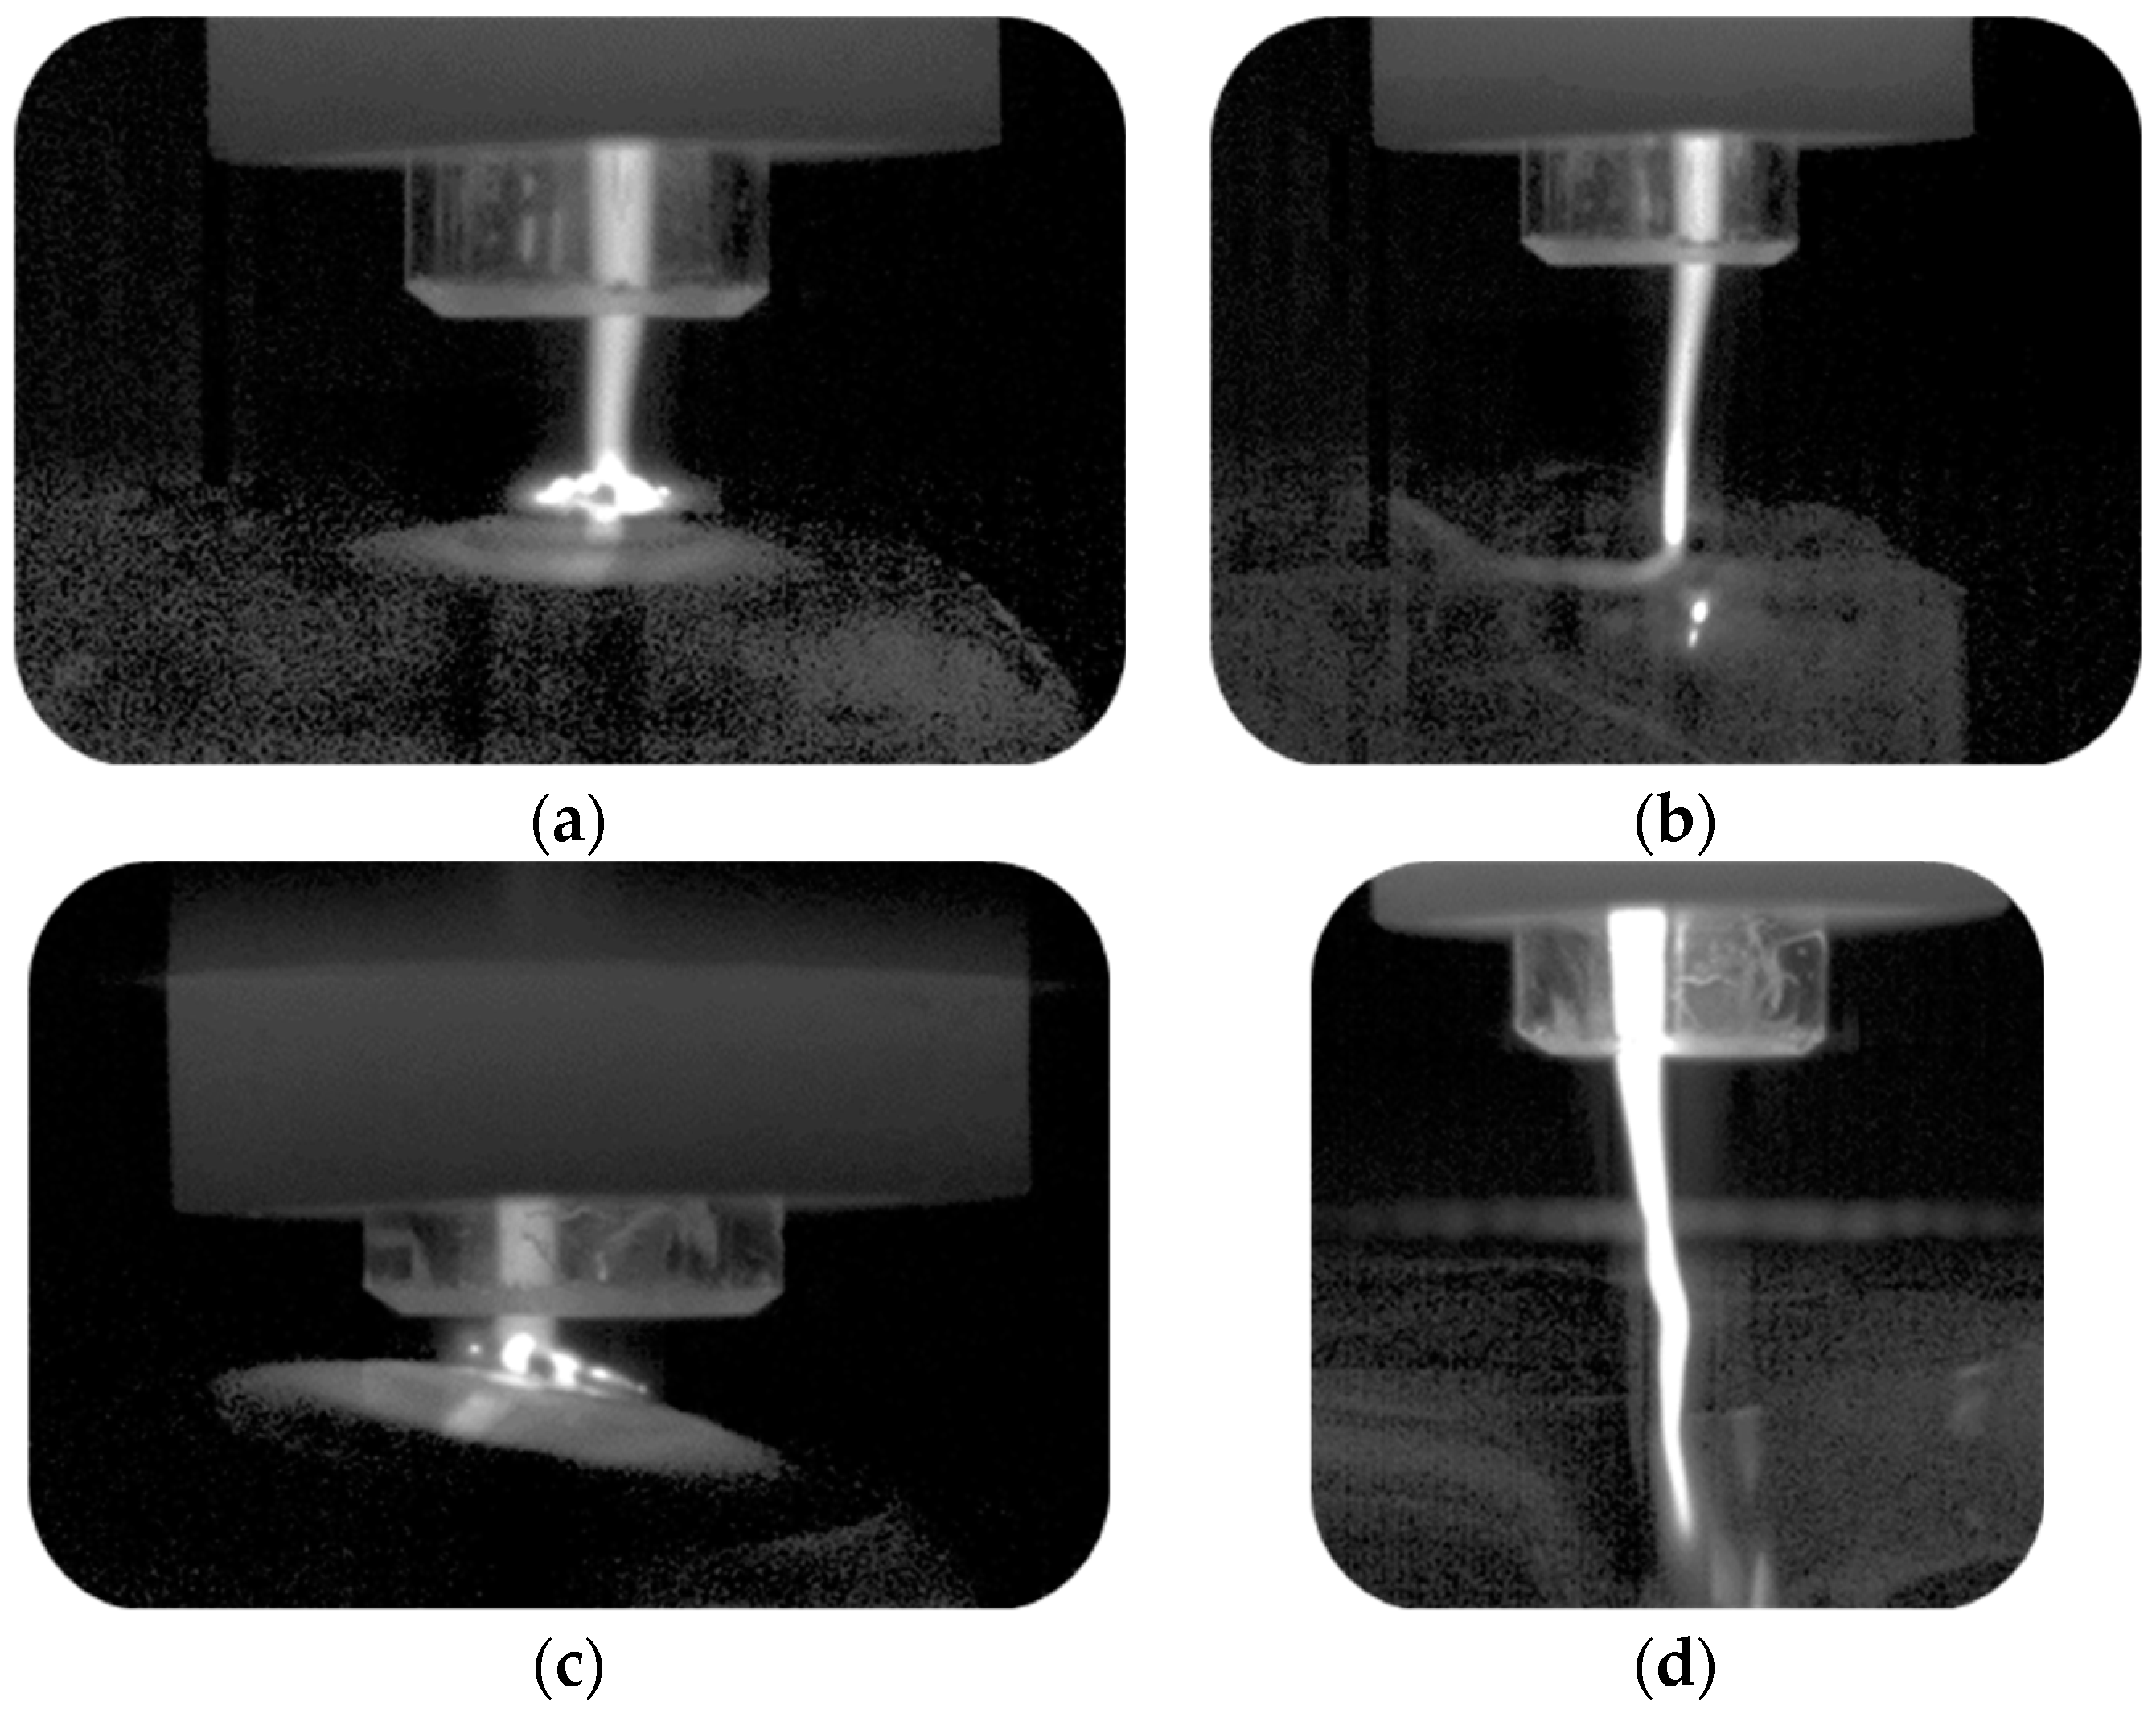
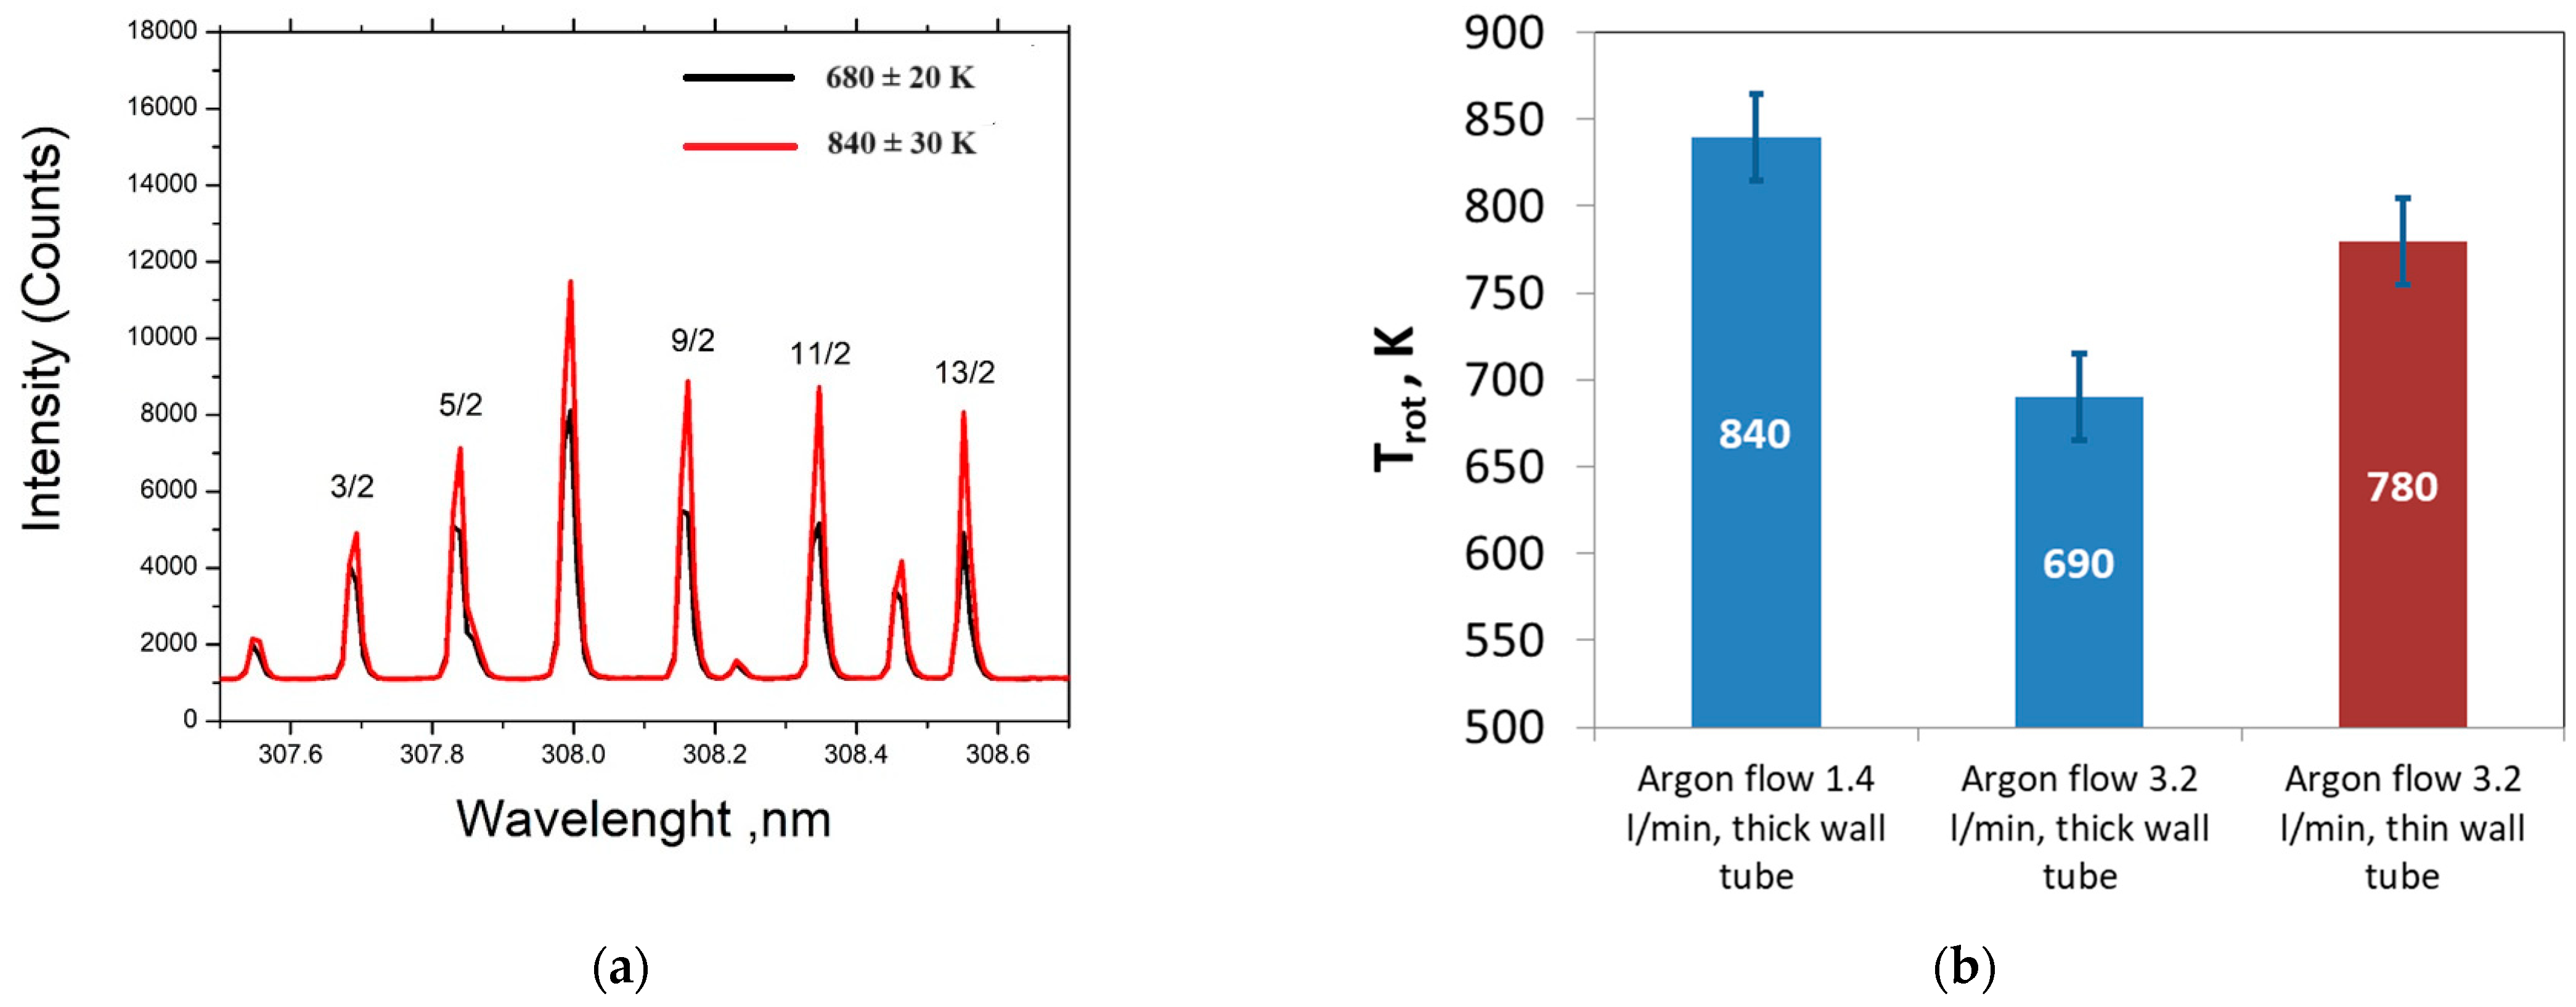
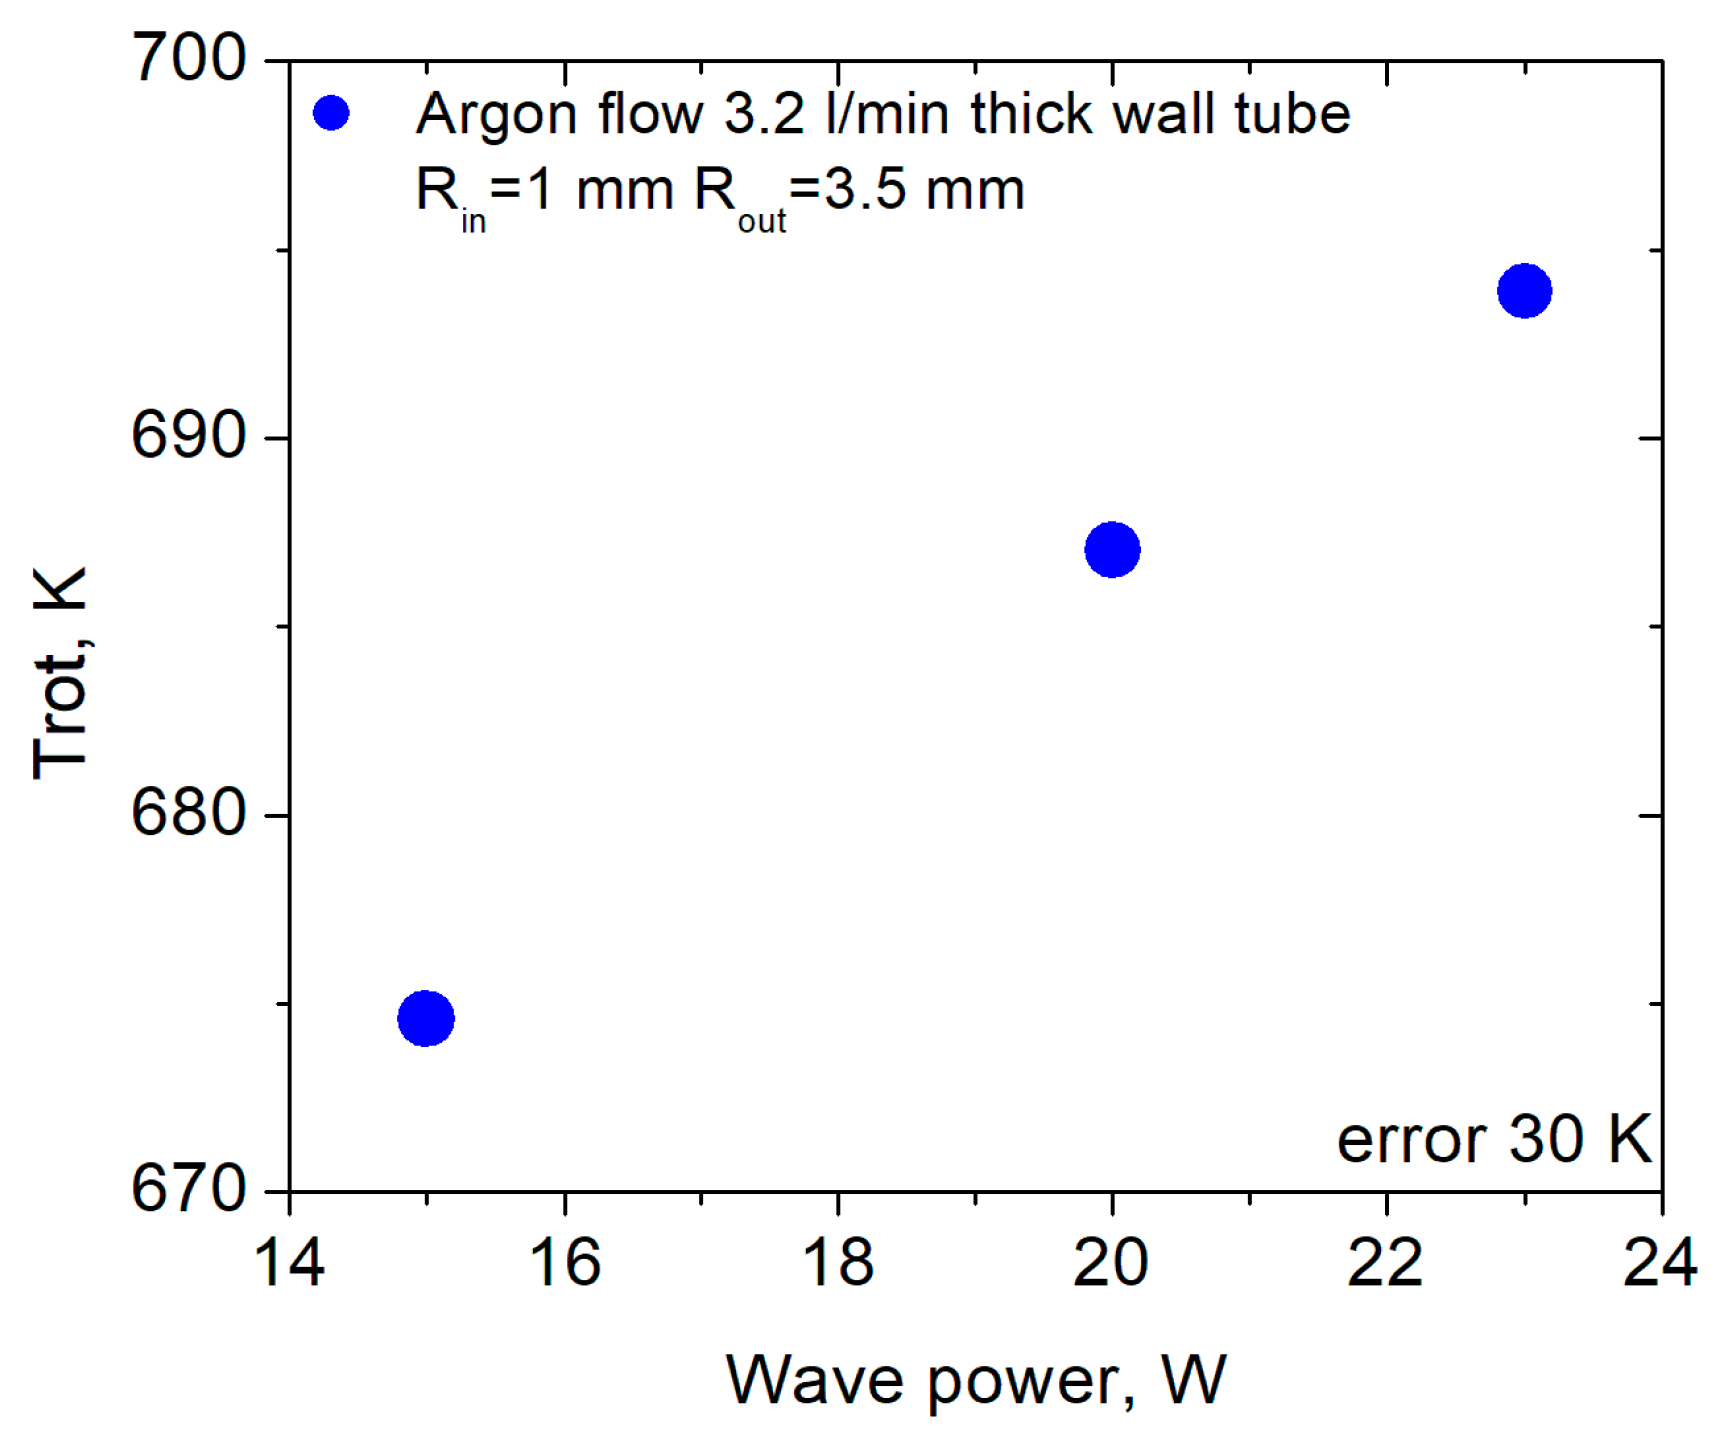
3.1. Interaction of Argon Plasma Torch with Water: Modification of Plasma Characteristics

The plasma–liquid interaction with the distilled water was studied using a high-speed camera with an acquisition rate of 12,500 frames per second at a resolution of 1024 × 1024 pixels at different experimental conditions.
The first effect that can be easily observed when placing water at some distance below the surface-wave-sustained plasma torch (so that the plasma cannot touch the water surface) is the change of its length at the same wave power, gas flow rate and the discharge tube parameters (inner radius, thickness, and dielectric permittivity). The results of this study are presented in [27]. It is shown there (see Figures 4 and 5 in [27]) that the plasma torch is longer when water is placed below the plasma, and this effect is significant, especially at higher wave power.
Placing the water at a distance lower than the length of the plasma torch (compare Figure 2a with Figure 2b,c), two generally different cases are observed: (i) the plasma torch is sliding along the water surface without changing surface shape (Figure 3a); (ii) the plasma torch produces a concave meniscus in the water surface (Figure 3b).
In the first case, a bright spot (Figure 3a) on the water surface may be visually observed. A more detailed look on the spot with a high-speed camera shows that there are 3–4 finger-shaped plasma structures gliding on the water surface. They also have their own structure, visible in Figure 4a,c. These structures sliding along the water surface can be obtained at a low gas flow rate, 0.4 L/min in Figure 4a and 0.2 L/min in Figure 4c, respectively. “Fingers” with a complicated structure sliding on the water surface have been described in [3].
When increasing the gas flow rate, instead of plasma “fingers” sliding on the water surface, a deformation of the water surface in the form of a concave meniscus can be observed (Figure 4b,d). In order to study the effect of gas flow rate, the electromagnetic wave power was fixed to 20 W in these experiments (Figure 4). Two discharge tubes with Rin = 1.5 mm and Rin = 1 mm were used, and the gas flow rate varied from 0.2 to 1.0 L/min. For tubes with Rin = 1.5 mm, the flow rates were 0.4 L/min (Figure 4a) and 1 L/min (Figure 4b), respectively. By decreasing the tube inner radius to Rin = 1 mm, the gas flow rate was decreased twice, to 0.2 L/min (Figure 4c) and 0.5 L/min (Figure 4d), respectively. In this way, the gas speed in Figure 4a,c remains very close (from 95 to 105 cm/s) and low enough to keep the water surface undeformed. The conditions in Figure 4b,d correspond to a gas speed that was more than twice higher (about 235 cm/s to 265 cm/s). At these high speeds, the deformation of the water surface occurs. If there is no plasma, the gas flow with high enough speed would be the only reason for the concave meniscus. It is important to clarify the role of plasma and plasma–liquid interaction in this deformation.
At some discharge conditions, the plasma torch changes its shape so that wave-like curves occur on the plasma torch (Figure 4d). In this case, the plasma column was surrounded by water. The meniscus was not purely hemispherical, but on its surface, some water waves were produced at the higher argon gas flow. At the same time, similar waves appeared in the plasma column. Figure 5 shows the waves in the plasma torch from Figure 4d with a duration of 6 ms as consecutive frames from the fast camera recording. Discharge conditions were: tube inner diameter 2 mm, outer diameter 4 mm, wave power 20 W, and argon gas flow 0.5 L/min. The waves propagating along the plasma torch were well visible in this sequence as well as the interaction between the plasma and the water surface. We assume that these mechanical waves are produced by the interaction between the plasma torch and the liquid surface. Further investigation is needed to clarify this phenomenon, but there is evidence from other investigations [36] showing that the jet of charged particles and electric field in the ionized gas (plasma) interaction with water is different from the interaction of the neutral gas jet with water. However, such investigation is complicated because the discharge conditions, when such waves exist, are not suitable for plasma diagnostics since the plasma torch is not stable enough. Nevertheless, as is shown in [36], the increase in neutral gas flow rate leads to the destabilization of the cavity boundary, while the plasma–water interaction has a stabilizing effect on the liquid surface.
The changes of the physical and chemical properties of water when interacting with plasma, consequently lead to a change in the dielectric–plasma waveguide structure for wave propagation. This affects the parameters of the plasma created, such as the length of the plasma column [27], electron excitation temperature Te, and mean rotation temperature Trot. The variation in the parameters of the dielectric in close proximity to the interaction with charged particles, electromagnetic field, and heating have been circumstantially studied before [37,38]. The effect of the plasma surrounding the medium has been extensively studied by means of modeling [39].
The surface of the water bent at a higher argon flow. Assuming the concentration of the active particles in the water was higher with a larger plasma–water contact area, a study has been made of the dependence of the affected area at the water surface on the discharge conditions. Measurements have been performed for the indentation of the concave meniscus caused by the plasma gas flow to the water surface (Figure 3b).
The concave meniscus exists at high gas flow only. However, the effect is weakly dependent on the discharge tube diameter and increasing the argon flow. Surprisingly, the results show a significant increase in the affected area with the increase in the input wave power. In Figure 6a, the affected water area, as defined in Figure 3b, is shown for different discharge conditions, varying the wave power from 12 to 40 W. The plasma torch created a meniscus, whose depth increased (Figure 6b), and the curvature also increased with the wave power increasing, while the width, which is the neck of the created “bubble”, started to close (Figure 6c).
The gas discharge temperature plays a very significant role in the treatment of temperature-sensitive materials. Direct determination of plasma gas temperature is difficult using standard methods due to the small plasma size, disturbance of the plasma, and plasma transparency for non-contact thermometers. Spectroscopic methods are recommended for the investigation of plasma parameters.
With optical emission spectroscopy, the axial profiles of rotational temperature and the electron excitation temperatures were estimated. The rotational temperature was obtained from the plasma-induced emission by measuring the rotational temperature of a diatomic molecule OH [40].
The spectrum emitted from the argon plasma column in the 306–308 nm range was investigated. The average along-the-torch rotation temperature Trot was obtained under different discharge conditions and the detailed axial profiles have recently been presented in [32]. The results show two main dependencies (Figure 7b): (i) sufficiently higher rotational temperatures for plasma sustained using a thin wall discharge tube in comparison with the thicker wall tube; (ii) a decrease in the rotational temperature with gas flow increase. While the second results are intuitive, the dependence of the plasma rotational temperature on the discharge tube thickness was a feature of SWDs only but not of all the other plasma sources. Because of this peculiarity, it is very easy to control the Trot and other plasma parameters by simply using appropriate discharge tubes. This was also confirmed by the results presented in Figure 8.
It has also been found that the averaged rotational temperature increases with increasing the wave power under the same discharge conditions–tube radius and argon flow (Figure 8 and Figure 9). Unfortunately, the lower input power leads to obtaining a shorter plasma column. For this parameter, an agreement between the plasma torch dimensions suitable for application and low temperature needs to be reached.
Studying the plasma parameters for different discharge conditions allows us to be able to choose the suitable ones for a given application. Figure 10 shows how the simultaneous change in all three parameters (discharge tube size, argon gas flow, and input power) leads to obtaining plasma with significantly different average rotational temperatures.
These studies show that the three parameters of the gas discharge conditions providing the low gas temperature in this type of discharge are low wave power, higher gas flow, and larger tube wall thickness. It should be kept in mind that these parameters cannot be changed independently and arbitrarily. There are combinations of discharge conditions under which the plasma cannot be sustained at all or is highly unstable.
It is well known from all previous investigations that the SWDs are non-homogeneous [30]. When the wave power of the surfatron is fixed, the power of the surface wave along the plasma torch decreases because it is absorbed by the electrons. The plasma density and all other plasma characteristics also change along the plasma column.
The axial profile of the electron excitation temperature is presented in Figure 11, which is in good agreement with the SWD modeling [39]. Both the experiment data and model prediction present an increase in the electron excitation temperature at the plasma column end, which is very important for applications since just the end of the plasma torch is in contact with the treated samples. Thus, the elementary processes involving high-energy electrons were possible, but this could not happen when the afterglow was used for the treatment. The measured Te was close to 0.5 eV for the main part of the plasma torch, increasing up to 6 eV at the torch tip.
At the same time, it is important to know if and how the presence of water changes the axial distribution of plasma characteristics. At different distances from the end of the plasma column, a vessel with water was placed (Figure 12), and the average rotation temperature Trot (Figure 13a) and the electron excitation temperature Te (Figure 13b) were obtained. The gas discharge conditions are wave power 20 W, 1.4 L/min argon flux, and a discharge tube with Rin = 1 mm and Rout = 3.5 mm.
The position of the plasma torch is fixed, and the container with the water approaches the torch tip upward with a step of 2 mm. For each position of the water surface, the rotational and excitation temperatures of the plasma torch are determined at a fixed distance of 5 mm from the surfatron. From the results presented (Figure 13), it is seen that both Te and Trot increase with decreasing the distance between the plasma torch tip and the water surface. This indicates that the plasma properties’ axial distribution changes when the water is present below the torch. The Te and Trot increase when the water surface approaches the tip of the plasma torch even without touching it.

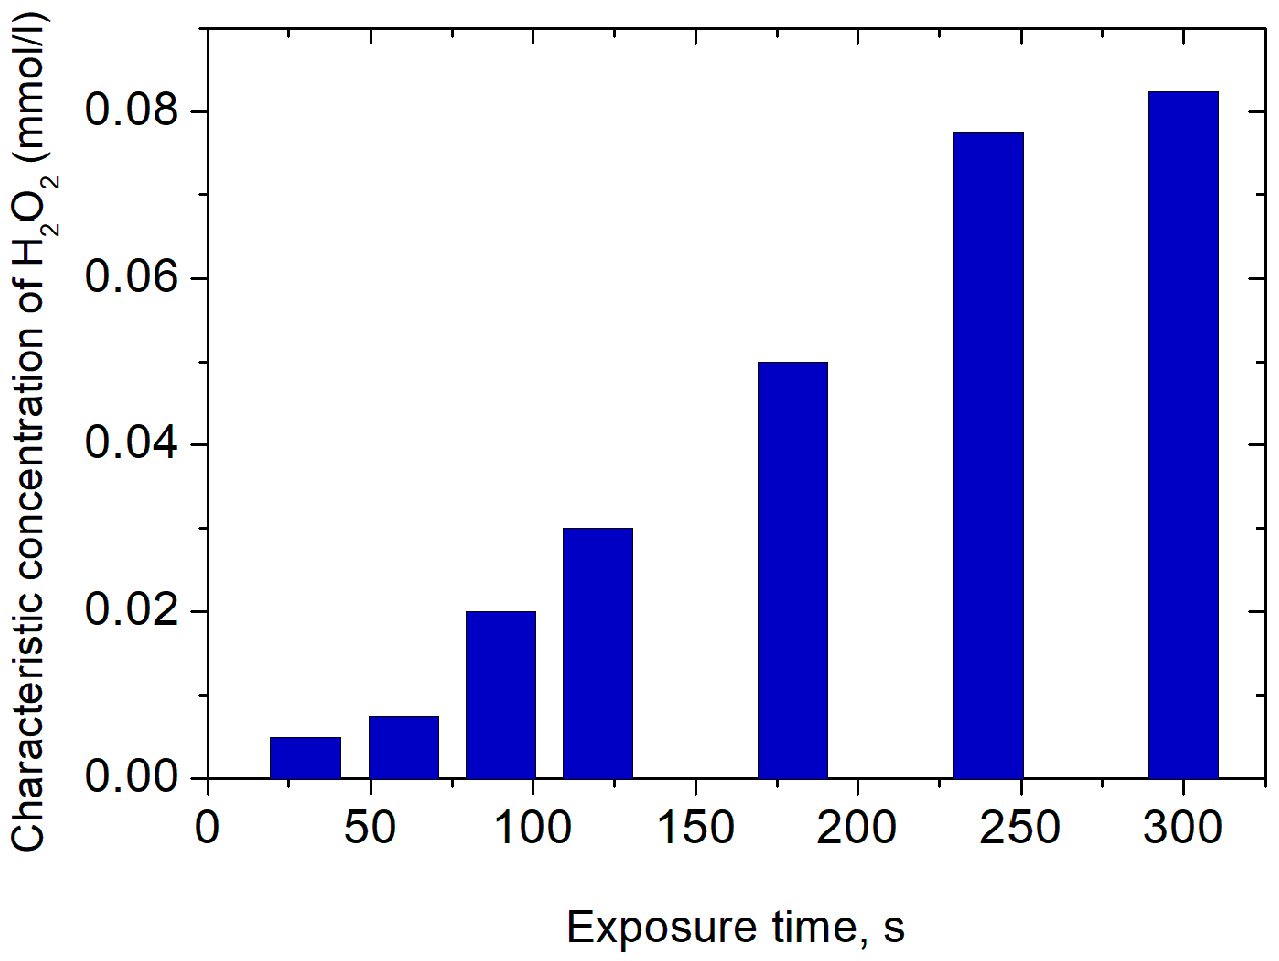
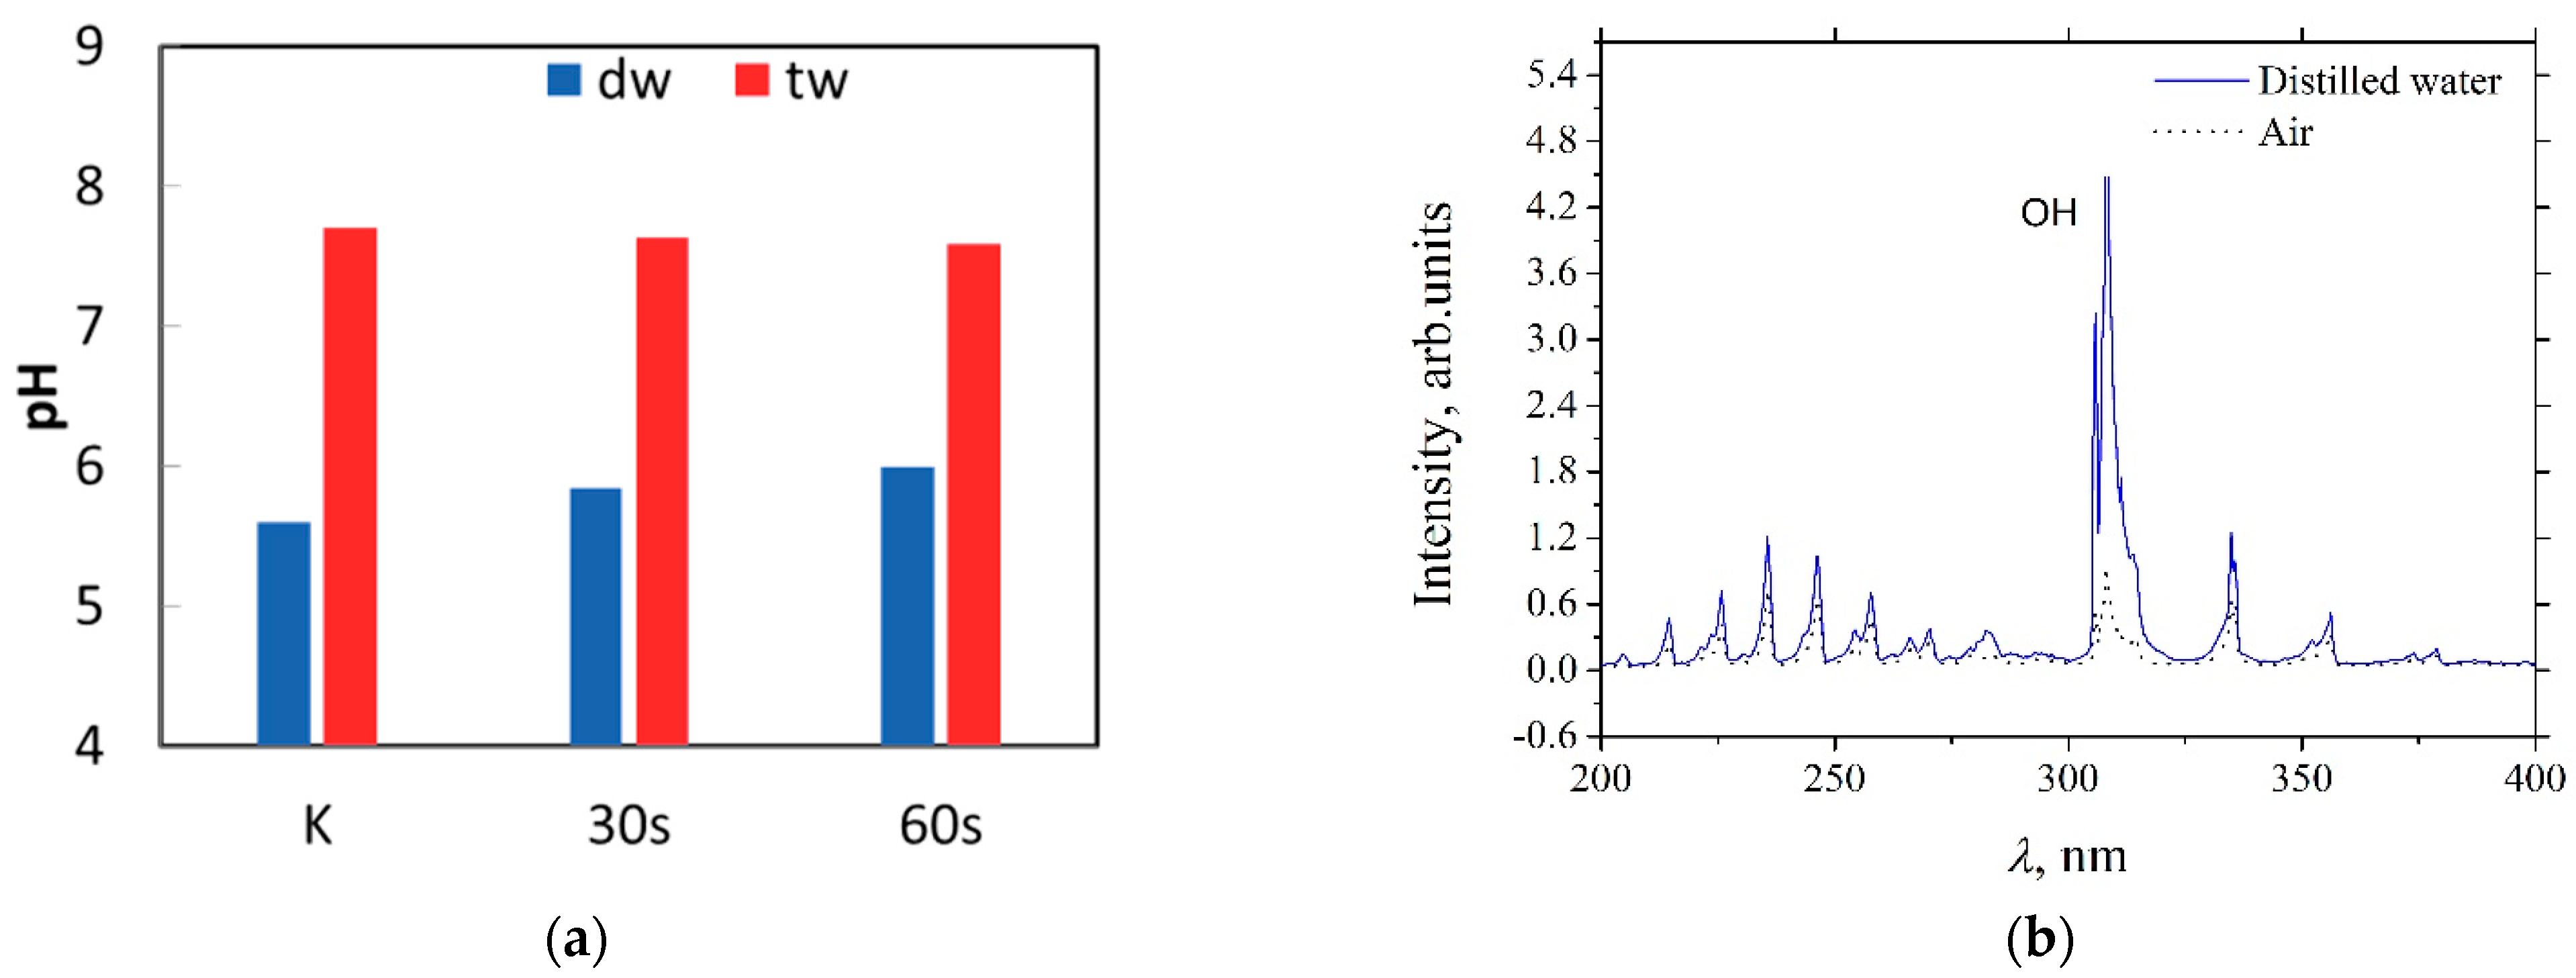
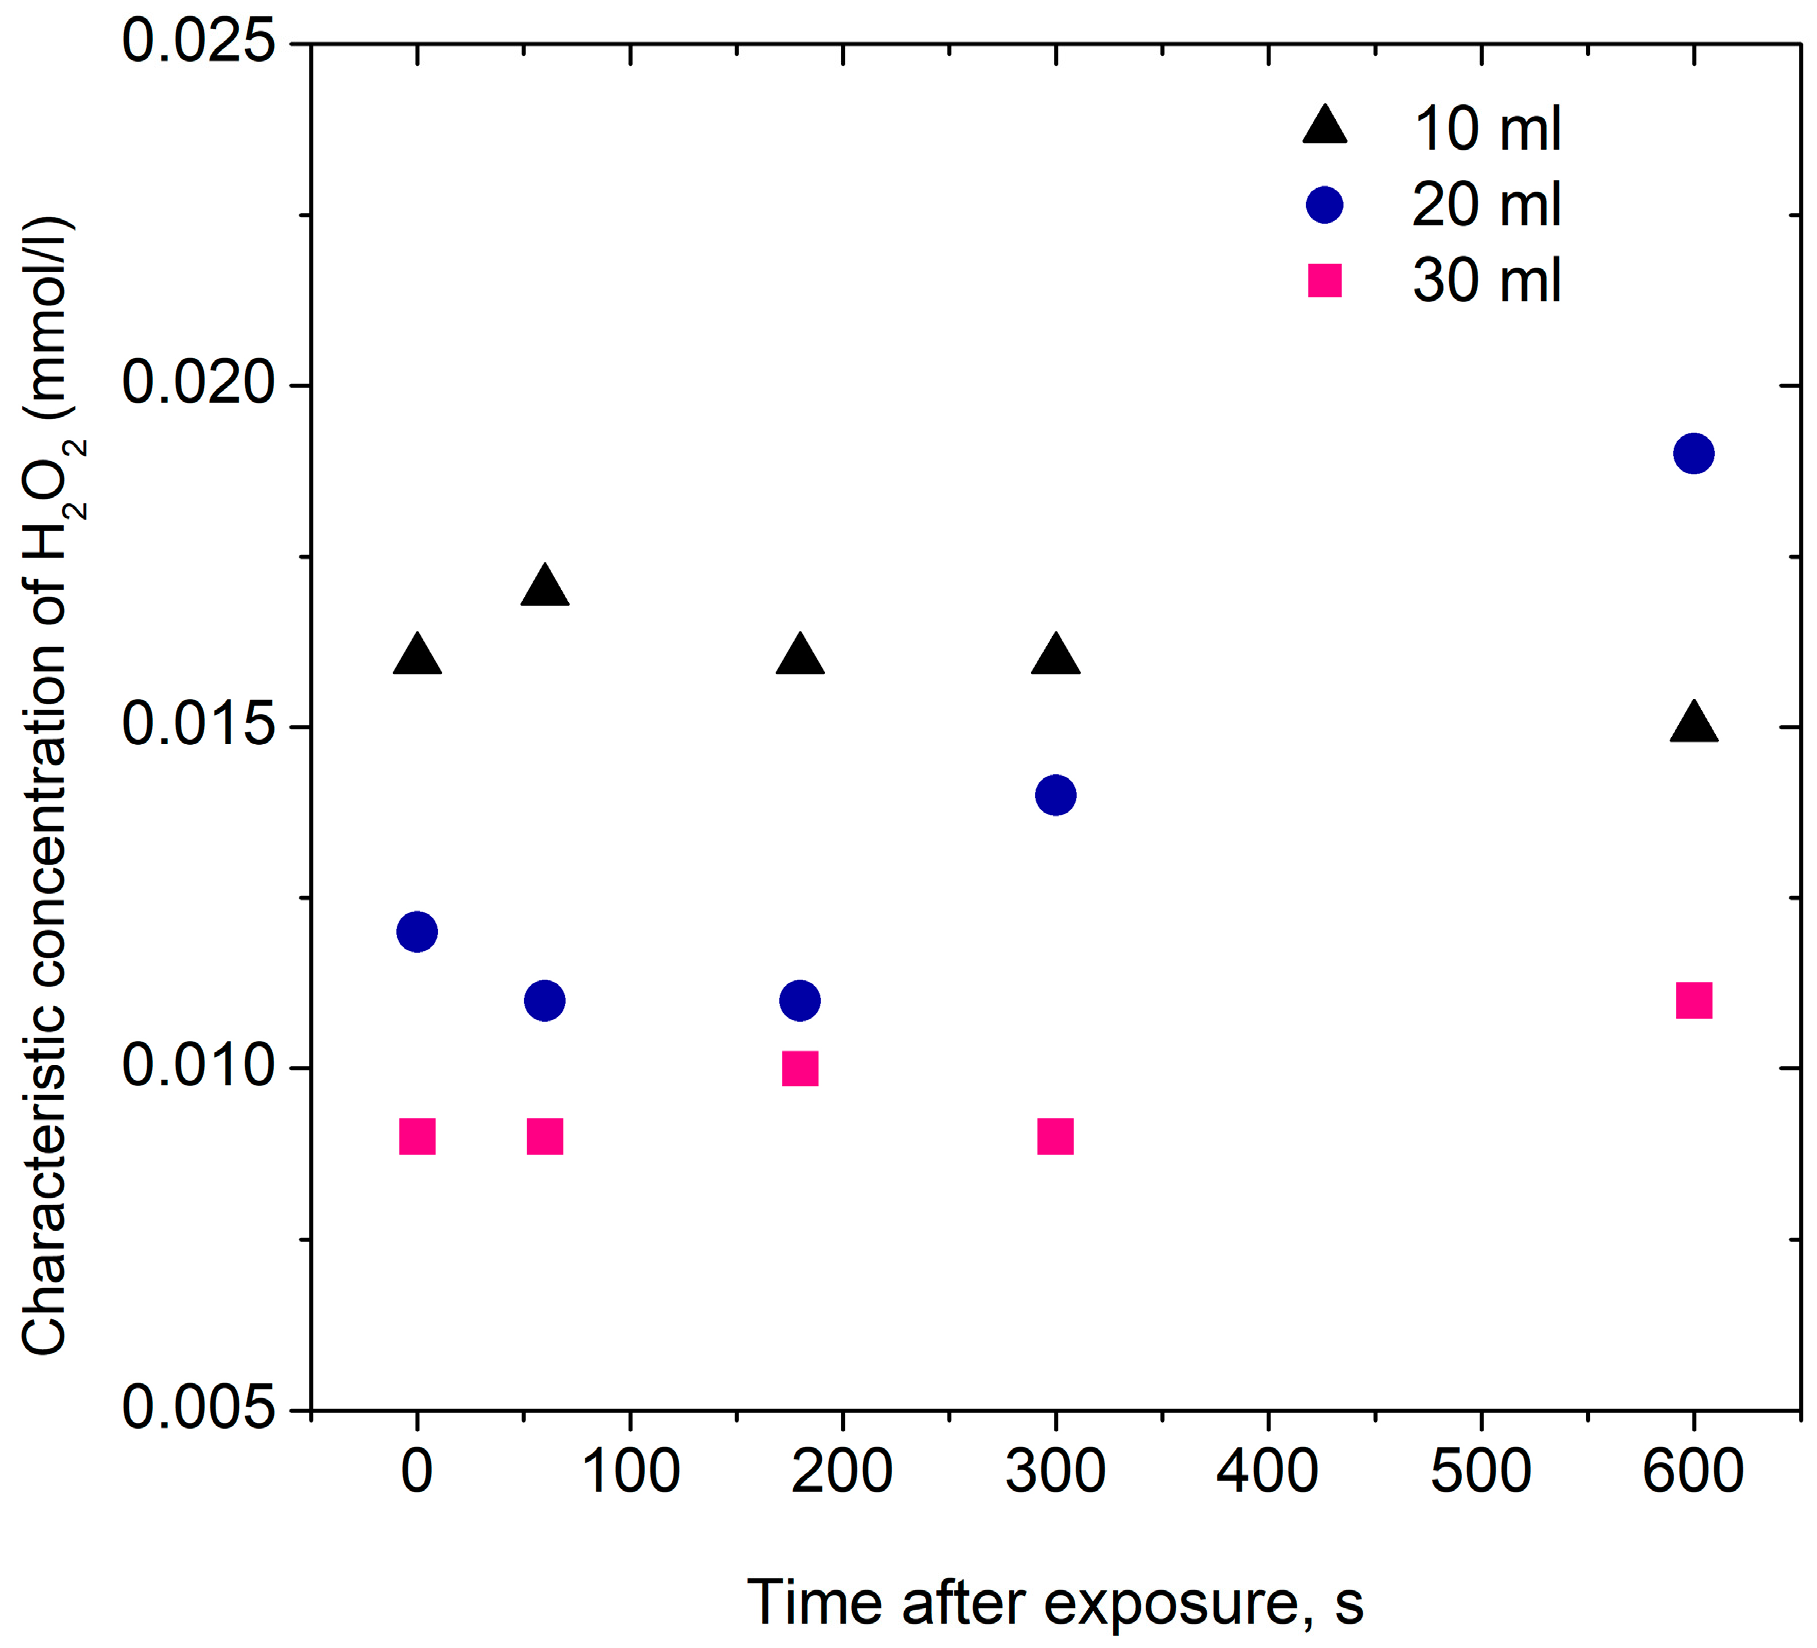
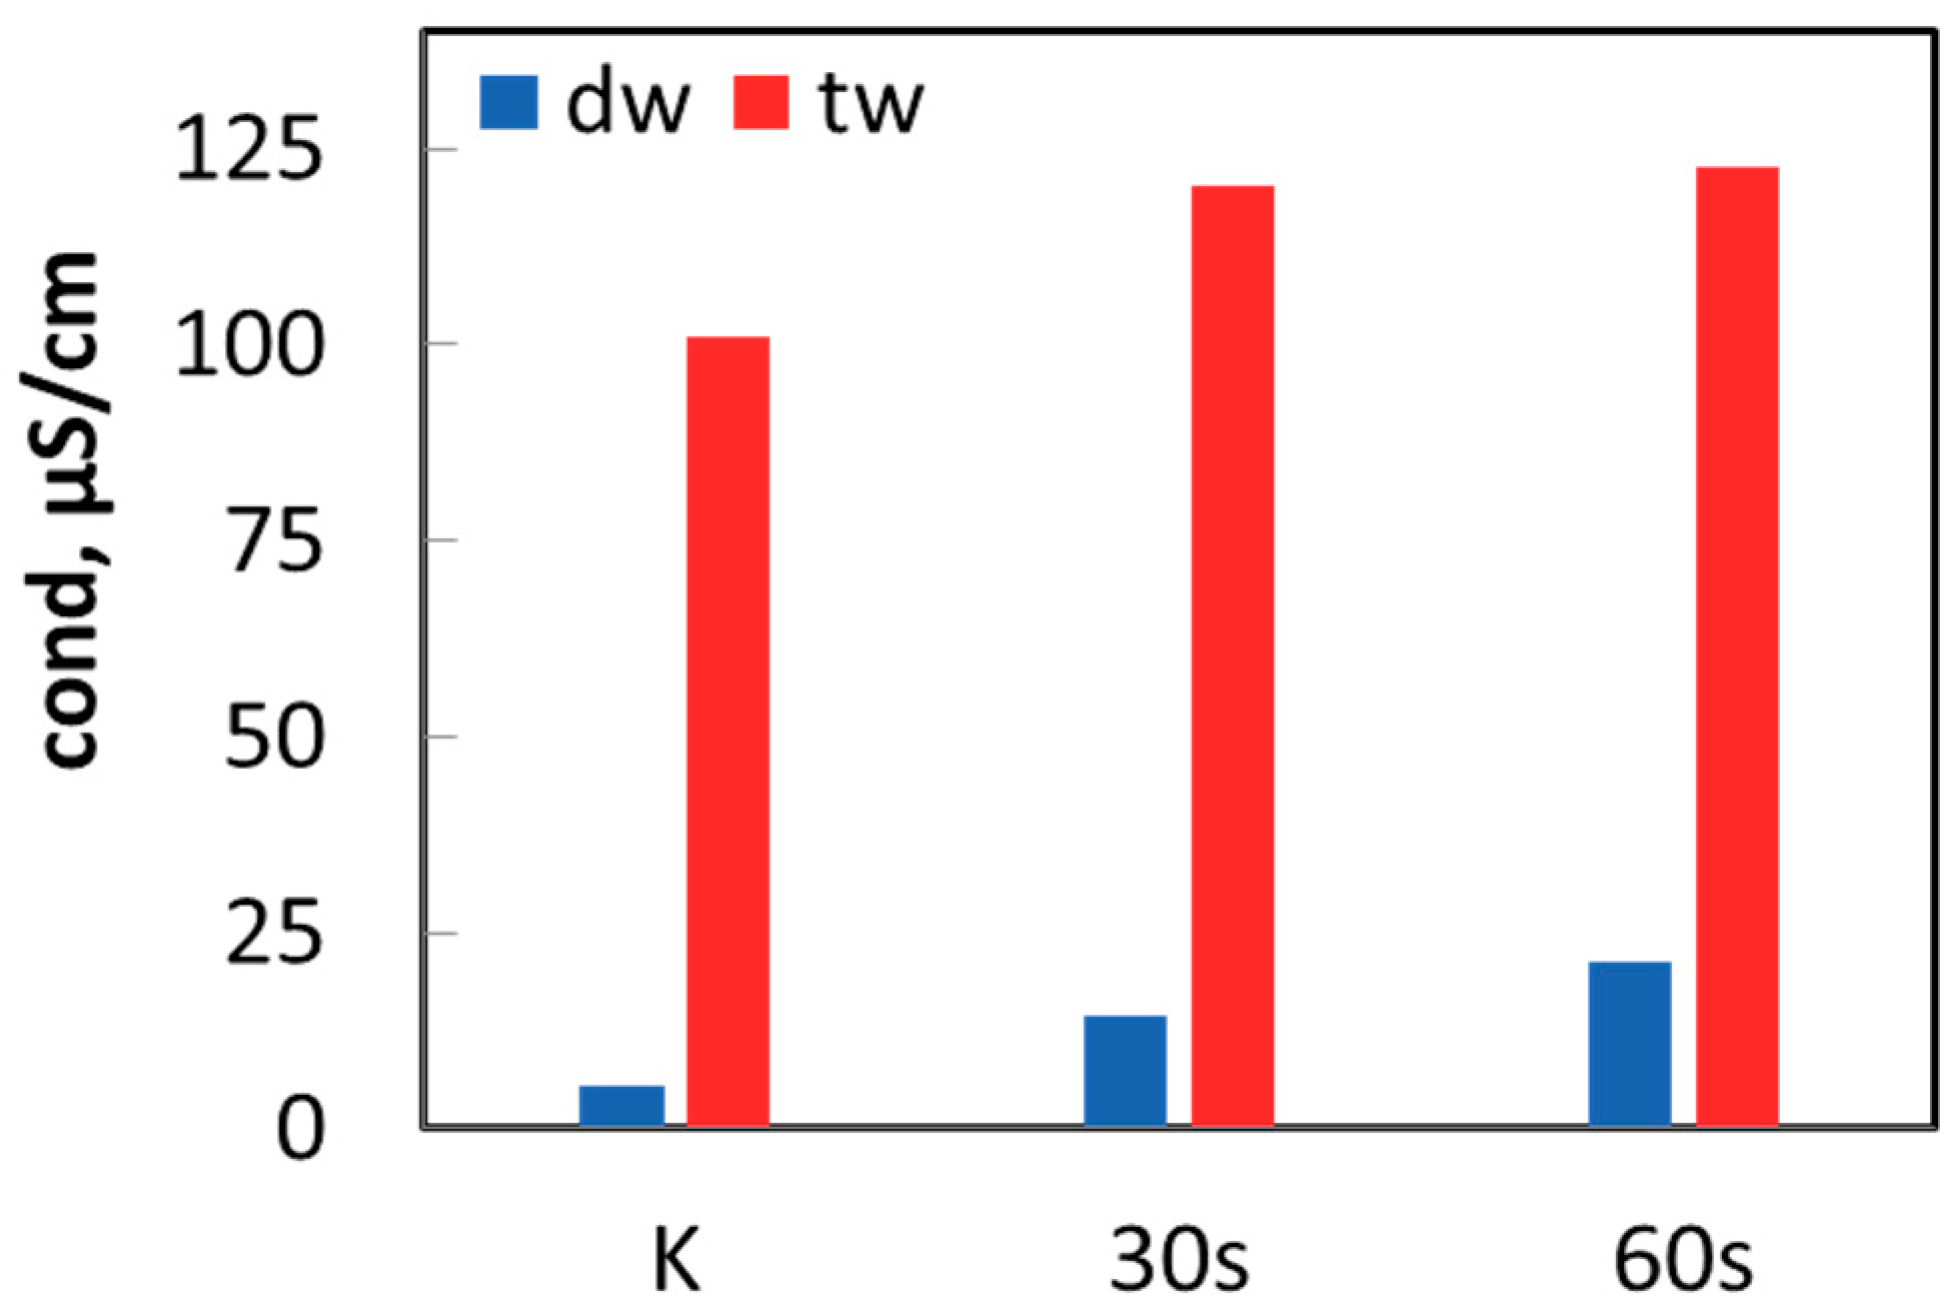
3.2. Interaction of Argon Plasma Torch with Water: Modification of Distilled Water Characteristics

How plasma changes the chemical and physical composition of water should be investigated together with the influence of the water’s presence on the plasma. Plasma treatment changes water characteristics such as pH and conductivity as well as the concentration of hydrogen peroxide produced in water. These changes are the result of the interaction of water with a large number of charged and excited particles of plasma [26]. It is observed that this effect depends on the treatment time, the wave power, and the volume of the treated liquid.
Creating hydrogen peroxide and measuring its concentration in plasma-treated fluids is extremely important. It is one of the strongest oxidizers capable of non-selective destruction of organic pollutants (that are usually difficult to remove) and inactivating bacteria. This is the reason why it has an important place in many biomedical and environmental applications.
The characteristic concentration of hydrogen peroxide has been studied, and it was shown that it can be produced in plasma-treated water for a very short treatment time of a few seconds and low input power [17]. In this study, an evaluation was made of the changes in the relative concentration of hydrogen peroxide in different volumes of distilled water treated with plasma under different discharge parameters. The effect of the treatment duration was examined, and the stability of the hydrogen peroxide produced after the treatment was observed.
The treatment was carried out without mixing the water and the plasma torch in contact with the surface of the liquid.
In Figure 14, the characteristic concentration of H2O2 in 4 mL of plasma-treated distilled water is presented for different significantly long treatment times (up to 300 s). The characteristic concentration of H2O2 increases with time.
The concentration of hydrogen peroxide obtained during plasma treatment depends on the treatment time. Also, a significant effect is due to the type of discharge used. The application that the plasma-activated water will be used determines the necessary concentration of H2O2 in the water due to the strong affinity of organics for it. When the water was treated with a microwave discharge and the treatment time was less than 5 min, the concentration of hydrogen peroxide was up to 0.08 mmol/L (Figure 14). The obtained concentration was significantly higher than the concentration obtained with plasma-activated water from other types of discharges reported [41].
Characteristic H2O2 concentrations for different volumes of treated distilled water at fixed treatment time (120 s) have been investigated and are shown in Figure 15. For the investigated volumes, there is an inverse dependence between the volume of the liquid and the hydrogen peroxide concentration. Note that the water surface area of 23.8 cm2 was the same for all volumes, and the water depth increased for volume increase. The total amount of H2O2 produced in the distilled water increased with the increase in the treated volume, which is also presented in Figure 15.
An important aspect when it comes to the application of plasma-treated liquids is the stability of the produced active species after some period of time. The changes in the concentration of H2O2 for a 10 min period after the treatment is presented in Figure 16. It has been observed that for this short time, no significant changes in the concentration have occurred. It is necessary for the active species to have an even longer lifetime when the object that we need to affect cannot be placed in the liquid during the treatment, but only the activated liquid will be used. A slight decrease in the concentrations obtained was observed in the first minutes after the treatment, and this was reported before [41]. Ten minutes after the plasma treatment, an increase in the concentration of hydrogen peroxide was observed in this case. This is in contradiction to the well-known decrease in hydrogen peroxide concentration in plasma-activated water in the period after plasma treatment. Since the observed increase has been obtained repeatedly and systematically when using SWD, a more detailed study of the variations in the concentrations of active particles over a long period of time after the treatment needs to be undertaken.
During the plasma–liquid interaction, the water is modified in such a way that the pH and conductivity change needs to be taken into account. Since the pH of the water is due to the concentration of hydrogen ions (H+) and hydroxyl ions (OH) it may be expected that producing active species in the water during plasma treatment is likely to induce significant changes in the pH. The higher the H+ concentration, the lower the pH, and the higher the OH concentration, the higher the pH.
The investigation of the changes in acidity and conductivity of water after treatment with the surface-wave discharge has been carried out for two types of water—distilled (dw) and tap water (tw).
Initial water parameters before treatment are denoted by K:
Distilled water pH = 5.6 and conductivity < 5 μS/cm;
Tap water pH = 7.7 and conductivity 100.9 μS/cm.
A microwave plasma torch with working conditions of 1 L/min argon flow and wave power 17 W has been used for the treatment of 15 mL of both distilled and tap water. The treatment times chosen were 30 s and 60 s. An increase of up to 6 in the pH of the distilled water after treatment is observed. On the other hand, the pH of the tap water is unchanged (Figure 17a). Any changes in the pH of the water are an important indicator that it is changing chemically.
The increase in the distilled water pH can be explained by the increase in OH concentration. One can see the increase in the OH’s relative intensity in the plasma emission spectrum at the plasma–liquid interface in comparison with the spectrum without water below the plasma torch (Figure 17b).
The conductivity increases for both types of water (Figure 18).

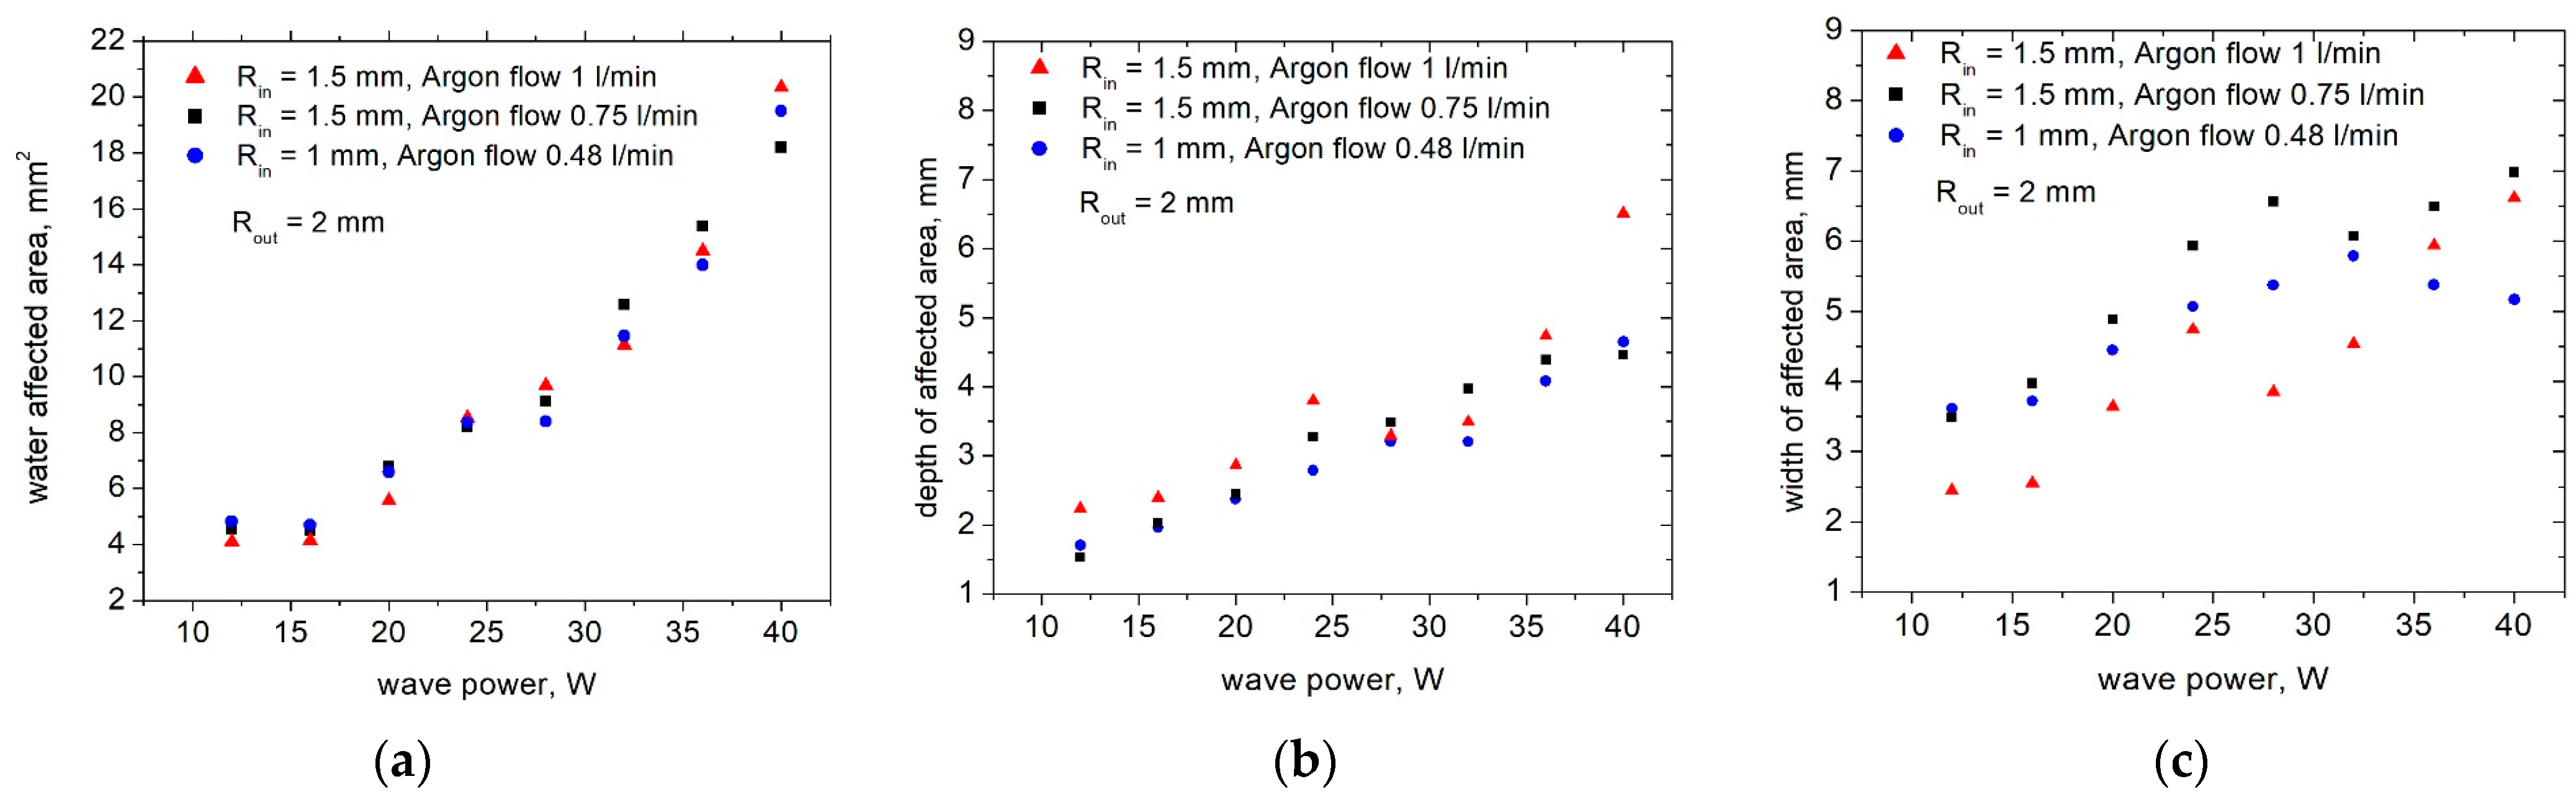
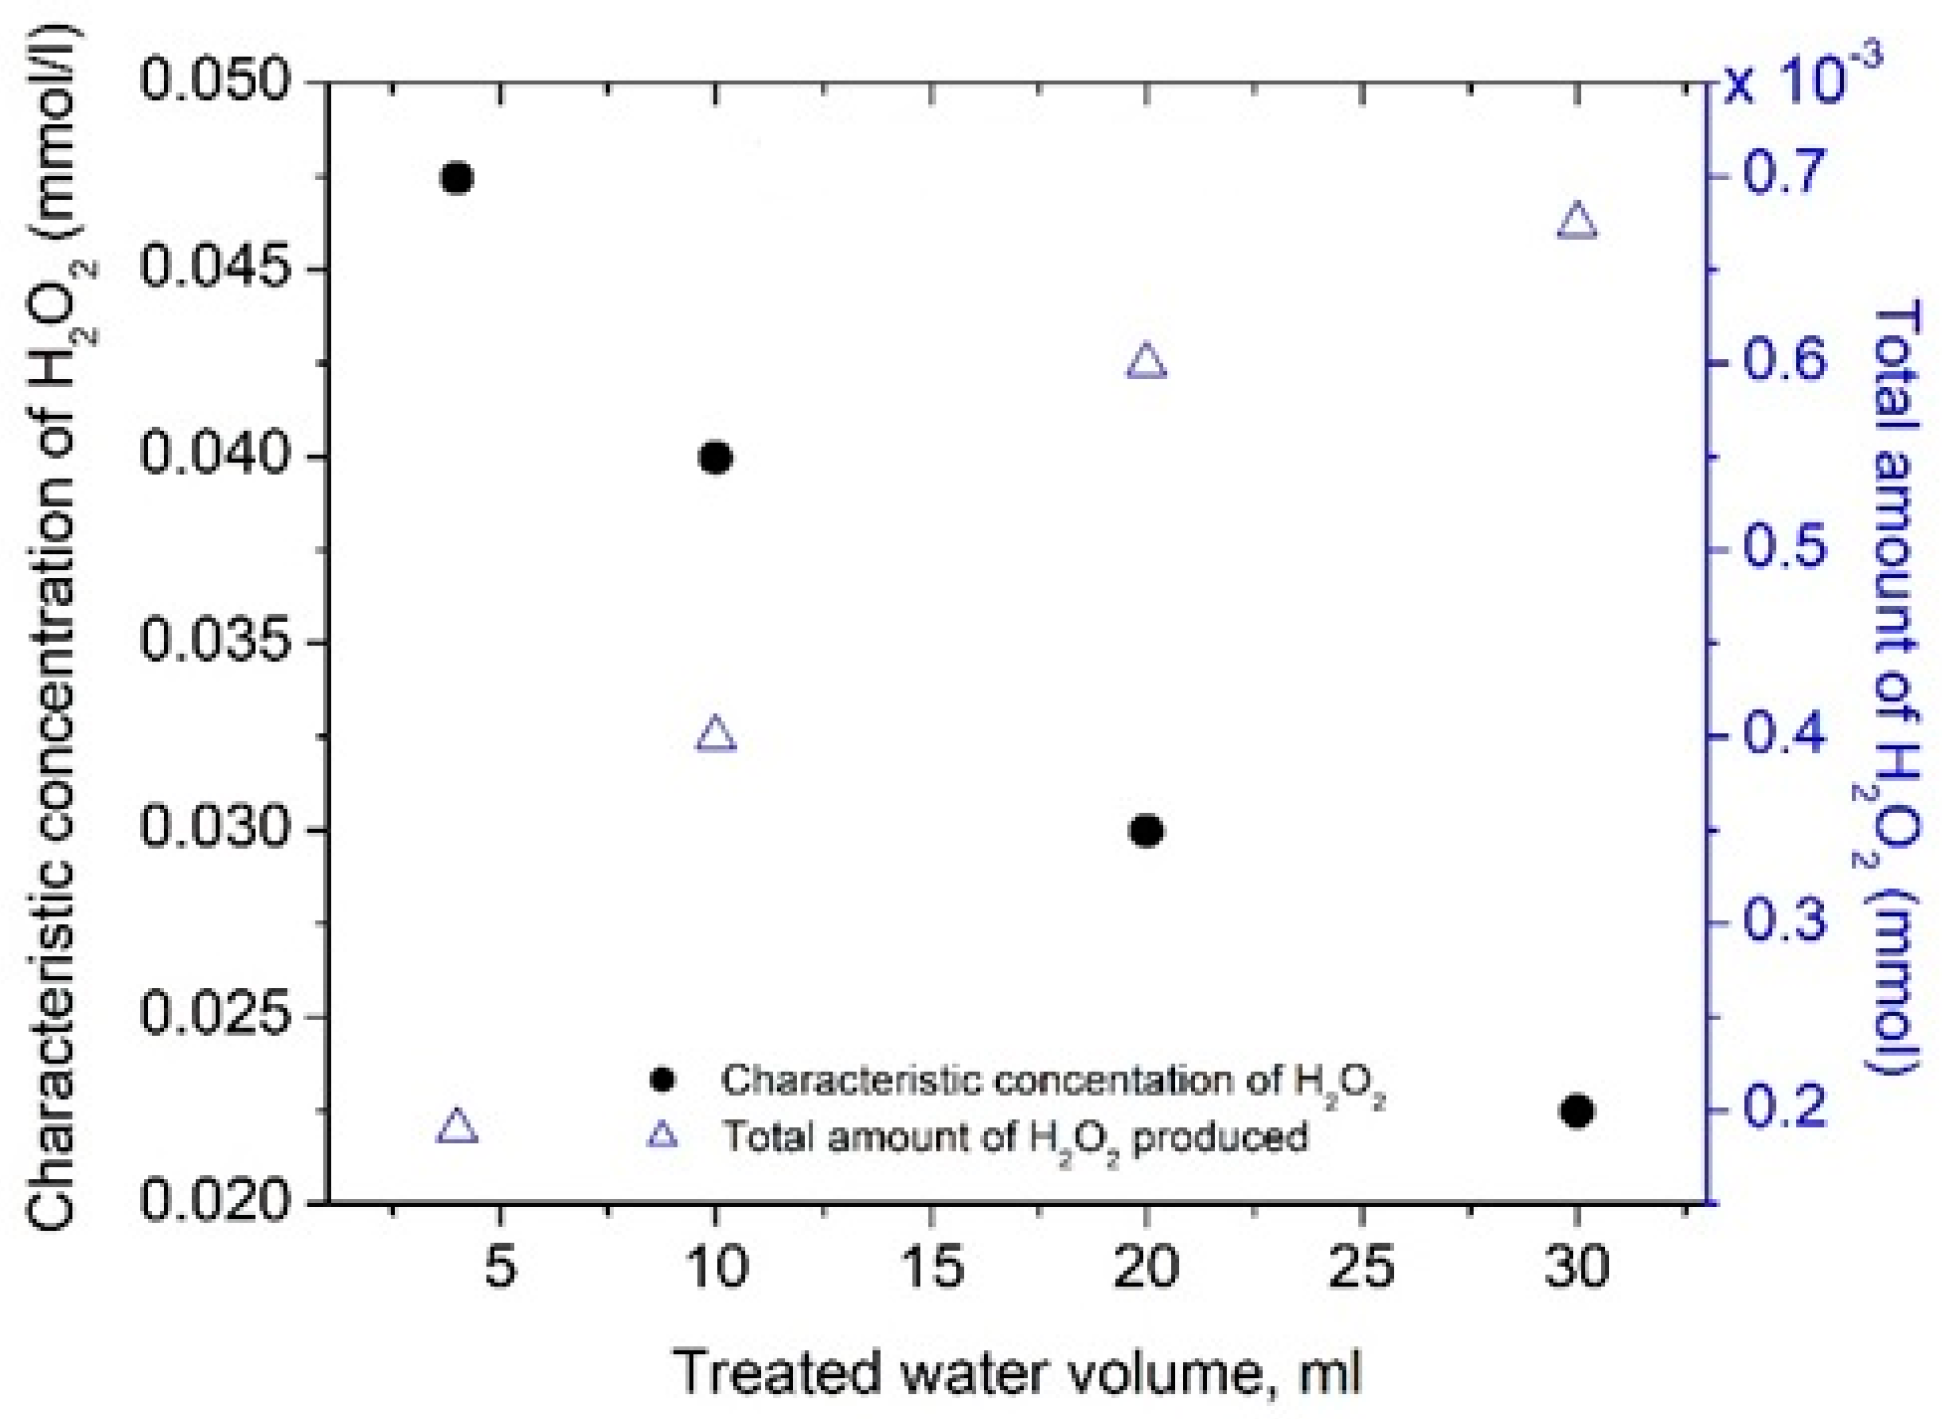
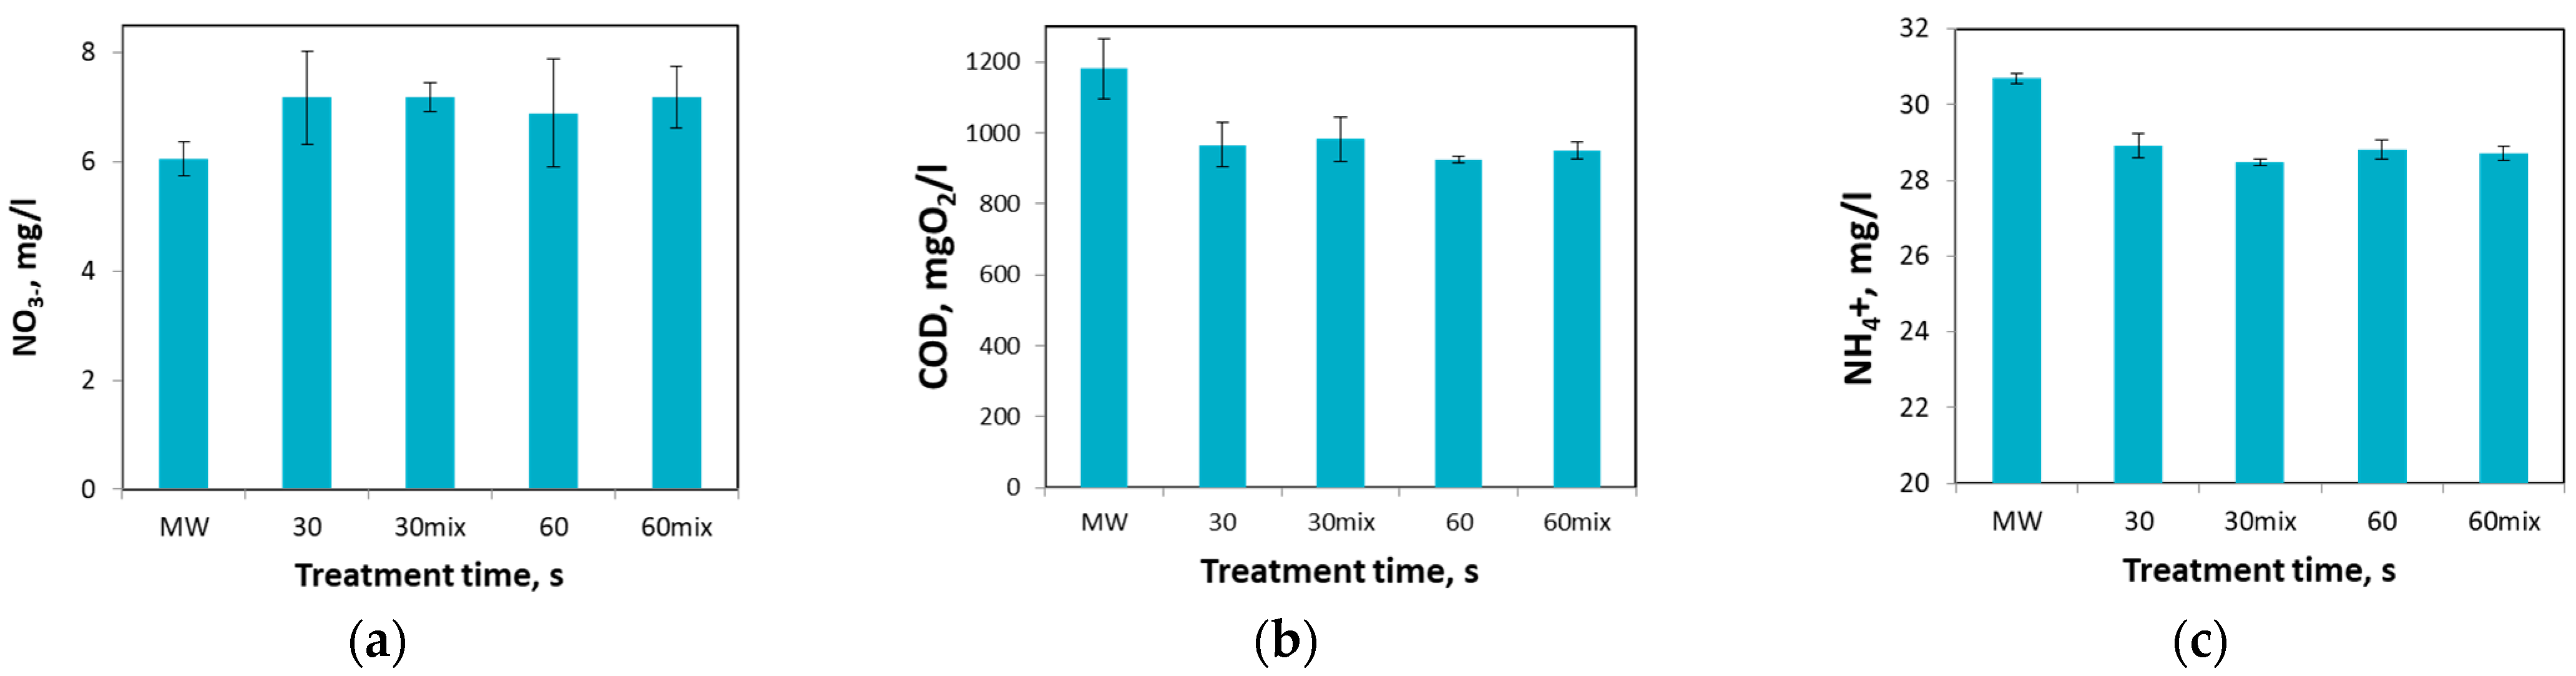
3.3. Surface Wave Sustained Plasma Torch for Model Water Treatment

The possibility for the removal of different contaminants in water during plasma treatment has been actively investigated for the future development of plasma water purification technologies. Plasma treatment of water is able to produce high concentrations of energetic and chemically active species with strong oxidative and destructive effects to many compounds. In addition to H2O2 discussed above, hydroxyl radicals, ozone, and other reactive oxygen and nitrogen species can also be generated and affect the water contaminants.
It this work, SWD treatment has been applied to water containing high concentrations of nitrates, ammonium ions, phosphates, and glucose as model pollutants (Table 1).
The plasma treatment results of this model waters with a significantly increased concentration of pollutants at two treatment times of 30 s and 60 s are shown in Figure 19.
Organics and ammonium are oxidized during the plasma treatment. As a result of this oxidation, chemical oxygen demand, COD (parameter for assessment of water organic content), and ammonium concentrations decreased. The COD concentration decreased by 20% and the NH4+ by 7–10%. Nitrate concentration increased because of ammonium oxidation and probably from the transformation of other reactive nitrogen species. Phosphates undergo no measurable change.
The water conductivity decreases, and the pH of the contaminated water is not affected due to the plasma treatment. As the effects strongly depend on the pollutant’s initial concentration, these studies should be continued to clarify the ongoing processes and mechanisms of pollutant degradation.

4. Conclusions

In this paper, an investigation of the interaction of surface-wave-sustained argon plasma torch with liquids is presented. Two different aspects of this process are taken into account. The study shows the changes in plasma characteristics when the plasma is in interaction with liquid, and also the modification of plasma-treated water.
(i) It has already been discussed that plasma changes its geometrical dimensions in contact with a water surface. From previous studies, it is known that plasma cannot penetrate into the water but can slide on the surface. In this paper, the deformation of the water surface in the form of a concave meniscus is investigated, and the affected water area is measured. The concave meniscus exists at high gas flow only. The depth and the width of the water meniscus for different discharge parameters are presented. The results show a significant increase in the affected area with the increase of the input wave power. The depth of the meniscus created by the plasma torch increases and the curvature also increases with the wave power increasing at the same gas flow rate, while the width, which is the neck of the created “bubble” starts to close. This behavior is different from the case when a neutral gas jet is producing the meniscus.
The plasma column shape and structure observed with fast imaging show that for given discharge parameters, well-visible waves propagate along the plasma torch. In this case, the plasma column is surrounded by water. The meniscus is not purely hemispherical, but some mechanical waves are produced both in the meniscus surface and in the plasma torch by the interaction between the plasma torch (ionized gas with charged particles and electric field) and the liquid surface.
Using emission spectroscopy, the changes in the plasma parameters, such as electron excitation temperature Te and the average rotation temperature Trot, have been investigated. The results show substantial dependences of Trot on the discharge tube wall thickness. Sufficiently higher rotational temperatures are obtained when the plasma is sustained using a thin wall discharge tube in comparison with the thicker wall tube. The experiment data presented shows an increase in the electron excitation temperature at the plasma column end, which is very important for applications since just the end of the plasma torch is in contact with the treated samples. The measurements of these plasma parameters are also performed when the plasma is in contact with water. From the results presented, it is seen that by approaching the water surface towards the end of the plasma column, Te and Trot increase.
(ii) An SWD operating at an atmospheric pressure of 2.45 GHz in argon with different discharge conditions (power, radius, gas flow) is used for water treatment. As a result of plasma–water interaction, the water’s chemical and physical characteristics, such as the water conductivity, pH, and H2O2 concentration, are modified.
It has been observed that the surface-wave-sustained argon plasma torch is able to produce H2O2 in the water at relatively short exposure times. The advantage of this type of discharge is the low operating gas temperature since the H2O2 decomposition is strongly dependent on the temperature.
It is observed that the effect depends on the treatment time, wave power, and volume of the treated liquid. The concentration of hydrogen peroxide when water is treated with a microwave discharge increases when the treatment time increases. The concentration obtained is significantly higher than the concentration obtained with plasma-activated water from other types of reported discharges. For the investigated volumes, there is an inverse dependence between the volume of the liquid and the hydrogen peroxide concentration. When the surface area of the treated water has been kept constant, characteristic H2O2 concentrations decrease in higher treated volumes of water.
(iii) The performed SWD treatment of model wastewater shows significant variation in nitrate, ammonium, phosphate, and COD (chemical oxygen demand) concentration as a result of the treatment. These contaminants are affected by the plasma treatment even for a very short treatment time of 30 s and 60 s. As a result of this oxidation, chemical oxygen demand, COD (parameter for assessment of water organic content), and ammonium concentrations decreased. The COD concentration decreased by 20% and the NH4+ by 7–10%. Nitrate concentration increased because of ammonium oxidation and the transformation of other reactive nitrogen species. Phosphates undergo no measurable change.
The surface-wave-sustained plasma torch operating at low power is capable of modifying water properties in a short treatment time and needs to be considered as a sufficient possibility for the degradation of pollutants in water, for the future development of plasma water purification technologies.

Author Contributions

The concept of the paper was proposed during a personal discussion between all authors. The experimental design was proposed by P.M., E.B., Y.T. (Yovana Todorova) and F.K.; experiments were performed by P.M., E.B., F.K., M.Z., Y.T. (Yovana Todorova), T.B. and I.Y. The original draft preparation was carried out by P.M., E.B. and F.K. Writing—review and editing, P.M., E.B., Y.T. (Yana Topalova) and F.K; supervision, E.B. All authors have read and agreed to the published version of the manuscript.

Funding

This research was funded by Grant No. BG05M2OP001-1.002-0019: “Clean Technologies for Sustainable Environment-Waters, Waste, Energy for a Circular Economy”, financed by the Science and Education for Smart Growth Operational Program (2014–2020) and co-financed by the EU through the European structural and investment fund. This research was supported by CEEPUS III network “CIII-AT-0063-01-0506—Applications and diagnostics of electric plasmas”.

Data Availability Statement

The data that support the presented results of this study are available from the corresponding author upon reasonable request.

Acknowledgments

The authors are thankful to Lukas Dostal for his valuable help with ultra-fast camera recordings.

Conflicts of Interest

The authors declare no conflict of interest. The funders had no role in the design of the study; in the collection, analyses, or interpretation of data; in the writing of the manuscript, or in the decision to publish the results.

References

  1. Goriachev, V.L.; Kulishevich, A.I.; Ufimtsev, A.A.; Rutberg, P.G. Electrophysical Properties of Impulse Discharges of Low Power in Water and their use in Ecology. In Progress in Plasma Processingof Materials; Begell House: Danburry, CT, USA, 2001; pp. 827–832. [Google Scholar]
  2. Locke, B.R.; Sato, M.; Šunka, P.; Hoffmann, M.R.; Chang, J.S. Electrohydraulic discharge and nonthermal plasma for water treatment. Industr. Eng. Chem. Res. 2006, 45, 892–905. [Google Scholar] [CrossRef]
  3. Graves, D. Low temperature plasma biomedicine: A tutorial review. Phys. Plasmas 2014, 21, 080901. [Google Scholar] [CrossRef]
  4. Graves, D.B. Mechanisms of plasma medicine: Coupling plasma physics, biochemistry, and biology. IEEE Trans. Radiat. Plasma Med. Sci. 2017, 1, 281. [Google Scholar] [CrossRef]
  5. Haertel, B.; von Woedtke, T.; Weltmann, K.D.; Lindequist, U. Non-thermal atmospheric-pressure plasma possible application in wound healing. Biomolec. Therap. 2014, 22, 477–490. [Google Scholar] [CrossRef] [PubMed]
  6. Puac, N.; Gherardi, M.; Shiratani, M. Plasma agriculture: A rapidly emerging field. Plasma Process Polym. 2018, 15, e1700174. [Google Scholar] [CrossRef]
  7. Attri, P.; Ishikawa, K.; Okumura, T.; Koga, K.; Shiratani, M. Plasma Agriculture from Laboratory to Farm: A Review. Processes 2020, 8, 1002. [Google Scholar] [CrossRef]
  8. Takeuchi, N.; Yasuoka, K. Review of plasma-based water treatment technologies for the decomposition of persistent organic compounds. Jpn. J. Appl. Phys. 2020, 60, SA0801. [Google Scholar] [CrossRef]
  9. Matějka, F.; Galář, P.; Khun, J.; Scholtz, V.; Kůsová, K. Mechanisms leading to plasma activated water high in nitrogen oxides. Phys. Scr. 2023, 98, 045619. [Google Scholar] [CrossRef]
  10. Tulková, T.; Fučík, J.; Kozáková, Z.; Procházková, P.; Krčma, F.; Gargošová, H.Z.; Mravcová, L.; Sovová, K. Impact of various oxidation processes used for removal of sulfamethoxazole on the quality of treated wastewater. Emerg. Contam. 2023, 9, 100231. [Google Scholar] [CrossRef]
  11. Zambon, Y.; Contaldo, N.; Laurita, R.; Várallyay, E.; Canel, A.; Gherardi, M.; Colombo, V.; Bertaccini, A. Plasma activated water triggers plant defence responses. Sci. Rep. 2020, 10, 19211. [Google Scholar] [CrossRef]
  12. Kutasi, K.; Popovic, D.; Krstulovic, N.; Milosevic, S. Tuning the composition of plasma-activated water by a surface-wave microwave discharge and a kHz plasma jet. Plasma Sourc. Sci. Technol. 2019, 28, 095010. [Google Scholar] [CrossRef]
  13. Weihe, T.; Schnabel, U.; Andrasch, M.; Stachowiak, J.; Tübbecke, F.; Ehlbeck, J. A Plasma-Based Decontamination Process Reveals Potential for an in-Process Surface-Sanitation Method. Plasma 2022, 5, 351–365. [Google Scholar] [CrossRef]
  14. Todorova, Y.; Benova, E.; Marinova, P.; Yotinov, I.; Bogdanov, T.; Topalova, Y. Non-Thermal Atmospheric Plasma for Microbial Decontamination and Removal of Hazardous Chemicals: An Overview in the Circular Economy Context with Data for Test Applications of Microwave Plasma Torch. Processes 2022, 10, 554. [Google Scholar] [CrossRef]
  15. Mai-Prochnow, A.; Clauson, M.; Hong, J.; Murphy, A.B. Gram positive and Gram negative bacteria differ in their sensitivity to cold plasma. Sci. Rep. 2016, 6, 38610. [Google Scholar] [CrossRef] [PubMed]
  16. Wang, S.; Xu, D.; Qi, M.; Li, B.; Peng, S.; Li, Q.; Zhang, H.; Liu, D. Plasma-Activated Water Promotes Wound Healing by Regulating Inflammatory Responses. Biophysica 2021, 1, 297–310. [Google Scholar] [CrossRef]
  17. Adamovich, I.; Baalrud, S.D.; Bogaerts, A.; Bruggeman, P.J.; Cappelli, M.; Colombo, V.; Czarnetzki, U.; Ebert, U.; Eden, J.G.; Favia, P.; et al. The 2017 Plasma Roadmap: Low temperature plasma science and technology. J. Phys. D Appl. Phys. 2017, 50, 323001. [Google Scholar] [CrossRef]
  18. Belmonte, T.; Cardoso, R.P.; Nöel, C.; Henrion, G.; Kosior, F. Microwave plasmas at atmospheric pressure: Theoretical insight and applications in surface treatment. Eur. Phys. J. Appl. Phys. 2008, 42, 41–46. [Google Scholar] [CrossRef]
  19. Yu, A.L. Microwave discharges: Generation and diagnostics. J. Phys. Conf. Ser. 2010, 257, 012016. [Google Scholar]
  20. Bruggeman, P.; Iza, F.; Brandenburg, R. Foundations of atmospheric pressure non-equilibrium plasmas. Plasma Sources Sci. Technol. 2017, 26, 123002. [Google Scholar] [CrossRef]
  21. Chen, C.-J.; Li, S.-Z.; Wu, Y.; Zhang, J. Investigation of role of the discharge tube in pulse modulated surface-wave argon plasma column at atmospheric pressure by optical emission spectroscopy. Phys. Plasmas 2019, 26, 053506. [Google Scholar] [CrossRef]
  22. Gadonna, K.; Leroy, O.; Silva, T.; Leprince, P.; Boisse-Laporte, C.; Alves, L.L. Hydrodynamic study of a microwave plasma torch. Eur. Phys. J. Appl. Phys. 2011, 56, 24008. [Google Scholar] [CrossRef]
  23. Sainz, A.; Margot, J.; Garcia, M.C.; Calzada, M.D. Role of dissociative recombination in the excitation kinetics of an argon microwave plasma at atmospheric pressure. J. Appl. Phys. 2005, 97, 113305. [Google Scholar] [CrossRef]
  24. Benova, E.; Marinova, P.; Tafradjiiska-Hadjiolova, R.; Sabit, Z.; Bakalov, D.; Valchev, N.; Traikov, L.; Hikov, T.; Tsonev, I.; Bogdanov, T. Characteristics of 2.45 GHz Surface-Wave-Sustained Argon Discharge for Bio-Medical Applications. Appl. Sci. 2022, 12, 969. [Google Scholar] [CrossRef]
  25. Benova, E.; Atanasova, M.; Bogdanov, T.; Marinova, P.; Krcma, F.; Mazankova, V.; Dostal, L. Microwave plasma torch at water surface. Plasma Med. 2016, 6, 59. [Google Scholar] [CrossRef]
  26. Bruggeman, P.; Kushner, M.J.; Locke, B.R.; Gardeniers, J.G.E.; Graham, W.G.; Graves, D.B.; Hofman-Caris, R.C.H.M.; Maric, D.; Reid, J.P.; Ceriani, E.; et al. Plasma–liquid interactions: A review and roadmap. Plasma Sources Sci. Technol. 2016, 25, 053002. [Google Scholar] [CrossRef]
  27. Marinova, P.; Benova, E.; Todorova, Y.; Topalova, Y.; Yotinov, I.; Atanasova, M.; Krcma, F. Surface-wave-sustained plasma torch for water treatment. J. Phys. Conf. Ser. 2018, 982, 012009. [Google Scholar] [CrossRef]
  28. Moisan, M.; Beaudry, C.; Leprince, P. A New HF Device for the Production of Long Plasma Columns at a High Electron Density. Phys. Lett. 1974, 50, 125. [Google Scholar] [CrossRef]
  29. Moisan, M.; Zakrzewski, Z.; Pantel, R. The theory and characteristics of an efficient surface wave launcher (surfatron) producing long plasma columns. J. Phys. D Appl. Phys. 1979, 12, 219. [Google Scholar] [CrossRef]
  30. Moisan, M.; Nowakowska, H. Contribution of surface-wave (SW) sustained plasma columns to the modeling of RF and microwave discharges with new insight into some of their features. A survey of other types of SW discharges. Plasma Sources Sci. Technol. 2018, 27, 073001. [Google Scholar] [CrossRef]
  31. Bruggeman, P.; Schram, D.C.; Kong, M.G.; Leys, C. Is the rotational temperature of OH(A-X) for discharges in and in contact with liquids a good diagnostic for determining the gas temperature? Plasma Proc. Polym. 2009, 6, 751. [Google Scholar] [CrossRef]
  32. Kramida, A.; Ralchenko Yu Reader, J.; NIST ASD Team. NIST Atomic Spectra Database (Ver. 5.5.3); National Institute of Standards and Technology: Gaithersburg, MD, USA, 2018. Available online: https://physics.nist.gov/asd (accessed on 31 March 2018).
  33. Krčma, F.; Tsonev, I.; Smejkalová, K.; Truchlá, D.; Kozáková, Z.; Zhekova, M.; Marinova, P.; Bogdanov, T.; Benova, E. Microwave micro torch generated in argon based mixtures for biomedical applications. J. Phys. D Appl. Phys. 2018, 51, 414001. [Google Scholar] [CrossRef]
  34. Locke, B.R.; Shih, K.-Y. Review of the methods to form hydrogen peroxide in electrical discharge plasma with liquid water. Plasma Sources Sci. Technol. 2011, 20, 034006. [Google Scholar] [CrossRef]
  35. Barkhudarov, E.; Kossyi, I.A.; Christofi, N.; Misakyan, M. Microwave plasma-chemical reactor based on plasma jet interaction with water. In Proceedings of the 10th International Workshop on Microwave Discharges: Fundamental and Applications, Zvenigorod, Russia, 3–7 September 2018. [Google Scholar]
  36. Park, S.; Choe, W.; Lee, H.; Park, J.Y.; Kim, J.; Moon, S.Y.; Cvelbar, U. Stabilization of liquid instabilities with ionized gas jets. Nature 2021, 592, 49–53. [Google Scholar] [CrossRef] [PubMed]
  37. Bonch-Bruevich, A.M.; Libenson, M.N.; Makin, V.S.; Trubaev, V.V. Surface electromagnetic waves in optics. Opt. Eng. 1992, 31, 718–730. [Google Scholar] [CrossRef]
  38. Libenson, M.N.; Makin, V.S.; Shiryaev, V.A.; Soileau, M.J. Surface periodic structures under the optical damage of transparent dielectrics. In Laser-Induced Damage in Optical Materials: 1994; SPIE: Bellingham, WA, USA, 1995; Volume 2428, pp. 676–681. [Google Scholar] [CrossRef]
  39. Benova, E.; Marinova, P.; Atanasova, M.; Petrova, T. Surface-wave-sustained argon plasma kinetics from intermediate to atmospheric pressure. J. Phys. D Appl. Phys. 2018, 51, 474004. [Google Scholar] [CrossRef]
  40. Bruggeman, P.; Schram, D.; González, M.Á.; Rego, R.; Kong, M.G.; Leys, C. Characterization of a direct dc-excited discharge in water by optical emission spectroscopy. Plasma Sources Sci. Technol. 2009, 18, 025017. [Google Scholar] [CrossRef]
  41. Lukes, P.; Dolezalova, E.; Sisrova, I.; Clupek, M. Aqueous-phase chemistry and bactericidal effects from an air discharge plasma in contact with water: Evidence for the formation of peroxynitrite through a pseudo-second-order post-discharge reaction of H2O2 and HNO2. Plasma Sources Sci. Technol. 2014, 23, 015019. [Google Scholar] [CrossRef]
Figure 1. Experimental setup of surface-wave-sustained plasma torch at atmospheric pressure.
Processes 11 03313 g001
Figure 2. Surface-wave-sustained plasma torch in air (a) and with water below it (b,c).
Processes 11 03313 g002
Figure 3. Surface-wave-sustained discharge sliding on the water surface (a) and the concave meniscus with its depth and width (b).
Processes 11 03313 g003
Figure 4. Microwave plasma torch at fixed wave power of 20 W in contact with distilled water. Finger-shaped plasma structures sliding on the water surface—left and plasma column in a concave meniscus—right. (a) Rin = 1.5 mm, argon gas flow: 0.4 L/min; (b) Rin = 1.5 mm, argon gas flow: 1.0 L/min; (c) Rin = 1 mm, argon gas flow: 0.2 L/min; (d) Rin = 1 mm, argon gas flow: 0.5 L/min.
Processes 11 03313 g004
Figure 5. Plasma torch form interaction with water in successive frames within 6 ms.
Processes 11 03313 g005
Figure 6. Dependence of the water surface affected (a), depth of the affected water surface (b), and width of the affected water surface by (c), by the plasma torch on the input wave power at different tube diameters and gas flow; error 6%.
Processes 11 03313 g006
Figure 7. Lowest OH (A→X) lines used for calculation of the rotational temperatures using Boltzmann plot methods (a). Plasma rotational temperature for different discharge conditions and wave power 20 W. Thick wall tube Rin = 1 mm, Rout = 3.5 mm and thin wall tube Rin = 1 mm, Rout = 2 mm, error 30 K (b).
Processes 11 03313 g007
Figure 8. Plasma rotational temperature for discharge conditions: thin wall tube Rin = 1 mm, Rout = 2 mm, and different argon flow and wave power.
Processes 11 03313 g008
Figure 9. Rotational temperature at discharge conditions: thick wall tube Rin = 1 mm, Rout = 3.5 mm, argon flow 3.2 L/min, and different wave power; error 30 K.
Processes 11 03313 g009
Figure 10. Dependence of the average rotational temperature on the discharge conditions.
Processes 11 03313 g010
Figure 11. Electron excitation temperature axial profile for discharge conditions: tube Rin = 1 mm, Rout = 3.5 mm, a, argon flow 3.2 L/min, and wave power 20 W.
Processes 11 03313 g011
Figure 12. Scheme of position determination for plasma torch at different distances above the water surface.
Processes 11 03313 g012
Figure 13. Rotational (a) and electron excitation temperature (b) for discharge conditions: thick wall tube Rin = 1 mm, Rout = 3.5 mm and argon flow 3.2 L/min, and different distance between the plasma torch tip and the water surface (error 30 K for the Trot and 0.07 eV for Te).
Processes 11 03313 g013
Figure 14. H2O2 characteristic concentration in 4 mL plasma treated distilled water for different treatment times; wave power 12 W; argon flow 1.4 L/min and discharge tube Rin = 1 mm, Rout = 3.5 mm.
Processes 11 03313 g014
Figure 15. H2O2 characteristic concentration in plasma treated for 120 s distilled water with different volumes; wave power 12 W; argon flow 1.4 L/min and discharge tube Rin = 1 mm, Rout = 3.5 mm.
Processes 11 03313 g015
Figure 16. The H2O2 characteristic concentration stability for 10 min after treatment for different distilled water volume; wave power 12 W; argon flow 1.4 L/min and discharge tube Rin = 1 mm, Rout = 3.5 mm.
Processes 11 03313 g016
Figure 17. (a) pH of distilled and tap water before (K) and after plasma treatment; (b) OH radical emission spectrum without water (dot line) and with distilled water (solid line) below the plasma torch.
Processes 11 03313 g017
Figure 18. Change in conductivity of distilled and tap water after plasma treatment.
Processes 11 03313 g018
Figure 19. Modification in the concentration of pollutants in model waters (nitrate (a), organic content (b), and ammonium (c) for different treatment times, treated volume of contaminated water 15 mL, power 12 W; argon flow 1.4 L/min and discharge tube Rin = 1 mm, Rout = 3.5 mm.
Processes 11 03313 g019
Table 1. Model water concentration of pollutants and parameters.
Pollutants/ParametersValue
Organic content as COD1180.01 mgO2/L
N H 4 + 30.702 mg/L
N O 3 6.050 mg/L
P O 4 3 1.008 mg/L
pH6.4
conductivity3.48 mS/cm
Disclaimer/Publisher’s Note: The statements, opinions and data contained in all publications are solely those of the individual author(s) and contributor(s) and not of MDPI and/or the editor(s). MDPI and/or the editor(s) disclaim responsibility for any injury to people or property resulting from any ideas, methods, instructions or products referred to in the content.

