1. Introduction
A centrifugal pump uses a high-speed rotating impeller to pressurize liquid, then the liquid obtains speed and pressure energy at the impeller outlet and produces negative pressure at the impeller entrance, so as to continuously uptake the liquid. However, if the liquid pressure at the inlet of the impeller is lower than its saturated vapor pressure, the liquid will vaporize, and the cavitation bubble will initiate, develop, and collapse, which results in the cavitation phenomenon. Cavitation causes great harm to the centrifugal pump, which will not only rapidly reduce the flow rate and head of the pump but also cause the impeller, volute, and other parts to be subjected to mechanical denudation, vibration, and noise, which seriously affect the normal operation and service life of the centrifugal pump.
The evolution process and mechanism of cavitation in a centrifugal pump are very important to the optimization of a centrifugal pump’s performance. In recent years, scholars from all over the world have performed a lot of research into the cavitation flow in a centrifugal pump. Ye [
1] observed the cavitation flow in centrifugal pumps under different flow conditions by the visualization method, studied the volume and length of cavitation bubbles under different inlet pressures, and improved the semi-analytical cavitation model. Cui Baoling [
2] studied the flow field in a centrifugal pump by using the numerical simulation method, observed the cavitation flow in the induction channel and impeller channel in a centrifugal pump by using high-speed photography technology, and then analyzed and summarized the characteristics of the development of cavitation bubbles under different degrees of cavitation. Okita [
3] used the DES turbulence model and an improved cavitation model to conduct numerical simulation of unsteady cavitation flow, focusing on the cavitation phenomena of cascade and inductor. At the same time, the gap vortex cavitation and reflux cavitation phenomena were observed by experimental methods, and compared and verified. Wang Dongwei [
4] studied the cavitation flow of a centrifugal pump by combining numerical simulation with an experiment and summarized the law of the development trend of cavitation in an impeller runner along with the cavitation margin. Lu Jiaxing [
5] studied the cavitation characteristics of a centrifugal pump under the condition of low flow by combining numerical simulation with an experiment. The characteristics of the internal flow and the pressure pulsation at the inlet and outlet of the centrifugal pump under different cavitation degrees were obtained. Luo Liang [
6] studied the cavitation flow of a centrifugal pump by combining numerical simulation with experiment and summarized the change in the law of pressure distribution and cavitation bubble distribution in an impeller with a reduction in the cavitation margin. Wei Li [
7] used the modified cavitation model to numerically simulate the cavitation performance of ECWP at different temperatures. The research shows that, as the inlet pressure is reduced, the bubble will expand from the suction face to the pressure surface until the whole impeller channel is blocked, and this process is accompanied by a significant decline in the external characteristics of the pump. At the same time, it was found that the inlet diameter of the pipeline had a great influence on the cavitation performance. Under the condition of a larger blade inlet, the suction resistance of the blade was stronger. Previous studies have demonstrated that cavitation has a great impact on centrifugal pump performance from a macroscopic perspective through either experiments or numerical simulation.
In order to reveal the evolution mechanism of cavitation bubbles in centrifugal pumps and other rotating machinery, researchers began to pay attention to the law of cavitation bubble distribution and size changes. Ye Yanghui [
8] conducted a visual study on the steady-state and rotating cavitation of centrifugal pumps under different flow rates, obtained morphologies of cavitation masses under different cavitation allowances, measured the vibrations of a pump’s body, and analyzed the relationship between the vibrations of a pump’s body and the morphologies of the cavitation masses. Zhang [
9] carried out a visualization experiment by using gas and water as the media through a three-stage pump. The research shows that the average diameter of bubbles increases with the increase in gas content and decreases with the increase in rotational speed. According to the different intake gas content, the flow patterns can be divided into four categories: uniform bubble flow, polymerization bubble flow, balloon flow, and separation flow. Yi [
10] also found that the centrifugal pump efficiency decreases when the inlet bubble diameter increases, whereas the bubble diameter decreases with an increase in rotational speed. Yang Guomin [
11] and Dunmin tested the gas phase movement in a centrifugal pump, and the results showed that, with the increase in gas volume fraction, the bubbles spread from the rear cover plate and non-working face outlet to the front cover plate and working face. When the liquid flow rate is small, the bubbles gather in the pump, and the degree of bubble accumulation becomes light when the liquid flow rate is high. Li Hong [
12] carried out high-speed photography tests on the starting process of a self-priming pump and found that the sizes of bubbles in the impeller were between 0.10 mm and 0.58 mm, and the sizes of retained bubbles at the volute outlet were between 1.5 mm and 1.8 mm. Li Chongqing [
13] studied the variation law of bubble diameter in an impeller of a low, specific-speed centrifugal pump through a visual test and numerical simulation. The results show that, with the increase in air intake, the number of bubbles in the impeller increases, and the diameters of bubbles also increase significantly. With the increase in liquid flow rate, the bubble diameter decreases gradually. The gas phase distribution in each impeller passage is not uniform, and the gas phase volume fraction in the impeller flow’s passage away from the tongue is larger. Zhang Zhongyuan [
14] conducted a comprehensive study on gas–liquid two-phase flow in pumps through numerical simulations, high-speed cameras, and ordinary cameras. By analyzing the images, the pixel area was converted into bubble diameter, revealing that bubbles closer to the volute wall tended to have smaller diameters. This visualization research has shed further light on the cavitation process in rotating machinery. Traditionally, the description of cavitation phenomena in centrifugal pumps mainly focused on the size and distribution of the cavitation region, as well as their changing patterns. However, precise measurement of cavitation bubbles was lacking, and numerical simulations were often based on single spherical cavitation bubbles or cavitation clouds. Recent studies have shown that cavitation bubbles in rotating machinery or shear flow fields are typically ellipsoidal in shape. Researchers discovered that the fully developed axisymmetric super cavitation shape approximates an ellipse and derived the longitudinal section formula for the cavity ellipse [
15]. Experimentally captured longitudinal section planes also exhibit an approximate elliptical shape [
16]. Thanh-Hoang Phan [
17] and Rui Han [
18] investigated the dynamic behavior of coalescing bubbles near a free surface by simultaneously generating two equally sized bubbles beneath the liquid’s free surface. The findings demonstrate that the dynamic behavior of coalescing bubbles differs significantly from that of individual bubbles due to the notable interaction between bubbles and the free surface. Undoubtedly, it is crucial to capture precisely and analyze the shape and evolution process of cavitation bubbles in centrifugal pumps. This is particularly important in describing the cavitation field of rotating machinery.
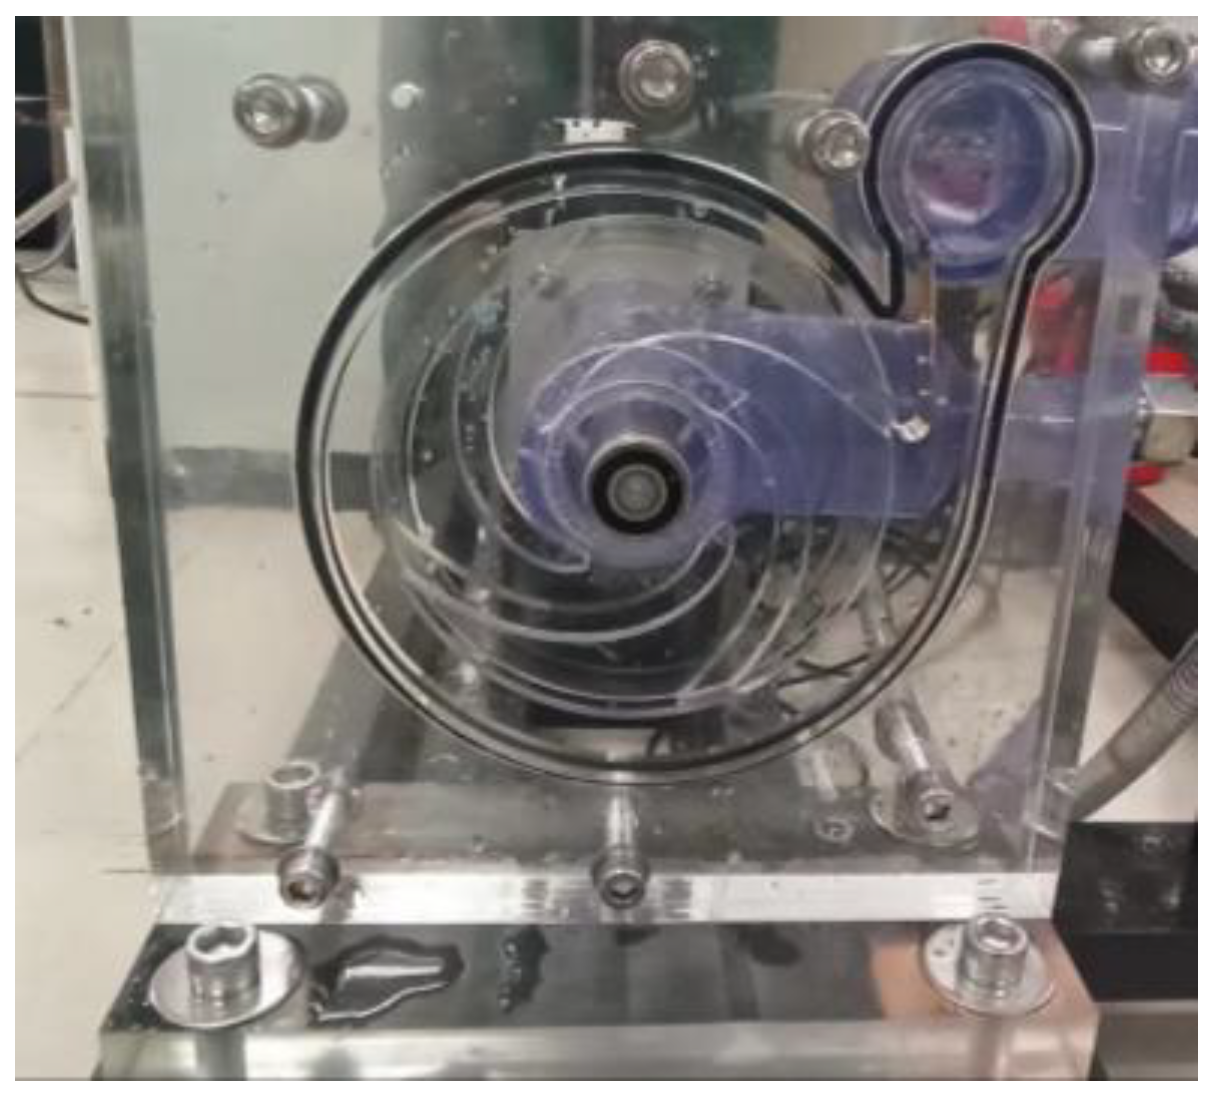
To sum up, this paper presents visual experiments conducted on a centrifugal pump cavitation system. It utilizes image processing methods to extract cavitation bubble characteristics, constructs statistical models, and quantitatively distinguishes different flow patterns and key flow characteristics. This research has great significance in enhancing the theoretical understanding of cavitation flow in centrifugal pumps, accurately describing the evolution of rotating mechanical cavitation bubbles, and advancing the theory of gas-liquid two-phase flow in pumps.
3. Results and Analysis
Besant was the first to study the flow field motion caused by regular spherical bubbles in an infinite fluid domain. Building upon this, Rayleigh developed the cavitation bubble dynamics equation for inviscid fluid. Later, Plesset considered the influence of liquid viscosity and non-condensable gas, extending the equation to viscous incompressible fluid and forming the widely used cavitation bubble dynamics equation, known as the Rayleigh–Plesset equation However, the equation is always limited by the assumption that the shape of cavitation bubbles is perfectly spherical. Experimental results have shown that when cavitation bubbles exist in non-static flow fields, they cannot maintain a completely spherical shape. Therefore, the morphology of cavitation bubbles becomes a crucial aspect of cavitation experiments.
3.1. Analysis of the Evolution Process of Cavitation Bubbles
The development of cavitation bubbles in a centrifugal pump can be divided into several stages: formation, expansion, maturity, rupture, and collapse, as illustrated in
Figure 5. This figure represents the continuous cycle of cavitation bubble development.
Figure 6 demonstrates various cavitation phenomena observed at different cavitation numbers.
In the formation stage, as the liquid passes through the depressurized area in the centrifugal pump, its pressure decreases. When the saturated pressure of the liquid is surpassed, small and dispersed cavitation bubbles begin to form. During the expansion stage, as the fluid continues to flow through the centrifugal pump, the pump’s pressure is further reduced. This leads to the expansion and merging of the cavitation bubbles, creating larger cavitation bubbles. Although the number of cavitation bubbles may decrease at this stage, their volume increases. In the mature stage, the cavitation bubbles within the pump continue to expand until they reach a certain volume. They aggregate and form a relatively stable cavitation region. This area often appears as a cluster or cloud of cavitation bubbles and may even occupy a portion of the pump channel in severe cases. As the cavitation area expands further, it reaches a point where the cavitation bubbles start to rupture due to factors such as shearing forces and turbulence. The rupture of cavitation bubbles generates strong eddy currents and impacts, which adversely affect the performance and operation of the centrifugal pump. Finally, in the collapse stage, when the cavitation bubble bursts, the liquid rapidly fills the cavitation area, restoring it to a liquid state. This process is known as the collapse of the bubble. The collapse generates shocks, significant noise, and in severe cases, it may cause wear and damage.
3.2. Cavitation Bubble Profile Statistics and Analysis under Different Cavitation Numbers
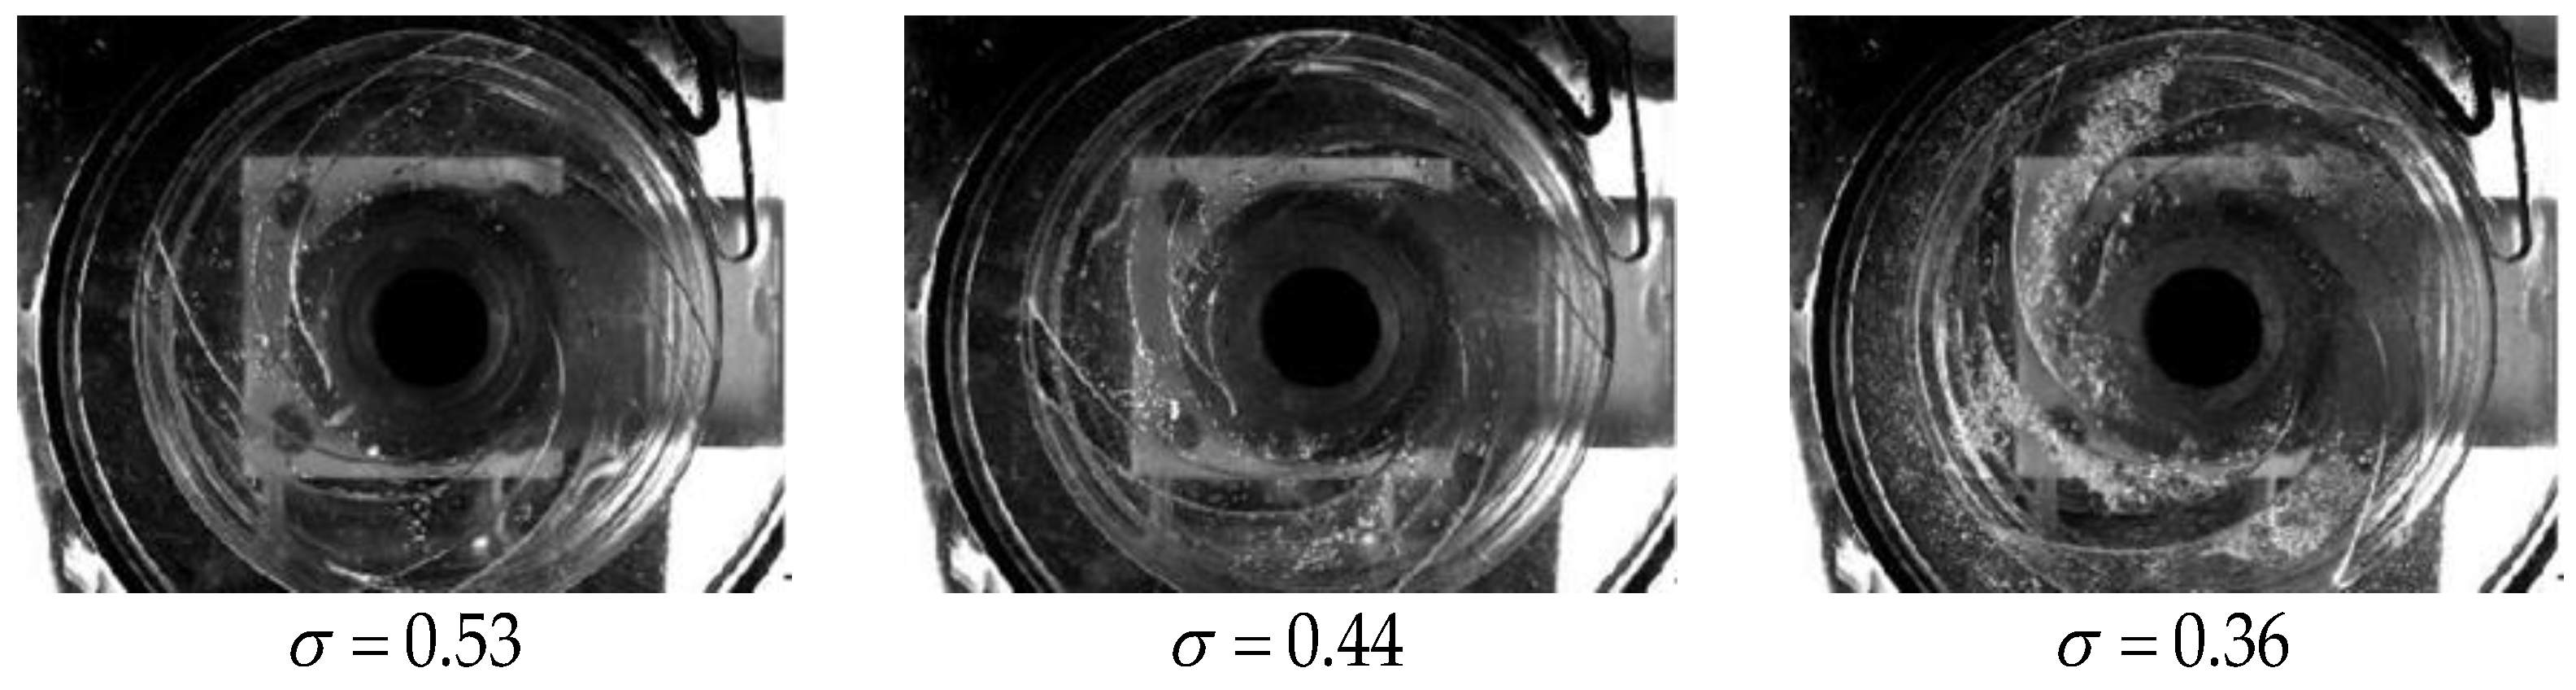
Various experimental phenomena were observed under different cavitation numbers, some of which are illustrated in
Figure 6. As the cavitation number decreases, cavitation first initiates at the suction surface near the blade inlet. At this stage, the gas volume fraction is relatively low, and numerous small bubbles are dispersed within the liquid phase, maintaining significant spacing between them. With further reduction in the cavitation number, the size and length of the cavitation bubbles gradually increase. The flow continuity is disrupted, and the cavitation bubble cluster begins to break apart starting from the rear end. The shed cavitation bubble groups move downstream alongside the main body. During this process, the pressure in the flow channel sequentially increases, leading to the gradual shrinking and collapsing of the cavitation bubbles. When the cavitation number reaches 0.36, the resulting cavitation nearly covers the entire surface of each blade, obstructing the flow passage significantly. It becomes challenging to distinguish clear phase interfaces within the air mass. Isolated bubbles can still be observed at the rear of the air mass, and their shapes are predominantly irregular ovals.
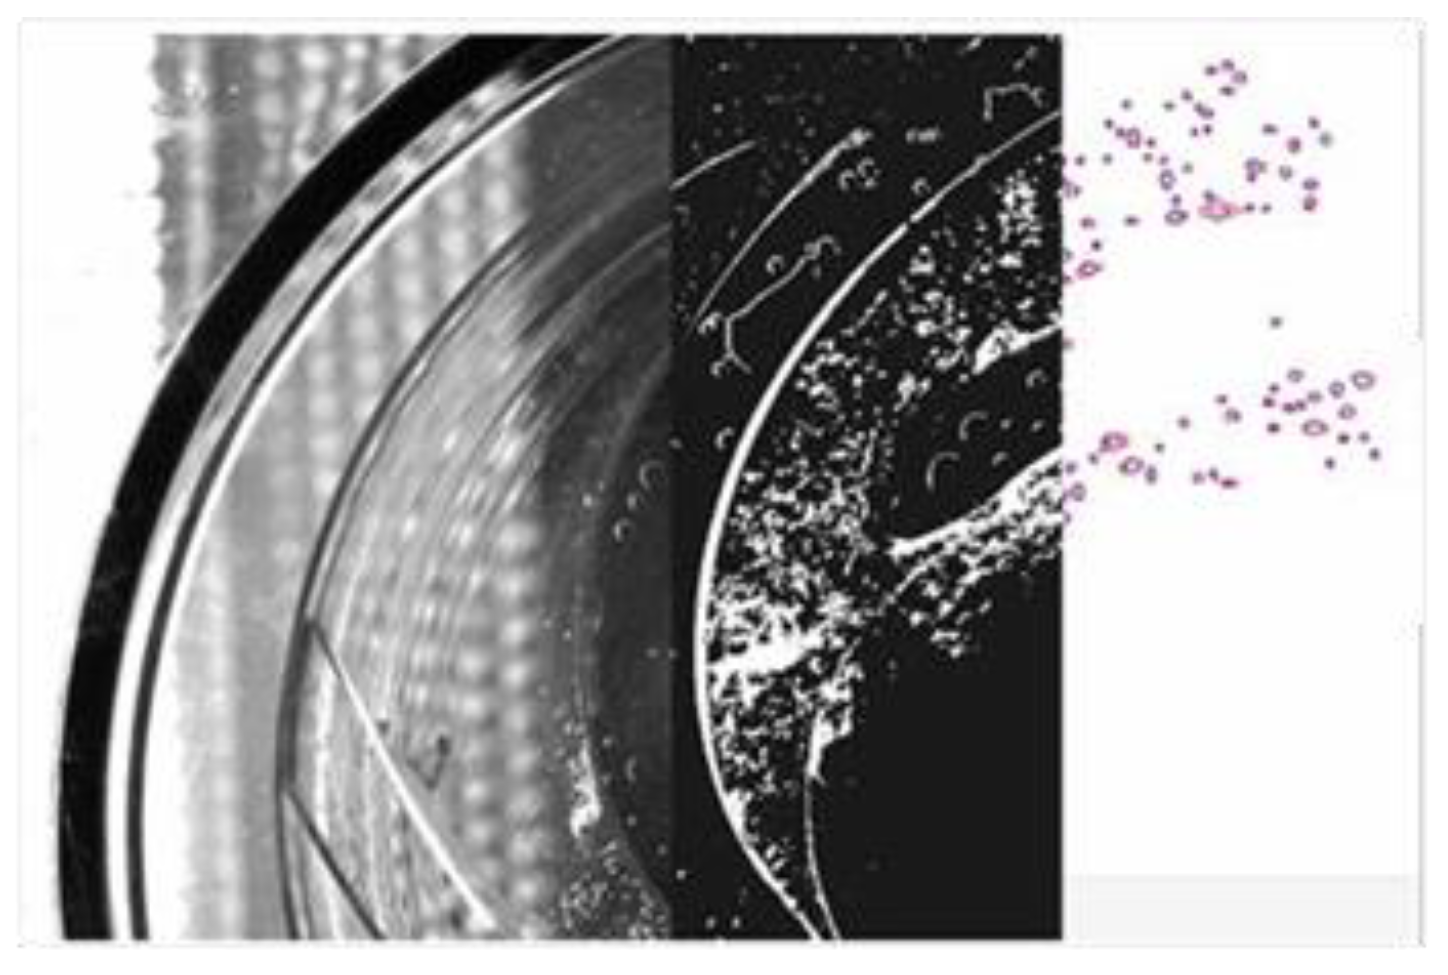
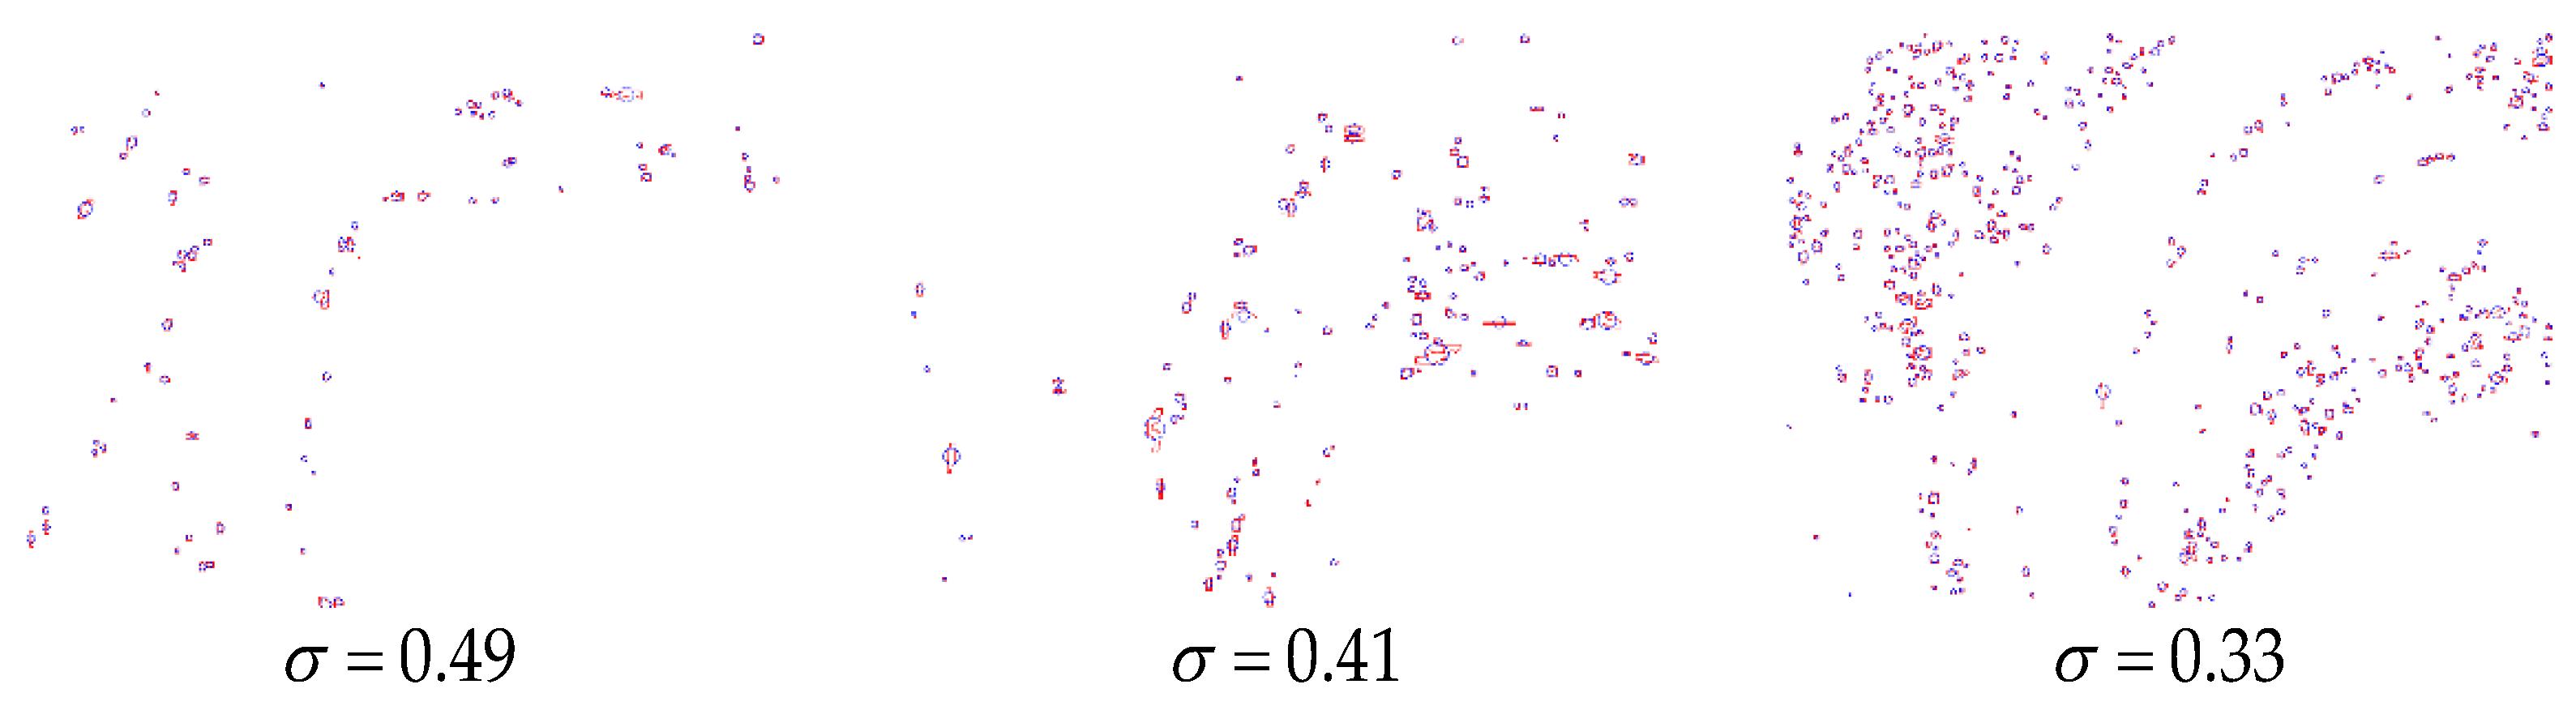
Figure 7 displays the image recognition results of the 1/4 flow field at various cavitation numbers.
Figure 8 provides an enlarged view of the local results. Based on the experimental findings, it is evident that the spherical images cannot sufficiently substitute for the actual experimental results. Consequently, oval shapes were adopted to better depict the characteristics and morphology of the cavitation bubbles. To further analyze the morphology characteristics of the cavitation bubbles, the length–diameter ratio of the bubbles was calculated under different working conditions. The statistical results are shown in
Figure 9.
The rotation of a centrifugal pump generates centrifugal force, which causes the fluid to accelerate outwards. This centrifugal force pushes bubbles towards the centrifugal axis, leading to their separation and gathering. Meanwhile, the surface tension affects the cavitation bubble’s shape, causing it to tend towards a shape with the minimum surface area, usually a spherical or nearly spherical shape. Spherical bubbles have the smallest surface area and experience the least force under the influence of surface tension. In
Figure 9, it can be observed that more than 75% of the total number of cavitation bubbles have a length–diameter ratio between 1 and 2. This is due to the fluid resistance impacting the bubble shape during the flow process. Compared to a spherical shape, ellipsoidal cavitation bubbles have a smaller projected area along the flow direction (with the long axis of the ellipse parallel to the flow line). Consequently, they experience less resistance. In other words, flow resistance promotes the cavitation bubble to have a smaller projected area along the flow direction. Therefore, the shape of a cavitation bubble is determined by the competition between flow resistance and the surface tension acting on the bubble.
3.3. Prediction and Analysis of Average Diameter of Cavitation Bubbles under Different Cavitation Numbers
During the process of cavitation development, the size of the cavitation bubble undergoes changes in response to the flow to a certain extent. The pressure difference, flow rate, temperature, and liquid properties exert an influence on the compression and aggregation of the cavitation bubble in the centrifugal pump. Additionally, as the liquid flows through the impeller, it creates a vortex and a turbulent, criss-cross flow state within the centrifugal pump. This turbulence generates extra kinetic energy, increasing the likelihood of collisions between the cavitation bubble and the surrounding liquid, thereby promoting the fragmentation of the cavitation bubble. Moreover, the cavitation bubble can be deformed and ruptured due to the shear forces between adjacent liquid layers in the flow, causing the gas within the bubble to disperse and rapidly return to the liquid state. Consequently, in centrifugal pump cavitation flow, larger cavitation bubbles tend to break into multiple smaller cavitation bubbles to maintain stability. Therefore, there is a certain relationship between the size of the cavitation bubble and different flow states. Within the field of cavitation bubble dynamics, the primary force acting upon the cavitation bubble is the Weber number, which represents the ratio of inertial force to surface tension:
where
u is the characteristic speed, m/s;
is the characteristic length, m;
is the density of the liquid, kg/m
3;
S is the surface tension, N/m.
The occurrence and severity of cavitation in cavitation flow cavities are evaluated using the dimensionless criterion known as the cavitation number. The cavitation number is expressed as follows:
When the inertial force surpasses the surface tension by a certain extent, meaning that the Weber number exceeds a critical value, cavitation bubbles larger than this critical value will fragment into numerous smaller cavitation bubbles. To investigate the relationship between cavitation and the Weber number, experiments are conducted to determine the correlation between the cavitation number and the Weber number in a centrifugal pump. The characteristic velocity, denoted as
u, is selected as the representative velocity, while the equivalent diameter of the bubble, represented by
d, serves as the characteristic length:
where:
d1 is the blade inlet diameter, m;
d2 is the blade outlet diameter, m;
n is the indicator of speed, RPM.
The effective image captured by the high-speed camera is processed to identify bubbles through bubble recognition algorithms. By applying the same recognition threshold setting, the equivalent diameter of each detected bubble is determined. Using this information, a schematic diagram is generated to visually represent different bubble sizes based on their equivalent bubble diameter.
Figure 10 illustrates the results of equivalent bubble diameter identification under the same working conditions, providing insights into bubble sizes within that specific scenario.
Figure 11, on the other hand, showcases the results of equivalent bubble diameter identification under different working conditions. This comparison allows for a better understanding of how the working conditions impact the size distribution of the bubbles.
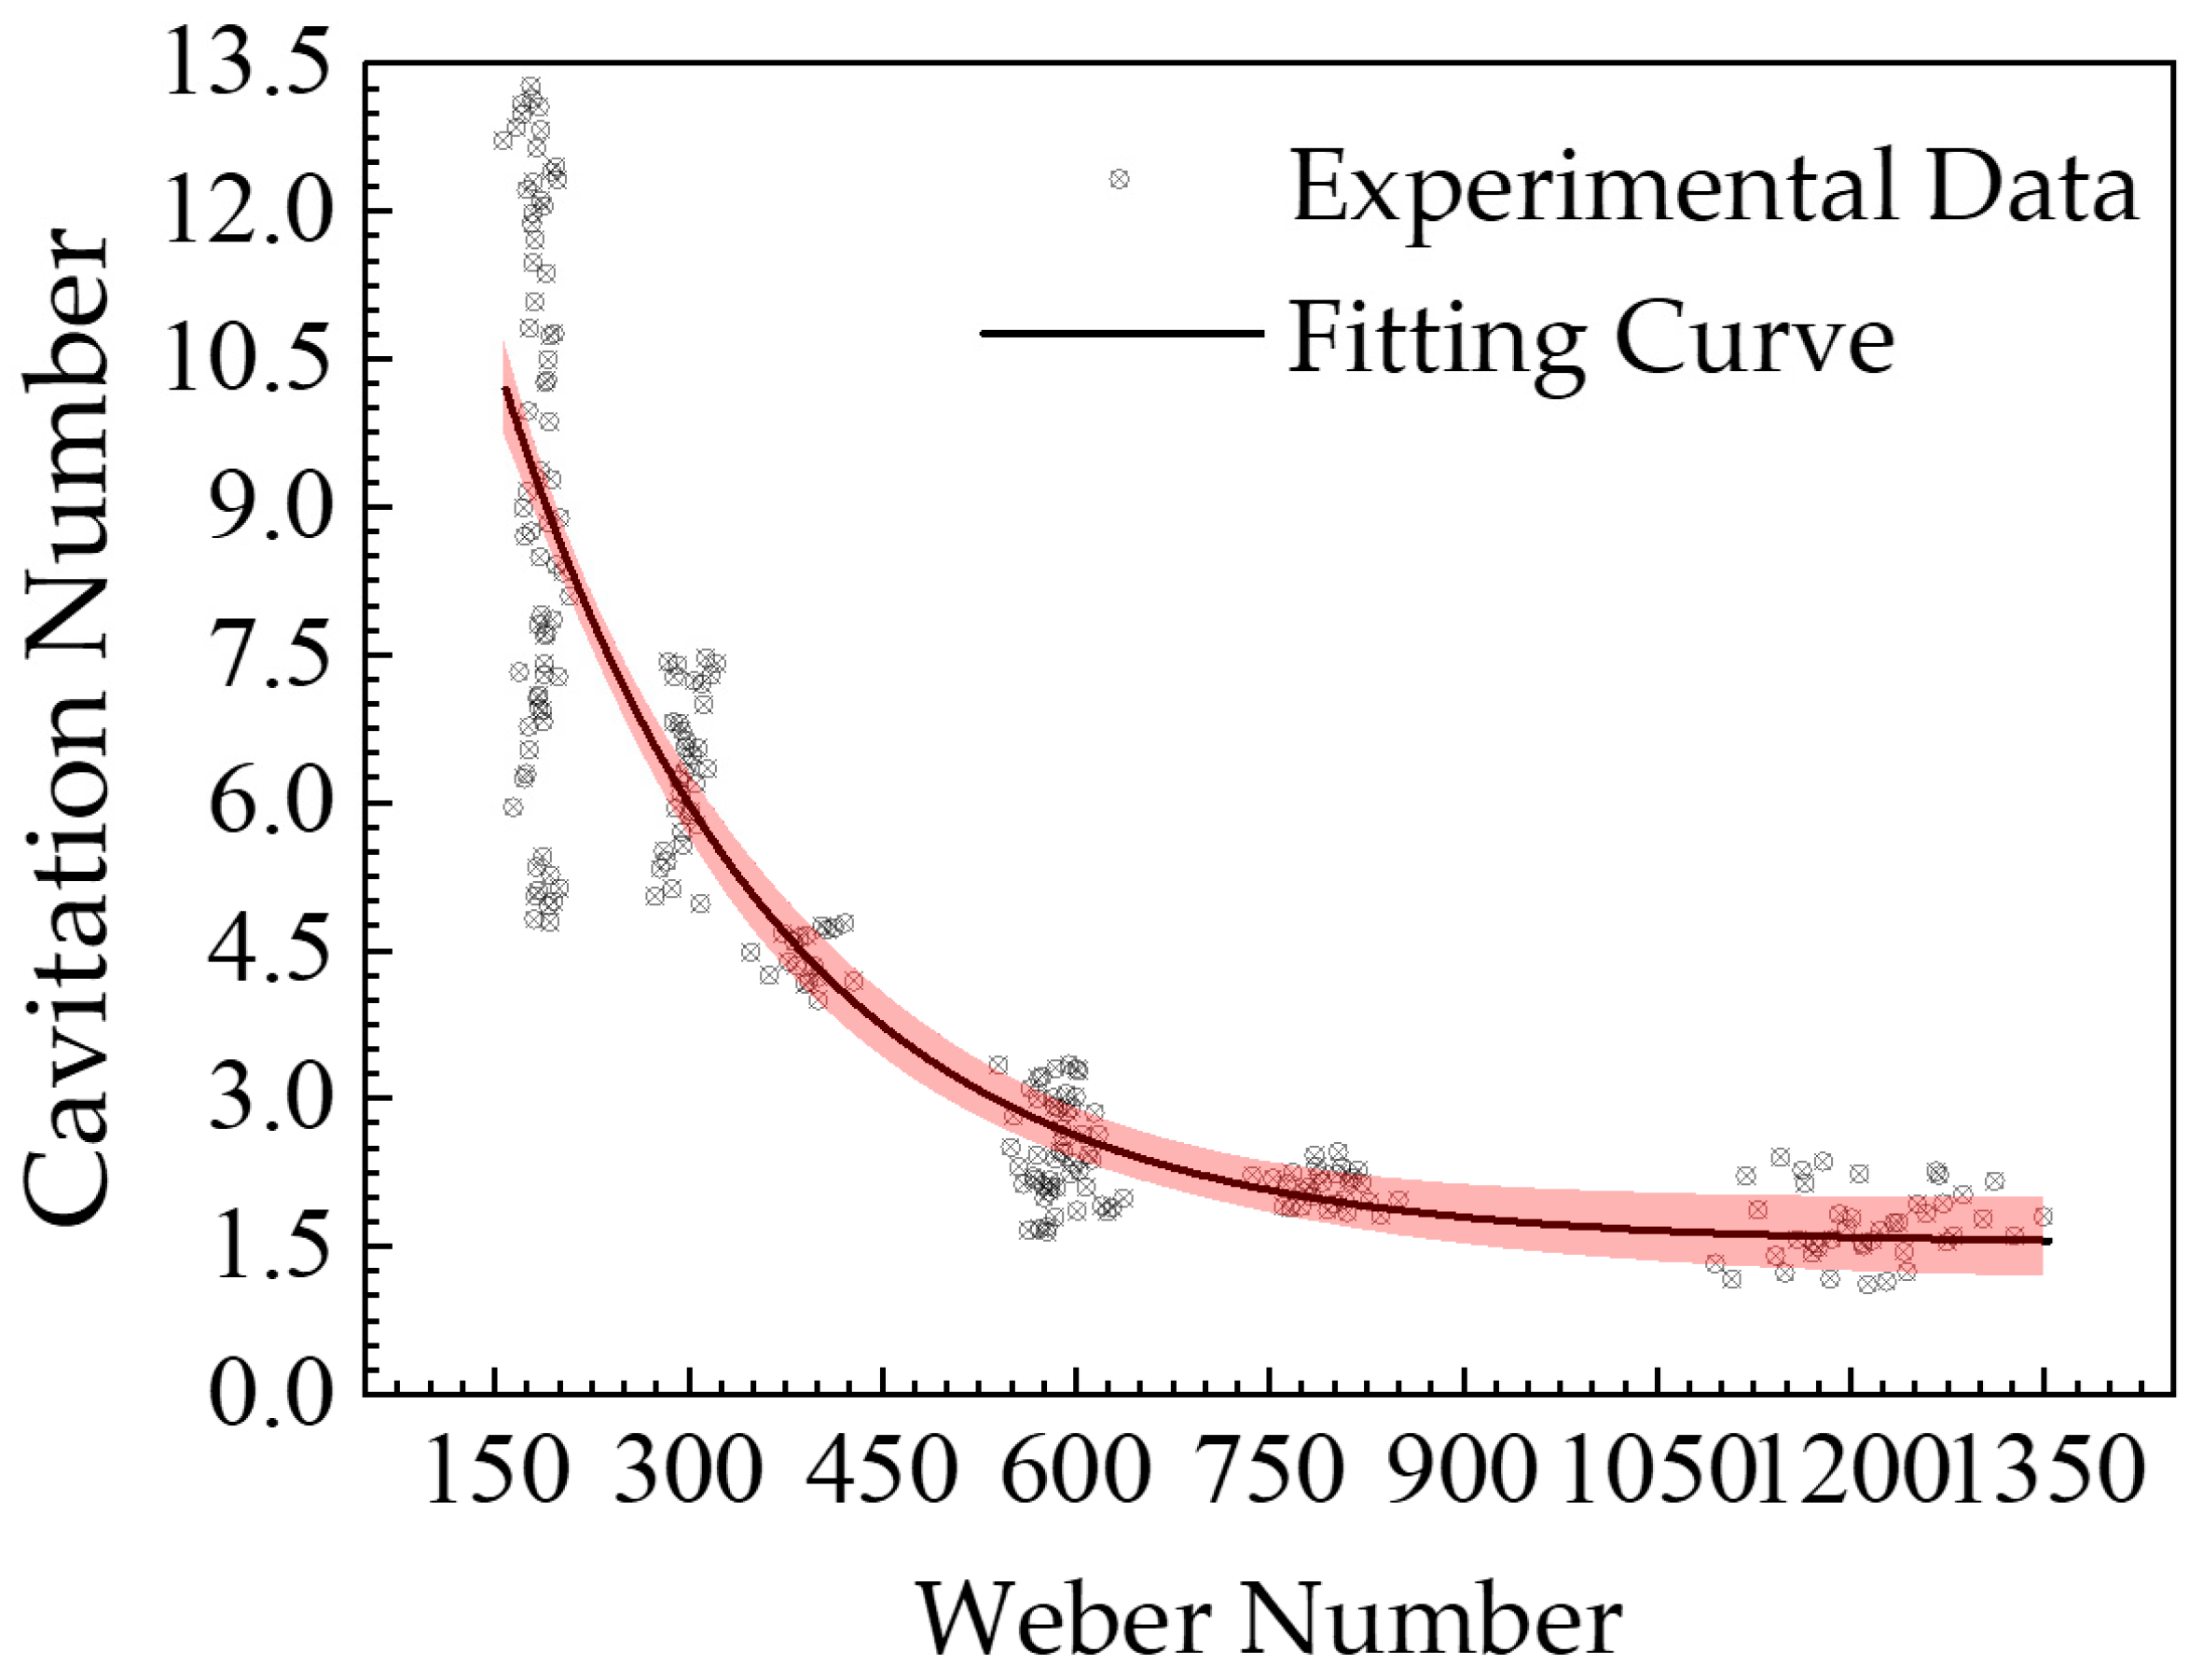
Based on the analysis mentioned above, a significant amount of bubble-related data was collected under various experimental conditions. After processing and analyzing the data, the relationship between the cavitation number and the Weber number in the centrifugal pump was determined.
Figure 12 presents the graphical representation of this relationship, illustrating how the cavitation number corresponds to different Weber number values in the centrifugal pump.
The relationship between
and
We can be obtained by the data fitting method:
where: A = 18.18897;
t = 213.52459;
y0 = 1.52843.
An expression for the average radius of the cavitation bubble can be obtained by the above expression:
When using the formula for evaluation, it should first be determined whether cavitation has occurred in the centrifugal pump. By observing Equation (13), it can be seen that the diameter of the cavitation bubble and the number of the cavitation exhibit the same trend. As the cavitation number decreases, indicating more complex flow in the centrifugal pump, the volume of the cavitation bubble also decreases. In a complex flow field environment, large bubbles are broken down into smaller ones due to turbulence and shear forces. The smaller bubbles are less influenced by the flow due to their small size and lower fluid resistance, making them more stable. Furthermore, small bubbles have a smaller volume and lighter mass, resulting in faster relative motion compared to the surrounding fluid. This relative motion reduces the mass transfer and heat transfer effects between the bubble and the surrounding fluid, hindering bubble growth and fusion. As a result, small bubbles tend to be more stable in this context.


