Abstract
In order to meet different operational requirements, existing low specific speed centrifugal pumps may have to be run at high speeds. Therefore, it is crucial to understand the transient performance of such centrifugal pumps during high speed starting and stopping. However, there are currently no experiments on the starting and stopping of low specific speed centrifugal pumps. In this paper, transient hydraulic performance experiments during starting and stopping had been carried out on an atypical open impeller centrifugal pump with a rated flow rate of 6 m3/h using an updated test rig. The correlation of speed, flow, head and shaft power with time was obtained for four flow ratios of 0.353, 1.022, 1.654 and 2.343 operating conditions. It was found that the fluctuation of the shaft power curve was the strongest during the starting process, and there was a significant impact phenomenon. The corresponding impact shaft power from small to large flow rates were 0.167 kW, 0.409 kW, 0.234 kW and 0.215 kW, and the shaft power impact phenomenon was the most obvious under rated operating conditions. During the stopping process, the speed, flow rate and head all remain stable for a small period of time, and the time required to decrease to 0 is longer than the time required to reach a stable state during starting. During stopping, the shaft power will instantly decrease, accompanied by varying degrees of fluctuations.
1. Introduction
During the transient operation process of startup and stopping a centrifugal pump, the transient flow inside the pump is very complex and has always been a research hotspot. During transient operation, the performance parameters change dramatically, which can adversely affect the stability and reliability of centrifugal pumps and systems, leading to machine damage and even safety accidents [1]. Therefore, an experimental research on the unsteady state operation of high speed centrifugal pumps during startup and stopping is necessary.
In recent years, there have been a large number of scholars abroad conducting research on the transient processes such as startup and stopping of centrifugal pumps and turbines. The research methods include experimental exploration, numerical simulation and theoretical analysis. In 1982, Japanese scholar Tsukamoto et al. [2,3] conducted extreme acceleration startup and stopping experiments on a single stage volute centrifugal pump to explore the differences between transient and quasi steady states under extreme testing conditions. It was found that the main reason for the difference between the two was the pulse pressure and hysteresis formed by the circulation around the blades after comparing the numerical calculation results. In 2016, Issa Chalghoumde et al. [4] adopted a theoretical analysis method to study the transient process inside a centrifugal pump. The reliability of the proposed numerical model in simulating and predicting the transient characteristics of centrifugal pumps was verified by numerically solving partial differential equations using the feature method and combining experimental results. In 2020, Julian et al. [5] explored the transient characteristics during the startup process of a mixed flow turbine through a combination of experiments and numerical simulations. It was found that the reverse rotating vortex in the draft tube can cause high amplitude pressure pulsation of the guide vanes during the startup process, and changing the startup plan can improve the expected life of the blades in the numerical simulation results. In 2017, Emma et al. [6] validated the rationality of the established 3D simulation model in predicting performance under forward rotation, and based on this, combined with experimental results, explored the transient characteristics of the test pump under reverse operating conditions to find the optimal efficiency point of the test pump. In 2015, Antoine Dazin et al. [7] used the bond graph method to establish a numerical model and conducted dimensionless analysis of the numerical simulation results. It is believed that the rapid startup of a centrifugal pump can be divided into three consecutive stages, with relevant time nodes provided, and changes in impeller angular acceleration can lead to an increase in transient effects. In 2010, Duplaa et al. [8] investigated the steady state and transient characteristics of the rocket engine turbopumps under non cavitation conditions. It was found that the transient process of the pump would generate significant pressure pulsation, leading to the occurrence of a cavitation phenomenon.
In 2011, Zhu et al. [9] conducted a rapid startup experiment on a centrifugal pump with an open impeller. They explored the changes in hydraulic performance parameters during the startup process by changing the opening of the discharge valve. It was found that increasing the valve opening degree did not significantly affect the evolution characteristics of the impeller speed, but would lead to a more obvious phenomenon of flow lagging behind the rotation speed. In 2016, Li et al. [10] conducted a three-dimensional numerical simulation of the startup process of the pump as a turbine, using fluid coupling and dynamic overlapping grid technology to explore the transient flow characteristics. The numerical simulation results were in good agreement with experimental measurements, which verify the rationality of the numerical simulation scheme. In 2013, Wu et al. [11] proposed two numerical simulation methods based on finite volume method, DM method and DSR method. Comparing the calculation results with experimental data, it was found that the fully dynamic calculation scheme based on DSR method has higher reliability in simulating transient flow field structures. In 2020, Fu et al. [12] investigated the impact load caused by transient flow in the pump station system, reasonably set the pump speed by force coupling, and simulated gate movement using dynamic grid technology. During the startup process, the flow is highly unstable and there is a significant instantaneous surge in head when the speed reaches the rated speed, and the impeller passage is filled with backflow and vortices. In 2020, Han et al. [13] proposed a method based on a combination of water tank experiment and numerical simulation to study the transient characteristics of a helical mixed flow pump during startup. The results show that the hydraulic performance parameters of the test pump, such as flow rate, head and shaft power, all initially increase and then gradually decrease to reach a relatively stable state. In 2020, Long et al. [14] conducted numerical simulations of the transient flow during the startup process of a multistage centrifugal pump, dividing the startup process into two stages, variable speed valve closure transition and variable flow valve opening transition, and compared them with the steady state process under the same conditions respectively. It was found that the conversion efficiency of internal mechanical energy is higher during the closing valve transition process, while the transient flow in the initial stage of the opening valve transition resulted in more significant rotational stall in the impeller passage, and then the internal flow gradually stabilized. In 2019, Wang et al. [15] conducted an experimental investigation on the transient flow during the startup process of an ultra low specific speed centrifugal pump. It was found that the phenomenon of head impact is commonly present before the startup is completed, and it becomes more significant with increasing startup acceleration. In 2018, Li et al. [1] found that the blade tip of a mixed flow pump vibrates violently during the startup process, and frequent startup can lead to severe deformation of the blade tip. In the hydraulic design of an axial flow pump, considering the influence of impeller rotation acceleration and the clearance value between the impeller and the pump sidewall is necessary.
In 2013, Gao et al. [16] established a mathematical model describing the relationship between the instantaneous head, instantaneous torque, and system parameters to investigate the transient performance during the startup process of the reactor coolant pump and conducted a dimensionless analysis. The purpose of adjusting the transient performance of the pump can be achieved by changing the system parameters. In 2022, Chen et al. [17] explored the transient characteristics of centrifugal pumps under power frequency and variable frequency starting conditions through experiments. The experimental results showed that the phenomenon of shaft power impact was milder and more suitable for practical safety applications under variable frequency startup. Zhang et al. [18] conducted numerical simulations on the startup process of the axial flow pumping station under the two starting modes of pre-opening the vacuum breaking valve and keeping the vacuum breaking valve closed. It was found that compared with the starting method in which the vacuum breaking valve is kept closed, the method of pre-opening the vacuum breaking valve reduces the maximum starting head by 20% and the exhaust time by 43%. The pre-open vacuum breaking valve effectively avoids the system instability caused by the start-up and exhaust of the pump device. Based on the secondary development of Flowmaster numerical software, Zhang et al. [19] also carried out numerical simulation research on LAPS stopping process under different gate control laws. Lu et al. [20] established a synchronous experimental system consisting of a test pump, high speed camera and sensors to measure cavitation and vibration of the pump during the steady state and fast start process at different accelerations of rotational speed. It was found that there is a strong correlation between cavitation and vibration and a new criterion method is proposed by definition of a dimensionless parameter of power ratio r, which divides the vibration power in 1200–1400 Hz by the vibration power in 0–200 Hz, to judge the cavitation occurrence. Liu et al. [21] established a theoretical model to predict pump transient performance under fast startup conditions. The established theoretical model and the corresponding time stepping algorithm are applied to a mixed flow pump under fast startup conditions with various acceleration time. The predicted evolution of pump head shows good agreement with experimental measurements. Liu et al. [22] numerically studied three-dimensional unsteady incompressible and non-cavitating flow in a radial flow pump during the rapid stopping period by CFD. The results showed that the air part in the reservoir approximated real conditions when using the VOF model. Pressure fluctuations were reduced and a sharp increase in pressure at the inlet of the pump was observed at the beginning of the stopping period. Cao et al. [23] quantitatively analyzed the water hammer effect and vibration characteristics in pump starting and pump stopping. It was found that in the pump-stopping process, the shorter the pumping-stop time is, the higher the dynamic pressure of the fracturing fluid and the greater the axial velocity of the pipe. It is easier to damage the pipe in pump stopping compared to pump starting.
In summary, experimental research on the rapid start-up and shutdown of atypical open impeller low specific speed centrifugal pumps at high speeds is very limited. This article conducts fast start and power off stopping experiments on an open impeller centrifugal pump under high speed conditions. The transient performance of a low specific speed centrifugal pump with atypical open impeller was measured during the starting and stopping periods, and the steady-state speed was adjusted to a higher value through a frequency converter and variable frequency motor. A detailed analysis was conducted on the experimental results and their evolution process. The variation pattern of performance parameters over time was obtained, revealing the transient hydraulic characteristics of the pump during starting and stopping, providing a theoretical basis for the wider application of the pump.
2. Experimental Equipment and Testing Pump
2.1. Experimental Equipment
The transient performance test bench for centrifugal pump external characteristics built in this experiment is completely consistent with reference [24]. It mainly consists of a centrifugal pump unit, a testing system, a water tank and a circulation pipeline system, as shown in Figure 1. The pump unit comprises an electric motor, a torque-speed transducer and the pump model to be tested. Two sets of three jaw couplings are connected between the motor and the torque-speed transducer, as well as between the torque-speed transducer and the centrifugal pump to be tested. Each coupling is equipped with rubber cushioning discs to ensure shock free operation during startup.
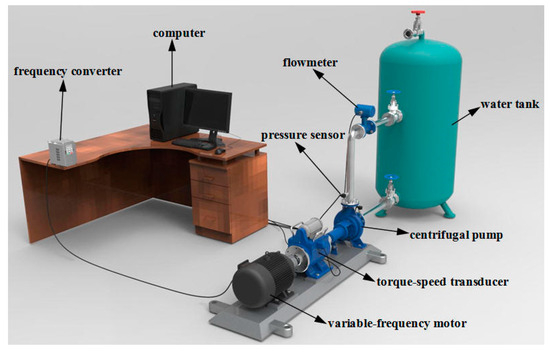
Figure 1.
Test rig.
2.2. Experimental Pump
The pump to be tested in this paper is a small low specific speed centrifugal pump with an atypical open impeller structure, as shown in Figure 2. The design parameters are as follows: flow rate Qr = 6 m3/h, head Hd = 8 m, rotational speed nr = 1450 r/min. Detailed geometric parameters can be found in reference [24]. The expected stable speed after startup and before stopping in this paper is 2900 r/min, which is twice the design speed of the test pump and clearly in a high speed state. The stable flow after startup and before stopping is preset by the pump outlet valve, and the expected values are 2, 6, 10 and 14 m3/h.
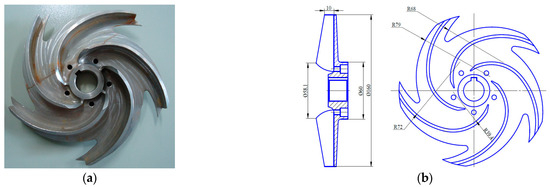
Figure 2.
Open impeller: (a) real model; (b) impeller dimensions.
3. Result Analysis
3.1. Startup Process
The flow change in this article is achieved by adjusting the valve. Adjust the valve to the flow value to be studied during the steady-state stage of the pump, and then stop the pump with the valve opening unchanged. Restart the pump at this valve opening for experimentation. In the pump system, the flow regulating valve is located downstream of the pump outlet, and changes in valve opening have no impact on the upstream. During the high speed startup process, the evolution process of various external characteristic parameters of the centrifugal pump measured through experiments under four different valve openings is shown in Figure 3, Figure 4, Figure 5 and Figure 6.
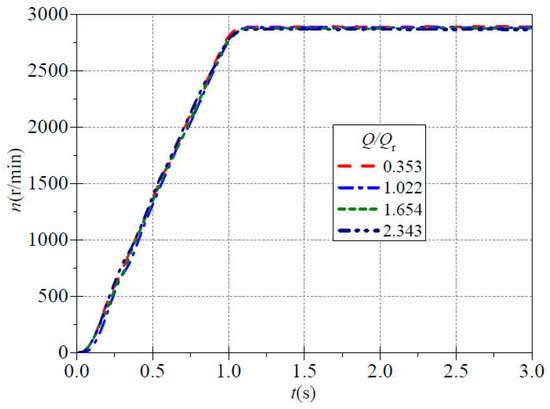
Figure 3.
The rotating speed characteristics during starting periods.
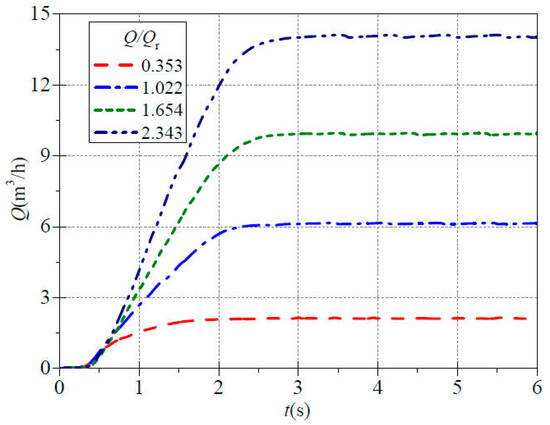
Figure 4.
The flow rate characteristics during starting periods.
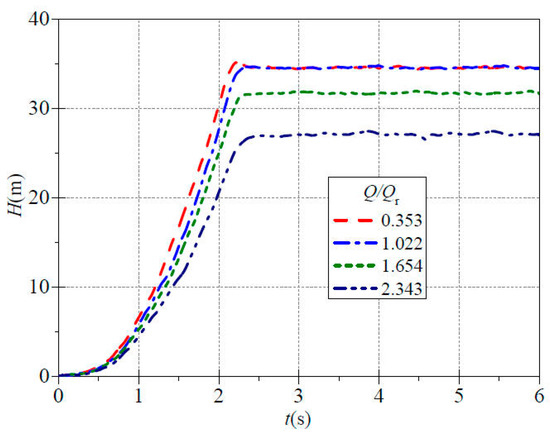
Figure 5.
The head characteristics during starting periods.
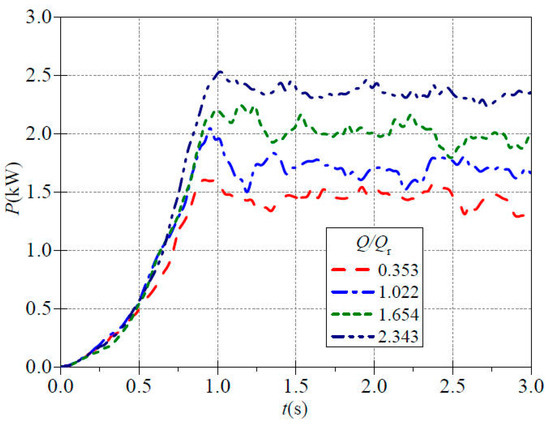
Figure 6.
The shaft power characteristics during starting periods.
Figure 3 shows the evolution process of instantaneous speed over time under different valve openings during the startup process. For centrifugal pumps, adjusting the valve opening at the outlet to attain a stable operating point can lead to changes in the shaft power of the motor output shaft, which potentially affect the instantaneous speed variation characteristics. From the figure, it can be observed that the trend in the variation in the instantaneous speed curves remains largely consistent under different valve openings, with minor discrepancies. Experimental results indicate that all four instantaneous speed curves reach their stable values at approximately 1.10 s. When the flow ratio Q/Qr is 0.353, 1.022, 1.654 and 2.343 (Qr is the rated flow, i.e., the initial design flow), the corresponding stable speeds are approximately 2893.673 r/min, 2886.677 r/min, 2877.949 r/min and 2869.935 r/min. It is evident that as the valve opening gradually increases, the stable speed of the pump shows a slight decreasing trend. This is because an increase in flow rate leads to an increased load on the centrifugal pump, thereby reducing the stable operating speed. Additionally, due to the initial stationary state of the water in the centrifugal pump before startup and its significant inertia, the instantaneous speed increase is relatively slow within the first 0.06 s after startup. By analyzing the experimental data, it can be found that at the startup time t = 0.20 s, the instantaneous speeds corresponding to the four speed curves are 519.283 r/min, 426.578 r/min, 525.995 r/min and 519.587 r/min; at the startup time t = 0.60 s, the instantaneous speeds corresponding to the four speed curves are 1616.267 r/min, 1609.722 r/min, 1652.229 r/min and 1662.264 r/min; at t = 1.00 s, the instantaneous speeds corresponding to the four speed curves are 2834.338 r/min, 2794.702 r/min, 2814.740 r/min and 2807.031 r/min. It was found that the trend of the speed curve increasing approximately follows a linear pattern after startup for 0.1 s. It can be seen that the speed almost linearly increases with time until 1.1s under the four working conditions, which is attributed to the precise adjustment and control of the motor speed by the frequency converter through precise control of the power frequency and voltage.
Figure 4 shows the evolution process of instantaneous flow over time under different valve openings during the startup process. It can be seen that the evolution trend of each instantaneous flow rate curve is similar to the speed curve in Figure 3. Its basic characteristics are that in the early stage of rapid startup, the increase is minimal, followed by a rapid increase, and finally it slowly rises to a stable state. The experimental results show that the time required for the four valve openings to reach stable flow rates from small to large is approximately 2.02 s, 2.77 s, 2.96 s and 3.02 s. The corresponding stable flow rate values are approximately 2.078 m3/h, 6.092 m3/h, 9.924 m3/h and 14.016 m3/h. It is evident that as the valve opening increases, the stable flow rate after startup also increases, and the time required to reach a stable state becomes longer. Simultaneously, the rate of increase in the corresponding flow curve will gradually increase with the larger valve opening. During the early stage of the startup process, approximately before t = 0.36 s, the rising speed of each flow curves for all valve openings is very slow with minimal differences. There is little difference in instantaneous flow rates among the four valve openings with flow ratios of 0.353, 1.022, 1.654 and 2.343 with instantaneous values of only 0.170 m3/h, 0.182 m3/h, 0.052 m3/h and 0.084 m3/h, respectively. Comparing the instantaneous flow curve during the startup process with the speed curve, it can be found that the flow curves gradually rise with the increasing speed. However, the upward trend is relatively gentle, and the time required for the flow rate to reach stability noticeably lags behind the time for the speed to stabilize. Due to the fact that the entire water in the system is in a stationary state before startup, in the early stage of rapid startup, approximately before 0.6 s, the speed curve rises rapidly, while the flow rate curve increases relatively slowly.
Figure 5 shows the evolution process of head over time under different valve openings during the startup process. From the figure, it can be observed that the trend in the variation in the instantaneous head curves remains largely consistent under different valve openings. The initial stage of the head curves exhibit a very slow rate of rise, followed by a rapid ascent and finally reaches a steady state. When the startup time is approximately before 0.40 s, the instantaneous head for various valve opening positions exhibits almost no difference with a minimal increase in magnitude. At this moment, the instantaneous head values corresponding to flow ratios of 0.353, 1.022, 1.654 and 2.343 are approximately 0.692 m, 0.627 m, 0.584 m and 0.414 m, respectively. These values represent only 2.00%, 1.81%, 1.84% and 1.53% of the final steady state head. After 0.40 s of startup, the rising rate of head curves increase gradually, and after about 1.00 s, the head curves rise rapidly, which is mainly due to the rotational speed at this time has been close to a stable level, the impeller work capacity is stronger. Subsequently, at about 2.40 s, the four instantaneous head curves have basically reached a stable state, and the stable head values corresponding to valve openings from small to large are about 34.616 m, 34.605 m, 31.766 m and 27.141 m. It is not difficult to find that there is also a more significant lag in the time to reach steady state for each head curve compared to the instantaneous speed curve. In addition, when the flow ratio is 0.353 and 1.022, the difference in the value of the steady head is very small, which is about 0.011 m. And when the flow ratio is 1.654 and 2.343, the difference in the value of the steady head with the previous valve opening is 2.839 m and 4.625 m, respectively. In summary, it can be seen that in all working conditions, the stable head value after the completion of the startup with the increase in the valve opening shows a trend of gradual reduction, and the degree of reduction gradually increased. It can be seen from the experimental data graph that only 0.353 and 1.022 of the four flow ratios have impact phenomena on the pump head, reaching the peak impact of the head at 2.2 s and 2.3 s, respectively, with corresponding peaks of about 35.229 and 34.753. The impact head (defined as the difference between the peak impact head and the stable head) is about 0.613 m and 0.148 m. As the valve opening increases, the impact phenomenon of the head gradually decreases or even disappears. In addition, during the rising process of the instantaneous head-flow curve, the rising rate gradually decreases with the increase in valve opening.
The instantaneous speed and torque during the test are obtained by means of a speed-torque transducer between the centrifugal pump and the motor, which is used to calculate the instantaneous shaft power of the pump main shaft during rapid startup. Figure 6 shows the evolution of shaft power over time during the startup process under four different valve openings. The shaft power curves rise slowly in the early stage of rapid startup, then rapidly increase until there is an impact phenomenon on the shaft power curve, and ultimately shows periodic fluctuations overall. It can be seen that the upward trend of the instantaneous shaft power curve under each valve opening is basically similar, and maintains a high degree of consistency with the rotational speed curve in Figure 3 at the time of change, which is mainly due to the fact that the rotational speed and the shaft power are measured by the same instrument and have a high degree of correlation. In the early stage of rapid startup of centrifugal pumps, the rate of shaft power increase is relatively small, and then rapidly increases. At flow ratios of 0.353, 1.022, 1.654 and 2.343, the peak shaft power is reached at approximately 0.92 s, 0.96 s, 0.99 s and 1.02 s, respectively. The corresponding peak shaft power is approximately 1.612 kW, 2.103 kW, 2.249 kW and 2.555 kW. It is not difficult to see from the graph that during the rapid rise stage of the shaft power curve, the rising rate gradually increases and the time to reach the peak shaft power is also delayed as the valve opening increases. After reaching the peak, the power curves of the four shafts gradually decrease, showing varying degrees of fluctuation characteristics. The average shaft power corresponding to the valve opening from small to large is about 1.445 kW, 1.694 kW, 2.015 kW and 2.340 kW. It can be seen that increasing the valve opening will gradually increase the shaft power of the centrifugal pump during stable operation. It can be observed that an increase in valve opening will cause the shaft power of the centrifugal pump to gradually increase during stable operation. Simultaneously, it can be calculated that the corresponding impact shaft power (the difference between peak shaft power and average shaft power) is 0.167 kW, 0.409 kW, 0.234 kW and 0.215 kW and the shaft power impact is most pronounced at the rated flow rate.
The author has previously studied the starting experiment of an atypical open impeller low specific speed centrifugal pump with a stable speed of 1450 r/min [24]. The stable speed in this article is twice that, but the rated flow rate is the same. Under the rated flow condition, the pump in this paper takes about 0.9 s longer than the literature [24] to reach the steady speed; the time required to reach the steady flow is 1.47s longer than the literature [24]; the head will increase significantly with the increase in stable speed, doubling the stable speed, and the head will increase to about five times the rated head. The time required to reach stable head will also be extended from about 0.5 s to 2.4 s. Under rated flow conditions, the pump in this article takes about 0.9 s to reach stable speed compared to reference [24]. The time required to achieve stable flow rate is 1.47 s longer than that of reference [24]. The head will increase significantly with the increase in stable speed, doubling the stable speed, and the head will increase to about five times the rated head. The time required to reach stable head will also be extended from about 0.5 s to 2.4 s; the fluctuation degree of shaft power will also increase. The average fluctuation in this article is 1.694 kW, while the average fluctuation in reference [24] is 0.32 kW. The time required to reach the peak is extended from 0.16 s to 0.96 s. By comparison, under high stable speed conditions, it takes longer for the pump system to reach a stable state during starting.
3.2. Stopping Process
The stopping experiment of the centrifugal pump was carried out by power cut off. The evolution of the impeller speed of the centrifugal pump during the stopping process is shown in Figure 7. From the figure, it can be observed that the trend in the variation in the instantaneous speed curves remains largely consistent under different valve openings with minor discrepancies. During the initial stage of power cut off in the centrifugal pump stopping process, the impeller speed curves do not immediately decrease. Prior to t = 0.06 s, all speed curves maintain a relatively high speed for a short period of time before showing a significant decrease. This is mainly because at the moment of power cut off, the impeller is still rotating at a high speed and the inertia effect is significant. The resistance effect of the fluid on the impeller does not immediately manifest resulting in the impeller speed not instantly dropping. From the figure, it can be seen that under the flow ratios of 0.353, 1.022, 1.654 and 2.343, the corresponding instantaneous speeds at 0.06 s are 2885.441 r/min, 2880.707 r/min, 2868.145 r/min and 2864.886 r/min, respectively. After the stopping time t = 0.06 s, the speed curve decreases rapidly. At approximately 0.50 s, the instantaneous speed values corresponding to each flow ratio are approximately 2242.283 r/min, 2226.019 r/min, 2201.791 r/min and 2227.304 r/min; The corresponding instantaneous speed values at 1.00 s are approximately 1511.841 r/min, 1491.916 r/min, 1468.786 r/min and 1501.362 r/min. At 1.50 s, the instantaneous speed values are approximately 761.096 r/min, 736.160 r/min, 708.207 r/min and 766.901 r/min. Comparing it with the startup speed curve shown in Figure 3, it is not difficult to observe that under various valve opening conditions, the decrease trend of the impeller speed after power cut off follows a linear pattern, similar to the trend of the startup speed. Moreover, approximately after 2.10 s from the power cut off, the impeller nearly stops rotating which is significantly longer than the time required for the speed to stabilize during startup. Although the speed characteristic curve is similar to that during startup, the internal reason for the decrease in impeller speed during shutdown is different from that during startup. During the starting process, the pump impeller is driven by an electric motor, which overcomes the torque generated by the fluid resistance inside and outside the impeller and converts its rotational kinetic energy into the kinetic energy and pressure energy of the fluid.
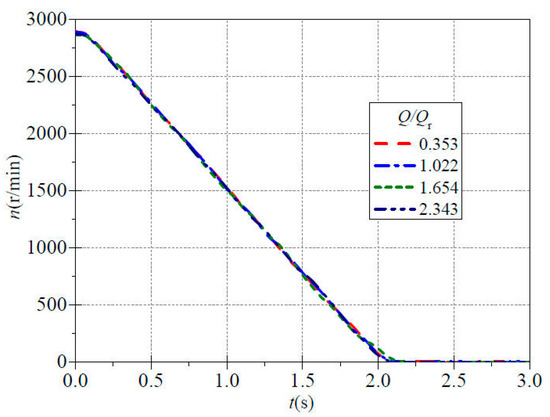
Figure 7.
The rotating speed characteristics during stopping periods.
Figure 8 shows the evolution process of instantaneous flow over time under different valve openings during the stopping process. From the experimental results shown in the graph, it can be found that, similar to the rotational speed curve, the flow rate curves do not immediately decrease at the moment of power cut off, but also remain stable for a period of time before showing a significant drop. The four instantaneous flow curves with different flow ratios start to decline at about 1.02 s, 0.97 s, 0.90 s and 0.89 s. It can be seen that in the early stage of power outage, the decrease in flow curve significantly lags behind the time node at which the speed curve begins to decrease, and as the valve opening increases, the time node at which the flow curve begins to decrease also delays. This is mainly because in the initial stage of stopping, due to inertia, the impeller does not immediately stop, and its rotational speed remains relatively high, resulting in the flow not decreasing immediately. The decreasing trends of the flow curves are generally similar, with the descent rate gradually slowing down. Additionally, varying degrees of abrupt drops in flow rate are observed before reaching zero flow. In the later stage of stopping, the descent rate of the flow rate curves significantly slows down. The time points at which the descent rate of the flow rate curves with flow ratios of 0.353, 1.022, 1.654 and 2.343 starts to noticeably slow down are approximately 4.02 s, 5.13 s, 5.56 s and 5.70 s, respectively. Subsequently, sudden drops in flow occurred, corresponding to time points of approximately 4.25 s, 5.28 s, 7.08 s and 8.92 s. Eventually, the flow curves decreased to zero after the sudden drops, corresponding to time points of approximately 4.91 s, 5.80 s, 7.55 s and 9.47 s. It is evident that an increase in valve opening results in a delay in the occurrence of the sudden drop in flow rate and the complete decrease in flow rate to zero. By comparing the flow rate curves during the startup process, it can be observed that regardless of the startup or stopping process, a larger valve opening leads to a faster rate of change in the flow curve the time required to reach stability or decrease to zero is delayed. Overall, the time required for the flow to decrease to zero is significantly greater than the time taken for the flow to rise to a stable value during startup.
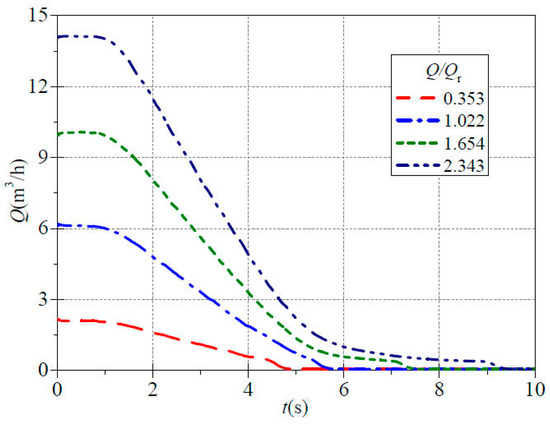
Figure 8.
The flow rate characteristics during stopping periods.
Figure 9 shows the evolution of instantaneous flow over time during the stopping process under four different valve openings. From the figure, it can be found that in the early stage of stopping, the instantaneous head curve is similar to the instantaneous speed and flow curve, neither of which directly decreases at the moment of power outage, but maintains a stable state for a short period of time. In the case of flow ratios of 0.353, 1.022, 1.654 and 2.343, the time nodes at which the decline begins are approximately 0.16 s, 0.16 s, 0.13 s and 0.09 s, respectively. It is evident that an increase in valve opening causes the point at which the head curve starts to decrease to slightly advance, which is in contrast to the phenomenon of delayed timing of flow rate curve decline during the stopping process. Subsequently, the head curves rapidly decline. At a stopping time of t = 1.00 s, the corresponding instantaneous heads are 21.431 m, 21.792 m, 19.053 m and 17.243 m. When the stopping time is 2.00 s, the instantaneous heads have already decreased to 10.273 m, 10.737 m, 9.122 m and 8.131 m. At 3.00 s after stopping, the instantaneous heads are 3.080 m, 3.327 m, 2.631 m and 2.437 m. Through analysis, it can be determined that during the stopping time from t = 1.00 s to 2.00 s, the respective decrease in instantaneous head is 11.158 m, 11.055 m, 9.931 m and 9.112 m. When the stopping time is from t = 2.00 s to 3.00 s, the corresponding difference in head values are 7.193 m, 7.41 m, 6.491 m and 5.694 m. It can be seen that the rate of decline is gradually slowing down. Simultaneously, as the valve opening increases, the rate of decline in the head curves with flow ratios of 1.022, 1.654 and 2.343 gradually decrease, which is consistent with the variation pattern of the rising rate in the head curves during the startup process. The head curves with a flow ratio of 0.353 and 1.022 have relatively small differences during the descent process. The instantaneous head curves of the final four valve openings all reach a stable state at approximately 4.11 s, with minimal fluctuations. The corresponding average stable head values were approximately 0.056 m, 0.070 m, 0.068 m and 0.007 m. In theory, when the stopping process is completed, the corresponding head value at any valve opening should remain constant at zero. The reason for the failure of the head to decrease to zero is the existence of a height difference in the installation position of the pressure sensor. Additionally, at this point, the head values are relatively small, and there may be certain measurement errors in the instruments, resulting in unequal average head values in the end. Furthermore, similar to the speed and flow rate curves, the time required for the head curve to decrease to zero during the stopping process is noticeably greater than the time required for the head to rise to a steady value during startup.
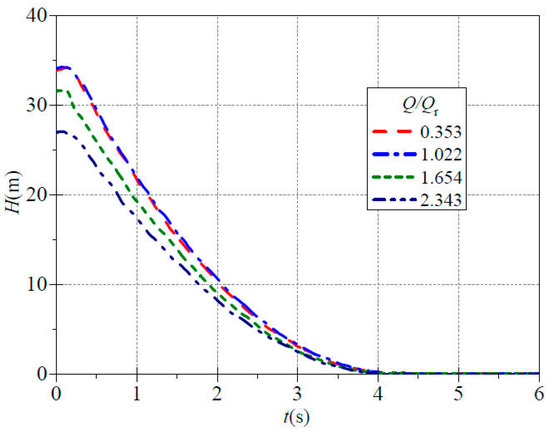
Figure 9.
The head characteristics during stopping periods.
Figure 10 shows the evolution of shaft power over time during the stopping process under four different valve openings. It can be observed from the graph that while the overall power curves of various shaft show a declining trend, this is because before the power outage, the impeller was driven by a motor, which belongs to the so-called “active torque”. However, after the power outage, the impeller no longer has “active torque” from the motor. Nevertheless, due to the rotational inertia of the impeller itself, the impeller will continue to rotate, but at a progressively lower speed due to the fluid resistance torque exerted on the impeller. There are significant differences from the speed, flow rate and head curves during the stopping process. The power curve with a flow rate ratio of 1.654 exhibits the most pronounced fluctuation and is the first to show fluctuation, corresponding to a time point of about 0.13 s, at which point the instantaneous shaft power value is about 1.685 kW. In the end, all shaft powers are reduced to zero, but the required time varies slightly. When the flow ratio is 0.353, 1.022 and 1.654, the time points when the shaft power drops to zero are all about t = 1.25 s, with minimal difference. Only when the flow ratio is 2.343, the time for the shaft power to decrease to zero is about t = 1.47 s. It can be found that the shaft power curves consistently exhibit varying degrees of fluctuation, with the descent rate gradually slowing down during the descent process. Moreover, at the moment of power outage, the shaft power does not remain stable for a period of time but immediately decreases. By comparing with Figure 6, it can be seen that the time required for the power of the shaft to drop to zero when the pump is stopping is longer than the time required for the power of the shaft to stabilize when the pump is at startup. Additionally, the fluctuations during the descent process are more pronounced.
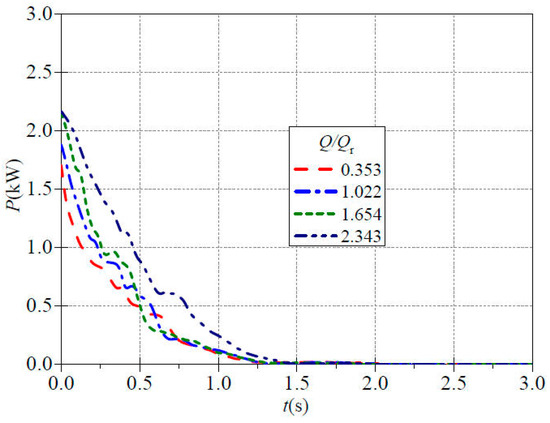
Figure 10.
The shaft power characteristics during stopping periods.
The author has previously studied the stopping experiment of an atypical open impeller low specific speed centrifugal pump with a stable speed of 1450 r/min [25]. The stable speed in this article is twice that, but the rated flow rate is the same. The following are all comparisons of parameters under a rated flow rate. Although the stabilized speed in this paper is twice as high as that in the literature [25], the difference in the time required for the speed to completely drop to 0 during the power failure and stopping process is not significant, with the time taken for the speed to completely drop to 0 at a stabilized speed of 2900 r/min being about 2.10 s, and that taken for the speed to completely drop to 0 at a stabilized speed of 1450 r/min being 1.92 s. The flow rate decreases in the same trend, but during the shutdown process at high speed, the flow rate drops to 0, which takes a shorter time, with 7.55 s and 7.75 s. The downward trend of head under the two operating conditions is similar, with a shorter time taken for the head to decrease to 0 during stopping under high stable speed conditions, with a duration of 4.11 s and 4.5 s; the trend of the shaft power curve is also similar, and it drops to 0 around 1.5 s. In the stopping experiment, it takes similar time for both high and low speed operating conditions to completely reduce to a stable state.
3.3. Discussion
This article conducted rapid starting and stopping external characteristic experiments on an atypical open impeller low specific speed centrifugal pump, and obtained the transient external characteristic changes during the starting and stopping processes, but did not conduct numerical simulation calculations. Further and more detailed internal characteristics research [26,27,28] will be conducted on atypical open impeller low specific speed centrifugal pumps using numerical simulation in the next work.
The author will further study the water hammer effect on the pump studied in this article using numerical simulation in future work, which has a significant impact on the transient hydraulic performance of centrifugal pumps during rapid starting.
An obvious phenomenon during the starting process is a sudden increase in pressure, and extending the startup time has been preliminarily determined as a measure to reduce the impact of pressure surge on the pump. The main problem during the stopping process is the delay in the decrease in various hydraulic parameters caused by the inertia of the impeller. The measure to address this problem is to add a locking device to the pump shaft, which changes the stopping process of the pump from inertial to non-inertial, and from uncontrollable stopping to controllable stopping.
4. Conclusions
In order to understand the transient performance of a low specific speed centrifugal pump during starting and stopping at high speed, this article conducted external characteristic tests on an atypical open impeller low specific speed small centrifugal pump during starting and stopping. The transient hydraulic performance changes of this centrifugal pump during rapid starting and inert stopping were mastered, which provides an effective basis for the selection of starting and stopping methods for centrifugal pumps. The major findings are as follows.
In the early stage of startup, the increase rate of various performance parameters is very slow. During the startup process, the time required for the flow to rise to a steady state value shows an increasing trend as the valve opening increases. The increase in valve opening has little effect on the ascending characteristic of the speed curve, but it leads to an increase in the operating load of the centrifugal pump, resulting in a slight decrease in the tendency of the steady state operating speed. During the startup process, a slight head impact phenomenon occurs, and the degree of impact decreases gradually with the increase in valve opening. In contrast, the shaft power impact phenomenon is more pronounced, with the maximum impact power occurring at the design flow condition.
During the initial phase of power failure stopping, the speed curve decreases first, followed by the head curve and finally the flow curve. During the stopping process, there is a sudden drop in flow and the time point at which the sudden drop occurs is delayed as the valve opening increases; the descent of the shaft power curve is accompanied by fluctuations and the magnitude of these fluctuations is much more pronounced compared to the ascending process of the shaft power curve during startup. As the valve opening increases, the time required for various parameters to decrease to zero values increases compared to the time taken for each parameter to rise to a relatively stable state during startup.
Author Contributions
J.-G.Y. proposed the innovative idea; S.-H.Z. carried out the performance experiment and analyzed the data; Y.-J.Z. carried out the writing of the manuscript; Y.-L.Z. and X.-Q.J. revised the manuscript. All authors have read and agreed to the published version of the manuscript.
Funding
The research was financially supported by Science and Technology Project of Quzhou (Grant No. 2023K256, No. 2022K98) and Zhejiang Provincial Administration for Market Regulation Research Project of China (Grant No. ZC2021B091).
Data Availability Statement
The data used to support the findings of this study are available from the corresponding author upon request.
Conflicts of Interest
The authors declared no potential conflict of interest with respect to the research, authorship, and/or publication of this article.
References
- Li, W.; Ji, L.; Shi, W. Fluid structure interaction study of a mixed-flow pump impeller during startup. Eng. Comput. 2018, 35, 18–34. [Google Scholar] [CrossRef]
- Tsukamoto, H.; Ohashi, H. Transient characteristics of a centrifugal pump during starting period. J. Fluids Eng. 1982, 104, 6–13. [Google Scholar] [CrossRef]
- Tsukamoto, H.; Matsunaga, S.; Yoneda, H.; Hata, S. Transient characteristics of a centrifugal pump during stopping period. J. Fluids Eng. 1986, 108, 392–399. [Google Scholar] [CrossRef]
- Chalghoum, I.; Elaoud, S.; Akrout, M.; Taieb, E.H. Transient behavior of a centrifugal pump during starting period. Appl. Acoust. 2016, 109, 82–89. [Google Scholar] [CrossRef]
- Unterluggauer, J.; Sulzgruber, V.; Doujak, E.; Bauer, C. Experimental and numerical study of a prototype Francis turbine startup. Renew. Energy 2020, 157, 1212–1221. [Google Scholar] [CrossRef]
- Frosina, E.; Buono, D.; Senatore, A. A performance prediction method for pumps as turbines (PAT) using a computational fluid dynamics (CFD) modeling approach. Energies 2017, 10, 103. [Google Scholar] [CrossRef]
- Dazin, A.; Caignaert, G.; Dauphin-Tanguy, G. Model based analysis of the time scales associated to pump start-ups. Nucl. Eng. Des. 2015, 293, 218–227. [Google Scholar] [CrossRef]
- Duplaa, S.; Coutier-Delgosha, O.; Dazin, A.; Roussette, O.; Bois, G.; Caignaert, G. Experimental study of a cavitating centrifugal pump during fast startups. J. Fluids Eng. 2010, 132, 02301. [Google Scholar] [CrossRef]
- Zhu, Z.; Guo, X.; Cui, B.; Li, Y. External characteristics and internal flow features of a centrifugal pump during rapid startup. Chin. J. Mech. Eng. 2011, 24, 798–804. [Google Scholar] [CrossRef]
- Li, Z.; Bi, H.; Wang, Z.; Yao, Z. Three-dimensional simulation of unsteady flows in a pump-turbine during start-up transient up to speed no-load condition in generating mode. Proc. Inst. Mech. Eng. Part A 2016, 230, 570–585. [Google Scholar] [CrossRef]
- Wu, D.; Chen, T.; Sun, Y.; Cheng, W.; Wang, L. Study on numerical methods for transient flow induced by speed-changing impeller of fluid machinery. J. Mech. Sci. Technol. 2013, 27, 1649–1654. [Google Scholar] [CrossRef]
- Fu, S.; Zheng, Y.; Kan, K.; Chen, H.; Han, X.; Liang, X.; Liu, H.; Tian, X. Numerical simulation and experimental study of transient characteristics in an axial flow pump during start-up. Renew. Energy 2020, 146, 1879–1887. [Google Scholar] [CrossRef]
- Han, W.; Zhang, T.; Su, Y.L.; Chen, R.; Qiang, Y.; Han, Y. Transient Characteristics of Water-Jet Propulsion with a Screw Mixed Pump during the Startup Process. Math. Probl. Eng. 2020, 2020, 5691632. [Google Scholar] [CrossRef]
- Yun, L.; Bin, L.; Jie, L. Research on the transient hydraulic characteristics of multistage centrifugal pump during start-up process. Front. Energy Res. 2020, 8, 76. [Google Scholar] [CrossRef]
- Wang, Y.; Xie, L.; Chen, J.; Liu, H.L.; Luo, K.K.; Zhang, Z.L.; Cao, M.H. Experimental study on transient startup characteristics of a super low specific speed centrifugal pump. J. Chem. Eng. Jpn. 2019, 52, 743–750. [Google Scholar] [CrossRef]
- Gao, H.; Gao, F.; Zhao, X.; Chen, J.; Cao, X. Analysis of reactor coolant pump transient performance in primary coolant system during start-up period. Ann. Nucl. Energy 2013, 54, 202–208. [Google Scholar] [CrossRef]
- Cheng, L.; Zhang, K.Y.; Zhang, Y.L.; Jia, X.Q. Effect on Starting Modes on Centrifugal Pump Performance. Processes 2022, 10, 2362. [Google Scholar] [CrossRef]
- Zhang, X.; Tang, F.; Liu, C.; Shi, L.; Liu, H.; Sun, Z.; Hu, W. Numerical simulation of transient characteristics of start-up transition process of large vertical siphon axial flow pump station. Front. Energy Res. 2021, 9, 706975. [Google Scholar] [CrossRef]
- Zhang, X.; Hu, C.; Tang, F.; Yang, F.; Song, X.; Liu, C.; Shi, L. Numerical and experimental study on the shutdown transition process of a large axial flow pump system focusing on the influence of gate control. J. Mar. Sci. Eng. 2023, 11, 280. [Google Scholar] [CrossRef]
- Lu, Y.; Tan, L.; Han, Y.; Liu, M. Cavitation-vibration correlation of a mixed flow pump under steady state and fast start-up conditions by experiment. Ocean Eng. 2022, 251, 111158. [Google Scholar] [CrossRef]
- Liu, M.; Han, Y.; Tan, L.; Lu, Y.; Ma, C.; Gou, J. Theoretical prediction model of transient performance for a mixed flow pump under fast startup conditions. Phys. Fluids 2023, 35, 025125. [Google Scholar] [CrossRef]
- Liu, J.; Li, Z.; Wang, L.; Jiao, L. Numerical simulation of the transient flow in a radial flow pump during stopping period. J. Fluids Eng. 2011, 133, 111101. [Google Scholar] [CrossRef]
- Cao, Y.; Dou, Y.; Huang, Y.; Cheng, J. Study on vibration characteristics of fracturing piping in pump-starting and pump-stopping water hammer. J. Fail. Anal. Prev. 2019, 19, 1093–1104. [Google Scholar] [CrossRef]
- Zhang, Y.; Zhu, Z.; Jin, Y.; Cui, B.; Li, Y.; Dou, H. Experimental study on a centrifugal pump with an open impeller during startup period. J. Therm. Sci. 2013, 22, 1–6. [Google Scholar] [CrossRef]
- Zhang, Y.L.; Zhu, Z.C.; Sheng, Y.N.; Cui, B.L.; Li, Y. Experimental study on a prototype centrifugal pump with open impeller during stopping period. Int. J. Fluid Mech. Res. 2016, 43, 18–27. [Google Scholar] [CrossRef]
- Peng, Y.; Mahyari, H.M.; Moshfegh, A.; Javadzadegan, A.; Toghraie, D.; Shams, M.; Rostami, S. A transient heat and mass transfer CFD simulation for proton exchange membrane fuel cells (PEMFC) with a dead-ended anode channel. Int. Commun. Heat Mass Transf. 2020, 115, 104638. [Google Scholar] [CrossRef]
- Shirani, N.; Toghraie, D.; Zarringhalam, M.; Afrand, M. Numerical simulation of transient mixed convection of water–Cu nanofluid in a square cavity with multiple rotating cylinders having harmonic motion. J. Therm. Anal. Calorim. 2021, 143, 4229–4248. [Google Scholar] [CrossRef]
- Shirani, N.; Toghraie, D. Numerical investigation of transient mixed convection of nanofluid in a cavity with non-Darcy porous inner block and rotating cylinders with harmonic motion. Sci. Rep. 2021, 11, 17281. [Google Scholar] [CrossRef]
Disclaimer/Publisher’s Note: The statements, opinions and data contained in all publications are solely those of the individual author(s) and contributor(s) and not of MDPI and/or the editor(s). MDPI and/or the editor(s) disclaim responsibility for any injury to people or property resulting from any ideas, methods, instructions or products referred to in the content. |
© 2023 by the authors. Licensee MDPI, Basel, Switzerland. This article is an open access article distributed under the terms and conditions of the Creative Commons Attribution (CC BY) license (https://creativecommons.org/licenses/by/4.0/).