Article

Occurrence Characteristics of Chang 7 Shale Oil from the Longdong Area in the Ordos Basin: Insights from Petrology and Pore Structure

1
Hubei Key Laboratory of Petroleum Geochemistry and Environment, Yangtze University, Wuhan 430100, China
2
School of Resource and Environment, Yangtze University, Wuhan 430100, China
3
The Third Oil Production Plant, Changqing Oilfield Company, PetroChina, Yinchuan 750006, China
4
Research Institute of Exploration and Development, PetroChina Changqing Oilfield Company, Xi’an 710018, China
5
The Twelfth Oil Production Plant, Changqing Oilfield Company, PetroChina, Qingyang 745099, China
6
Technology Development Department, XMotors.ai Inc., Santa Clara, CA 95054, USA
*
Authors to whom correspondence should be addressed.
Processes 2023, 11(11), 3090; https://doi.org/10.3390/pr11113090
Submission received: 9 September 2023 / Revised: 23 October 2023 / Accepted: 25 October 2023 / Published: 27 October 2023

Abstract

:
Organic geochemistry experiments, X-ray diffraction (XRD), field emission scanning electron microscopy (FE-SEM), N2 adsorption, CO2 adsorption, and two-dimensional nuclear magnetic resonance (2D NMR) were performed on ten Chang 7 shale samples (Longdong area, Ordos Basin) to elucidate their pore structure and the characteristics of oil occurrence. Moreover, the factors influencing free oil were discussed, and an occurrence model was established. FE-SEM analysis reveals that the pore types include interparticle pores, intraplatelet pores within clay aggregates, rare fracture pores, and organic matter (OM) pores. The pores are predominantly slit-shaped. The development of micropores was mainly contributed to by OM. Quartz and clay minerals influence the development of macropores and mesopores, feldspar mainly controls macropore development, and pyrite most strongly affects micropore development. Micropores and mesopores constitute the main total pore specific surface area, while mesopores and macropores are the main contributors to the total pore volume. Pores > 2 nm are the main storage spaces for shale oil, and free oil mainly occurs in pores > 20 nm. Adsorbed oil and free oil were assessed by NMR T1–T2 mapping. The adsorbed oil signal intensities range from 7.5–23.4 a.u. per g of rock, and the free oil signal intensities range from 4.4–23.2 a.u. per g of rock. The free oil proportions are 15.9–70.6% (average of 44.2%). The free oil proportion is negatively correlated with the clay mineral content and total organic carbon (TOC) content but positively correlated with the saturated hydrocarbon content and volume of pores > 20 nm. The results of this study could help optimize favorable shale oil target areas.

1. Introduction

Due to its enormous resources, shale oil has attracted worldwide attention and has gradually changed the strategic pattern of world energy resources [1,2,3,4,5,6]. Shale oil primarily exists in the micro/nanopores of shale in the form of adsorbed and free states. Adsorbed oil is absorbed by OM or adsorbed on the surface of OM and mineral particles, while free oil mostly appears in pores and fractures. Generally, free oil flows easily, while adsorbed oil has more difficulty in flowing. The mobility of shale oil is directly influenced by the occurrence mechanism [7,8]. Therefore, investigating the pore structure and its internal oil occurrence characteristics is significant for shale oil sweet spot prediction and resource evaluation. Furthermore, the characteristics of shale oil occurrence are controlled by the rock composition (i.e., minerals and kerogen), crude oil composition, and pore structure.
Several advanced techniques are used to characterize the pore structure of shale reservoirs, mainly including imaging methods and fluid injection methods. Imaging methods are mostly used for the qualitative identification of organic and inorganic pore types, including various high-resolution techniques such as computed tomography (CT), Ar ion milling scanning electron microscopy (Ar-SEM), and field emission−/focused ion beam SEM (FE-/FIB-SEM) [9,10,11,12,13]. Although the combination of FIB-SEM and CT with 3D reconstruction technology can help analyze the size distribution and topological characteristics of pores and microfractures, there is a contradiction between representativeness and resolution [14]. Fluid injection methods can quantitatively characterize the pore size distribution of porous media, such as gas adsorption (CO2 and N2 adsorption), nuclear magnetic resonance (NMR), and mercury intrusion porosimetry (MIP) [15,16,17,18]. N2 adsorption is used to characterize pores ranging in size from 2 to 200 nm, while CO2 adsorption can characterize only pores < 2 nm. MIP can obtain the throat size and NMR can effectively characterize almost all pore information. However, other experiments are needed to convert T2 into a pore size distribution (PSD). Hence, it is essential to employ multiple techniques to fully reveal the pore structure.
Methods for studying the characteristics of occurrence can be divided into direct methods and indirect methods. Direct methods include cryo-SEM, environmental SEM (ESEM), FE-SEM (which is based on the electron beam charging effect), laser confocal scanning, CT scanning, and energy dispersive spectroscopy [19,20,21,22,23,24]. Indirect methods include Rock–Eval pyrolysis, solvent extraction, pore size analysis before and after extraction, and 2D NMR. The direct method can directly observe the state of the residual oil and identify its occurrence form and location. However, the direct method is only a qualitative observation. The indirect method can quantitatively characterize the pore size and content of shale oil in various occurrence states. Bai et al. [8] reported that solvent extraction and Rock–Eval pyrolysis can measure traditional geochemical parameters to characterize the mobility of shale oil. However, dissolved organic matter (DOM) characterized by solvent extraction excludes low carbon-number hydrocarbons. Different solvents were used to study mobile hydrocarbons by Qian et al. [25]. Zhang et al. [26] conducted cold extraction of shale with multiple particle sizes to determine the shale oil. Li et al. [27] used multiparticle and multipolar extraction methods to investigate the free oil content in different fine-grained sedimentary rocks. Rock–Eval pyrolysis was used to assess the contents of the free hydrocarbon content (S1) and the cracking hydrocarbons (S2). On the basis of gas chromatography results, a pyrolysis product before 350 °C was considered free oil. Jarvie [2,3] proposed using the oil saturation index (OSI, 100 × S1/TOC) to indicate shale oil mobility. Jarvie believed that OSI values > 100 mg/g indicate that shale oil has good mobility. However, this conclusion is practical for mature marine shale in the USA but may not be applicable to continental shale in other regions. Xue et al. [28] defined the lower limit of shale oil mobility in the Qingshankou Formation as 75 mg/g (OSI), and Huang et al. [29] defined the lower limit of shale oil mobility of Chang 7 as 70 mg/g (OSI). The pore sizes in the extracted and unextracted samples can be compared, and the presence of shale oil in pores of various sizes can be characterized [30]. However, the clay minerals in some samples may expand due to solvent extraction, resulting in changes in the pore structure [31]. Different hydrogen-containing components can be distinguished by the T1–T2 map, and kerogen, adsorbed and free oil can be identified [8,32,33].
In this work, Chang 7 shale samples were collected from the Longdong area in the Ordos Basin. The petrology and organic geochemistry characteristics were analyzed by thin section, X-ray diffraction (XRD), and geochemistry experiments. Furthermore, the pore structure and oil content were investigated by FE-SEM, CO2 adsorption, N2 adsorption, and 2D NMR. Finally, relationships among OM abundance, petrological components, pore structure, crude oil composition, and free oil content were discussed, and the modes of occurrence were preliminarily established.

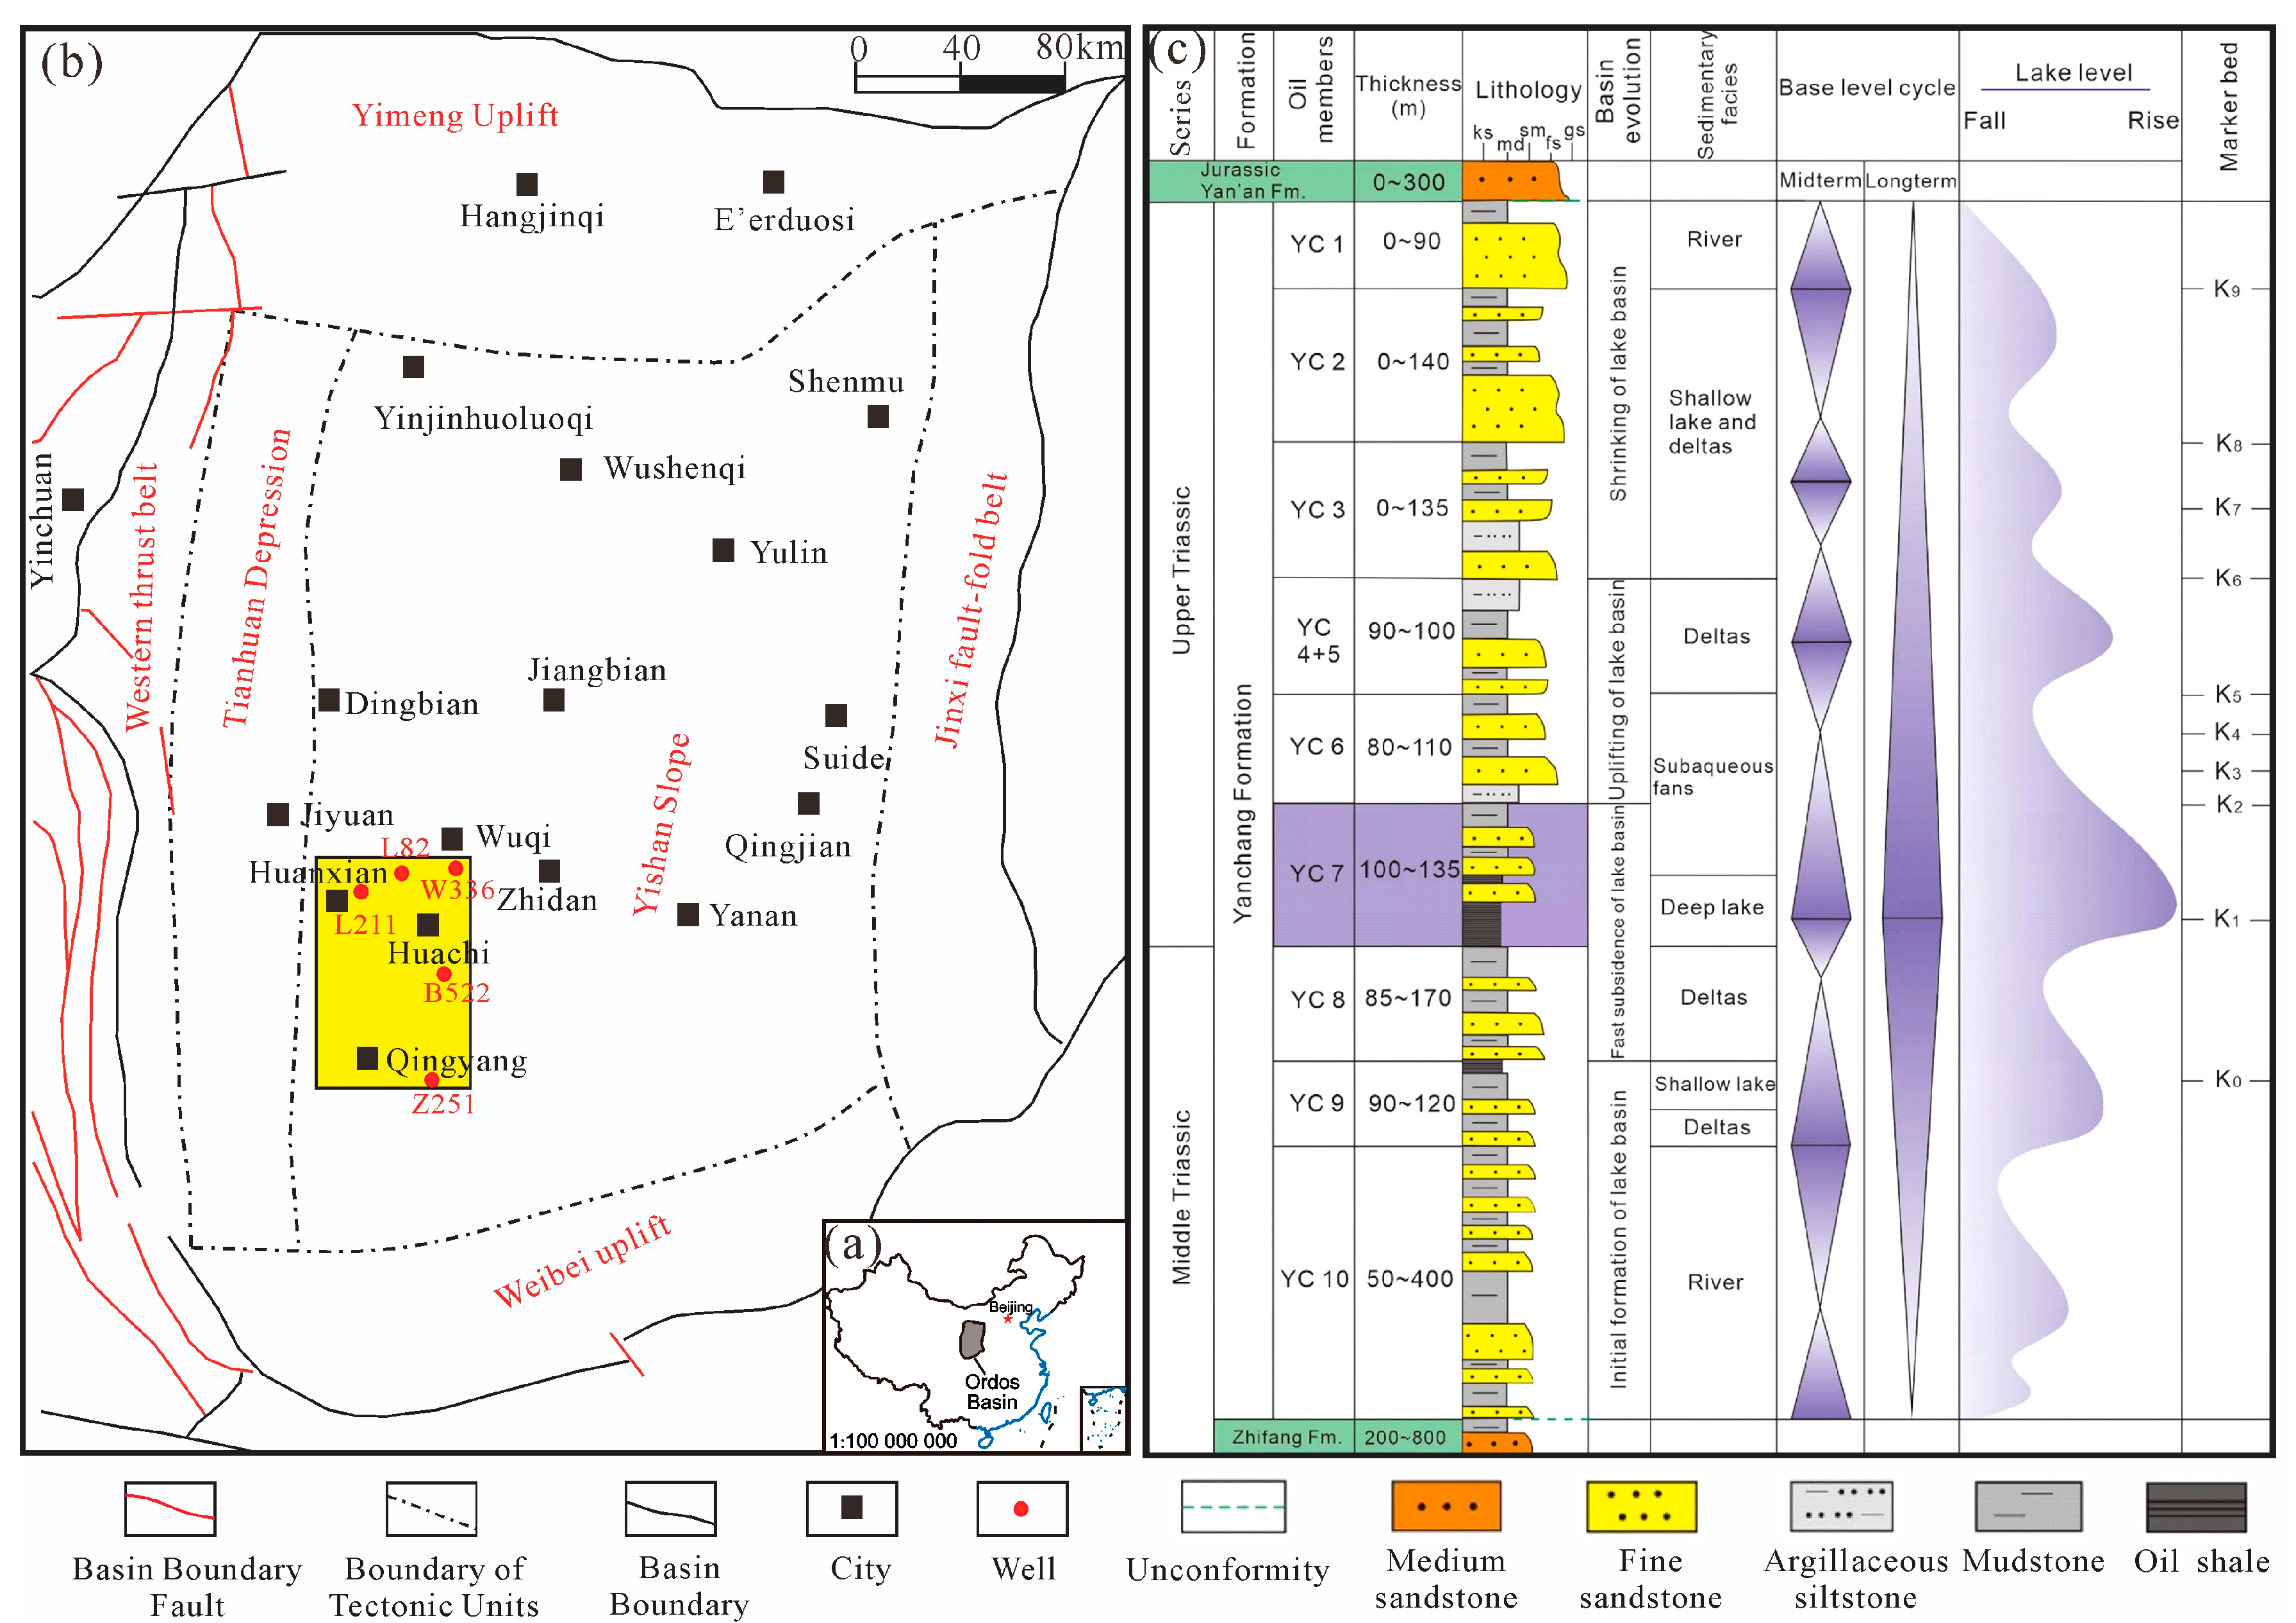
2. Geological Setting

The Ordos Basin, belonging to the western part of the North China Craton, is a crucial petroleum basin in China composed of the Jinxi Fault and Fold Belt, Western Margin Thrust Belt, Weibei Uplift, Yimeng Uplift, Tianhuan Depression, and Yishan Slope (Figure 1a,b). During the deposition period of the Triassic Yanchang Formation, a set of terrigenous clastic rocks was developed and divided into 10 sections from bottom to top, named Chang 10 to Chang 1 [34,35] (Figure 1c). In the Chang 7 period, strong tectonic movement led to the rapid expansion of the lake basin. The gray and black mud shale was deposited in a large area during the Chang 7 member [36,37].

3. Materials and Methods

3.1. Samples

In total, 159 TOC and Rock–Eval pyrolysis data of the Chang 7 core samples were assembled from the PetroChina Changqing Oilfield Company. In the study area, ten Chang 7 shale samples (Figure 1b) were collected from boreholes. A variety of experiments were performed on the selected samples, including thin section, XRD, FE-SEM, TOC, Rock–Eval, solvent extraction, Vitrinite reflectance (Ro), maceral composition analysis, and gas chromatography–mass spectrometry (GC–MS), and six of the samples were analyzed by CO2 adsorption, N2 adsorption, and 2D NMR.

3.2. XRD and FE-SEM

XRD analysis was performed using a Bruker AXS D8 Discover X-ray diffractometer to analyze the mineral composition based on the SY/T 5163-2010 standard formulated by the Chinese Ministry of Education. FE-SEM samples were observed by an FEI Quantum model 450. The argon ion grinding surfaces were prepared with an Ilion+II 697C argon ion mill. The sample was made into a block with a width of 1 cm and a thickness of 0.5 cm along the direction perpendicular to the bedding.

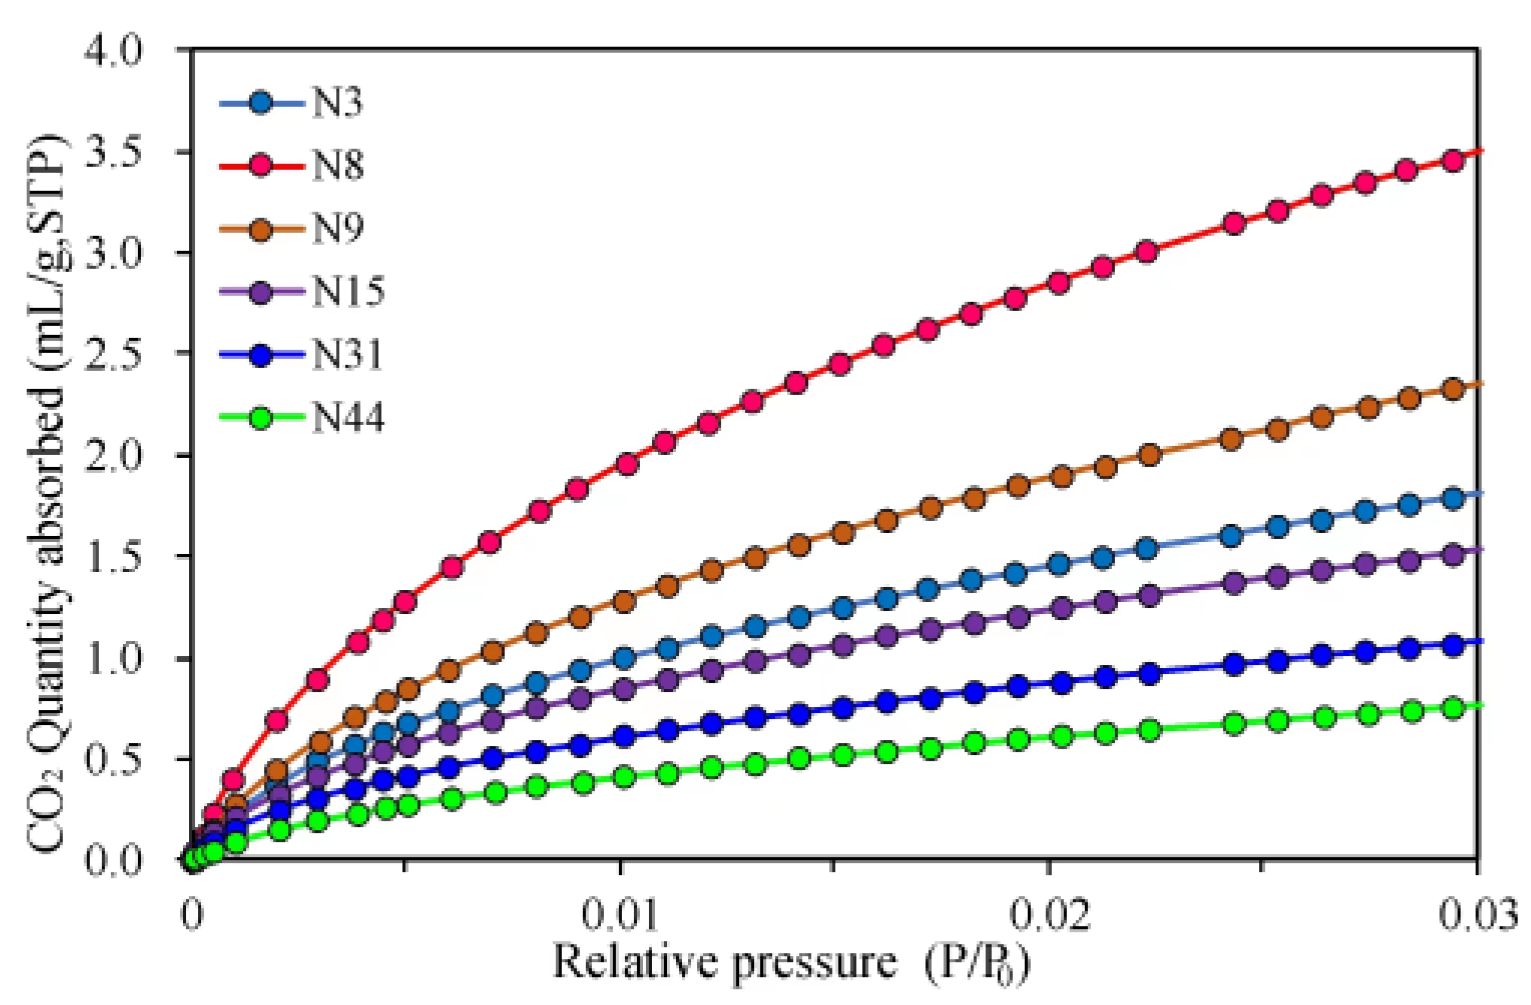
3.3. Gas Adsorption and NMR Measurements

Various gas adsorption experiments were employed to characterize pores of varying sizes. The CO2 and N2 adsorption analyses were conducted using an ASAP 2460 and Micro Active for ASAP2020, respectively. The samples were pulverized to approximately 100 mesh in an agate mortar. The relative pressure (P/P0) values for CO2 adsorption were in the range of 0.0001–0.032, and those for N2 adsorption were 0.009–0.995. NMR experiments were conducted using a Niumag MesoMR23-060H-I. The parameter settings were as follows: echo time (TE), 0.06 ms; number of echoes, 5000; number of scans (NS), 8; and waiting time, 1000 ms.

3.4. TOC Analysis, Rock–Eval, Ro, and GC–MS

TOC analysis was carried out on the powdered samples (about 100 mesh) using a LECO CS230 analyzer. Dilute hydrochloric acid was added to remove inorganic carbon. A Rock–Eval OGE-VI instrument was used to pyrolyze the crushed powder. The measured parameters include free hydrocarbons (S1), residual hydrocarbons (S2), and temperature of maximum pyrolysis yield (Tmax). The identification of rock slices was performed on a Leica Leitz DMR XP polarizing microscope with an objective lens multiple of 10×–100×. Ro determination and organic petrological observations were performed on a Zeiss Axio Scope A1/J&M Msp200 digital maceral analysis system, the shale was cut into cubic blocks to a width of about 2 cm, and epoxy resin was used to solidify the sample into a lightweight sheet, which was polished to obtain a smooth surface for testing. The light source wavelength was 546 ± 5 nm. Powder samples were extracted using a Soxhlet extractor > 72 h. The extract was separated into saturated hydrocarbons (n-alkanes+ i-alkanes+ cycloalkanes), aromatic hydrocarbons (BTEX + naphtalenes), non-hydrocarbon (sulfur, nitrogen, oxygen compounds) and asphaltenes [38]. The asphalt was separated with cold hexane precipitation and weighed. Deasphalted fractions were eluted with hexane to remove saturated hydrocarbon fractions, petroleum ether: DCM (9:1, v/v) to remove aromatic fractions, and chloroform to remove non-hydrocarbon fractions, respectively, on a silica gel/alumina column. An Agilent 6890 gas chromatograph was connected to the Agilent 5975 MSD system.

4. Results

4.1. Petrology and Organic Geochemistry Characteristics
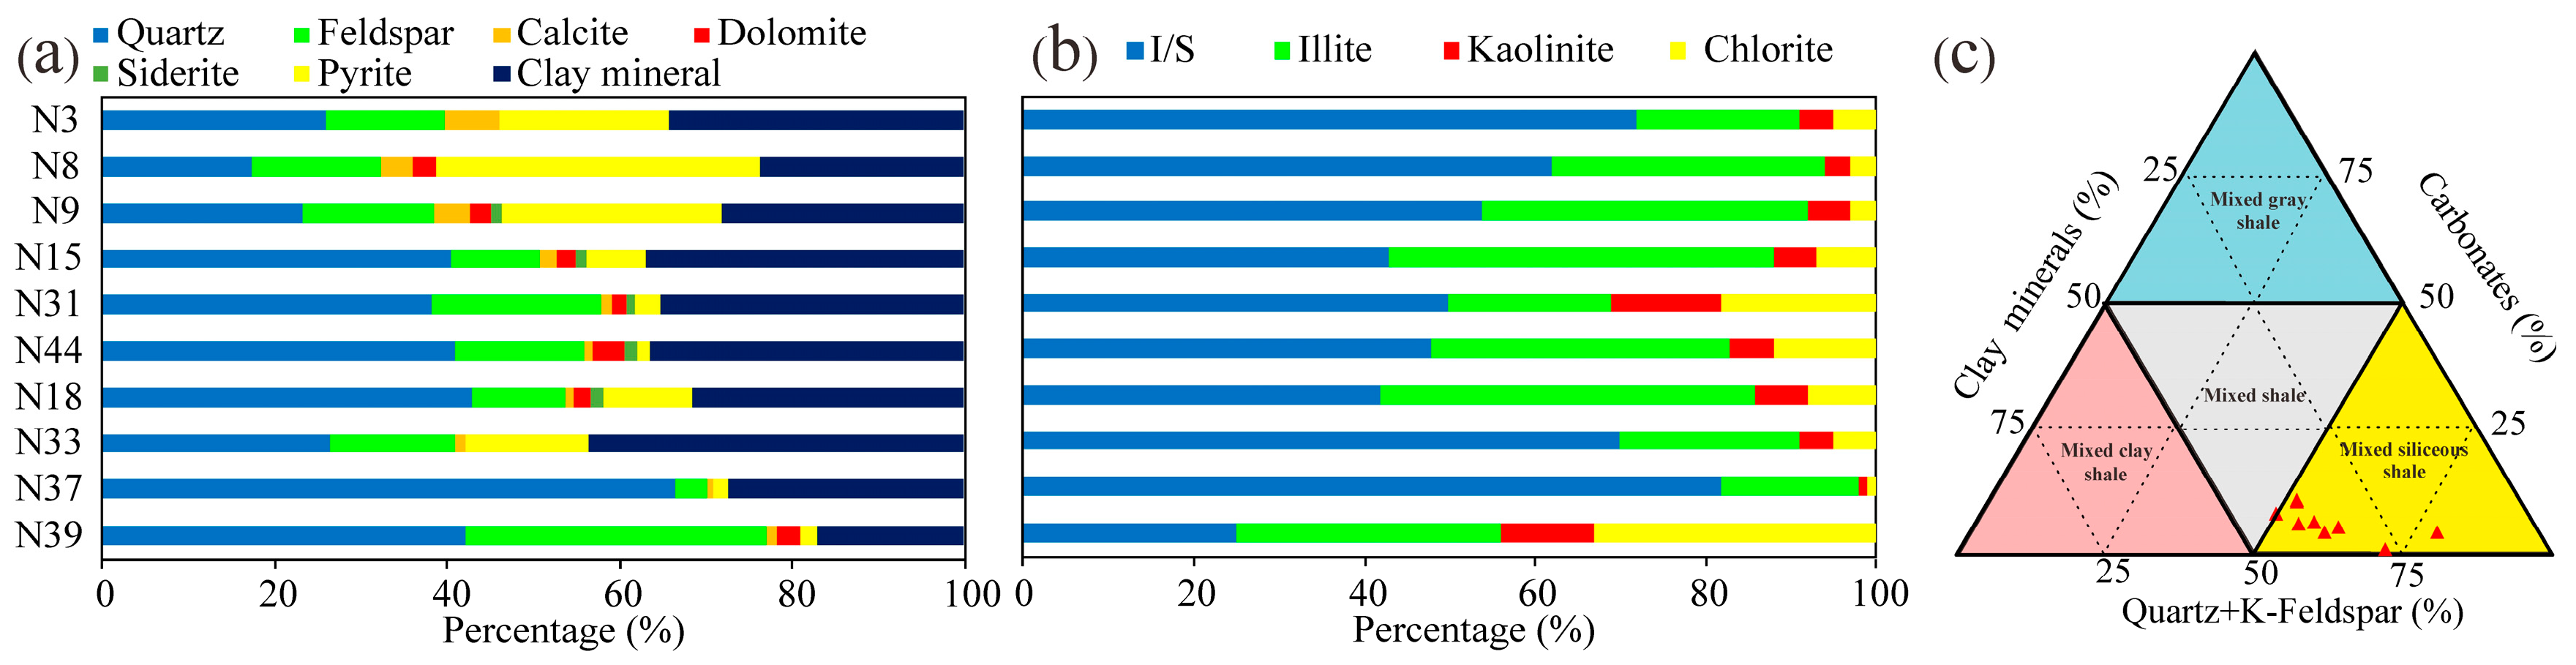
4.1.1. Mineralogy

The samples had abundant quartz, clay minerals, feldspar, and pyrite, with contents of 17.4–66.5 wt% (mean of 36.5 wt%), 17.0–43.5 wt% (mean of 31.2 wt%), 3.8–34.8 wt% (average of 15.3 wt%), and 1.6–37.6 wt% (average of 13.3%), respectively (Figure 2a), according to the XRD analysis. Clay minerals were mainly illite/smectite (I/S) mixed layers, with contents of 25.0–82.0% (mean of 54.8%), followed by illite (16.0–45.0%). The average contents of chlorite and kaolinite were 5.7% and 9.5%, respectively (Figure 2b). The content of highly brittle minerals was an important indicator for effective fracturing. In this study, quartz, feldspar, carbonate minerals, and pyrite are considered brittle minerals [39]. The contents of brittle minerals was in the range of 56.7–83.1% (mean of 9.4%), similar to the shale from the Qingshankou Formation [39].

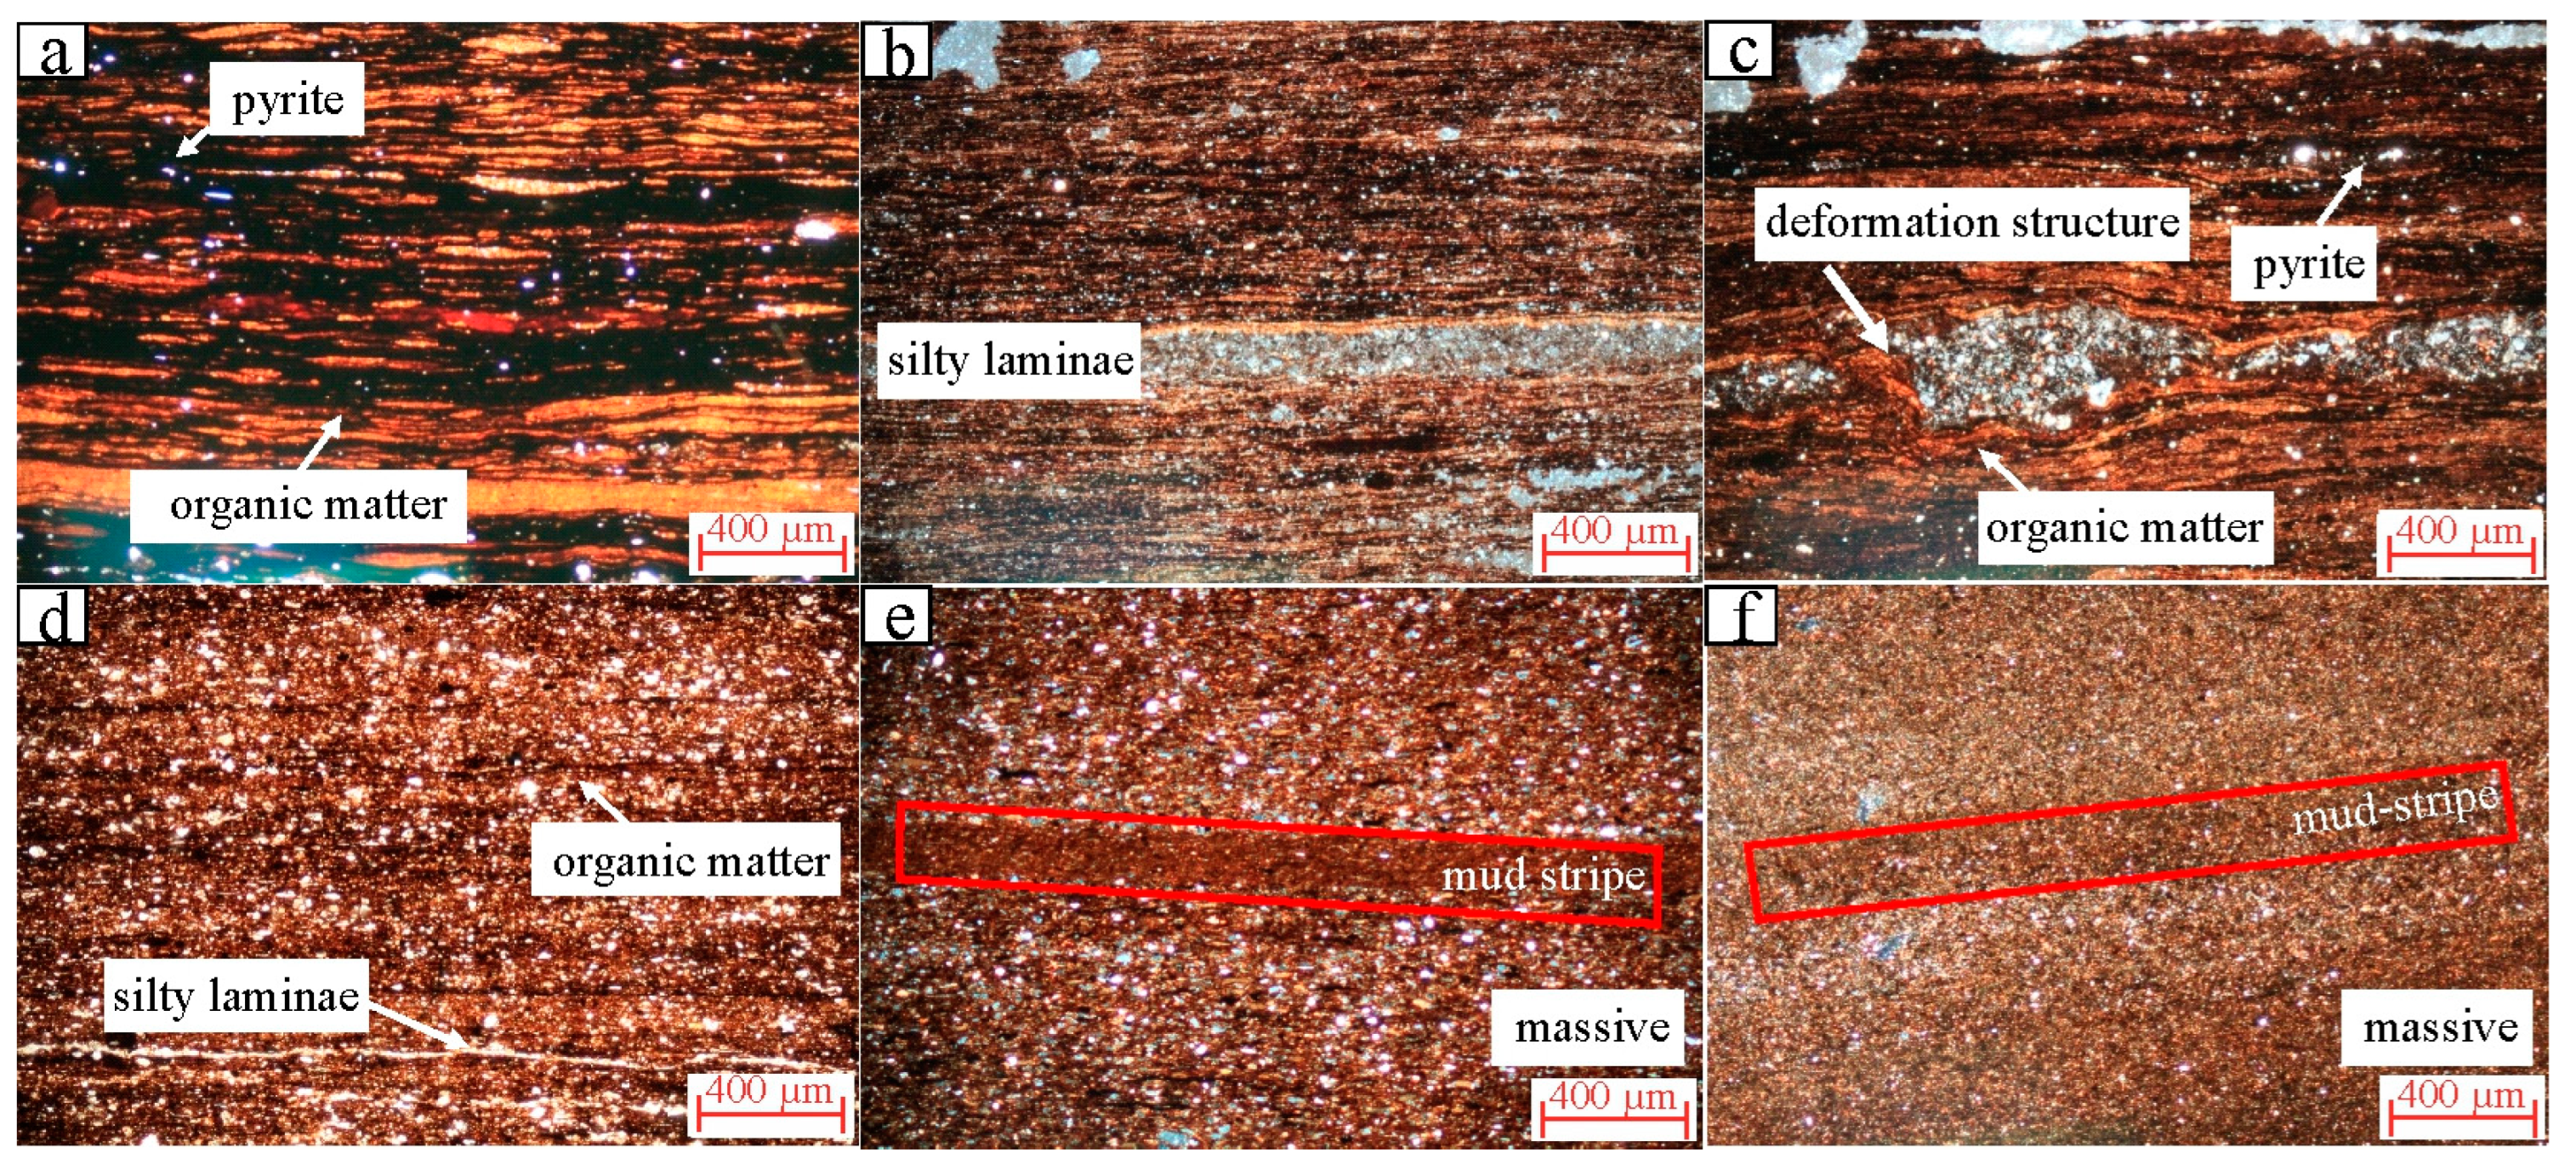
4.1.2. Shale Lithofacies Identification

Referring to the classification of shale lithofacies by Wang et al. [40] and Xi et al. [41], the samples were mainly OM-rich laminated felsic shale and OM-rich massive felsic mudstone (Figure 2c).
The OM-rich laminated felsic shales developed OM-rich lamina and felsic lamina with local enrichment of pyrite, accompanied by some plastic deformation structures. The OM-rich lamina is dark, with high OM amounts and a continuous horizontal layered distribution. The thickness of a single lamina is approximately ten to hundreds of microns. The felsic laminae are light in color and are also horizontally layered, with a single-layer thickness of more than 100 microns. The vertical plastic deformation structures reach 200 microns (Figure 3a–d).
OM-rich massive felsic mudstones mainly contain clay minerals and a small quantity of fine silt, which are argillaceous debris structures. OM is scattered in the mudstone. The argillaceous bands can be observed, with thicknesses of >100 microns (Figure 3e,f).

4.1.3. Organic Petrology

Organic petrologic characteristics objectively reflect the biogenic input characteristics of OM in source rocks. The macerals in the study area are dominated by sapropelic groups, indicating that the biological sources are mainly lower aquatic organisms such as algae. Strawberry-like pyrite in the sample is scattered or aggregated (Figure 4), reflecting a relatively quiet and reducing depositional environment [42]. These results demonstrate that the Chang 7 shale has a strong hydrocarbon generation ability.

4.1.4. TOC, Rock–Eval Pyrolysis, Biomarker Characteristics, and Ro

The TOC values of the samples range from 0.15% to 37.40% (average of 7.21%), and samples with TOC values > 5% account for 40%. The TOC values are higher than those of other continental shales in China [43,44,45,46]. The hydrocarbon generation potential (S1 + S2) varies from 0.17 mg/g to 122.19 mg/g (mean of 27.93 mg/g) (Figure 5a,b). The hydrogen index (HI = 100 × S2/TOC) values vary between 69.2 mg/g TOC and 510.3 mg/g TOC (mean of 266.7 mg/g TOC). Plots of S2 versus TOC and HI versus Tmax are used to assess the types of OM [47]. Most data are in the regions belonging to type II1–II2 OM (Figure 5c,e). The maturity of OM can be evaluated by Tmax, the biomarker parameters C29αββ/(αββ + ααα) and C2920S/(20S + 20R), and Ro [38]. Tmax values range from 427 °C to 458 °C (mean of 447 °C). The values of αββ/(αββ + ααα) and 20S/(20S + 20R) are two commonly used maturity indicators for the isomerization of C29 steranes. Values of C29-20S/(20S + 20R) and C29-αββ/(αββ + ααα) of less than 0.2 and 0.25 indicate the immature stage, values less than 0.4 indicate the early mature stage, and values more than 0.4 indicate the mature stage. Both C29-20S/(20S + 20R) and C29-αββ/(αββ + ααα) are in the range of 0.50–0.62. Ro is also a classic parameter for assessing maturity. When the Ro value is ≤0.5%, OM is in the immature stage; when Ro values are 0.5~0.8%, OM is in the early stage of maturity; when Ro values are 0.8~1.2%, OM is in the middle of the mature stage; when Ro values are 1.2~1.6%, OM is at the end of the mature stage. Ro values are in the range of 0.8–1.2%. The above parameters show that the samples are in a mature stage (Figure 5d–f, Table 1).

4.2. Pore Characteristics

4.2.1. Pore Type Classification

According to the pore classification scheme of Loucks [10], the pore space of the Chang 7 shale samples is composed of intraplatelet pores within clay aggregates (IntraP pores), interparticle pores (InterP pores), OM pores, and fracture pores (Figure 6). IntraP pores were commonly surveyed in the Chang 7 shales, with curved and irregular shapes. The aspect ratios of IntraP pores are mostly below 10:1. Moreover, the lengths of IntraP pores can reach 600 nm, and the widths are generally less than 60 nm (Figure 6c,f,i). InterP pores mainly reside between quartz and feldspar particles, with a maximum pore size of up to several micrometers. Due to strong compaction and cementation, the distribution of InterP pores is relatively isolated. The OM pores are dominated by shrinkage OM, which are in the shape of curved lines. Shrinkage OM pores usually exist between OM and minerals or within OM. The maximum width of the shrinkage OM pores can exceed 200 nm, and the length can reach several microns (Figure 6g). Moreover, nearly circular or irregularly shaped OM pores are observed within OM aggregates (Figure 6a,b,g), and the pore sizes are mostly distributed from 10 to 300 nm.

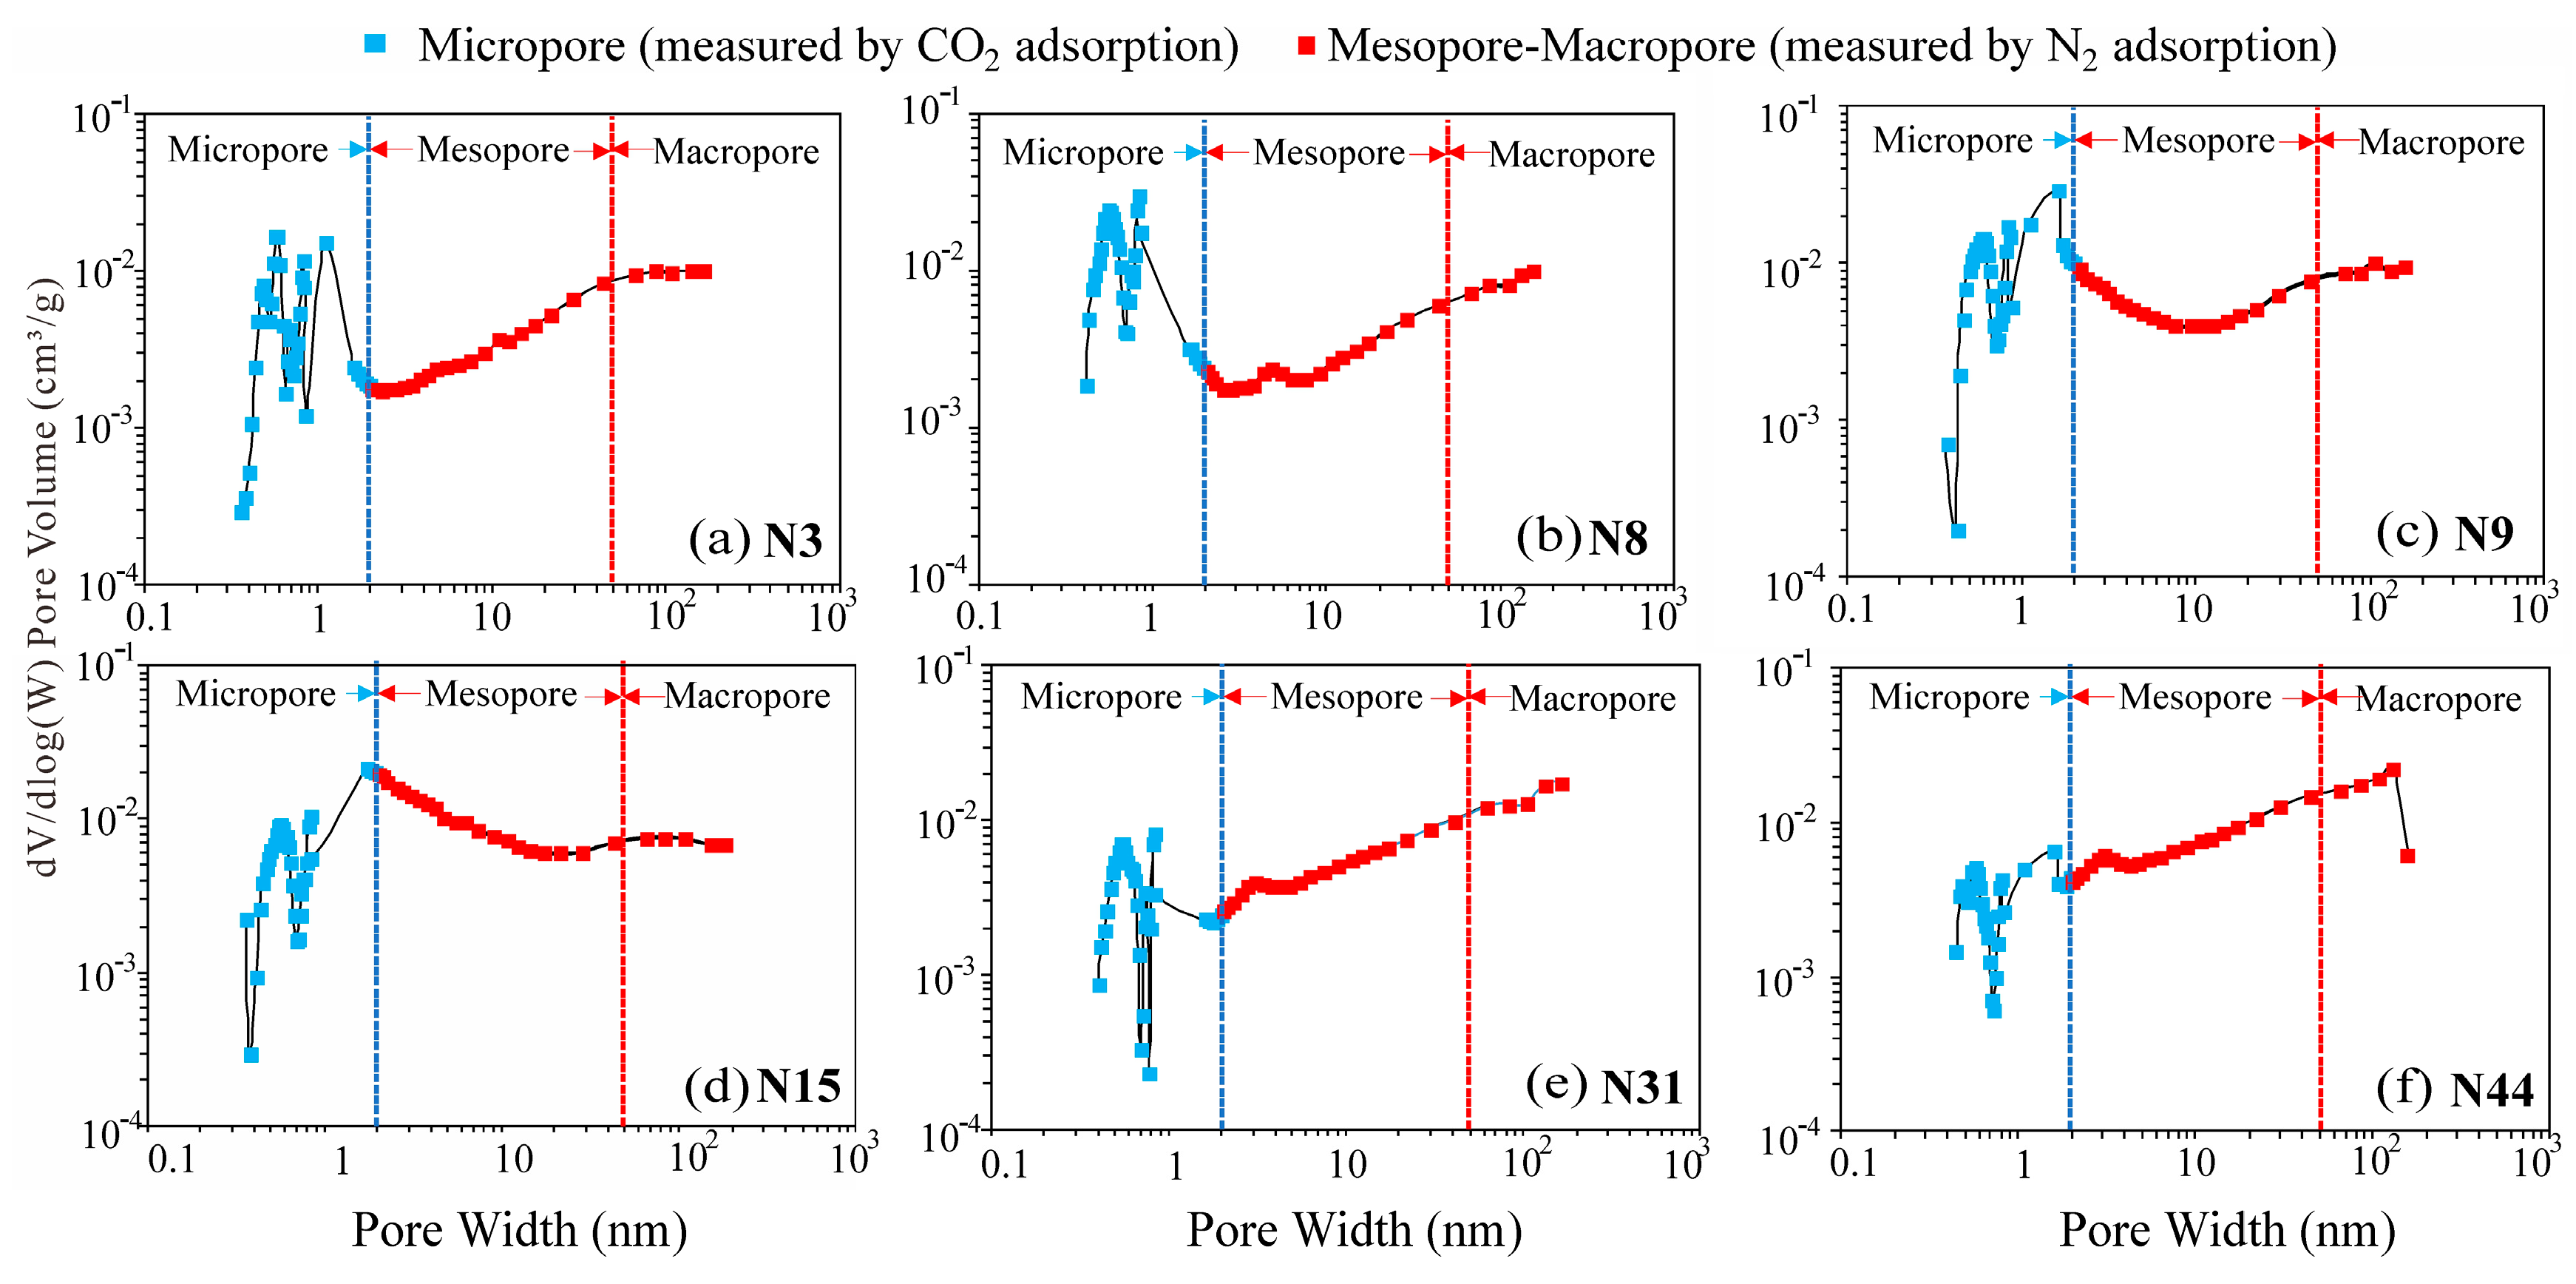
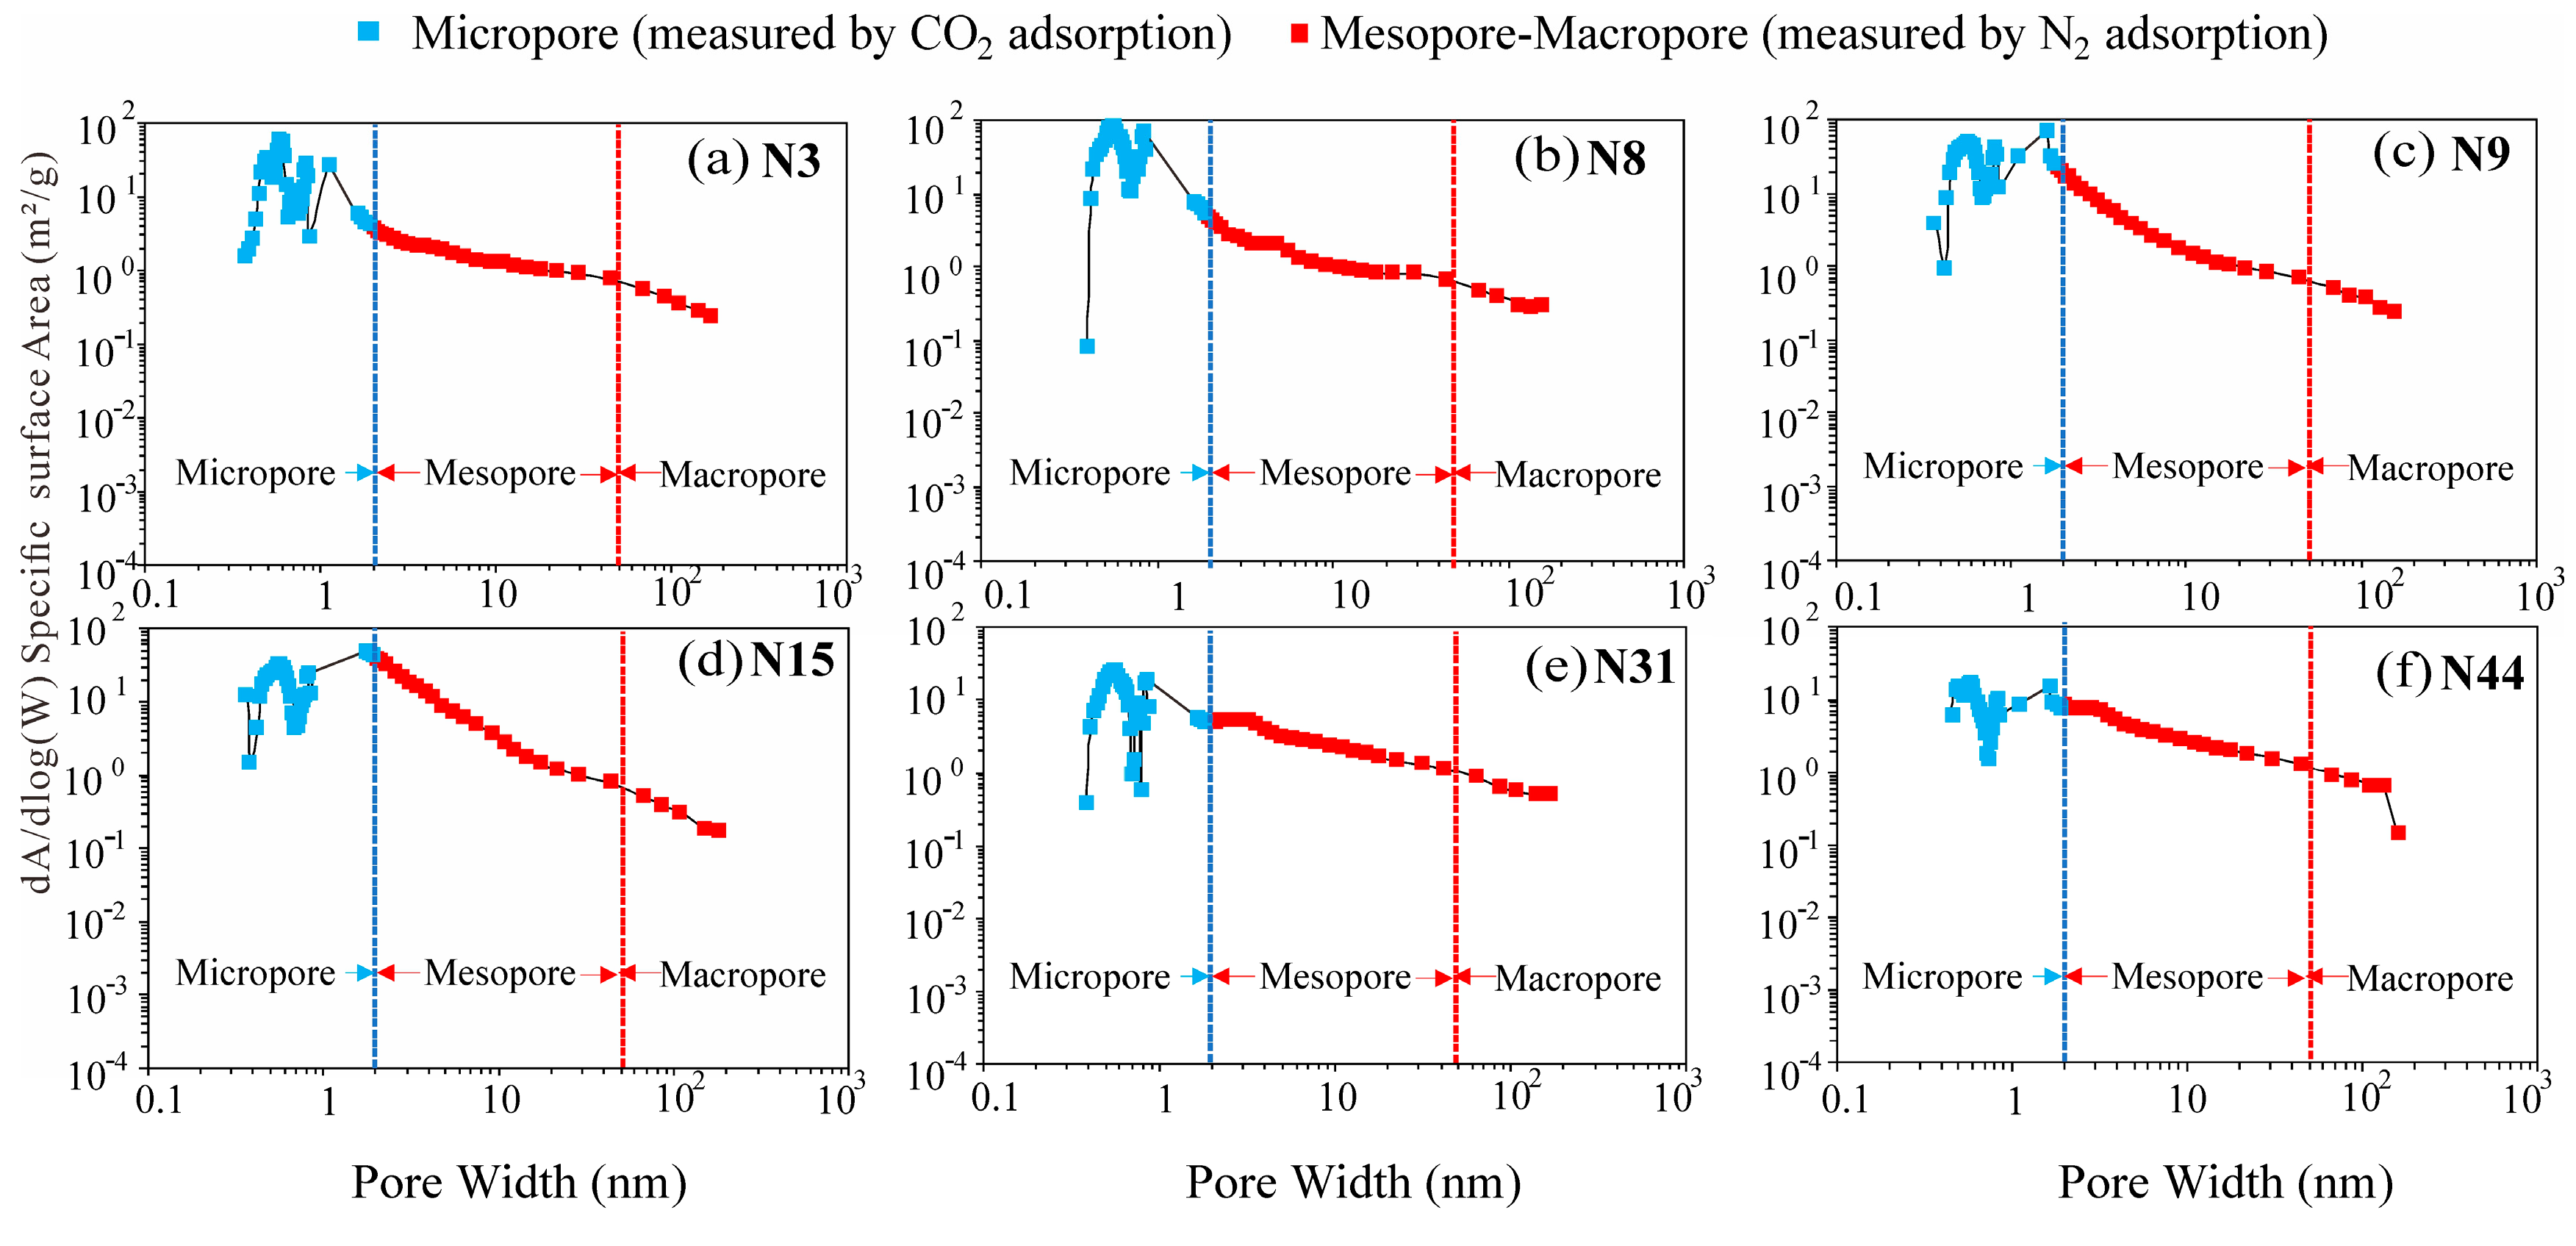
4.2.2. Pore Distribution Characteristics

According to The International Union of Pure and Applied Chemistry (IUPAC), the pores are divided by cutoffs of between 2 nm and 50 nm [48]. The CO2 adsorption curve is a typical type I curve (Figure 7). The CO2 adsorption capacity increases rapidly with pressure in the range of 0–0.007. At this stage, CO2 first enters larger pores for monolayer adsorption. The adsorption rate of CO2 decreases gradually and then stabilizes at pressures > 0.007. This phenomenon is due to multilayer adsorption in smaller pores [49,50].
The N2 adsorption curves are in line with the type IV isotherm, showing that there is an open and continuous nanopore system. According to the classification of hysteresis loop (HL) shapes [51,52] (Figure 8), the HLs of the Chang 7 shale samples are type H3 or a transitional type between type H2 and type H3. These results demonstrate that the pore shapes in the Chang 7 shales are controlled by slit-like pores, and some ink bottle-type pores developed, consistent with the microscopic (Figure 6).
The pore volume (PV) of the micropores ranges from 0.0012 to 0.0044 cm3/g (mean of 0.0028 cm3/g). The specific surface area (SSA) values of the micropores are in the range of 3.68–14.36 m2/g (mean of 8.51 m2/g). The mesopore PVs of N2 adsorption range from 0.0052 to 0.0130 cm3/g (mean of 0.0090 cm3/g). The SSA values of mesopores measured by the BET method are in the range of 1.94–9.83 m2/g (mean of 4.62 m2/g). The PVs of macropores range from 0.0036 to 0.0075 cm3/g (average of 0.0051 cm3/g). The SSA values of macropores are in the range of 0.14–0.31 m2/g (average of 0.21 m2/g). The total PVs range from 0.0129 to 0.0213 cm3/g (mean of 0.0169 cm3/g), and the total SSA values range from 8.81 m2/g to 18.80 m2/g (average of 13.34 m2/g). The total PV and total SSA values are significantly lower than the Nenjiang Formation shale and the Barnett shale in North America, and slightly higher than the Dalong Formation shale from the Sichuan Basin [43,53].
The PSD curve can provide important information, including the pore size range and the contribution of different pores to total PV and SSA [50,54]. Quantitative characterization of PSD can be ascertained by combining the adsorption results of N2 and CO2 (Figure 9 and Figure 10). The PSD shows the multipeak distribution. The main peaks are distributed at 0.4~0.8 nm and 10~100 nm (Figure 9 and Figure 10). Mesopores are the largest contributor to PV, accounting for 53.2%, followed by macropores and micropores, which account for 30.4% and 16.4%, respectively. The average contribution rate of micropores to SSA is 63.8%, that of mesopores is 34.6%, and that of macropores is 1.6%, which all decrease sequentially.

4.3. Oil Content

4.3.1. Geochemical Characteristics

The contents of S1 range from 0.95 mg/g to 3.58 mg/g, with a mean of 1.84 mg/g. The percentages of chloroform bitumen “A” are 0.19–0.90%, with a mean of 0.58%. They are lower than those of the Shahejie Formation and the Lucaogou Formation and similar to those of the second member of the Kongdian Formation and the Qing 1 member [55]. The OSI values range from 16.0 mg/g to 68.1 mg/g (mean of 29.8 mg/g) and decrease with increasing TOC. The range of percentages of saturated hydrocarbons is 24.6–72.3%, the mean is 45.7%, and the range of aromatic hydrocarbon contents is 9.6–22.7%, with an average of 17.1% (Figure 11). These results are similar to those of the Shahejie Formation [55].

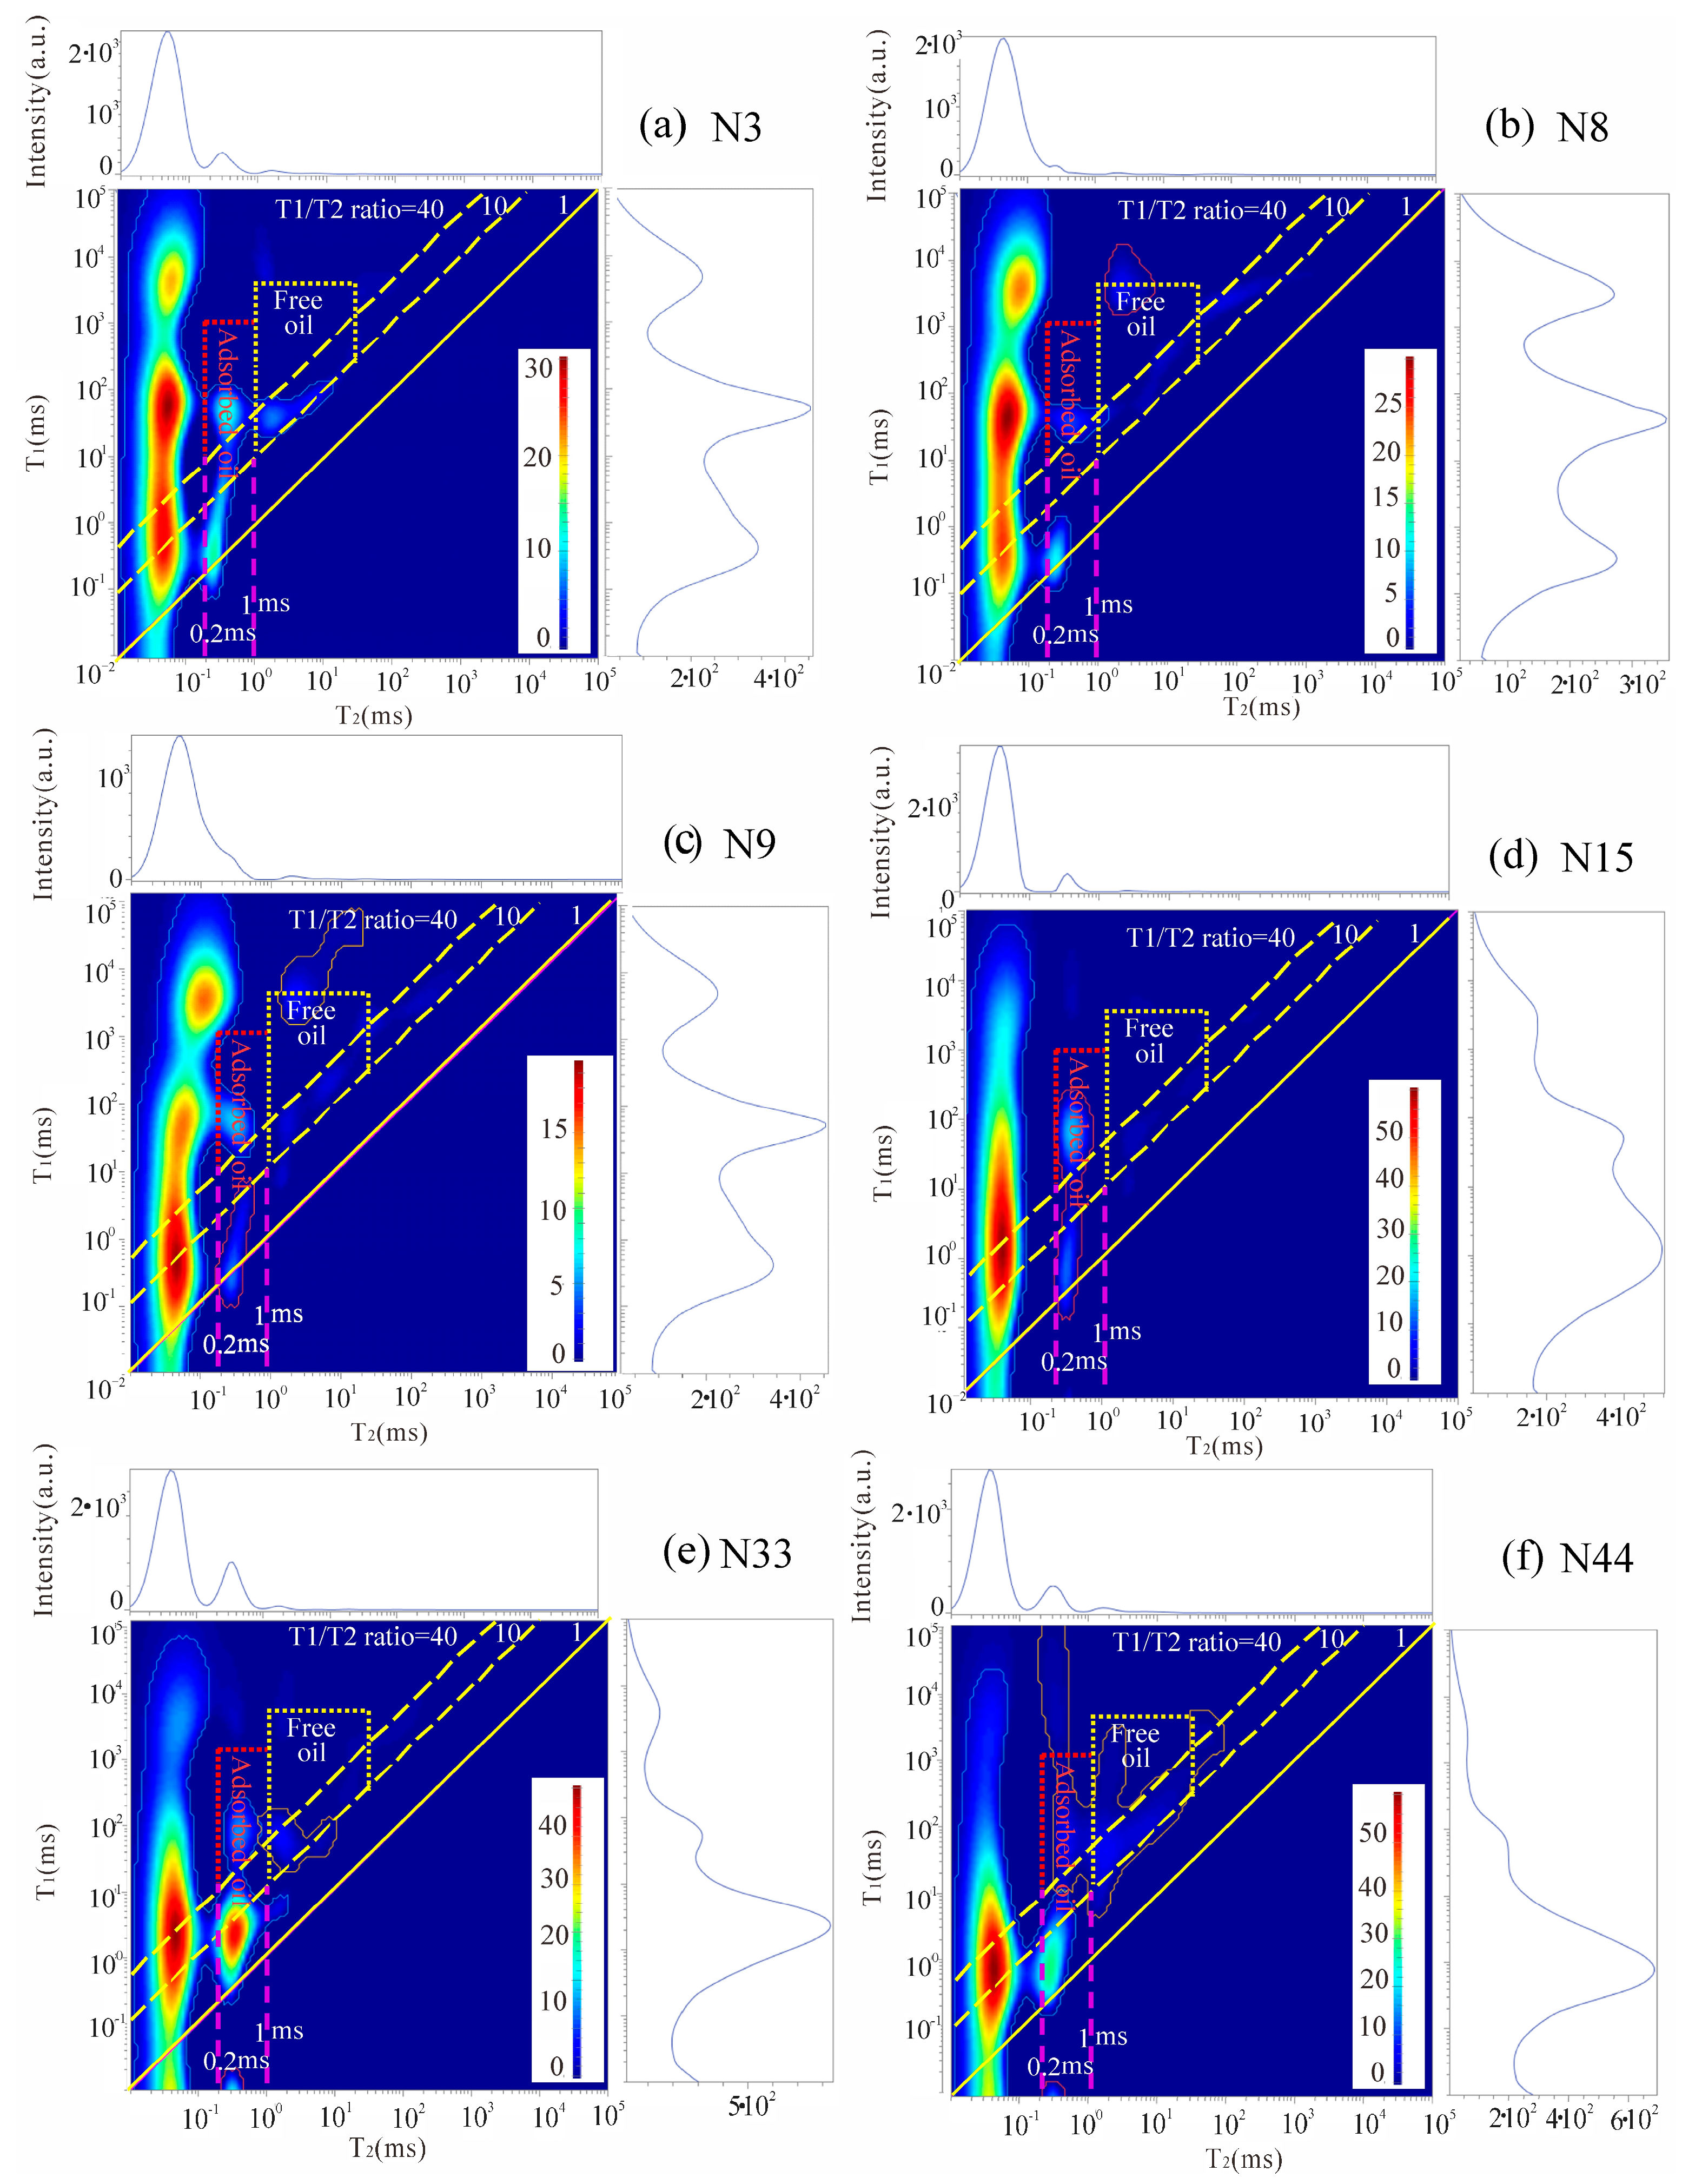
4.3.2. NMR T1–T2 Map

According to the cutoff times of T1 and T2, the NMR T1–T2 map was divided into three regions: kerogen, adsorbed oil, and free oil [33]. The T1–T2 maps (Figure 12) were compared with previous data. The cutoff values were determined: for 0 ms < T2 < 1 ms, T1/T2 > 40 was defined as the range of adsorbed oil, and T2 > 1 ms, T1/T2 > 10 was defined as the range of free oil. Furthermore, the NMR signal intensities of free oil and adsorbed oil were extracted. The NMR signal intensities of total oil range from 17.5 to 35.2 a.u./g of rock, with an average of 26.3 a.u./g of rock. The signal intensities of adsorbed oil range from 7.5 to 23.4 a.u./g of rock, and the proportion ranges from 29.4% to 84.0%, with a mean of 55.8%. The signal intensities of free oil range from 4.4 to 23.2 a.u./g of rock, and the proportions range from 15.9% to 70.6%, with an average of 44.2%. These values are higher than those in other regions of China [55]. The signal intensity of the adsorbed oil has a good correlation with DOM. In addition, the free oil has a good correlation with the OSI. These results show that DOM is dominated by adsorbed oil, consistent with the geochemical characteristics (Figure 13).

5. Discussion

5.1. Effects of Composition on Pore Structure

In this work, the TOC content of six samples shows strong positive correlations with the PV (Figure 14a, R2 = 0.55) and SSA (Figure 14b, R2 = 0.64) of the micropores, whereas the TOC shows a negative relationship with the PV and SSA of mesopores and macropores. The TOC content shows a strong positive correlation with the total PV (R2 = 0.87) and a weak positive relationship with the total SSA (R2 = 0.13). The results indicate that the OM pores in the Longdong area are mostly micropores, and the higher the TOC content, the less developed the mesopores and macropores become, which is due to the low maturity of OM.
Quartz has a negative relationship with the PV (R2 = 0.60) and SSA (R2 = 0.69) of micropores, while quartz is well associated with the PV (R2 = 0.77) and SSA (R2 = 0.42) of mesopores and the PV (R2 = 0.41) and SSA (R2 = 0.40) of macropores. Moreover, quartz is positively correlated with the total PV (Figure 14c, R2 = 0.79) and negatively correlated with the total SSA (Figure 14d, R2 = 0.11). The above relationship indicates that the higher the quartz content is, the more macropores and mesopores there are. This is because a high content of quartz, as a rigid mineral, promotes the conservation of primary pores. Feldspar is well associated with the PV (R2 = 0.40) and SSA (R2 = 0.38) of macropores and is negatively associated with the PVs and SSAs of mesopores and micropores (Figure 14e,f). As a soluble mineral, the higher the feldspar content is, the more developed the dissolved pores. The correlations between carbonate minerals and the PV and SSA are not significant (R2 < 0.2), indicating that pores related to carbonate did not develop (Figure 14g,h). Pyrite is well associated with the PV (R2 = 0.70) and SSA (R2 = 0.81) of micropores but negatively correlated with the PVs (R2 = 0.50 and 0.45) and SSAs (R2 = 0.27 and 0.42) of mesopores and macropores. Furthermore, pyrite is negatively correlated with the total PV (R2 = 0.58) and positively correlated with the total SSA (R2 = 0.12) (Figure 14i,j). The development of pyrite is closely related to micropores. The content of clay minerals is negatively associated with the PV (R2 = 0.68) and SSA (R2 = 0.76) of micropores and positively correlated with the PVs of macropores (R2 = 0.31) and mesopores (R2 = 0.52), indicating that the pores of the related clay are mostly macropores and mesopores (Figure 14k–l).
In general, quartz and clay minerals mainly control the formation of macropores and mesopores. Feldspar mainly controls macropores, while the development of micropores is significantly influenced by pyrite and OM [53].

5.2. Pore Size Characteristics

The experimental data of CO2/N2 adsorption for the extracted and unextracted shale samples were compared, and the pore size of shale oil occurrence was revealed. Figure 15 shows the PSDs of unextracted (black line) and extracted (green line) shale samples. When the pore diameter exceeds 2 nm, the PV of the extracted samples significantly surpasses that of the unextracted samples, indicating that shale oil mainly exists in pores larger than 2 nm.

5.3. Factors Influencing Free Oil

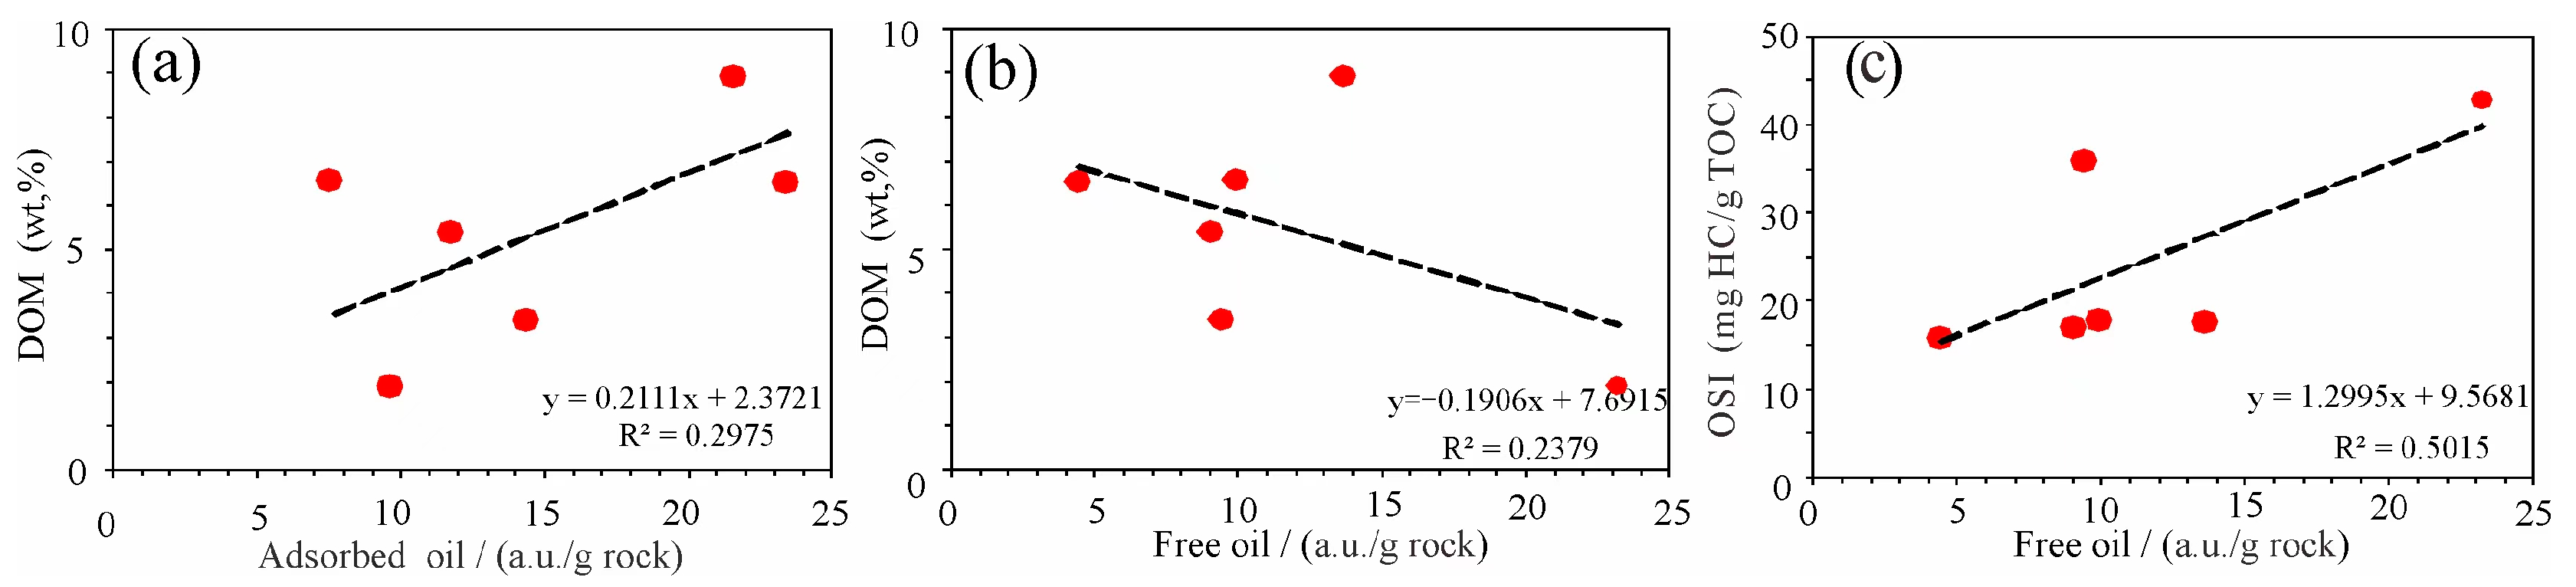
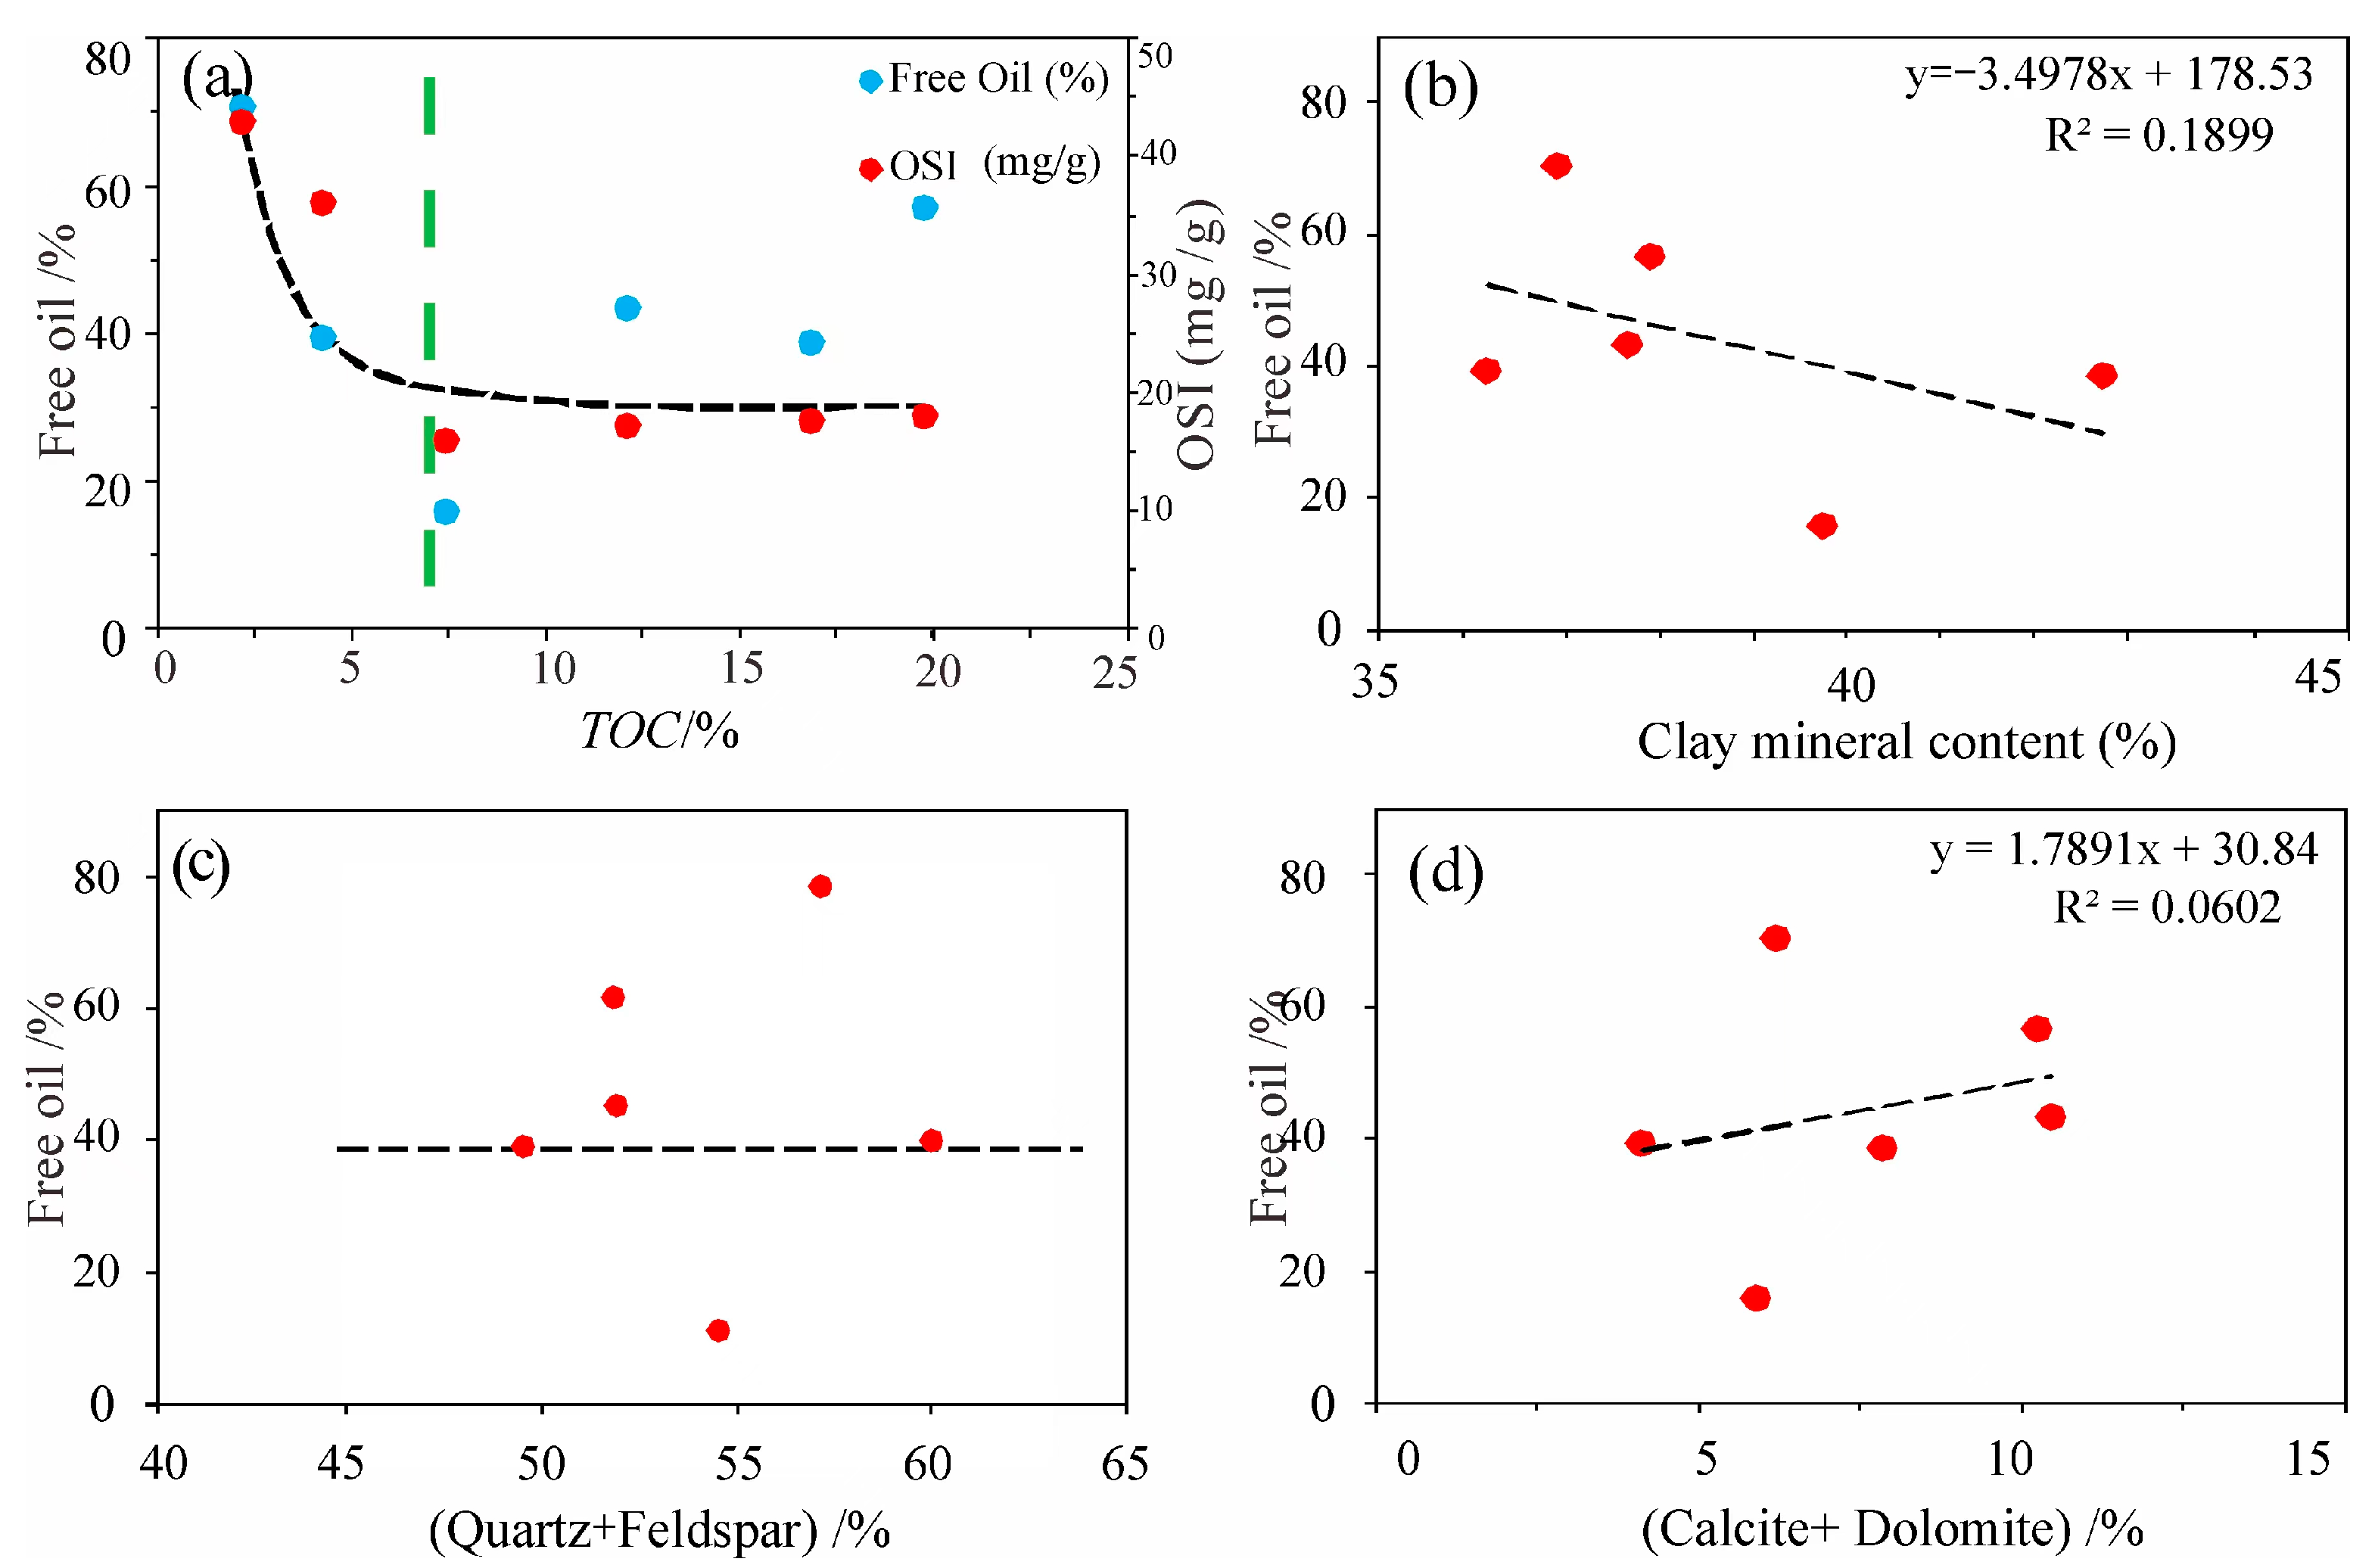
5.3.1. OM Abundance and Mineral Composition

There is a significant negative correlation between the proportion of free oil and the TOC (Figure 16a). In particular, when the TOC > 7%, the ratio of free oil significantly decreases. Due to the strong interaction between OM/kerogen and oil, a considerable amount of oil is adsorbed and swelled by kerogen [56]. Thus, high OM abundance leads to the poor mobility of shale oil.
Compared with other minerals, clay minerals have a higher crude oil adsorption capacity [57,58]. Therefore, the stronger adsorption capacity of minerals to crude oil leads to reduced oil mobility. The mineral effects are displayed in Figure 17. The proportion of free oil has no obvious correlation with carbonate minerals (calcite + dolomite) and silicate minerals (quartz + feldspar) and is negatively correlated with the clay mineral content (Figure 16b–d).

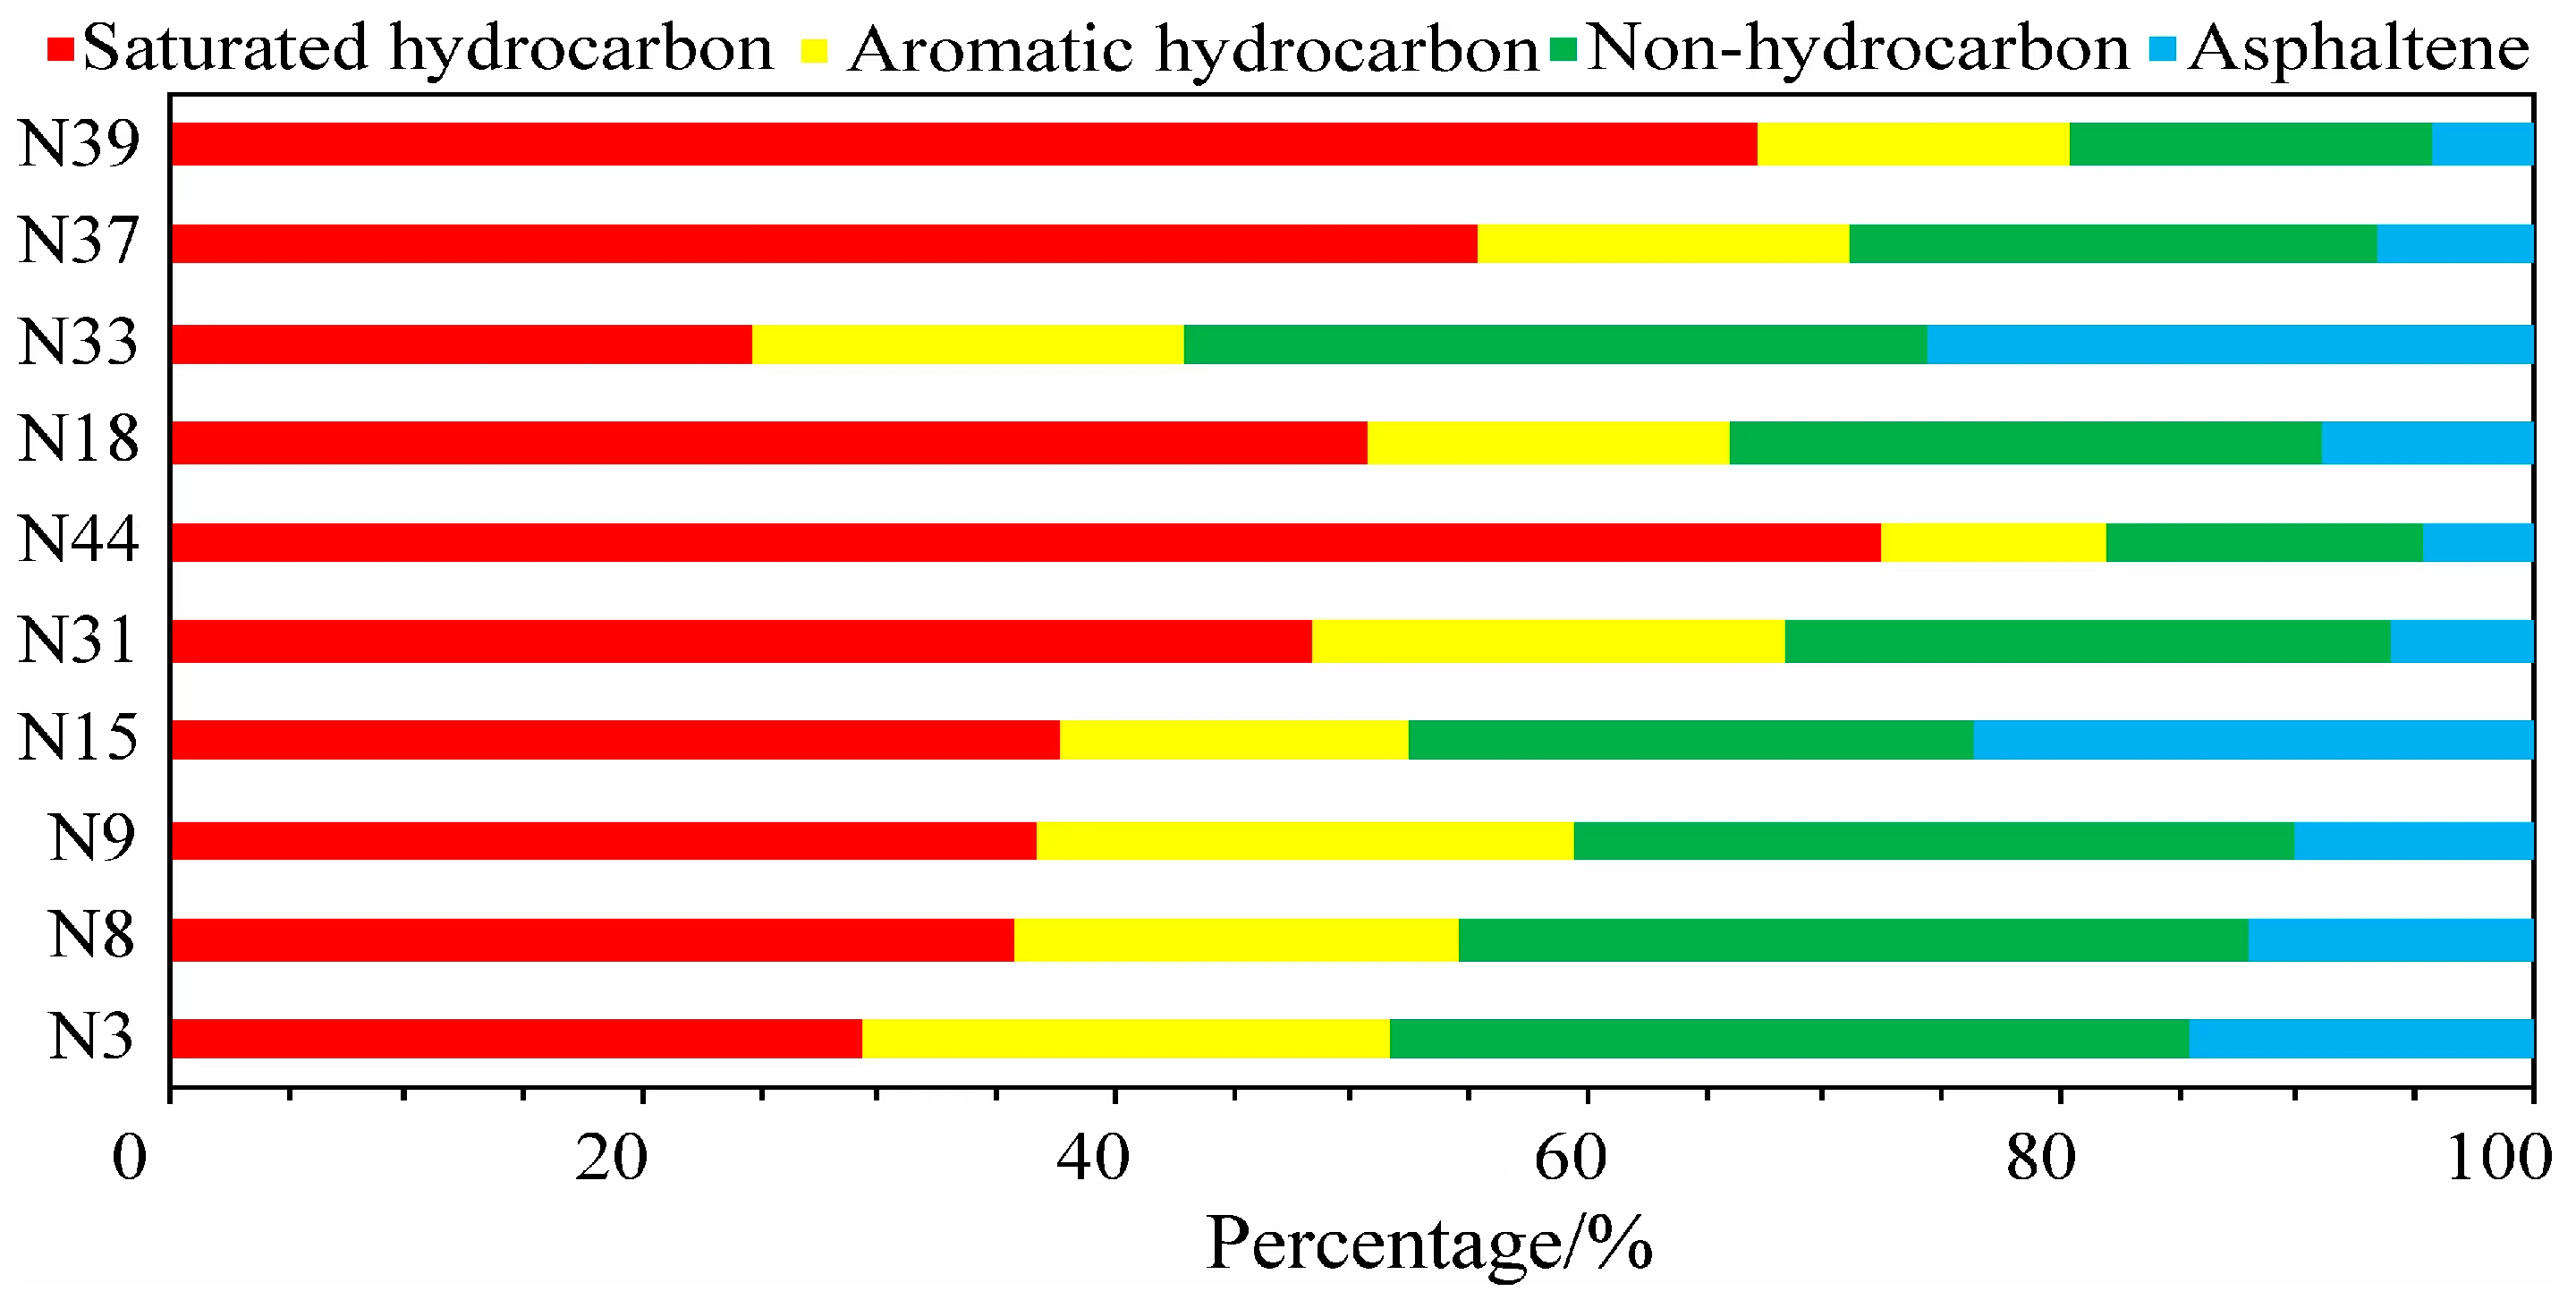
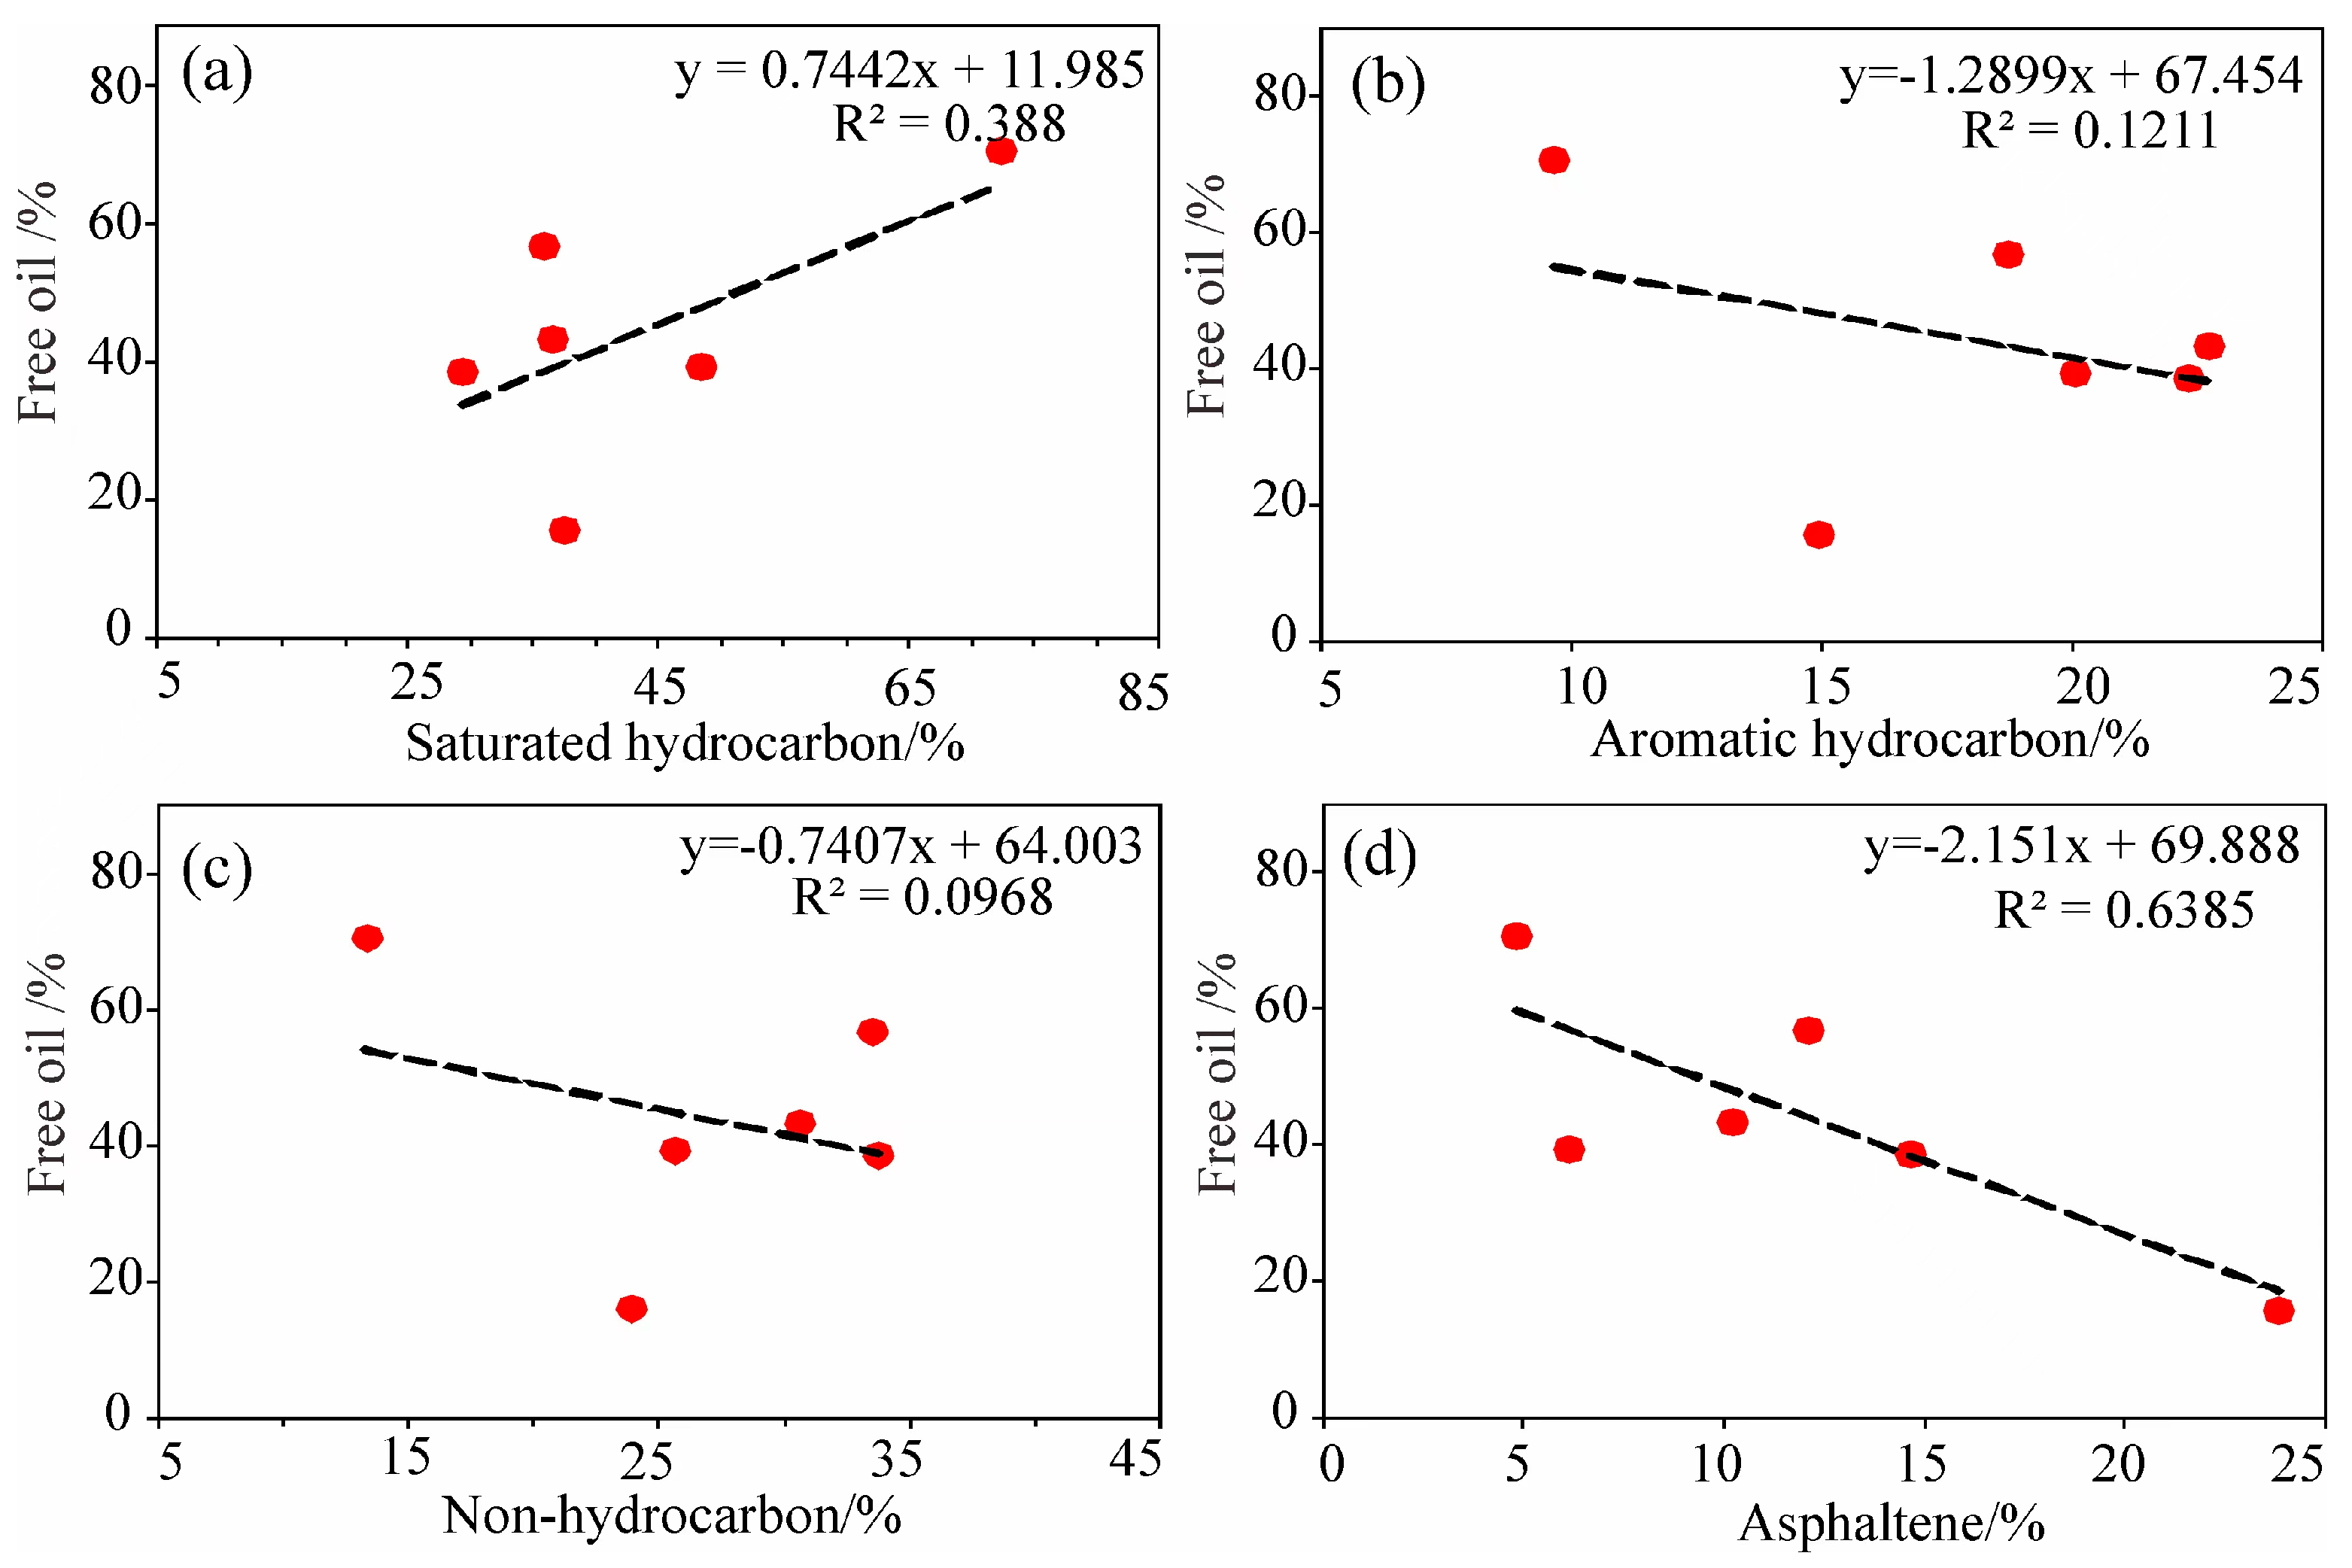
5.3.2. Shale Oil Composition

The relationship between shale oil properties and free oil is also reflected in the characteristics of the shale oil components. The viscosity of oil is inversely proportional to the content of saturated hydrocarbons. Moreover, non-hydrocarbons and asphaltenes are more easily adsorbed on the mineral surface, making the mineral surface lipophilic and thus increasing the resistance of the flow of crude oil. In this work, the proportion of free oil in Chang 7 shale oil is positively correlated with saturated hydrocarbons and negatively correlated with the other components (Figure 17).

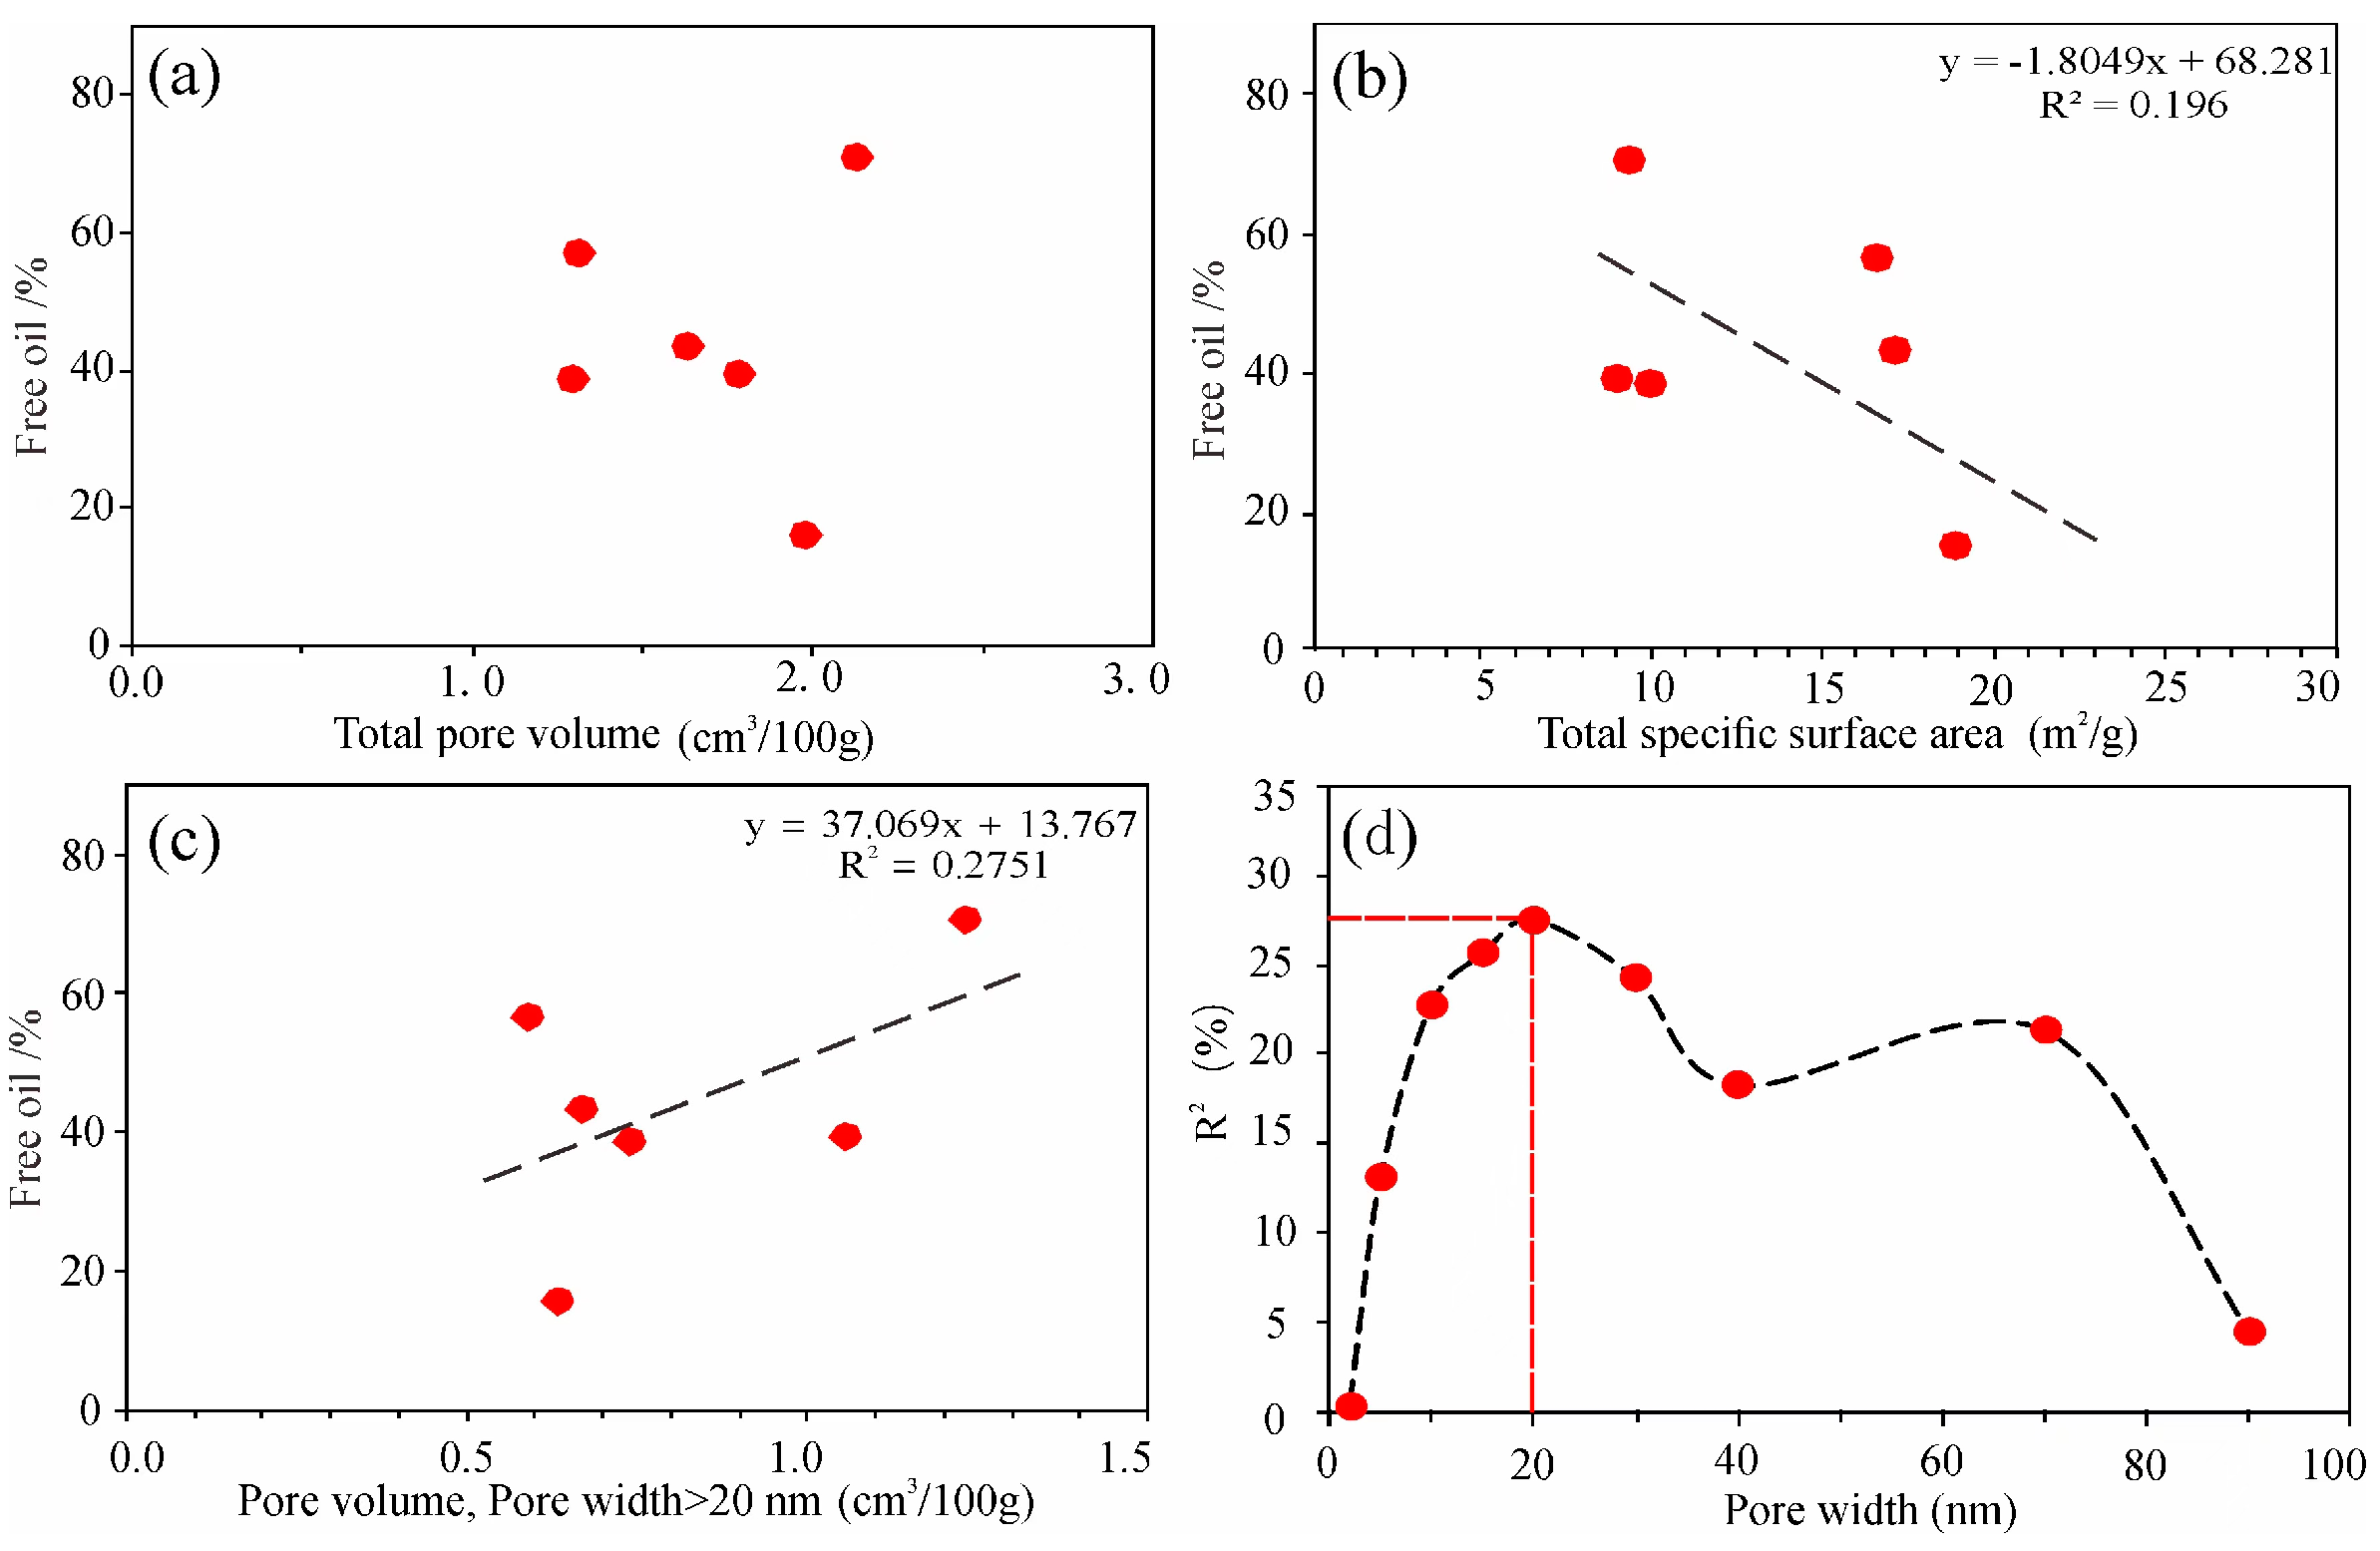
5.3.3. Pore Volume and Pore Surface Area

From the optical microscope fluorescence and SEM images, large amounts of algae, bituminite, and exsudatinite are distributed in the InterP pores of the laminae, emitting bright yellow fluorescence. Figure 18a shows that there is no obvious correlation between the proportion of free oil and total PV. Thus, the relationship between PVs is larger than a certain pore size (2, 5, 10, 15, 20, 30, 40, 70, and 90 nm). The proportion of free oil has the highest correlation with PVs larger than 20 nm, suggesting that free oil mainly occurs in pores larger than 20 nm (Figure 18c,d). The proportion of free oil is significantly negatively correlated with the SSA (Figure 18b). This is mainly because the larger the SSA is, the more adsorption sites there are on the pore surface, with a higher proportion of adsorbed oil [32].

5.4. Modes of Occurrence of Shale Oil

Based on the above analysis, the adsorbed oil and free oil in Chang 7 shale oil have different distributions for different pore sizes. The occurrence modes in various pores were preliminarily established (Figure 19). The InterP pores are mainly macropores associated with minerals, mainly containing free oil. Since the fracture pores are mainly mesopores to macropores in size, the fracture pores mainly contain free oil. The pore size of the IntraP pores can reach hundreds of nanometers, and the proportion of free oil gradually increases with increasing pore size. For pores of the same size, the proportion of adsorbed oil in the IntraP pores is higher than that in the InterP pores due to the strong adsorption capacity of clay minerals. OM pores mainly contain adsorbed oil.

6. Conclusions

(1)
According to the analysis of the TOC, mineral composition, and rock structure, two types of shale lithofacies are identified: OM-rich laminated felsic shale and OM-rich massive felsic mudstone;
(2)
The pore space is composed of IntraP pores, InterP pores, fracture pores, and OM pores. The pore shape is predominantly slit-type pores. Micropore development is primarily influenced by OM and pyrite. The development of macropores and mesopores is influenced by quartz and clay minerals. Feldspar mainly controls macropores;
(3)
Based on the T1–T2 map, the free oil content was obtained, which has good consistency with the OSI. The proportion of free oil is inversely correlated with the TOC and clay mineral contents but positively related to the saturated hydrocarbon and PV values of pores larger than 20 nm;
(4)
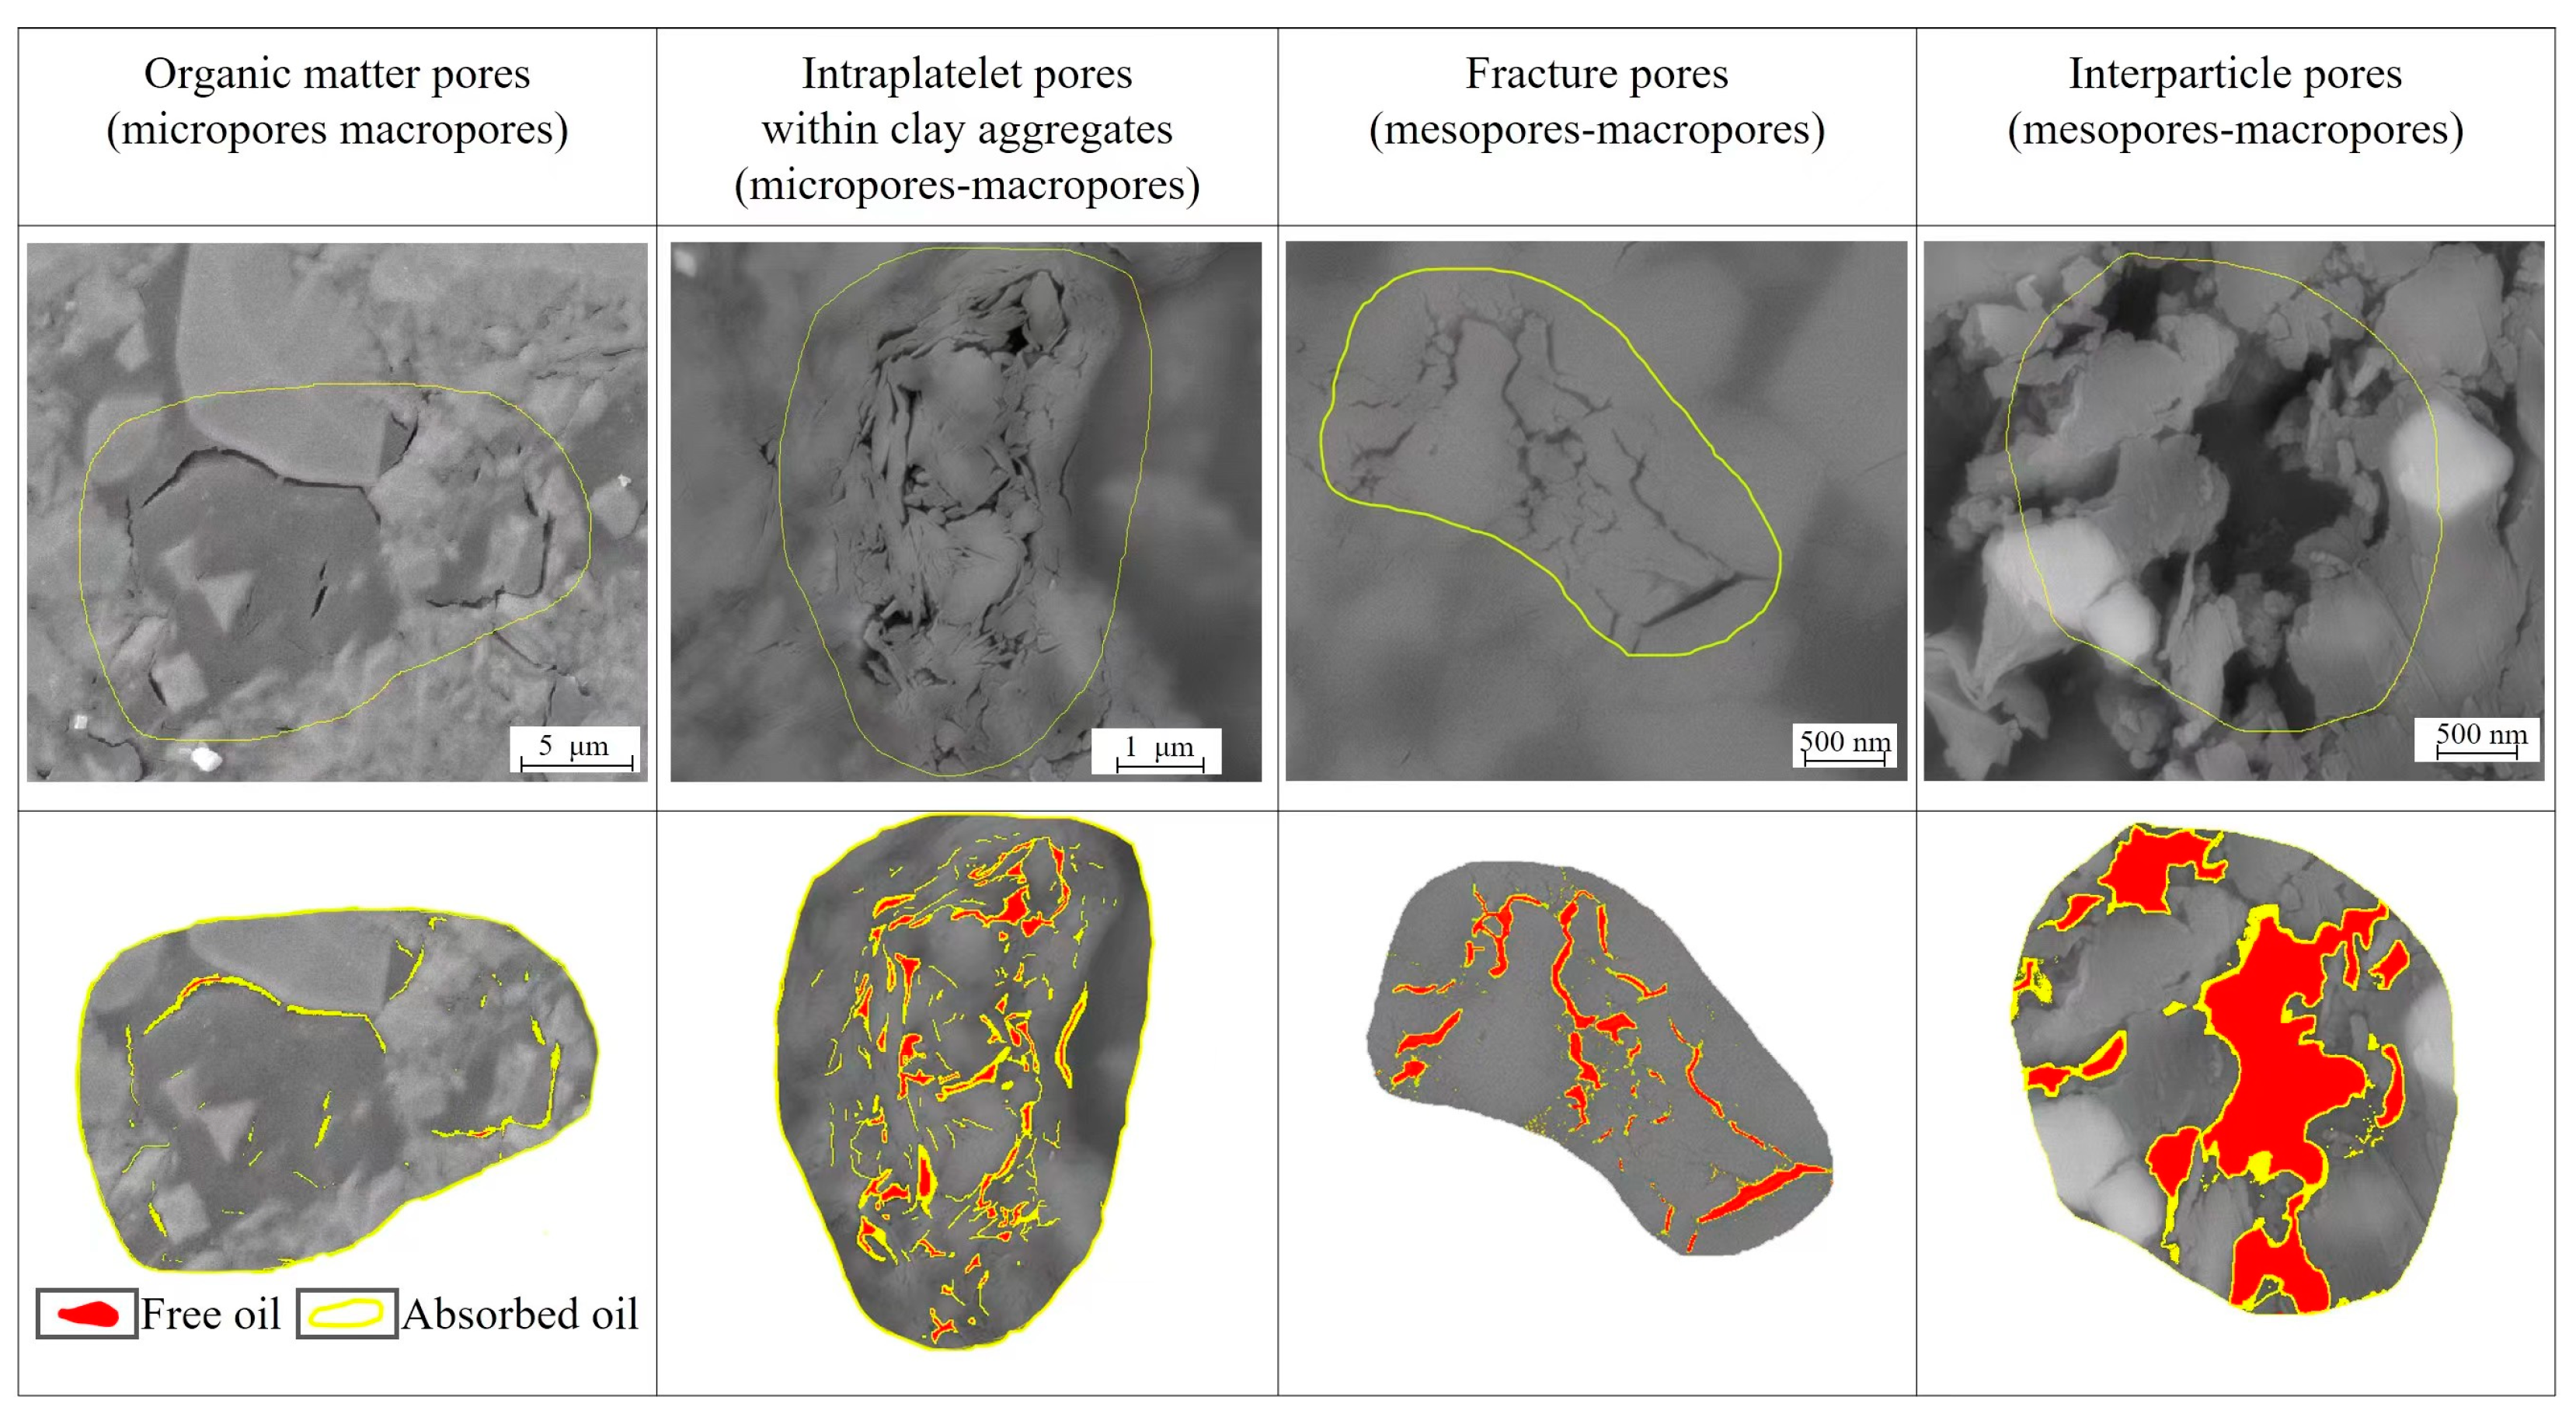
The modes of shale oil occurrence in various pores were preliminarily established. OM pores mainly contain adsorbed oil. InterP pores and fracture pores are mainly occupied by free oil. The proportion of adsorbed oil in the IntraP pores is higher than that in the InterP pores of the same size. These findings help us to preliminarily understand the mode of shale oil occurrence. The next step involves quantitatively characterizing the mode of shale oil occurrence.

Author Contributions

Conceptualization, project administration, funding acquisition, Z.W.; writing—review and editing, W.T.; software, Z.Z.; validation and resources, Z.Z., X.Z. (Xinping Zhou) and K.Z.; formal analysis, H.G.; investigation, Y.Y. and Y.L.; data curation, X.Z. (Xiaoyin Zheng); writing—original draft preparation, Y.F.; supervision, Z.W. and W.T. All authors have read and agreed to the published version of the manuscript.

Funding

This research was funded by the National Natural Science Foundation of China (Grant Nos. 42202187 and 42272160).

Data Availability Statement

Not applicable.

Acknowledgments

The authors wish to thank PetroChina Changqing Oilfield Company for giving us access to the core samples.

Conflicts of Interest

The authors declare no conflict of interest.

References

  1. Kinley, T.J.; Cook, L.W.; Breyer, J.A.; Jarvie, D.M.; Busbey, A.B. Hydrocarbon potential of the Barnett Shale (Mississippian), Delaware Basin, west Texas and southeastern New Mexico. AAPG Bull. 2008, 92, 967–991. [Google Scholar] [CrossRef]
  2. Jarvie, D.M. Shale resource systems for oil and gas: Part 1—Shale-oil resource systems. AAPG Mem. 2012, 97, 69–87. [Google Scholar]
  3. Jarvie, D.M. Shale resource systems for oil and gas: Part 2—Shale-oil resource systems. AAPG Mem. 2012, 97, 89–119. [Google Scholar]
  4. Kuhn, P.P.; di Primio, R.; Hill, R.; Lawrence, J.R.; Horsfield, B. Three-dimensional modeling study of the low-permeability petroleum system of the Bakken Formation. AAPG Bull. 2012, 96, 1867–1897. [Google Scholar] [CrossRef]
  5. Kirschbaum, M.A.; Mercier, T.J. Controls on the deposition and preservation of the Cretaceous Mowry Shale and Frontier Formation and equivalents, Rocky Mountain region, Colorado, Utah, and Wyoming. AAPG Bull. 2013, 97, 899–921. [Google Scholar] [CrossRef]
  6. Kuuskraa, V.; Stevens, S.H.; Moodhe, K.D. Technically Recoverable Shale Oil and Shale Gas Resources: An Assessment of 137 Shale Formations in 41 Countries Outside the United States; U.S. Energy Information Administration: Washington, DC, USA, 2013. [Google Scholar]
  7. Sun, L.D.; Liu, H.; He, W.; LI, G.; Zhang, S.; Zhu, R.; Jin, X.; Meng, S.; Jiang, H. An analysis of major scientific problems and research paths of Gulong shale oil in Daqing Oilfield, NE China. Pet. Explor. Dev. 2021, 48, 453–463. [Google Scholar] [CrossRef]
  8. Bai, L.H.; Liu, B.; Chi, Y.A.; Li, S.C.; Wen, X. 2D NMR studies of fluids in organic-rich shale from the Qingshankou Formation, Songliao Basin. Oil Gas Geol. 2021, 42, 1389–1400. [Google Scholar] [CrossRef]
  9. Loucks, R.G.; Reed, R.M.; Ruppel, S.C.; Jarvie, D.M. Morphology, genesis, and distribution of nanometer-scale pores in siliceous mudstones of the mississippian barnett shale. J. Sediment. Res. 2009, 79, 848–861. [Google Scholar] [CrossRef]
  10. Loucks, R.G.; Reed, R.M.; Ruppel, S.C.; Hammes, U. Spectrum of pore types and networks in mudrocks and a descriptive classification for matrix-related mudrock pores. AAPG Bull. 2012, 96, 1071–1098. [Google Scholar] [CrossRef]
  11. Bernard, S.; Horsfield, B.; Schulz, H.-M.; Wirth, R.; Schreiber, A.; Sherwood, N. Geochemical evolution of organic-rich shales with increasing maturity: A STXM and TEM study of the Posidonia Shale (Lower Toarcian, northern Germany). Mar. Pet. Geol. 2012, 31, 70–89. [Google Scholar] [CrossRef]
  12. Tiwari, P.; Deo, M.; Lin, C.L.; Miller, J.D. Characterization of oil shale pore structure before and after pyrolysis by using X-ray micro CT. Fuel 2013, 107, 547–554. [Google Scholar] [CrossRef]
  13. Li, W.; Lu, S.; Xue, H.; Zhang, P.; Hu, Y. Microscopic pore structure in shale reservoir in the argillaceous dolomite from the Jianghan Basin. Fuel 2016, 181, 1041–1049. [Google Scholar] [CrossRef]
  14. Lu, S.F.; Xue, H.T.; Wang, M.; Xiao, D.; Huang, W.; Li, J.; Xie, L.; Tian, S.; Wang, S.; Wang, W.; et al. Several key issues and research trends in evaluation of shale oil. Acta Pet. Sin. 2016, 37, 1309–1322. [Google Scholar] [CrossRef]
  15. Li, J.; Lu, S.; Jiang, C.; Wang, M.; Chen, Z.; Chen, G.; Li, J.; Lu, S. Characterization of shale pore size distribution by NMR considering the influence of shale skeleton signals. Energy Fuels 2019, 33, 6361–6372. [Google Scholar] [CrossRef]
  16. Li, M.; Chen, Z.; Ma, X.; Cao, T.; Qian, M.; Jiang, Q.; Tao, G.; Li, Z.; Song, G. Shale oil resource potential and oil mobility characteristics of the Eocene-Oligocene Shahejie Formation, Jiyang Super-Depression, Bohai Bay Basin of China. Int. J. Coal Geol. 2019, 204, 130–143. [Google Scholar] [CrossRef]
  17. Xiao, D.; Jiang, S.; Thul, D.; Huang, W.; Lu, Z.; Lu, S. Combining rate-controlled porosimetry and NMR to probe full-range pore throat structures and their evolution features in tight sands: A case study in the Songliao Basin, China. Mar. Pet. Geol. 2017, 83, 111–123. [Google Scholar] [CrossRef]
  18. Tian, W.; Lu, S.; Huang, W.; Wang, S.; Gao, Y.; Wang, W.; Li, J.; Xu, J.; Zhan, Z. Study on the full-range pore size distribution and the movable oil distribution in glutenite. Energy Fuels 2019, 33, 7028–7042. [Google Scholar] [CrossRef]
  19. O’Brien, N.R.; Cremer, M.D.; Canales, D.G. The role of argillaceous rock fabric in primary migration of oil. Gulf Coast Assoc. Geol. Soc. Trans. 2002, 52, 1103–1112. [Google Scholar]
  20. Wu, S.T.; Zou, C.N.; Zhu, R.K.; Yuan, X.; Yao, J.; Yang, Z.; Sun, L.; Bai, B. Reservoir quality characterization of upper triassic Chang 7 shale in Ordos basin. Earth Sci. 2015, 40, 1810–1823. [Google Scholar]
  21. Wang, M.; Zhang, F.; Liu, Y.; Guan, H.; Li, J.; Shao, L.; Yang, S.; She, Y. Quantitative research on tight oil microscopic state of Chang 7 Member of Triassic Yanchang Formation in Ordos Basin, NW China. Pet. Explor. Dev. 2015, 42, 827–832. [Google Scholar] [CrossRef]
  22. Wang, X.; Sun, L.; Zhu, R.; Jin, X.; Li, J.; Wu, S.; Bi, L.; Liu, X. Application of charging effects in evaluating storage space of tight reservoirs: A case study from Permian Lucaogou Formation in Jimusar sag, Junggar Basin, NW China. Pet. Explor. Dev. 2015, 42, 516–524. [Google Scholar] [CrossRef]
  23. Kassem, A.A.; Hussein, W.S.; Radwan, A.E.; Anani, N.; Abioui, M.; Jain, S.; Shehata, A.A. Petrographic and diagenetic study of siliciclastic Jurassic sediments from the Northeastern Margin of Africa: Implication for reservoir quality. J. Pet. Sci. Eng. 2021, 200, 108340. [Google Scholar] [CrossRef]
  24. Radwan, A.E.; Husinec, A.; Benjumea, B.; Kassem, A.A.; Abd El Aal, A.K.; Hakimi, M.H.; Thanh, H.V.; Abdel-Fattah, M.I.; Shehata, A.A. Diagenetic overprint on porosity and permeability of a combined conventional-unconventional reservoir: Insights from the Eocene pelagic limestones, Gulf of Suez, Egypt. Mar. Pet. Geol. 2022, 146, 105967. [Google Scholar] [CrossRef]
  25. Qian, M.H.; Jiang, Q.G.; Li, M.W.; Ma, Y.Y.; Li, Z.M.; Liu, P.; Cao, T.T.; Ma, X.X. Quantitative characterization of extractable organic matter in lacustrine shale with different occurrences. Pet. Geol. Exp. 2017, 39, 278–286. [Google Scholar]
  26. Zhang, H.; Huang, H.; Li, Z.; Liu, M. Comparative study between sequential solvent-extraction and multiple isothermal stages pyrolysis: A case study on Eocene Shahejie Formation shales, Dongying Depression, East China. Fuel 2020, 263, 116591. [Google Scholar] [CrossRef]
  27. Li, S.X.; Zhou, X.P.; Guo, Q.H.; Liu, J.P.; Liu, J.Y.; Li, S.T.; Wang, B.; Lv, Q.Q. Research on evaluation method of movable hydrocarbon resources of shale oil in the Chang 73 sub-member in the Ordos Basin. Nat. Gas Geosci. 2021, 32, 1771–1784. [Google Scholar]
  28. Xue, H.T.; Tian, S.S.; Lu, S.F.; Zhang, W.H.; Du, T.T.; Mu, G.D. Selection and verification of key parameters in the quantitative evaluation of shale oil: A case study at the Qingshankou formation, Northern Songliao Basin. Bull. Mineral. Petrol. Geochem. 2015, 34, 70–78. [Google Scholar]
  29. Huang, Z.L.; Hao, Y.Q.; Li, S.J.; Wo, Y.; Sun, D.; Li, M.; Chen, J. Oil-bearing potential, mobility evaluation and significance of shale oil in Chang 7 shale system in the Ordos Basin: A case study of well H317. Oil Shale 2020, 47, 210–219. [Google Scholar]
  30. Chen, G.; Lu, S.; Zhang, J.; Pervukhina, M.; Liu, K.; Wang, M.; Han, T.; Tian, S.; Li, J.; Zhang, Y.; et al. A method for determining oil-bearing pore size distribution in shales: A case study from the Damintun Sag, China. J. Pet. Sci. Eng. 2018, 166, 673–678. [Google Scholar] [CrossRef]
  31. Qi, Y.; Ju, Y.; Cai, J.; Gao, Y.; Zhu, H.; Hunag, C.; Wu, J.; Meng, S.; Chen, W. The effects of solvent extraction on nanoporosity of marine-continental coal and mudstone. Fuel 2019, 235, 72–84. [Google Scholar] [CrossRef]
  32. Li, J.; Huang, W.; Lu, S.; Wang, M.; Chen, G.; Tian, W.; Guo, Z. Nuclear magnetic resonance T 1–T 2 map division method for hydrogen-bearing components in continental shale. Energy Fuels 2018, 32, 9043–9054. [Google Scholar] [CrossRef]
  33. Li, J.; Jiang, C.; Wang, M.; Lu, S.; Chen, Z.; Chen, G.; Li, J.; Li, Z.; Lu, S. Adsorbed and free hydrocarbons in unconventional shale reservoir: A new insight from NMR T1-T2 maps. Mar. Pet. Geol. 2020, 116, 104311. [Google Scholar] [CrossRef]
  34. Yang, R.; Fan, A.; Han, Z.; van Loon, A.J. Lithofacies and origin of the Late Triassic muddy gravity-flow deposits in the Ordos Basin, central China. Mar. Pet. Geol. 2017, 85, 194–219. [Google Scholar] [CrossRef]
  35. Sun, N.; Chen, T.; Zhong, J.; Gao, J.; Shi, X.; Xue, C.; Swennen, R. Petrographic and geochemical characteristics of deep-lacustrine organic-rich mudstone and shale of the Upper Triassic Chang 7 member in the southern Ordos Basin, northern China: Implications for shale oil exploration. J. Asian Earth Sci. 2022, 227, 105118. [Google Scholar] [CrossRef]
  36. Jia, C.; Zou, C.; Li, J.; Li, D.; Zheng, M. Assessment criteria, main types, basic features and resource prospects of the tight oil in China. Acta Pet. Sin. 2012, 33, 343–350. [Google Scholar]
  37. Jin, Z. Origin, Types and Distribution Characteristics of Shale Oil in China; International Symposium on Shale Oil Exploration Technology: Wuxi, China, 2012. [Google Scholar]
  38. Zhang, H.; Huang, H.; Yin, M. Investigation on Oil Physical States of Hybrid Shale Oil System: A Case Study on Cretaceous Second White Speckled Shale Formation from Highwood River Outcrop, Southern Alberta. Minerals 2022, 12, 802. [Google Scholar] [CrossRef]
  39. Liu, B.; Sun, J.; Zhang, Y.; He, J.; Fu, X.; Yang, L.; Xing, J.; Zhao, X. Reservoir space and enrichment model of shale oil in the first member of Cretaceous Qingshankou Formation in the Changling Sag, southern Songliao Basin, NE China. Pet. Explor. Dev. 2021, 48, 608–624. [Google Scholar] [CrossRef]
  40. Wang, Y.; Wang, X.; Song, G.; Liu, H.; Zhu, D.; Zhu, D.; Ding, J.; Yang, W.; Yin, Y.; Zhang, S.; et al. Genetic connection between mud shale lithofacies and shale oil enrichment in Jiyang Depression, Bohai Bay Basin. Pet. Explor. Dev. 2016, 43, 759–768. [Google Scholar] [CrossRef]
  41. Xi, K.; Li, K.; Cao, Y.; Lin, M.; Niu, X.; Zhu, R.; Wei, X.; You, Y.; Liang, X.; Feng, S. Laminae combination and shale oil enrichment patterns of Chang 73 sub-member organic-rich shales in the Triassic Yanchang Formation, Ordos Basin, NW China. Pet. Explor. Dev. 2020, 47, 1342–1353. [Google Scholar] [CrossRef]
  42. Kong, Q.F. The organic maceral characteristic of Yanchang source rock in Ordos Basin. Xinjiang Pet. Geol. 2007, 28, 163–166. [Google Scholar]
  43. Rouquerol, J.; Avnir, D.; Fairbridge, C.W.; Everett, D.H.; Haynes, J.H.; Pernicone, N.; Ramsay, J.D.F.; Sing, K.S.W.; Unger, K.K. Physical chemistry division commission on colloid and surface chemistry, subcommittee on characterization of porous solids: Recommendations for the characterization of porous solids. Pure Appl. Chem. 1994, 66, 1739–1758. [Google Scholar] [CrossRef]
  44. Wang, Y.; Liang, J.; Zhang, J.; Zhao, B.; Zhao, Y.; Liu, X.; Xia, D. Resource potential and exploration direction of Gulong shale oil in Songliao Basin. Pet. Geol. Oilfield Dev. Daqing 2020, 39, 20–34. [Google Scholar]
  45. Gao, Y.; Ye, Y.P.; He, J.X.; Qian, G.B.; Qin, J.H.; Li, Y.Y. Development practice of continental shale oil in Jimsar sag in the Junggar Basin. China Pet. Explor. 2020, 25, 133–141. [Google Scholar]
  46. Zhou, L.; Zhao, X.; Chai, G.; Jiang, W.; Pu, X.; Wang, X.; Han, W.; Guan, Q.; Feng, J.; Liu, X. Key exploration & development technologies and engineering practice of continental shale oil: A case study of Member 2 of Paleogene Kongdian Formation in Cangdong Sag, Bohai Bay Basin, East China. Pet. Explor. Dev. 2020, 47, 1138–1146. [Google Scholar] [CrossRef]
  47. He, W.Y.; Meng, Q.A.; Feng, Z.H.; Zhang, J.; Wang, R. In-situ accumulation theory and exploration & development practice of Gulong shale oil in Sonaliao Basin. Acta Pet. Sin. 2022, 43, 1–14. [Google Scholar]
  48. Hu, Q.; Quintero, R.P.; El-Sobky, H.F.; Kang, J.; Zhang, T. Coupled nano-petrophysical and organic-geochemical study of the Wolfberry Play in Howard County, Texas U.S.A. Mar. Pet. Geol. 2020, 122, 104663. [Google Scholar] [CrossRef]
  49. Ross, D.J.K.; Bustin, R.M. The importance of shale composition and pore structure upon gas storage potential of shale gas reservoirs. Mar. Pet. Geol. 2009, 26, 916–927. [Google Scholar] [CrossRef]
  50. Clarkson, C.R.; Jensen, J.L.; Pedersen, P.K.; Freeman, M. Innovative methods for flow-unit and pore-structure analyses in a tight siltstone and shale gas reservoir. AAPG Bull. 2012, 96, 355–374. [Google Scholar] [CrossRef]
  51. Sing, K.S.W.; Everett, D.H.; Haul, R.A.W.; Moscou, L.; Pierotti, R.A.; Rouquerol, J.; Siemieniewska, T. Reporting physisorption data for gas/solid systems with special reference to the determination of surface area and porosity (Recommendations 1984). Pure Appl. Chem. 1985, 57, 603–619. [Google Scholar] [CrossRef]
  52. Labani, M.M.; Rezaee, R.; Saeedi, A.; Hinai, A.A. Evaluation of pore size spectrum of gas shale reservoirs using low pressure nitrogen adsorption, gas expansion and mercury porosimetry: A case study from the Perth and Canning Basins, Western Australia. J. Pet. Sci. Eng. 2013, 112, 7–16. [Google Scholar] [CrossRef]
  53. Zhang, J.; Li, X.; Xie, Z.; Li, J.; Zhang, X.; Sun, K.; Wang, F. Characterization of microscopic pore types and structures in marine shale: Examples from the Upper Permian Dalong formation, Northern Sichuan Basin, South China. J. Nat. Gas Sci. Eng. 2018, 59, 326–342. [Google Scholar] [CrossRef]
  54. Mastalerz, M.; Schimmelmann, A.; Drobniak, A.; Chen, Y. Porosity of Devonian and Mississippian New Albany Shale across a maturation gradient: Insights from organic petrology, gas adsorption, and mercury intrusion. AAPG Bull. 2013, 97, 1621–1643. [Google Scholar] [CrossRef]
  55. Jin, X.; Li, G.; Meng, S.; Wang, X.; Liu, C.; Tao, J.; Liu, H. Microscale comprehensive evaluation of continental shale oil recoverability. Pet. Explor. Dev. 2021, 48, 256–268. [Google Scholar] [CrossRef]
  56. Zhang, L.Y.; Bao, Y.S.; Li, J.Y.; Li, Z.; Zhu, R.F.; Zhang, L.; Wang, Y.R. Hydrocarbon and crude oil adsorption abilities of minerals and kerogens in lacustrine shales. Pet. Geol. Exp. 2015, 37, 776–780. [Google Scholar]
  57. Pernyeszi, T.; Patzkó, Á.; Berkesi, O.; Dékány, I. Asphaltene adsorption on clays and crude oil reservoir rocks. Colloids Surf. A Physicochem. Eng. Asp. 1998, 137, 373–384. [Google Scholar] [CrossRef]
  58. Li, Z.; Zou, Y.; Xu, X.; Sun, J.; Li, M.; Peng, P. Adsorption of mudstone source rock for shale oil—Experiments, model and a case study. Org. Geochem. 2016, 92, 55–62. [Google Scholar] [CrossRef]
Figure 1. (a) Location of the study area; (b) structure units of the study area; (c) comprehensive stratigraphic column of the Triassic Yanchang Formation in the Ordos Basin (modified from Yang et al. [34] and Sun et al. [35]).
Processes 11 03090 g001
Figure 2. Mineral composition (a,b) and ternary diagram (c) of Chang 7 shale.
Processes 11 03090 g002
Figure 3. Thin section photographs: (a) N3 (Sample id), dark layer of organic matter, bright particles of pyrite (white arrow); (b) N8 (Sample id), light area are silty laminae; (c) N9 (Sample id), dark layer of organic matter, bright particles of pyrite, plastic deformation structures (white arrow); (d) N15 (Sample id), dark layer of organic matter, light area of silty laminae; (e,f) N31 and N44 (Sample id), dark layer containing mud stripe (red zone); (ad) laminar; (e,f) massive. Cross-polarized light.
Processes 11 03090 g003
Figure 4. Photomicrographs of the Chang 7 shale: (a,b) N3, pyrite, telalginite, lamalginite; (c,d) N8, vitrinite, exsudatinite; (e,f) N9, pyrite, bituminite; (g,h) N15, vitrinite, bituminite; (i,j) N31, exsudatinite, liptodetrinite; (k,l) N44, vitrinite, exsudatinite. F = fluorescent light, R = reflected white light).
Processes 11 03090 g004
Figure 5. Distribution frequency diagram of TOC and (S1 + S2) (a,b); plots of S2 versus TOC (c); HI versus Tmax, showing type II1-II2 kerogen (e); and maturity parameters of the Chang 7 shale (df). The orange lines in (c) represent the boundaries of different kerogen types.
Processes 11 03090 g005
Figure 6. Pore features of the Chang 7 shale (OM: organic matter, Py: pyrite, InterP: interparticle, IntraP: intraparticle: (a) N3, OM pores; (b,c) N8, OM pores, IntraP pores within clay aggregates; (d) N9, InterP pores; (e) N15, InterP pores; (f) N15, IntraP pores within clay aggregates; (g) N31, fracture pores; (h,i) N44, IntraP pores within clay aggregates).
Processes 11 03090 g006
Figure 7. Low-pressure CO2 adsorption isotherms.
Processes 11 03090 g007
Figure 8. N2 adsorption/desorption isotherms: ((ac) mainly ink bottle-shaped pores; (df) mainly slit-shaped pores).
Processes 11 03090 g008
Figure 9. PV distribution with pore width determined from N2 and CO2 adsorption.
Processes 11 03090 g009
Figure 10. SSA distribution with pore width determined from N2 and CO2 adsorption.
Processes 11 03090 g010
Figure 11. Hydrocarbon component characteristics.
Processes 11 03090 g011
Figure 12. NMR T1–T2 map of the Chang 7 shale.
Processes 11 03090 g012
Figure 13. Relationships between shale oil mobility and DOM/OSI: (a) adsorbed oil vs. DOM; (b) free oil vs. DOM; (c) free oil vs. OSI.
Processes 11 03090 g013
Figure 14. Relationships between multiple scales of PVs and SSAs with TOC and mineral contents. (a) Relationships between multiple scales of PVs and TOC; (b) Relationships between multiple scales of SSAs and TOC; (c) Relationships between multiple scales of PVs and quartz content; (d) Relationships between multiple scales of SSAs and quartz content; (e) Relationships between multiple scales of PVs and feldspar contents; (f) Relationships between multiple scales of SSAs and feldspar contents; (g) Relationships between multiple scales of PVs and carbonate mineral content; (h) Relationships between multiple scales of SSAs and carbonate mineral content; (i) Relationships between multiple scales of PVs and pyrite content; (j) Relationships between multiple scales of SSAs and pyrite content; (k) Relationships between multiple scales of PVs and clay mineral content; (l) Relationships between multiple scales of SSAs and clay mineral content.
Processes 11 03090 g014
Figure 15. PSDs of extracted and unextracted samples. (a) is from N3; (b) is from N8; (c) is from N9; (d) is from N15; (e) is from N31; (f) is from N44.
Processes 11 03090 g015
Figure 16. Relationship between free oil and shale composition: (a) free oil and OSI vs. TOC; (b) free oil vs. clay mineral; (c) free oil vs. quartz + feldspar; (d) free oil vs. calcite + dolomite.
Processes 11 03090 g016
Figure 17. Relationship between free oil and crude oil composition: (a) free oil vs. saturated hydrocarbon; (b) free oil vs. aromatic hydrocarbon; (c) free oil vs. non-hydrocarbon; (d) free oil vs. asphaltene. The red circle represents the free oil and crude oil composition data of samples N3, N8, N9, N15, N31, N44.
Processes 11 03090 g017
Figure 18. Relationship between shale oil mobility and PV/SSA: (a) free oil vs. total PV; (b) free oil vs. total SSA; (c) free oil vs. PV (pore width > 20 nm); (d) R2 vs. pore width. The red circle represents the data of free oil, PV and SSA from samples N3, N8, N9, N15, N31, N44.
Processes 11 03090 g018
Figure 19. Modes of occurrence of Chang 7 shale oil.
Processes 11 03090 g019
Table 1. Geological and geochemical parameters of the Chang 7 shale.
No.WellDepth (m)DOM
(wt, %)
TOC (wt, %)S1S2S3OSIPIPC (%)HITmax
(℃)
Ro (%)
N3Z2511676.740.9016.92.9975.662.917.690.046.53447.694280.89
N8B5221953.470.6619.83.5732.004.1718.030.12.95161.624501.12
N9B5221949.770.5412.12.0815.474.4517.190.121.46127.854401.07
N15L2112356.350.667.41.1915.817.615.990.071.41212.50447/
N18L2112373.770.718.21.6020.224.0818.890.071.81238.724481.22
N31W3361977.000.344.31.5513.542.3236.050.11.25314.884451.12
N33W3362020.290.7811.92.0547.662.4717.230.044.13400.50442/
N37W3362061.690.671.91.266.542.468.110.160.65353.514451.09
N39W3362051.270.412.61.166.642.6845.490.150.65260.394511.06
N44L822181.600.192.210.952.851.6442.990.250.32128.964571.11
S1 = free hydrocarbon, mg/g; S2 = residual hydrocarbon, mg/g; S3 = mg CO2/g; HI = hydrogen index, S2/TOC × 100, mg/g TOC; OSI = oil saturation index, S1/TOC × 100, mg/g TOC, PI = production index, S1/(S1 + S2); PC = pyrolyzable carbon, (S1 + S2) × 0.083 × 100%.
Disclaimer/Publisher’s Note: The statements, opinions and data contained in all publications are solely those of the individual author(s) and contributor(s) and not of MDPI and/or the editor(s). MDPI and/or the editor(s) disclaim responsibility for any injury to people or property resulting from any ideas, methods, instructions or products referred to in the content.

