


Investigation of the Effects of Infrared and Hot Air Oven Drying Methods on Drying Behaviour and Colour Parameters of Red Delicious Apple Slices


Abstract
:1. Introduction
2. Materials and Methods
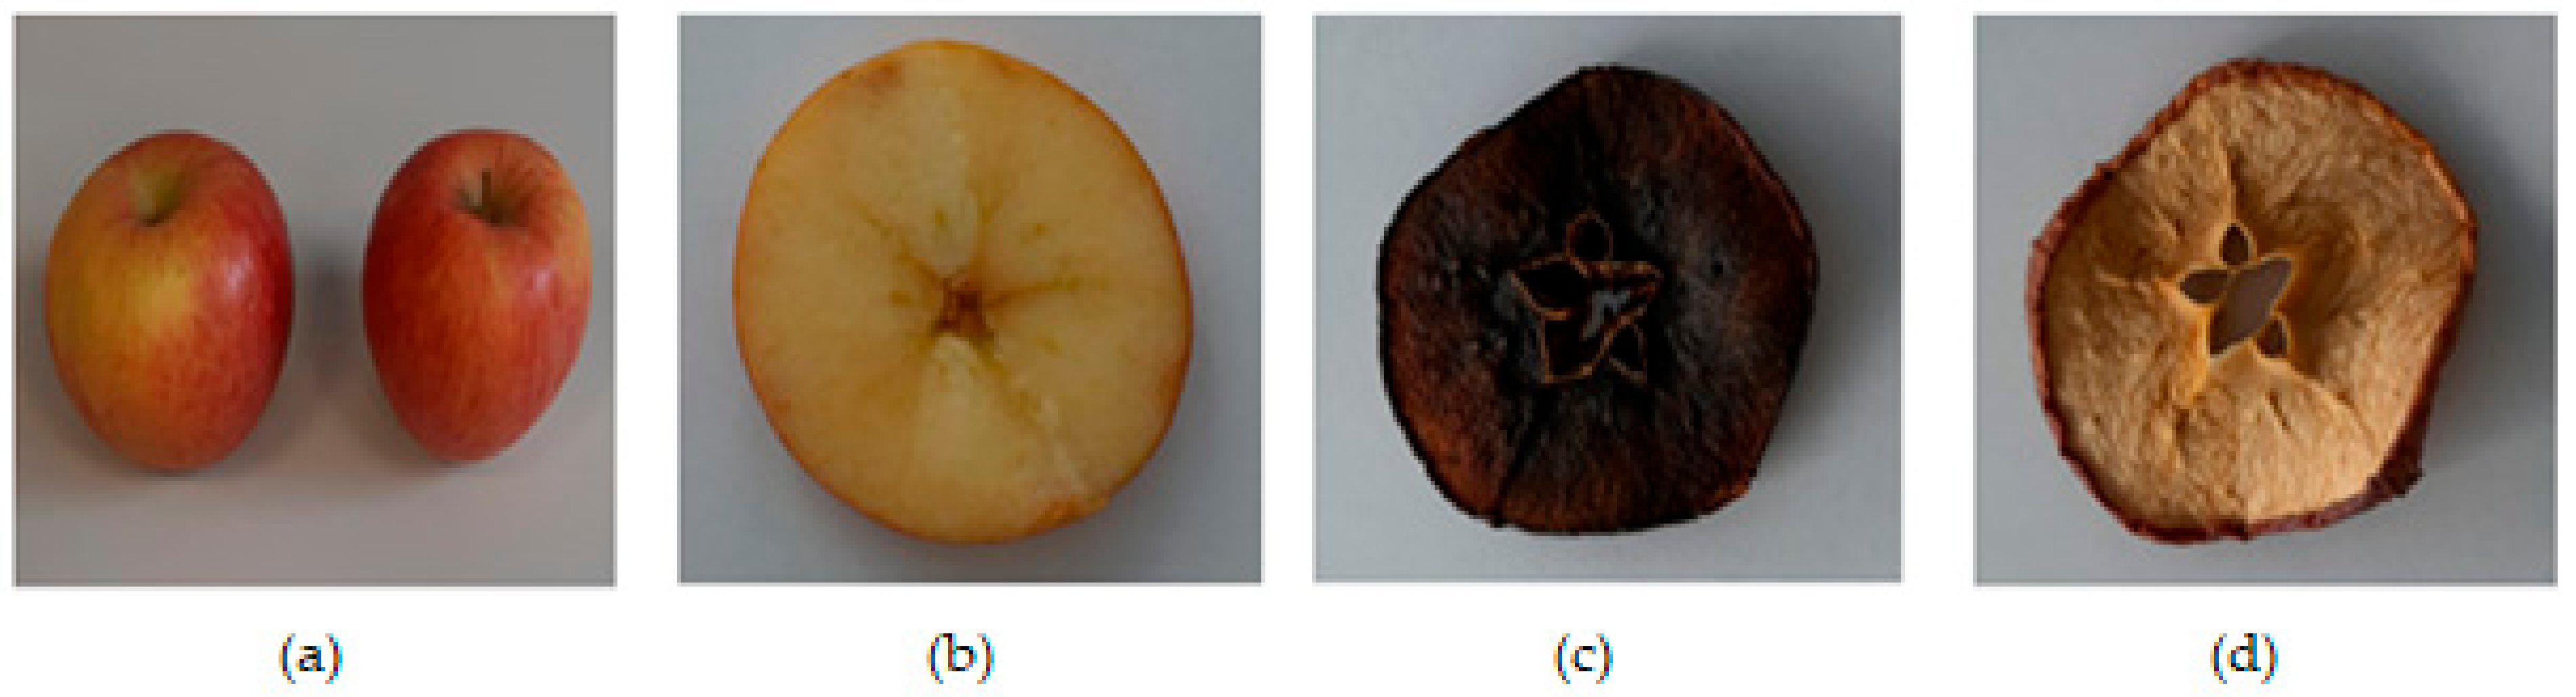
2.1. Sample and Drying Methods
2.2. Colour Analysis
- (If
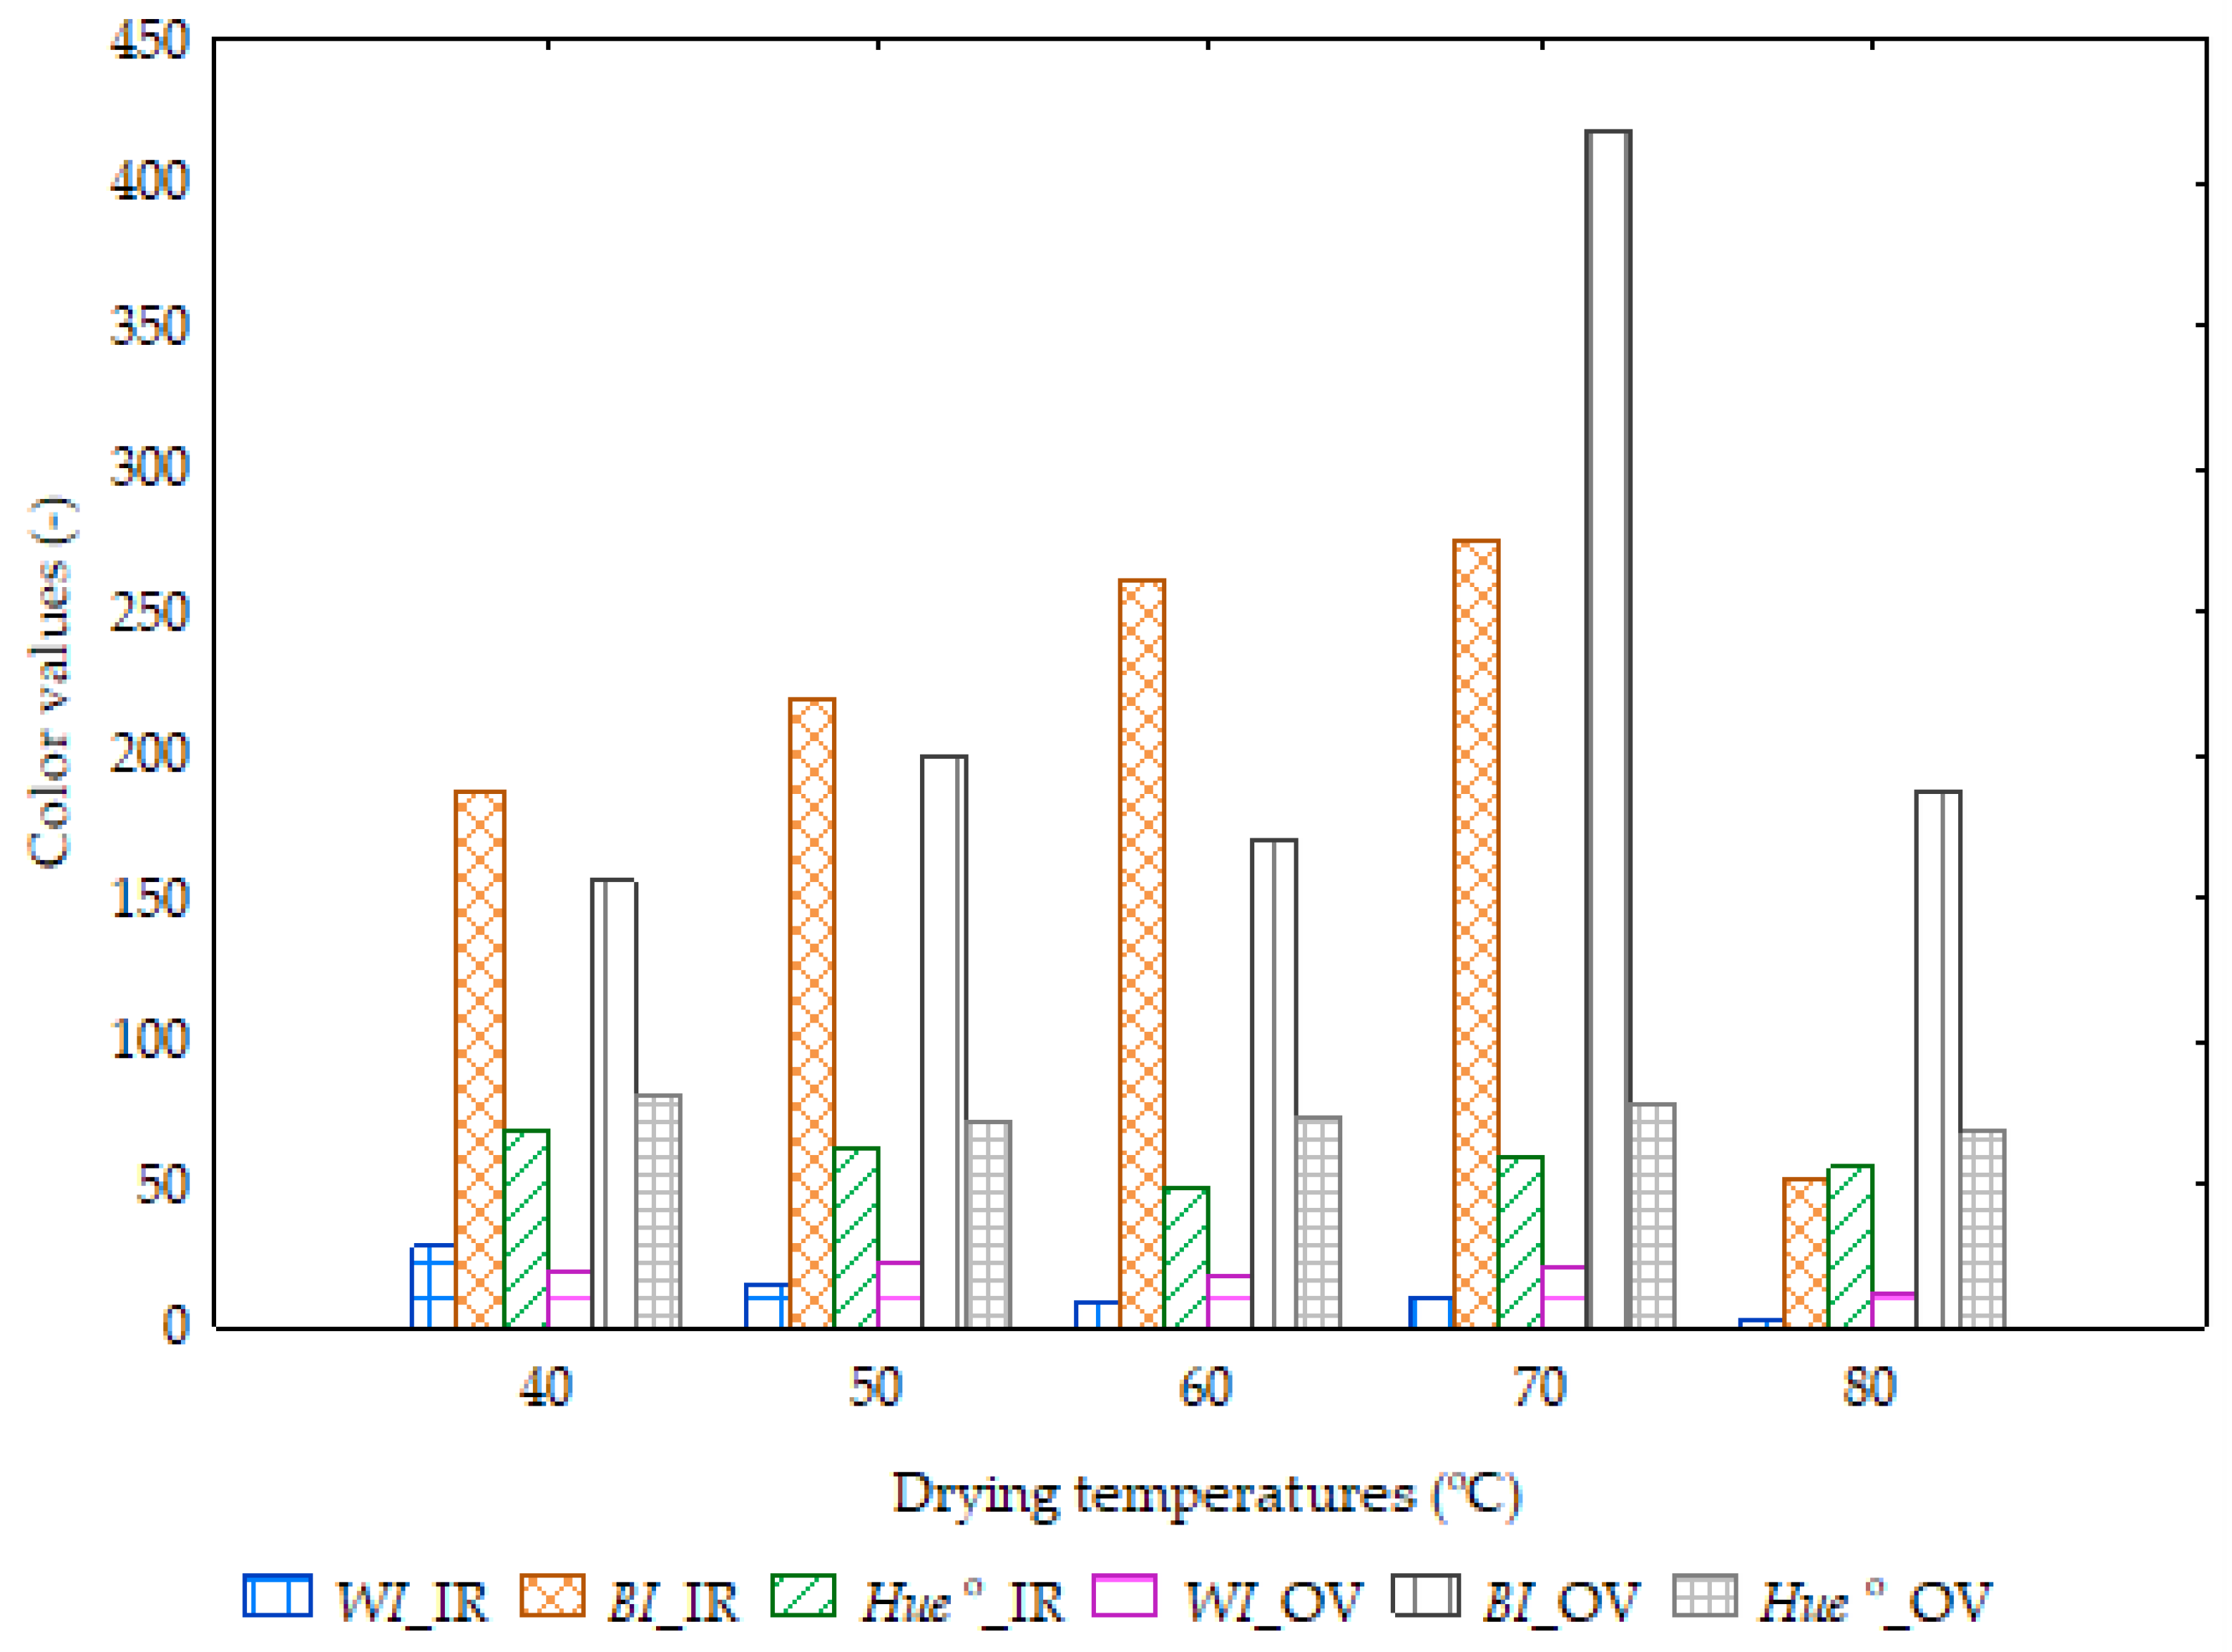
- where , and represent the fresh samples, whereas and represent the dried samples. The colour parameter is in a range from 0 (blackness) to 100 (whiteness). The parameter is from (greenness) to + (redness) and the parameter is from (blueness) to + (yellowness). The chroma (C) indicates the colour’s saturation or purity [11,16,61,67].
2.3. Dry Basis Moisture Content
2.4. Moisture Ratio
2.5. Rehydration Ratio
2.6. Shrinkage
2.7. Bulk Density
2.8. Surface Area
2.9. Applied Mathematical Models to the Drying Curves
2.10. Models Fitting of Experimental Drying Curves
2.11. Validation Metrics for Fitted Mathematical Models
2.12. Statistical Analyses
3. Results and Discussion
3.1. Calculated Parameters under Drying Temperatures and Methods
3.2. Evaluation of Colour Parameters
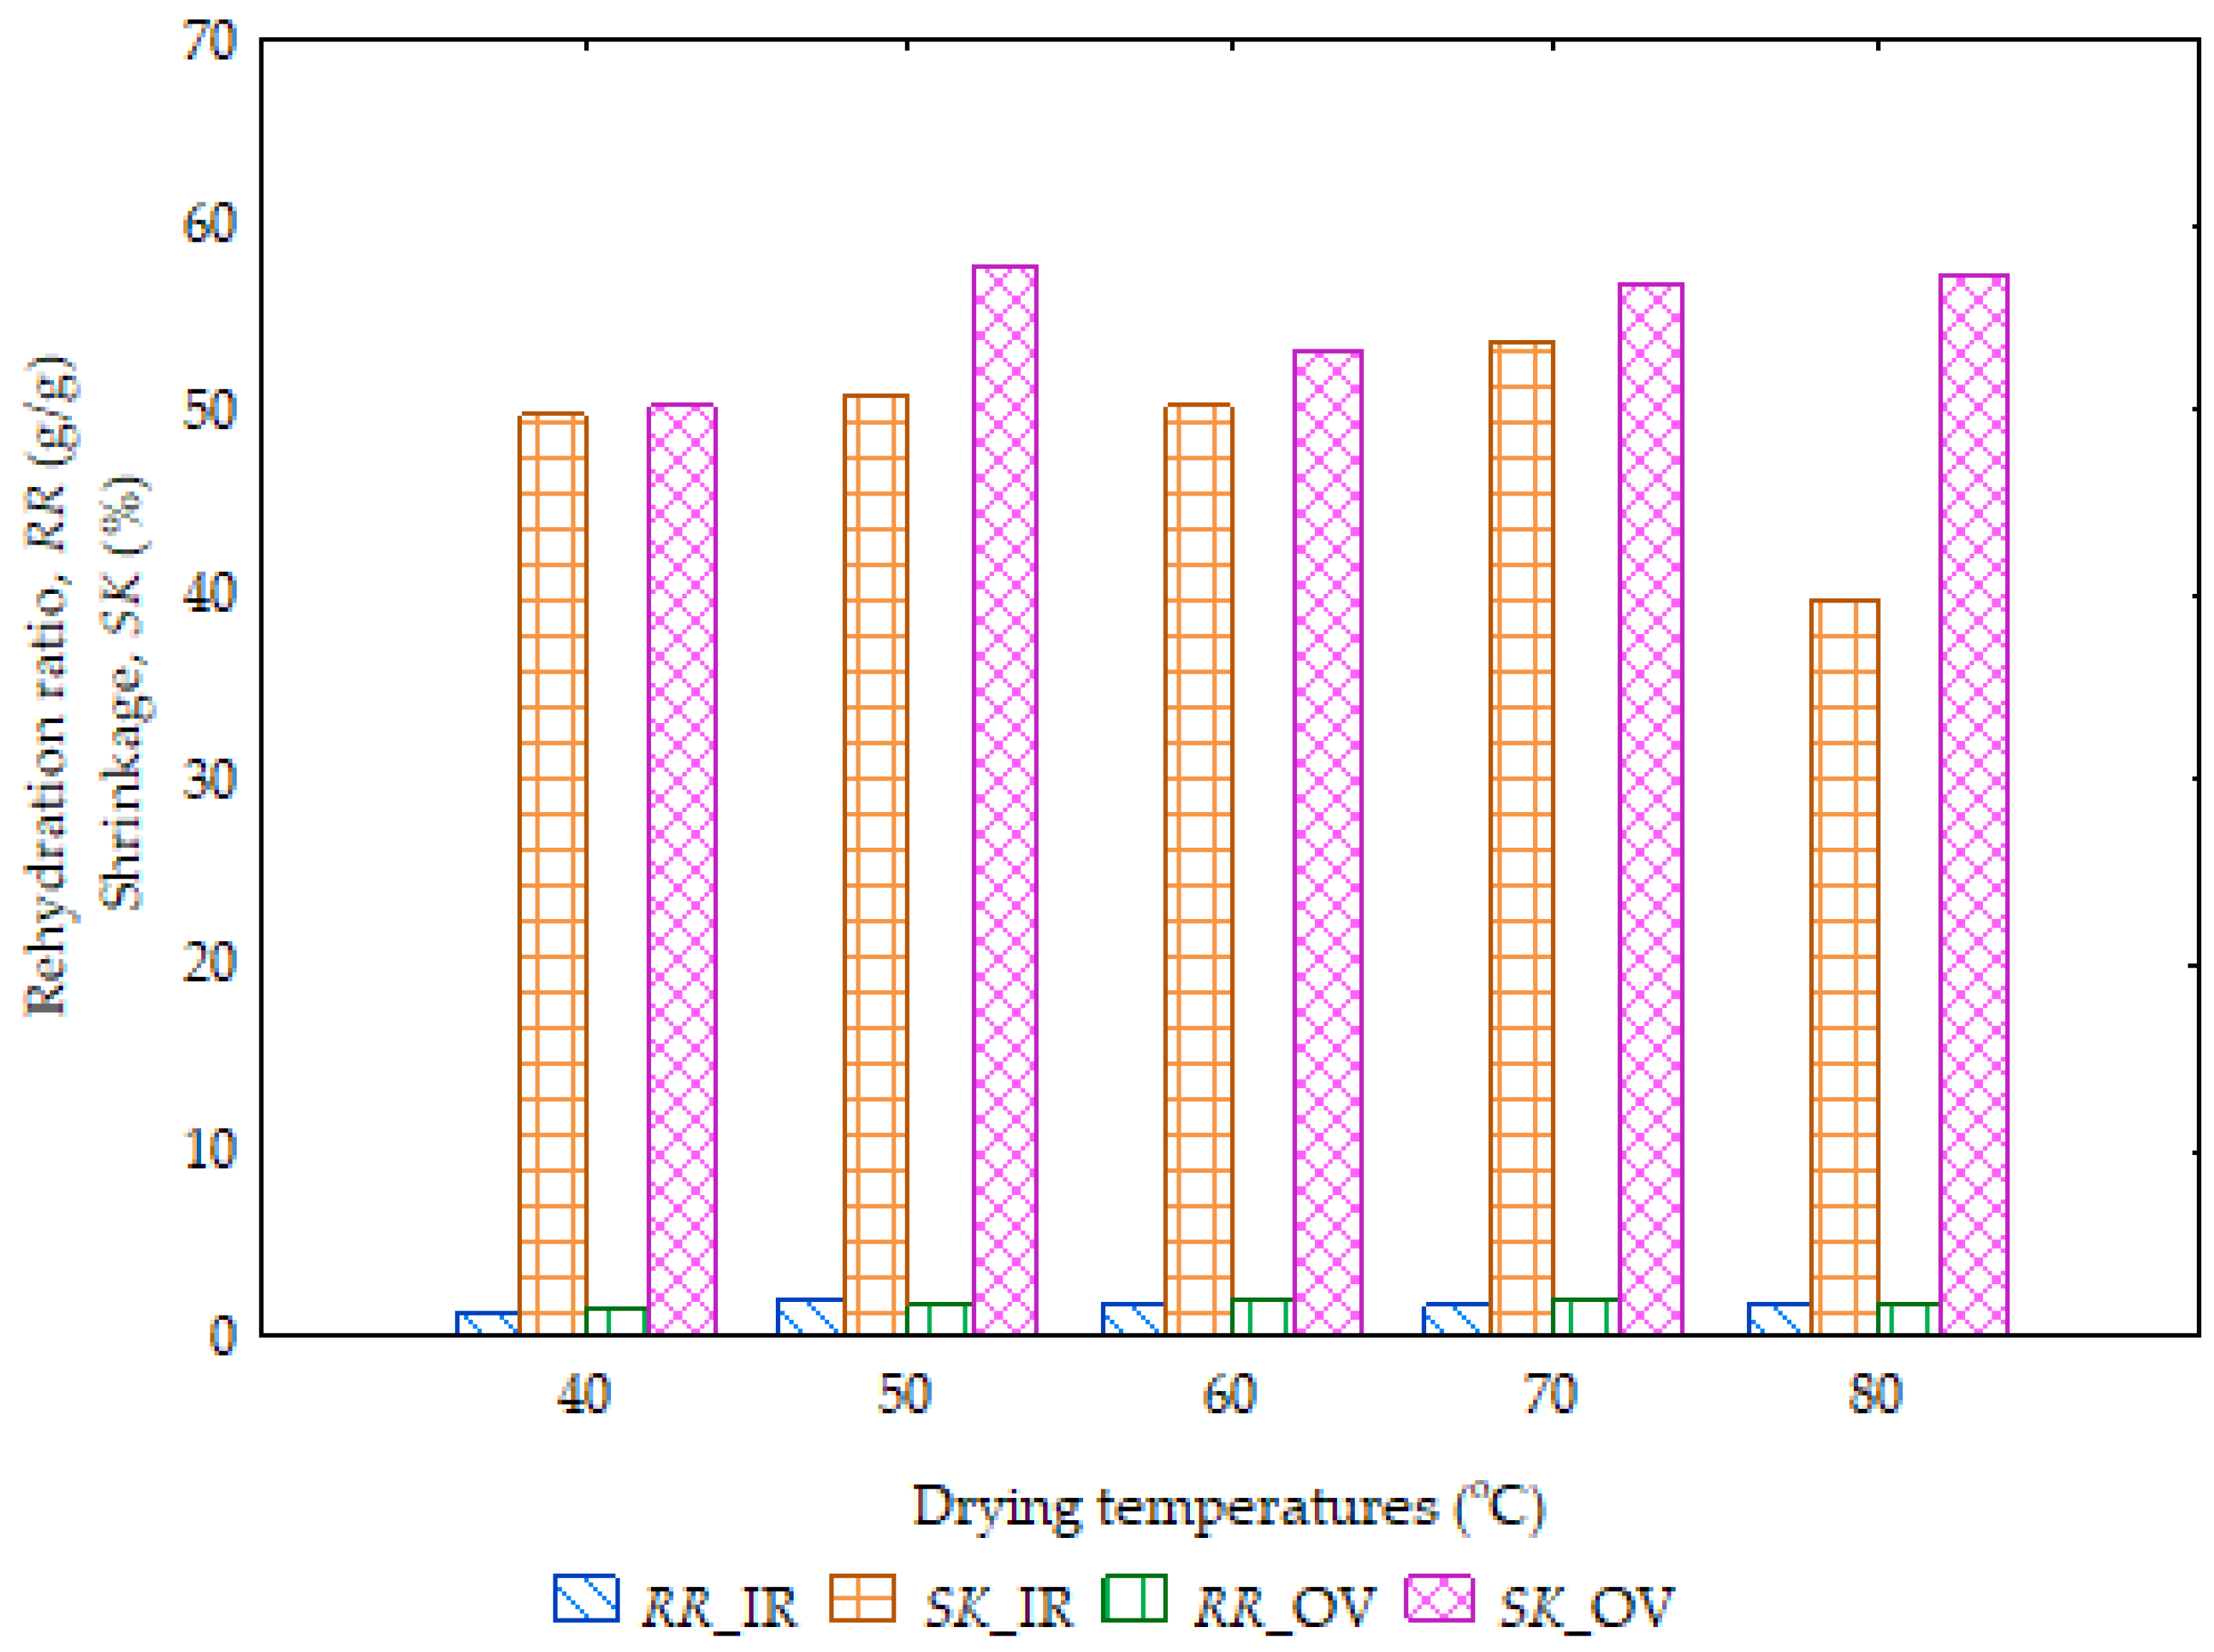
3.3. Rehydration Ratio and Shrinkage
3.4. Bulk Density, Final Area and Final Volume
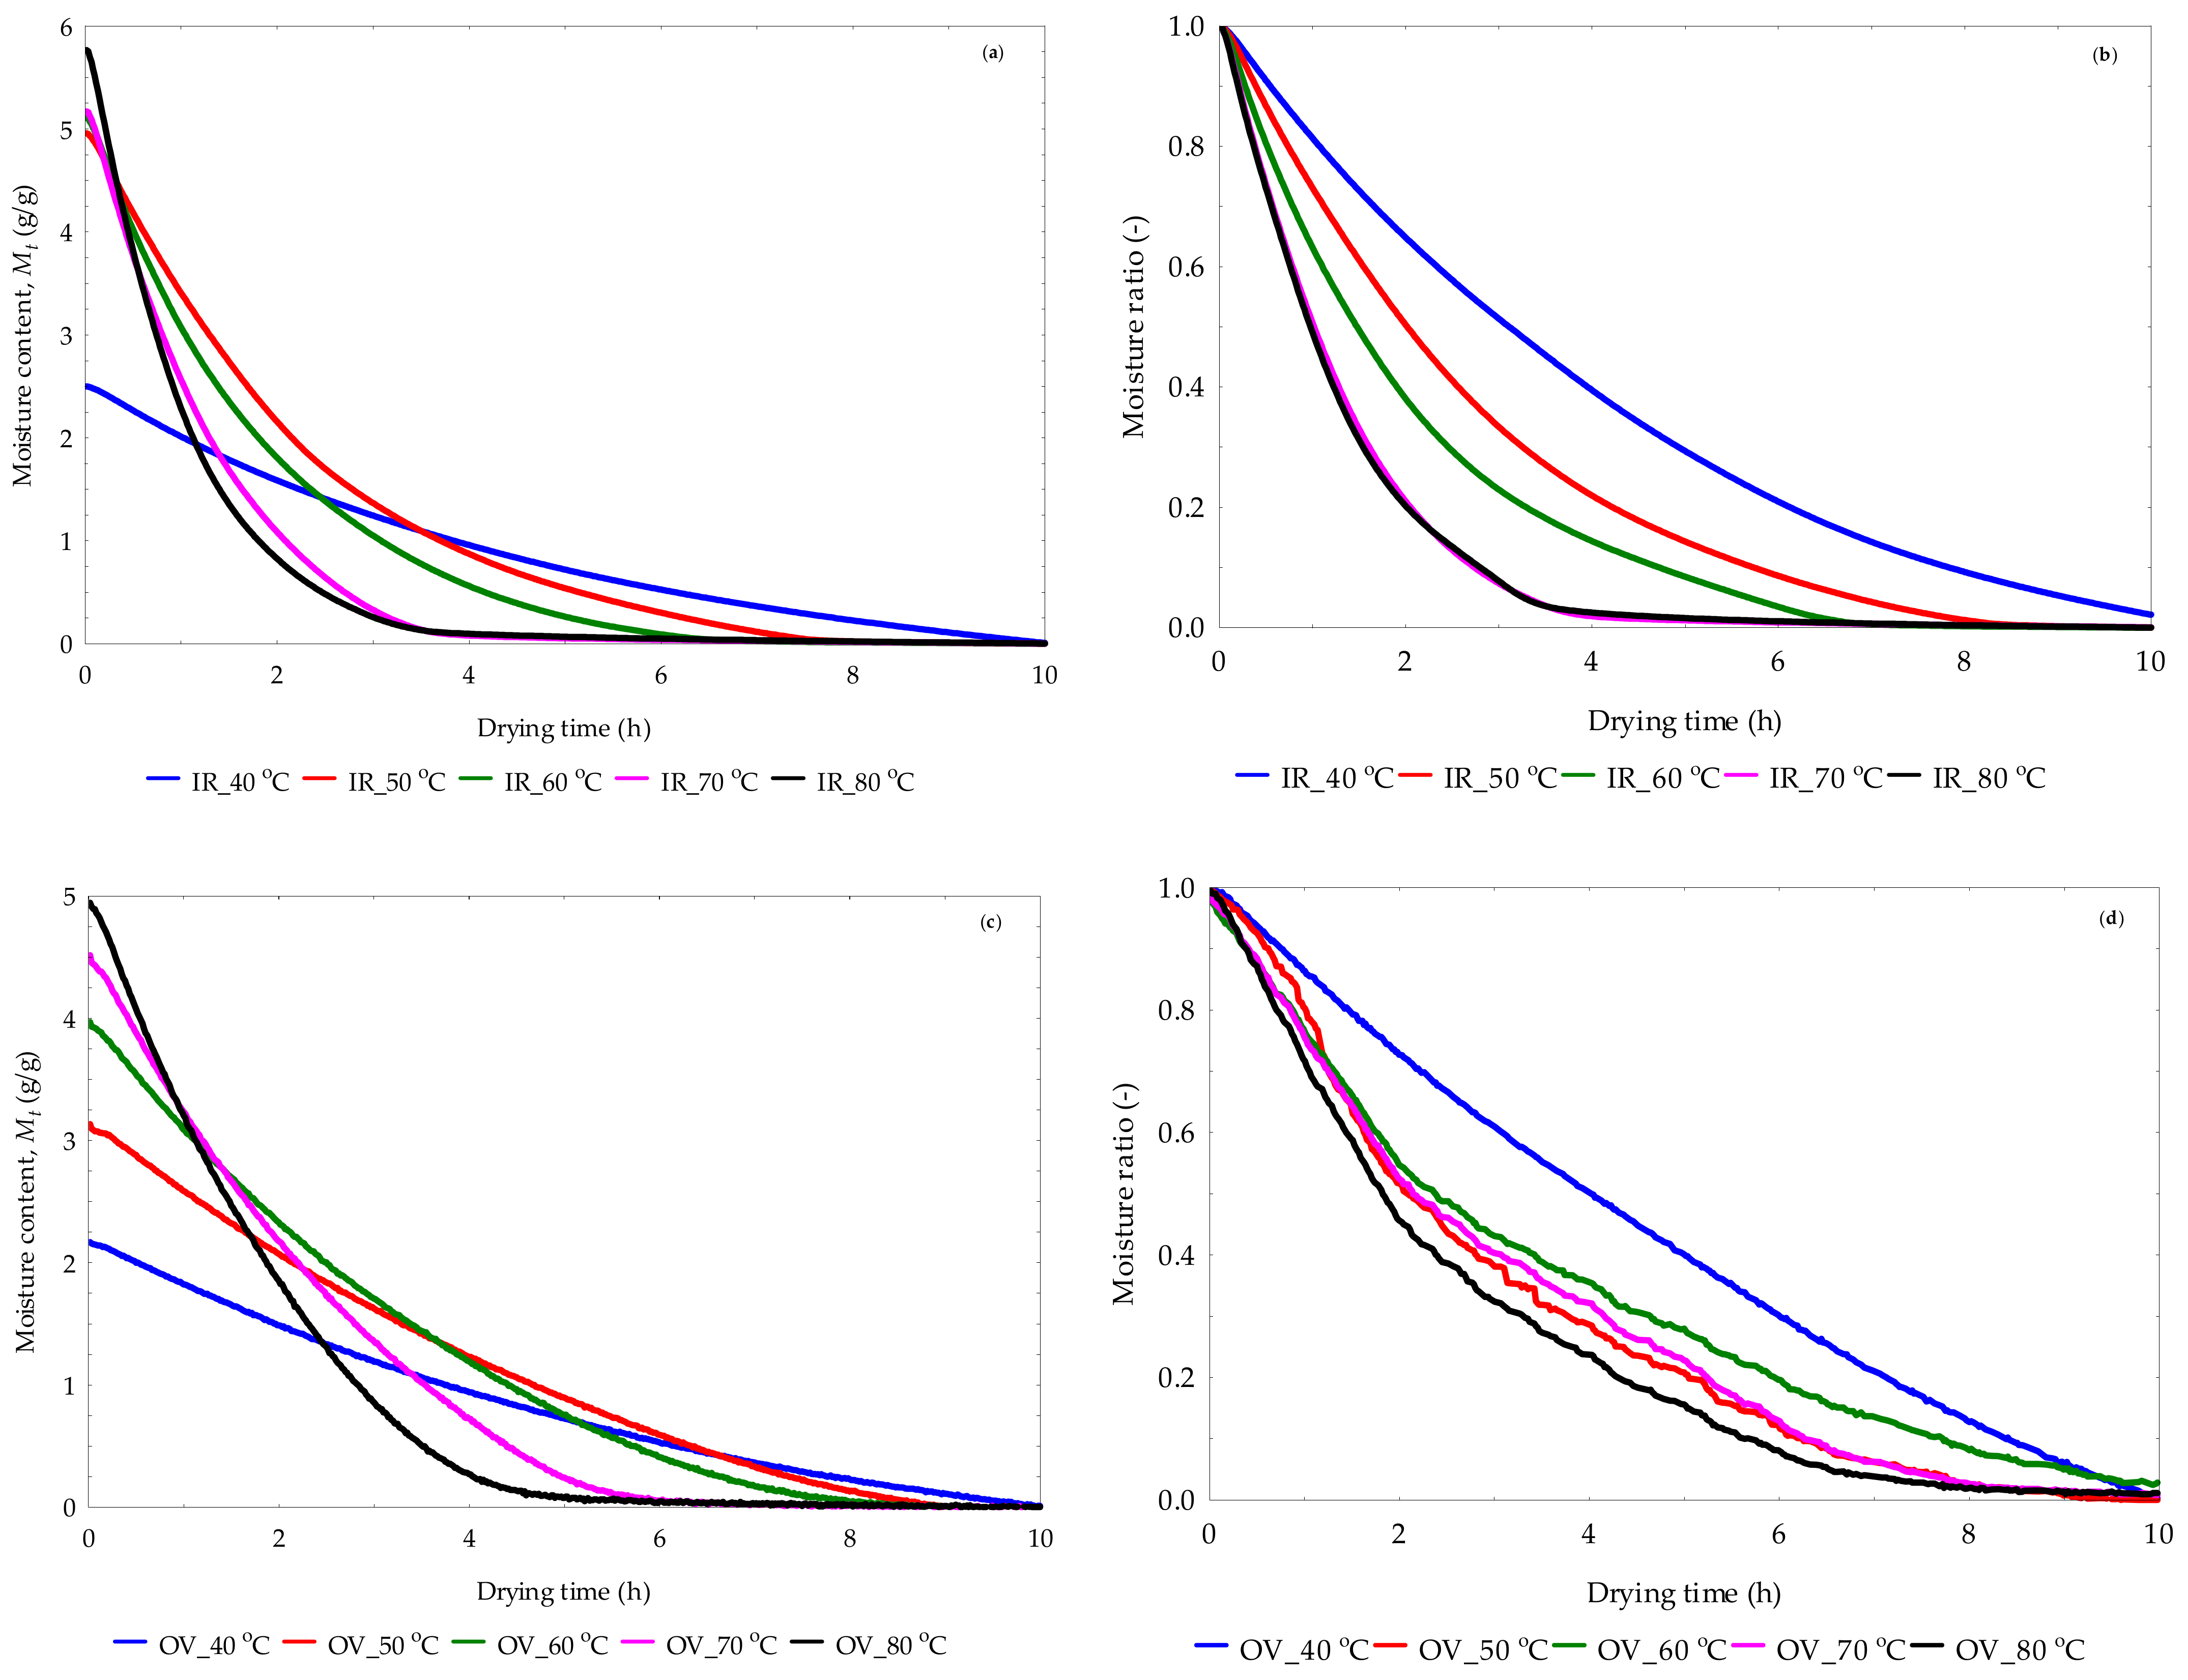
3.5. Experimental Drying Curves
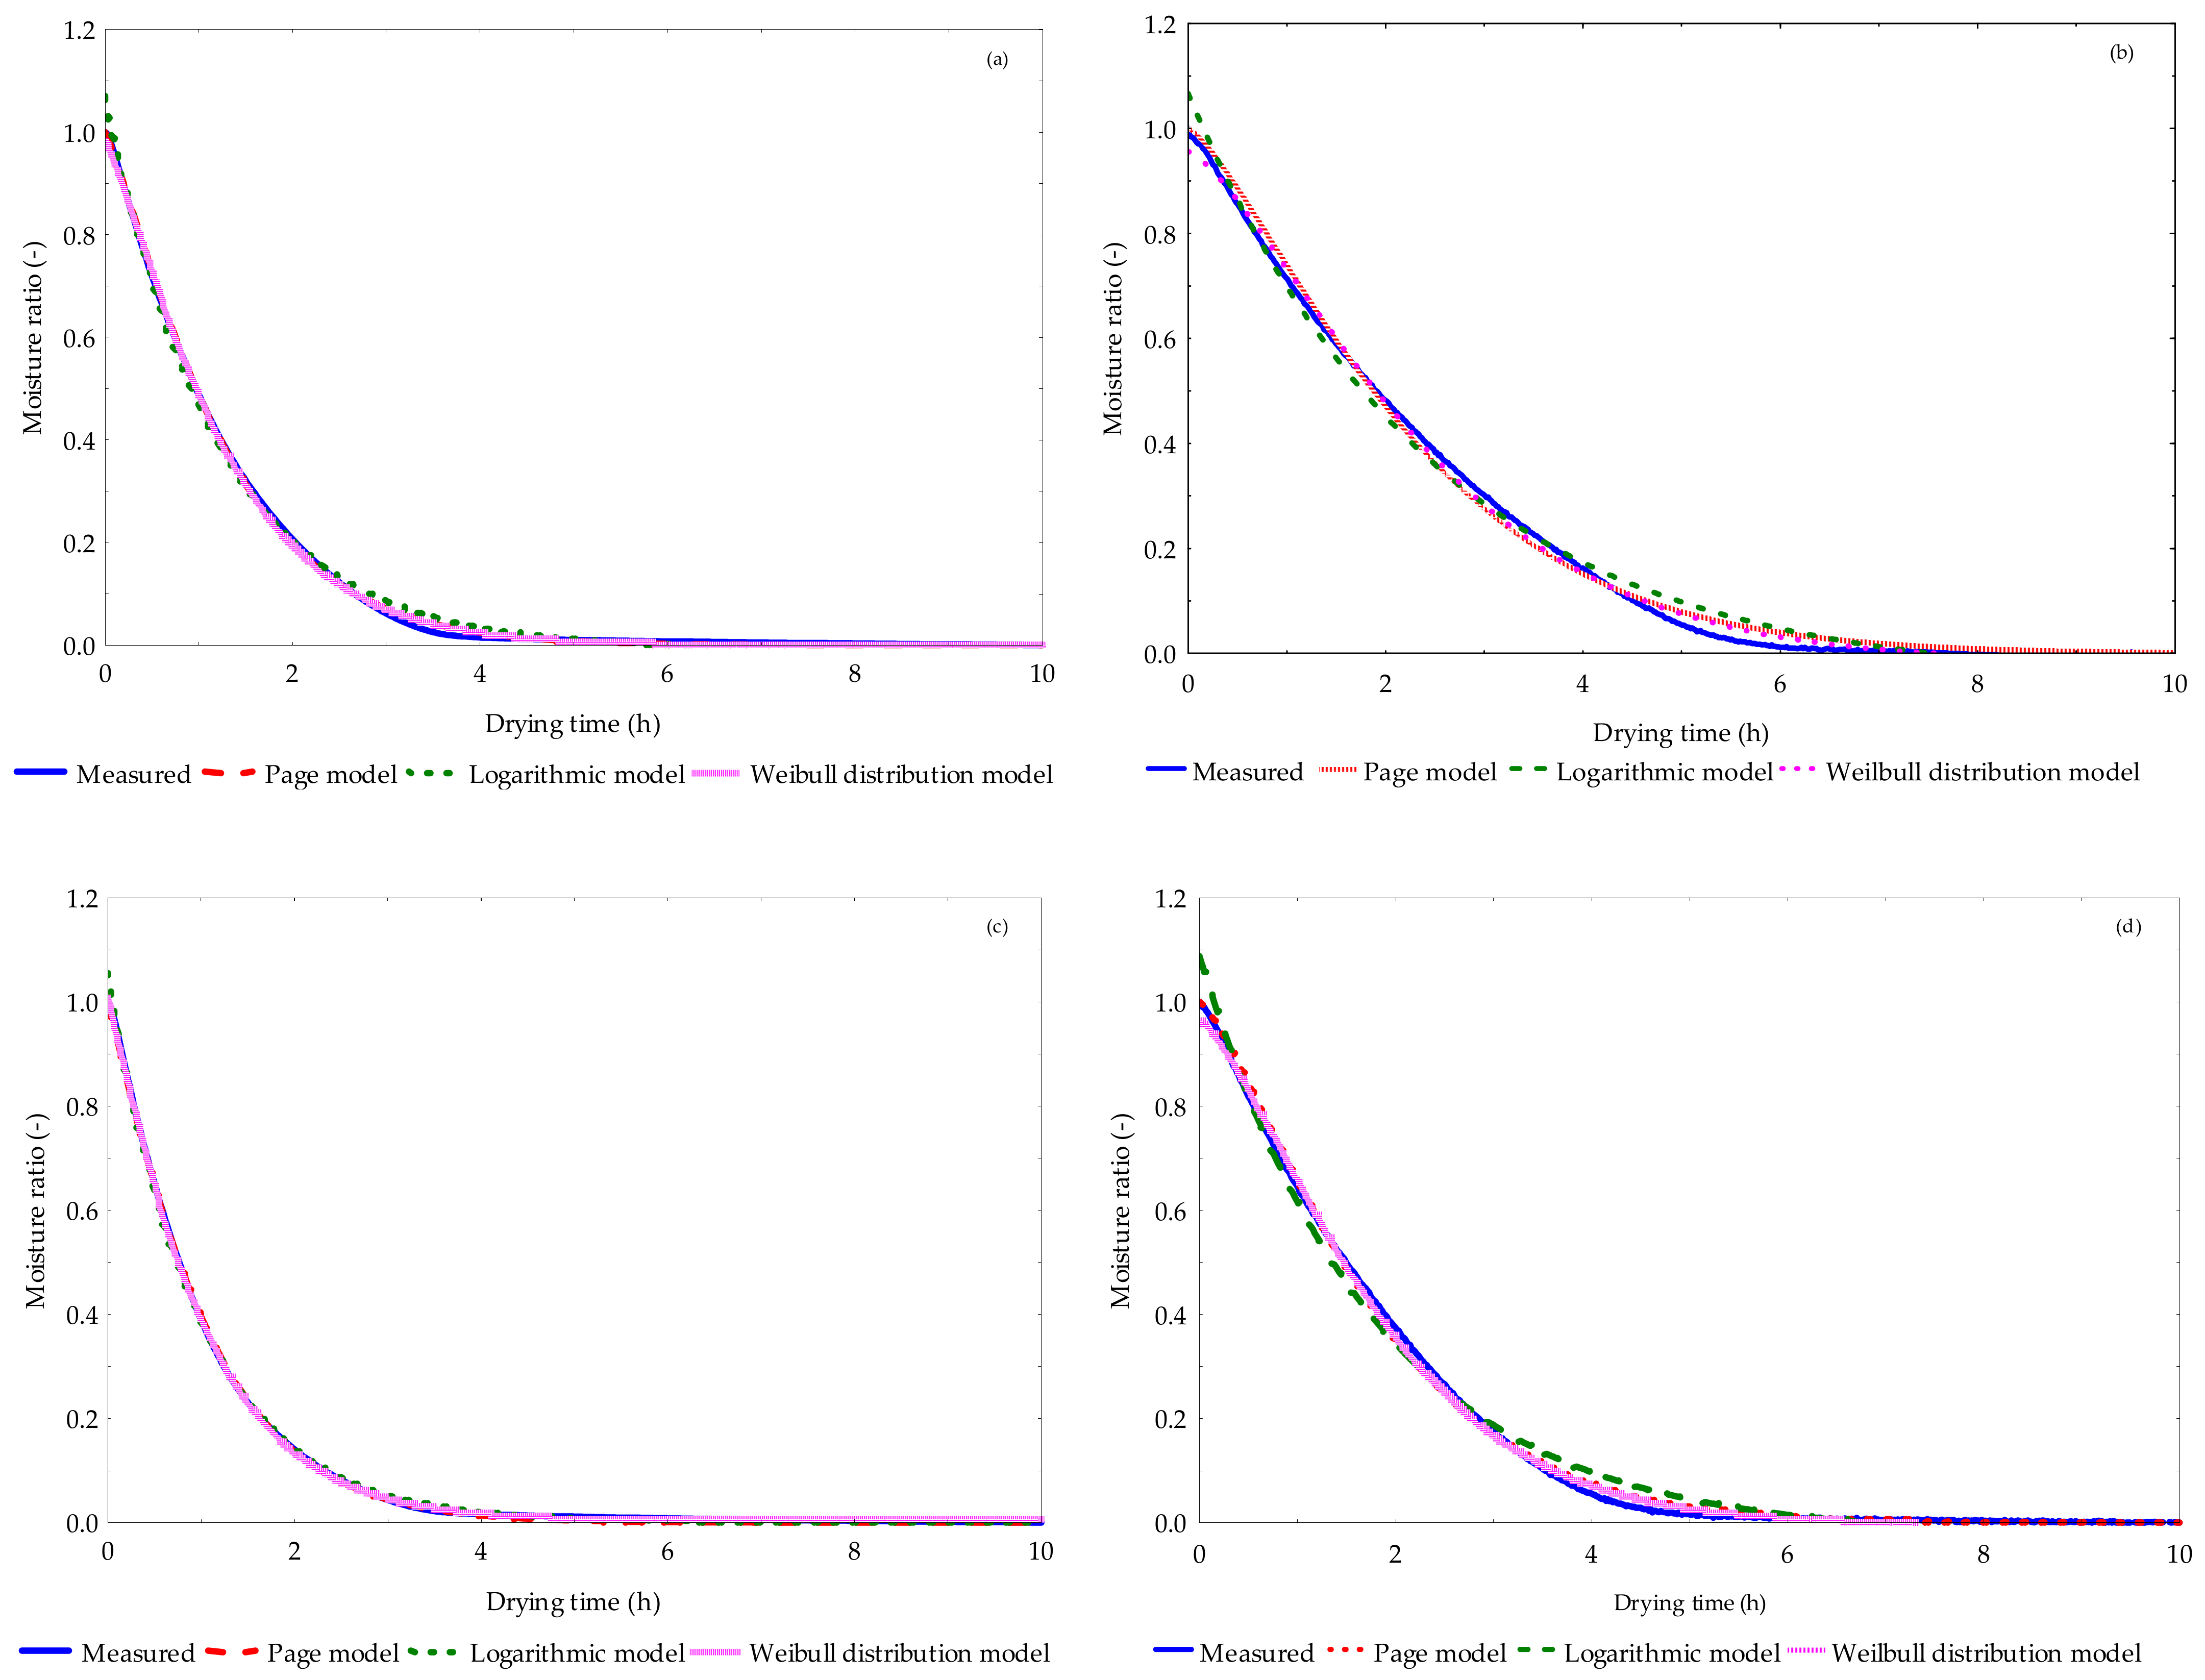
3.6. Model Fitting of Drying Curves and Validation Metrics
3.7. Evaluation of Linear Correlation and ANOVA Analyses
4. Conclusions
Supplementary Materials
Author Contributions
Funding
Data Availability Statement
Conflicts of Interest
References
- Musacchi, S.; Serra, S. Apple fruit quality: Overview on pre-harvest factors. Sci. Hortic. 2018, 234, 409–430. [Google Scholar] [CrossRef]
- Barreira, J.C.M.; Arraibi, A.A.; Ferreira, I.C.F.R. Bioactive and functional compounds in apple pomace from juice and cider manufacturing: Potential use in dermal formulations. Trends Food Sci. Technol. 2019, 90, 76–87. [Google Scholar] [CrossRef]
- Zhang, F.; Wang, T.; Wang, X.; Lu, X. Apple pomace as a potential valuable resource for full-components utilization: A review. J. Clean. Prod. 2021, 329, 129676. [Google Scholar] [CrossRef]
- Costa, J.M.; Ampese, L.C.; Ziero, H.D.D.; Sganzerla, W.G.; Forster-Carneiro, T. Apple pomace biorefinery: Integrated approaches for the production of bioenergy, biochemicals, and value-added products—An updated review. J. Environ. Chem. Eng. 2022, 10, 108358. [Google Scholar] [CrossRef]
- EL-Mesery, H.S.; Kamel, R.M.; Emara, R.Z. Influence of infrared intensity and air temperature on energy consumption and physical quality of dried apple using hybrid dryer. Case Stud. Therm. Eng. 2021, 27, 101365. [Google Scholar] [CrossRef]
- Pinheiro, M.N.; Castro, L.M.M.N. Effective moisture diffusivity prediction in two Portuguese fruit cultivars (Bravo de Esmolfe apple and Madeira banana) using drying kinetics data. Heliyon 2023, 9, e17741. [Google Scholar] [CrossRef] [PubMed]
- Shaheen, S.O.; Sterne, J.A.C.; Thompson, R.L.; Songhurst, C.E.; Margettes, B.M.; Burney, P.G.J. Dietary antioxidants and asthma in adults population-based case-control study. Am. J. Respir. Crit. Care Med. 2001, 164, 1823–1828. [Google Scholar] [CrossRef] [PubMed]
- Kukull, W.A. An apple a day to prevent parkinson disease. Neurology 2012, 78, 1112. [Google Scholar] [CrossRef] [PubMed]
- Khudyakov, D.; Sosnin, M.; Shorstkii, I.; Okpala, C.O.R.I. Cold filamentary microplasma combined with infrared dryer: Effects on drying efficiency and quality attributes of apple slices. J. Food Eng. 2022, 329, 111049. [Google Scholar] [CrossRef]
- Bradford, K.J.; Dahal, P.; Asbrouck, J.V.; Kunusoth, K.; Bello, P.; Thompson, J.; Wu, F. The dry chain: Reducing postharvest losses and improving food safety in humid climates. Trends Food Sci. Technol. 2018, 71, 84–93. [Google Scholar] [CrossRef]
- Jafari, F.; Movagharnejad, K.; Sadeghi, E. Infrared drying effects on the quality of eggplant slices and process optimization using response surface methodology. Food Chem. 2020, 333, 127423. [Google Scholar] [CrossRef] [PubMed]
- Mohammed, S.; Edna, M.; Siraj, K. The effect of traditional and improved solar drying methods on the sensory quality and nutritional composition of fruits: A case of mangoes and pineapples. Heliyon 2020, 6, e04163. [Google Scholar] [CrossRef]
- Sacilik, K.; Elicin, A.K. The thin layer drying characteristics of organic apple slices. J. Food Eng. 2009, 73, 281–289. [Google Scholar] [CrossRef]
- Shewale, S.R.; Rajoriya, D.; Hebbar, H.U. Low humidity air drying of apple slices: Effect of EMR pretreatment on mass transfer parameters, energy efficiency and quality. Innov. Food Sci. Emerg. Technol. 2019, 55, 1–10. [Google Scholar] [CrossRef]
- Aradwad, P.P.; Venkatesh, A.K.T.; Mani, I. Infrared drying of apple (Malus demestica) slices: Effect on drying and color kinetics, texture, rehydration, and microstructure. J. Food Process Eng. 2023, 42, e14218. [Google Scholar] [CrossRef]
- Aral, S.; Bese, A.W. Convective drying of hawthorn fruit (Crataegus spp.): Effect of experimental parameters on drying kinetics, color, shrinkage, and rehydration capacity. Food Chem. 2016, 210, 577–584. [Google Scholar] [CrossRef] [PubMed]
- Cetin, N.; Saglam, C.; Demir, B. Effects of different drying conditions on physical changes of apple (Malus communis L.). MKUJAS 2019, 24, 71–77. [Google Scholar]
- Wang, H.; Liu, Z.-L.; Vidyarthi, S.K.; Wang, Q.-H.; Gao, L.; Li, B.-R.; Wei, Q.; Liu, Y.-H.; Xiao, H.-W. Effects of different drying methods on drying kinetics, physicochemical properties, microstructure, and energy consumption of potato (Solanum tuberosum L.) cubes. Dry. Technol. 2021, 39, 418–431. [Google Scholar] [CrossRef]
- Guo, X.-h.; Xia, C.-Y.; Tan, Y.-R.; Chen, L.; Ming, J. Mathematical modeling and effect of various hot-air drying on mushroom (Lentinus edodes). J. Integr Agric. 2014, 13, 207–216. [Google Scholar] [CrossRef]
- Aidani, E.; Hadadkhodaparast, M.; Kashaninejad, M. Experimental and modeling investigation of mass transfer during combined infrared-vacuum drying of Hayward kiwifruits. Food Sci. Nutr. 2016, 5, 596–601. [Google Scholar] [CrossRef] [PubMed]
- Karaaslan, S.; Ekinci, K.; Akbolat, D. Drying characteristics of sultana grape fruit in microwave dryer. Pol. Acad. Sci. 2017, IV/1, 1317–1327. [Google Scholar]
- Bozkir, H.; Ergun, A.R.; Serdar, E.; Metin, G.; Baysal, T. Influence of ultrasound and osmotic dehydration pretreatment on drying and quality properties of persimmon fruit. Ultrason Sonochem. 2019, 54, 135–141. [Google Scholar] [CrossRef] [PubMed]
- Li, C.; Ren, G.; Zhang, L.; Duan, X.; Wang, Z.; Ren, X.; Chu, Q.; He, T. Effects of different drying methods on the drying characteristics and drying quality of Cistanche deserticola. Food Sci. Technol. 2023, 184, 115000. [Google Scholar] [CrossRef]
- Liu, Z.-L.; Wei, Z.-P.; Vidyarthi, S.K.; Pan, Z.; Zielinska, M.; Deng, L.-Z.; Wang, Q.-H.; Wei, Q.; Xiao, H.-W. Pulsed vacuum drying of kiwifruit slices and drying process optimization based on artificial neural network. Dry. Technol. 2020, 39, 405–417. [Google Scholar] [CrossRef]
- Cano-Lamadrid, M.; Lech, K.; Calin-Sanchez, A.; Rosas-Burgos, E.C.; Figiel, A.; Wojdylo, A.; Wasilewska, M.; Carbonell-Barrachina, A.A. Quality of pomegranate pomace as affected by drying method. J. Food Eng. 2018, 55, 1074–1082. [Google Scholar] [CrossRef]
- Izli, G.; Izli, N.; Taskin, O.; Yildiz, G. Convective drying of kumquat slices: Comparison of different drying temperatures on drying kinetics, colour, total phenolic content and antioxidant capacity. Lat. Am. Appl. Res. 2018, 48, 37–42. [Google Scholar] [CrossRef]
- Khaled, A.Y.; Kabutey, A.; Selvi, K.C.; Mizera, Č.; Hrabe, P.; Herák, D. Application of computational intelligence in describing the drying kinetics of persimmon fruit (Diospyros kaki) during vacuum and hot air drying process. Processes 2020, 8, 544. [Google Scholar] [CrossRef]
- Izli, G.; Yildiz, G.; Berk, S.E. Quality retention in pumpkin powder dried by combined microwave-convective drying. J. Food Sci. Technol. 2022, 59, 1558–1569. [Google Scholar] [CrossRef]
- Yildiz, G. Color, microstructure, physicochemical, textural and sensory properties with the retention of secondary metabolites in convective, microwave and freeze-dried carrot (Daucus carota) slices. Br. Food J. 2022, 124, 3922–3935. [Google Scholar] [CrossRef]
- Blanco-Cano, L.; Soria-Verdugo, A.; Garcia-Gutierrez, L.M.; Ruiz-Rivas, U. Modeling the thin-layer drying process of Granny Smith apples: Application in an indirect solar dryer. Appl. Therm. Eng. 2016, 108, 1086–1094. [Google Scholar] [CrossRef]
- Peng, J.; Yin, X.; Jiao, S.; Wei, K.; Tu, K.; Pan, L. Air jet impingement and hot air-assisted radio frequency hybrid drying of apple slices. LWT—Food Sci. Technol. 2019, 116, 108517. [Google Scholar] [CrossRef]
- Anderson, B.A.; Singh, R.P. Modeling the thawing of frozen foods using air impingement technology. Int. J. Refrig. 2006, 29, 294–304. [Google Scholar] [CrossRef]
- Gong, C.; Zhang, H.; Yue, J.; Miao, Y.; Jiao, S. Investigation of hot air-assisted radio frequency heating as a simultaneous dry-blanching and pre-drying method for carrot cubes. Innov. Food Sci. Emerg. Technol. 2019, 56, 102181. [Google Scholar] [CrossRef]
- Lai, F.C.; Lai, K.W. EHD-enhanced drying with wire electrode. Dry. Technol. 2002, 20, 1393–1405. [Google Scholar] [CrossRef]
- Martynenko, A.; Zheng, W. Electrohydrodynamic drying of apple slices: Energy and quality aspects. J. Food Eng. 2016, 168, 215–222. [Google Scholar] [CrossRef]
- Joardder, M.U.H.; Karim, M.A. Drying kinetics and properties evolution of apple slices under convective and intermittent-MW drying. Therm. Sci. Eng. Prog. 2022, 30, 101279. [Google Scholar] [CrossRef]
- Ceclu, L.S.; Botez, E.; Nistor, O.-V.; Andronoiu, D.G.; Mocanu, G.-D. Effect of different drying methods on moisture ratio and rehydration of pumpkin slices. Food Chem. 2016, 195, 104–109. [Google Scholar]
- Feng, Y.; Wu, B.; Yu, X.; Yagoub, A.E.A.; Sarpong, F.; Zhou, C. Effect of catalytic infrared dry-blanching on the processing and quality characteristics of garlic slices. Food Chem. 2018, 226, 309–316. [Google Scholar] [CrossRef] [PubMed]
- Ando, Y.; Hagiwara, S.; Nabetani, H.; Sotome, I.; Okunishi, T.; Okadome, H.; Orikasa, T.; Tagawa, A. Effects of prefreezing on the drying characteristics, structural formation and mechanical properties of microwave-vacuum dried apple. J. Food Eng. 2019, 244, 170–177. [Google Scholar] [CrossRef]
- Lammerskitten, A.; Mykhailyk, V.; Wiktor, A.; Toepfl, S.; Nowacka, M.; Bialik, M.; Czyzewski, J.; Wiltrowa-Rajchert, D.; Parniakov, O. Impact of pulsed electric fields on physical properties of freeze-dried apple tissue. Innov. Food Sci. Emerg. Technol. 2019, 57, 102211. [Google Scholar] [CrossRef]
- Souza da Silva, E.; Brandao, S.C.R.; Lopes da Silva, A.; Fernandes da Silva, J.H.; Coelho, A.C.D.; Azoubel, P.M. Ultrasound-assisted vacuum drying of nectarine. J. Food Eng. 2019, 246, 119–124. [Google Scholar] [CrossRef]
- Feng, Y.; Zhou, C.; Yagoub, A.E.A.; Sun, Y.; Owusu-Ansah, P.; Yu, X.; Wang, X.; Xu, X.; Zhang, J.; Rein, Z. Improvement of the catalytic infrared drying process and quality characteristics of the dried garlic slices by ultrasound-assisted alcohol pretreatment. LWT—Food Sci. Technol. 2019, 116, 108577. [Google Scholar] [CrossRef]
- Rojas, M.L.; Augusto, P.E.D.; Carcel, J.A. Ethanol pre-treatment to ultrasound-assisted convective drying of apple. Innov. Food Sci. Emerg. Technol. 2020, 61, 102328. [Google Scholar] [CrossRef]
- Menges, H.O.; Ertekin, C. Mathematical modeling of thin layer dring of Golden apples. J. Food Eng. 2005, 77, 119–125. [Google Scholar] [CrossRef]
- Meisami-asl, E.; Rafiee, S.; Keyhani, A.; Tabatabaeefar, A. Mathematical modeling of moisture content of apple slices (Var. Golab) during drying. Pak. J. Nutr. 2009, 8, 80–809. [Google Scholar]
- Zhu, J.; Liu, Y.; Zhu, C.; Wei, M. Effects of different drying methods on the physical properties and sensory characteristics of apple chip snacks. LWT—Food Sci. Technol. 2022, 154, 112829. [Google Scholar] [CrossRef]
- Das, M.; Akpinar, E.K. Determination of thermal and drying performances of the solar air dryer with solar tracking system: Apple drying test. Case Stud. Therm. Eng. 2020, 21, 100731. [Google Scholar] [CrossRef]
- Ghinea, C.; Prisacaru, A.E.; Leahu, A. Physico-chemical and sensory quality of oven-dried and dehydrator-dried apples of the Starkrimson, golden delicious and florina cultivars. Appl. Sci. 2022, 12, 2350. [Google Scholar] [CrossRef]
- Wang, L.; Xu, B.; Wei, B.; Zeng, R. Low frequency ultrasound pretreatment of carrot slices: Effect on the moisture migration and quality attributes by intermediate-wave infrared radiation drying. Ultrason. Sonochem. 2018, 40, 619–628. [Google Scholar] [CrossRef] [PubMed]
- Mujumdar, A.S. Handbook of Industrial Drying (Advances in Drying Science and Technology), 3rd ed.; Dekker, M., Ed.; Routledge: New York, NY, USA, 2006. [Google Scholar]
- Sturm, B.; Vega, A.-M.N.; Hofacker, W.C. Influence of process control strategies on drying kinetics, colour and shrinkage of air dried apples. Appl. Therm. Eng. 2014, 62, 455–460. [Google Scholar] [CrossRef]
- Thamkaew, G.; Sjoholm, I.; Galindo, F.G. A review of drying methods for improving the quality of dried herbs. Crit. Rev. Food Sci. Nutr. 2021, 61, 1763–1786. [Google Scholar] [CrossRef]
- Hnin, K.K.; Zhang, M.; Wang, B.; Devahastin, S. Different drying methods effect on quality attributes of restructured rose powder-yam snack chips. Food Biosci. 2019, 32, 100486. [Google Scholar] [CrossRef]
- Zhang, L.; Zhang, C.; Wei, Z.; Huang, W.; Yan, Z.; Luo, Z.; Beta, T.; Xu, X. Effects of four drying methods on the quality, antioxidant activity and anthocyanin components of blueberry pomace. Food Prod. Process. Nutr. 2023, 5, 35. [Google Scholar] [CrossRef]
- Martynenko, A.; Janaszek, M.A. Texture changes during drying of apple slices. Dry. Technol. 2014, 32, 567–577. [Google Scholar] [CrossRef]
- Torki-Harchegani, M.; Ghanbarian, D.; Maghsoodi, V.; Moheb, A. Infrared thin layer drying of saffron (Crocus sativus L.) stigmas: Mass transfer parameters and quality assessment. Chin. J. Chem. Eng. 2017, 25, 426–432. [Google Scholar] [CrossRef]
- Huang, X.; Li, Y.; Zhou, X.; Wang, J.; Zhang, Q.; Yang, X.; Zhu, L.; Geng, Z. Prediction of apple slices drying kinetic during infrared- assisted-hot air drying by deep neural networks. Foods 2022, 11, 3486. [Google Scholar] [CrossRef] [PubMed]
- MA 50/1.R Moisture Analyzer › Laboratory Balances—Radwag Balances And Scales, Laboratory, Industrial scales. Available online: https://radwag.com/en/ma-50r-moisture-analyzer,w1,F03,101-103-103 (accessed on 1 March 2022).
- Nowak, D.; Lewicki, P.P. Infrared drying of apple slices. Innov. Food Sci. Emerg. Technol. 2004, 5, 353–360. [Google Scholar] [CrossRef]
- Wu, X.-f.; Zhang, M.; Li, Z. Influence of infrared drying on the drying kinetics, bioactive compounds and flavor of Cordyceps militaris. LWT—Food Sci. Technol. 2019, 111, 790–798. [Google Scholar] [CrossRef]
- Dajbych, O.; Kabutey, A.; Mizera, Č.; Herák, D. Investigation of infrared and hot air oven for drying fresh apple slices at different temperatures. In Proceedings of the International Conference on Trends in Agricultural Engineering, Prague, Czech Republic, 20–23 September 2022. [Google Scholar]
- Bozkir, H.; Ergun, A.R. Effect of sonication and osmotic dehydration applications on the hot air drying kinetics and quality of persimmon. LWT—Food Sci. Technol. 2020, 131, 109704. [Google Scholar] [CrossRef]
- Soares de Mendonca, K.; Correa, J.L.G.; Renato de Jesus Junqueira, J.; Cirillo, M.A.; Figueira, F.V.; Carvalho, E.E.N. Influences of convective and vacuum drying on the quality attributes of osmo-dried pequi (Caryocar brasiliense Camb.) slices. Food Chem. 2017, 224, 212–218. [Google Scholar] [CrossRef] [PubMed]
- Cuccurullo, G.; Giordano, L.; Metallo, A.; Cinquanta, L. Drying rate control in microwave assisted processing of sliced apples. Biosyst. Eng. 2018, 170, 24–30. [Google Scholar] [CrossRef]
- Nurkhoeriyati, T.; Kulig, B.; Sturm, B.; Hensel, O. The effect of pre-heating treatment and drying conditions on quality and energy consumption of hot air-dried celeriac slices: Optimisation. Foods 2021, 10, 1–19. [Google Scholar] [CrossRef] [PubMed]
- Hussain, P.R.; Wani, I.A.; Rather, S.A.; Suradkar, P.; Ayob, O. Effect of post-processing radiation treatment on physico-chemical, microbiological and sensory quality of dried apple chips during storage. Radiat. Phys. Chem. 2021, 182, 109367. [Google Scholar] [CrossRef]
- Bagheri, N.; Dinani, S.T. Investigation of ultrasound-assisted convective drying process on quality characteristics and drying kinetics of zucchini slices. Heat Mass Transf. 2019, 55, 2123–2163. [Google Scholar] [CrossRef]
- Xie, Y.; Lin, Y.; Li, X.; Yang, H.; Han, J.; Shang, C.; Li, A.; Xiao, H.; Lu, F. Peanut drying: Effects of various drying methods on drying kinetic models, physicochemical properties, germination characteristics, and microstructure. Inf. Process. Agric. 2022. [Google Scholar] [CrossRef]
- Xiao, H.W.; Pang, C.L.; Wang, L.H.; Bai, J.W.; Yang, W.X.; Gao, Z.J. Drying kinetics and quality of Monukka Seedless grapes dried in an air–impingement jet dryer. Biosyst. Eng. 2010, 105, 233–240. [Google Scholar] [CrossRef]
- Cui, Z.W.; Li, C.Y.; Song, C.F.; Song, Y. Combined microwave vacuum and freeze drying of carrot and apple chips. Dry. Technol. 2008, 26, 1517–1523. [Google Scholar] [CrossRef]
- Majdi, H.; Esfahani, J.A.; Mohebbi, M. Optimization of convective drying by response surface methodology. Comput. Electron. Agric. 2019, 156, 574–584. [Google Scholar] [CrossRef]
- Zhu, Y.; Pan, Z.; McHugh, T.H.; Barrett, D.M. Processing and quality characteristics of apple slices processed under simultaneous infrared dry-blanching and dehydration with intermittent heating. J. Food Eng. 2010, 97, 8–16. [Google Scholar] [CrossRef]
- Goula, A.M.; Adamopoulos, K.G. Spray drying of tomato pulp in dehumidified air: II. The effect on powder properties. J. Food Eng. 2005, 66, 35–42. [Google Scholar] [CrossRef]
- Westerman, P.W.; White, G.M.; Ross, I.J. Relative humidity effect on the high temperature drying of shelled corn. Trans. ASABE 1973, 16, 1136–1139. [Google Scholar] [CrossRef]
- Onwude, D.I.; Hashim, N.; Janius, R.B.; Nawi, N.M.; Abdan, K. Modeling the thin layer drying of fruits and vegetables: A review. Compr. Rev. Food Sci. Food Saf. 2016, 15, 599–618. [Google Scholar] [CrossRef]
- Page, G.E. Factors Influencing the Maximum Rates of Air Drying Shelled Corn in Thin Layers. Master’s Thesis, Department of Mechanical Engineering, Prude University, West Lafayette, IN, USA, 2009. [Google Scholar]
- Yaldiz, O.; Ertekin, C. Thin layer solar drying of some different vegetables. Dry. Technol. 2001, 19, 583–596. [Google Scholar] [CrossRef]
- Yagcioglu, A.; Degirmencioglu, A.; Cagatay, F. Drying characteristics of laurel leaves under different conditions. In Proceedings of the 7th International Congress on Agricultural Mechanization and Energy, Adana, Turkey, 29 October–1 November 2023; Bascetincelik, A., Ed.; Faculty of Agriculture, Cukorova University: Adana, Turkey, 1999; pp. 565–569. [Google Scholar]
- Yaldiz, O.; Ertekin, C.; Uzun, H.I. Mathematical modeling of thin layer solar drying of Sultana grapes. Energy. 2001, 26, 457–465. [Google Scholar] [CrossRef]
- Rahman, M.S.; Perera, C.O.; Thebaud, C. Desorption isotherm and heat pump drying kinetics of peas. Food Int. Res. 1998, 30, 485–491. [Google Scholar] [CrossRef]
- Ozdemir, M.; Devres, Y.O. The thin layer drying characteristics of hazelnuts during roasting. J. Food Eng. 1999, 42, 225–233. [Google Scholar] [CrossRef]
- Verma, L.R.; Bucklin, R.A.; Endan, J.B.; Wratten, F.T. Effects of drying air parameters on rice drying models. Trans. ASAE 1985, 28, 296–301. [Google Scholar] [CrossRef]
- Karathanos, V.T. Determination of water content of dried fruits by drying kinetics. J. Food Eng. 1999, 39, 337–344. [Google Scholar] [CrossRef]
- Midilli, A.; Kucuk, H.; Yapar, Z. A new model for single layer drying of some vegetables. Dry. Technol. 2002, 20, 1503–1513. [Google Scholar] [CrossRef]
- Babalis, S.T.; Papanicolaou, E.; Kyriakis, N.; Belessiotis, V.G. Evaluation of thin layer drying models for describing drying kinetics of figs (Ficus carica). J. Food Eng. 2006, 75, 205–214. [Google Scholar] [CrossRef]
- Alibaş, I. Microwave drying of strawberry slices and the determination of the some quality parameters. J. Agric. Mach. Sci. 2012, 8, 161–170. [Google Scholar]
- Goyal, R.K.; Kingsly, A.R.P.; Manikantan, M.R.; Llyas, S.M. Mathematical modelling of thin layer drying kinetics of plum in a tunnel dryer. J. Food Eng. 2007, 79, 176–180. [Google Scholar] [CrossRef]
- Boy, V.; Mlayah, S.; Giblaine, M.; Lemee, Y.; Lanoiselle, J.-L. A case study at turbulent free jet flows issuing from rectangular slots on process performances and quality of hot-air-dried apple. Processes 2021, 9, 1900. [Google Scholar] [CrossRef]
- Statsoft Inc. STATISTICA for Windows; Statsoft Inc.: Tulsa, OK, USA, 2013. [Google Scholar]
- Reimann, C.; Filzmoser, P.; Garrett, R.; Dutter, R. Statistical Data Analysis Explained: Applied Environmental Statistics with R; John Wiley & Sons Ltd.: Chichester, UK, 2008. [Google Scholar]
- Edjabou, M.E.; Martin-Fernandez, J.A.; Scheutz, C.; Astrup, T.F. Statistical analysis of solid waste composition data: Arithmetic mean, standard deviation and correlation coefficients. Waste Manag. 2017, 69, 13–33. [Google Scholar] [CrossRef]
- Cruz, A.C.; Guiné, R.P.F.; Gonçalves, J.C. Drying Kinetics and Product Quality for Convective Drying of Apples (cvs. Golden Delicious and Granny Smith). Int. J. Fruit Sci. 2015, 15, 54–78. [Google Scholar] [CrossRef]
- Lechtanska, J.M.; Szadzinska, J.; Kowalski, S.J. Microwave and infrared-assisted convective drying of green pepper: Quality and energy considerations. Chem. Eng. Process. 2015, 98, 155–164. [Google Scholar] [CrossRef]
- Alibas, I.; Yilmaz, A. Microwave and convective drying kinetics and thermal properties of orange slices and effect of drying on some phytochemical parameters. J. Therm. Anal. Calorim. 2021, 147, 8301–8321. [Google Scholar] [CrossRef]
- Vishwanathan, K.H.; Giwari, G.K.; Hebbar, H.U. Infrared assisted dry-blancing and hybrid drying of carrot. Food Bioprod. Process. 2013, 91, 89–94. [Google Scholar] [CrossRef]
- Baysal, T.; Icier, F.; Ersus, S.; Yildiz, H. Effects of microwave and infrared drying on the quality of carrot and garlic. Eur. Food Res. Technol. 2003, 218, 68–73. [Google Scholar] [CrossRef]
- Vishwanathan, K.H.; Hebbar, H.U.; Raghavarao, K.S.M.S. Hot air assisted infrared drying of vegetables and its quality. Food Sci. Technol. Res. 2010, 15, 381–388. [Google Scholar] [CrossRef]
- Lewicki, P.P.; Jakubczyk, E. Effect of hot air temperature on mechanical properties of dried apples. J. Food Eng. 2004, 64, 307–314. [Google Scholar] [CrossRef]
- Bai, Y.; Rahman, M.S.; Perera, C.O.; Smith, B.; Melton, L.D. Structural changes in apple rings during convection air-drying with controlled temperature and humidity. J. Agric. Food Chem. 2002, 50, 3179–3185. [Google Scholar] [CrossRef]
- Dhurve, P.; Arora, V.K.; Yadav, D.K.; Malakar, S. Drying kinetics, mass transfer parameters, and specific energy consumption analysis of watermelon seeds dried using the convective dryer. Mater. Today 2020, 50, 926–932. [Google Scholar] [CrossRef]
- Murugesan, K.; Thomas, H.R.; Cleall, P.J. An investigation of the influence of two-stage drying conditions on convective drying of porous materials. Int. J. Num. Meth. Heat Fluid Flow 2002, 12, 29–46. [Google Scholar] [CrossRef]
- Yu, X.L.; Zielinska, M.; Ju, H.Y.; Mujumdar, A.S.; Duan, X.; Gao, Z.J.; Xiao, H.W. Multistage relative humidity control strategy enhances energy and exergy efficiency of convective drying of carrot slices. Int. J. Heat Mass Transf. 2020, 149, 119231. [Google Scholar] [CrossRef]
- Doymaz, I. Drying behaviour of green beans. J. Food Eng. 2005, 69, 161–165. [Google Scholar] [CrossRef]
- Onwude, I.; Hashim, N.; Abdan, K.; Janius, R.; Chen, G. The effectiveness of combined infrared and hot-air drying strategies for sweet potato. J. Food Eng. 2019, 241, 75–87. [Google Scholar] [CrossRef]
- Bitencourt, B.S.; Correa, J.L.G.; Carvalho, G.R.; Augusto, P.E.D. Valorization of pineapple pomace for food or feed: Effects of pre-treatment with ethanol on convective drying and quality properties. Waste Biomass Valori. 2022, 13, 2253–2266. [Google Scholar] [CrossRef]
- Chia, Z.B.; Putranto, A.; Chen, X.D.; Onwude, D.I. Combined infrared and hot air drying (IR-HAD) of sweet potato explored using a multiphase model: Application of reaction engineering approach. Dry. Technol. 2022, 40, 1629–1638. [Google Scholar] [CrossRef]
- Simal, S.; Mulet, A.; Tarrazo, J.; Rossello, C. Drying models for green peas. Food Chem. 1996, 55, 121–128. [Google Scholar] [CrossRef]
- Panchariya, P.C.; Popovic, D.; Sharma, A.L. Thin-layer modelling of black tea drying process. J. Food Eng. 2002, 52, 349–357. [Google Scholar] [CrossRef]
- Moradi, M.; Niakousari, M.; Khaneghah, A.M. Kinetics and mathematical modeling of thin layer drying of osmo-treated Aloe vera (Aloe barbadensis) gel slices. J. Food Process Eng. 2019, 42, e13180. [Google Scholar] [CrossRef]
- Hasan, T. Simple modelling of infrared drying of fresh apple slices. J. Food Eng. 2005, 71, 311–323. [Google Scholar]


| Model Name | Model | References |
|---|---|---|
| Newton and Lewis | [20,45,67,74,75] | |
| Page | [20,45,67,74,75,76] | |
| Modified page | [45,75,77] | |
| Henderson and Pabis | [45,75,78] | |
| Logarithmic | [20,45,67,75,79] | |
| Two-term | [20,45,75,80] | |
| Two-term exponential | [45,67,75,77] | |
| Wang and Singh | [45,67,75,81] | |
| Approximation of diffusion | [20,45,67,75,79] | |
| Verma et al., 1985 [82] | [20,45,67,82] | |
| Modified Henderson and Pabis | [45,75,83] | |
| Midilli et al., 2002 [84] | [20,45,67,84] | |
| Weibull distribution | [21,85] | |
| Alibas | [21,86] |
| Calculated Parameters | Infrared Drying at 70 °C | Hot Air Oven Drying at 70 °C | ||||
|---|---|---|---|---|---|---|
| Mean | ±SD | % CV | Mean | ±SD | % CV | |
| 42.883 | 3.902 | 9.099 | 43.984 | 1.643 | 3.736 | |
| 11.097 | 6.857 | 61.793 | 20.716 | 5.291 | 25.539 | |
| 6.244 | 0.721 | 11.551 | 7.392 | 0.904 | 12.236 | |
| 7.350 | 6.515 | 88.640 | 5.458 | 1.328 | 24.330 | |
| 29.012 | 0.793 | 2.735 | 24.055 | 7.200 | 29.934 | |
| 12.536 | 10.776 | 85.961 | 25.083 | 0.603 | 2.405 | |
| 36.773 | 7.520 | 20.449 | 24.085 | 3.370 | 13.990 | |
| 17.676 | 10.332 | 58.451 | 6.128 | 0.605 | 9.873 | |
| 63.254 | 36.841 | 58.244 | 10.525 | 0.384 | 3.650 | |
| 9.409 | 4.710 | 50.052 | 16.642 | 4.764 | 28.642 | |
| 275.138 | 156.695 | 56.951 | 417.610 | 243.270 | 58.253 | |
| 60.081 | 1.072 | 1.785 | 77.768 | 2.611 | 3.357 | |
| 1.670 | 0.144 | 8.637 | 2.053 | 0.027 | 1.332 | |
| 53.722 | 0.469 | 0.873 | 56.790 | 1.425 | 2.508 | |
| 0.284 | 0.027 | 9.360 | 0.315 | 0.022 | 7.008 | |
| 9005.683 | 730.973 | 8.117 | 9368.521 | 145.169 | 1.550 | |
| 5825.287 | 436.630 | 7.495 | 6602.650 | 165.364 | 2.505 | |
| 30.923 | 1.714 | 5.542 | 31.021 | 0.736 | 2.372 | |
| 14.307 | 0.648 | 4.531 | 13.399 | 0.124 | 0.927 | |
| Calculated Parameters | Infrared Drying at 80 °C | Hot Air Oven Drying at 80 °C | ||||
|---|---|---|---|---|---|---|
| Mean | ±SD | % CV | Mean | ±SD | % CV | |
| 43.223 | 2.933 | 6.786 | 46.425 | 3.258 | 7.017 | |
| 3.088 | 1.165 | 37.737 | 12.188 | 10.316 | 84.644 | |
| 4.601 | 1.360 | 29.557 | 4.502 | 2.672 | 59.361 | |
| 0.679 | 0.431 | 63.468 | 4.181 | 3.416 | 81.713 | |
| 26.719 | 0.169 | 0.633 | 28.923 | 1.838 | 6.354 | |
| 1.026 | 0.711 | 69.297 | 10.806 | 9.276 | 85.840 | |
| 47.844 | 1.046 | 2.185 | 38.810 | 9.705 | 25.006 | |
| 26.018 | 0.805 | 3.093 | 18.125 | 7.447 | 41.089 | |
| 240.154 | 107.063 | 44.581 | 52.216 | 46.272 | 88.616 | |
| 3.078 | 1.155 | 37.509 | 11.074 | 8.899 | 80.357 | |
| 52.496 | 20.608 | 39.257 | 186.910 | 4.467 | 2.390 | |
| 55.838 | 1.990 | 3.565 | 68.317 | 1.250 | 1.830 | |
| 1.699 | 0.117 | 6.893 | 1.670 | 0.234 | 13.991 | |
| 39.815 | 2.671 | 6.708 | 57.282 | 4.745 | 8.283 | |
| 0.187 | 0.008 | 4.088 | 0.338 | 0.009 | 2.666 | |
| 9055.354 | 1001.409 | 11.059 | 8245.719 | 970.837 | 11.774 | |
| 8795.898 | 1003.753 | 11.412 | 7625.466 | 828.761 | 10.868 | |
| 29.719 | 4.558 | 15.337 | 27.149 | 3.794 | 13.976 | |
| 17.826 | 1.950 | 10.937 | 11.507 | 0.334 | 2.898 | |
| (a) | |||||||||
|---|---|---|---|---|---|---|---|---|---|
| Model Name | (°C) | Drying Methods | Model Coefficients/Constants (k, n, a, and c) | RMSE | χ2 | R2 | EF | ||
| Page * | 70 ** | IR * | k 0.005487 | n 1.189299 | 0.070680 | 0.000041 | 0.999248 | 0.999992 | |
| OV * | 0.001358 | 1.320076 | 0.124774 | 0.000338 | 0.996488 | 0.99909 | |||
| Logarithmic * | 70 ** | IR * | a 1.077076 | k 0.013660 | c −0.005972 | 0.104138 | 0.000190 | 0.996488 | 1 |
| OV * | 1.123411 | 0.006597 | −0.057317 | 0.150237 | 0.000680 | 0.991783 | 1 | ||
| Page * | 80 ** | IR * | k 0.010195 | n 1.101400 | 0.063898 | 0.000024 | 0.999653 | 0.999259 | |
| OV * | 0.001911 | 1.315627 | 0.094260 | 0.000146 | 0.998141 | 0.999737 | |||
| Logarithmic * | 80 ** | IR * | a 1.053957 | k 0.016772 | c 0.001478 | 0.063429 | 0.000035 | 0.999205 | 1 |
| OV * | 1.113527 | 0.009167 | −0.025581 | 0.145513 | 0.000625 | 0.991444 | 1 | ||
| (b) | |||||||||
| Model Name | (°C) | Drying Methods | Model Coefficients/Constants | ||||||
| k | a | b | n | ||||||
| Weibull distribution | 70 ** | IR * | 0.004899 | 0.001273 | −0.98763 | 1.212419 | |||
| OV * | 0.000938 | −0.01397 | −0.96946 | 1.37482 | |||||
| 80 ** | IR * | 0.010951 | 0.004149 | −1.01219 | 1.091566 | ||||
| OV * | 0.001302 | −0.00257 | −0.96673 | 1.38421 | |||||
| (c) | |||||||||
| Model Name | (°C) | Drying Methods | Statistical Metrics | ||||||
| RMSE | χ2 | R2 | EF | ||||||
| Weibull distribution | 70 ** | IR * | 0.067883 | 0.000039 | 0.999284 | 1 | |||
| OV * | 0.108892 | 0.000188 | 0.997744 | 1 | |||||
| 80 ** | IR * | 0.050042 | 0.000009 | 0.999806 | 1 | ||||
| OV * | 0.090309 | 0.000105 | 0.998569 | 1 | |||||
| Calculated Parameters | Infrared Drying Temperature °C | Hot Air Oven Drying Temperature °C | ||
|---|---|---|---|---|
| Correlation Coefficient, r | p-Value | Correlation Coefficient, r | p-Value | |
| 0.380 | >0.05 | 0.419 | >0.05 | |
| −0.847 | <0.05 | −0.281 | >0.05 | |
| −0.316 | >0.05 | −0.013 | >0.05 | |
| −0.620 | >0.05 | 0.156 | >0.05 | |
| −0.216 | >0.05 | 0.076 | >0.05 | |
| −0.799 | <0.05 | −0.097 | >0.05 | |
| ΔE | 0.853 | <0.05 | 0.385 | >0.05 |
| ΔC | 0.731 | <0.05 | 0.172 | >0.05 |
| CI | 0.764 | <0.05 | 0.497 | >0.05 |
| WI | −0.847 | <0.05 | −0.335 | >0.05 |
| −0.321 | >0.05 | 0.315 | >0.05 | |
| Hue° | −0.520 | >0.05 | −0.580 | >0.05 |
| RR | 0.249 | >0.05 | 0.554 | >0.05 |
| −0.443 | >0.05 | 0.511 | >0.05 | |
| −0.761 | <0.05 | −0.831 | <0.05 | |
| 0.420 | >0.05 | 0.183 | <0.05 | |
| 0.701 | <0.05 | 0.738 | <0.05 | |
| 0.499 | >0.05 | 0.394 | >0.05 | |
| 0.756 | <0.05 | −0.002 | >0.05 | |
| Infrared Drying Temperature °C | |||
|---|---|---|---|
| Calculated Parameters | R2 | F-Value | p-Value |
| 0.876 | 8.826 | <0.05 | |
| ΔE | 0.832 | 6.179 | <0.05 |
| CI | 0.815 | 5.499 | <0.05 |
| WI | 0.877 | 9.917 | <0.05 |
| 0.896 | 10.827 | <0.05 | |
| 0.894 | 10.586 | <0.05 | |
| 0.846 | 6.841 | <0.05 | |
| Hot air oven drying temperature °C | |||
| Hue° | 0.878 | 8.973 | <0.05 |
| RR | 0.876 | 8.821 | <0.05 |
| 0.874 | 8.634 | <0.05 | |
Disclaimer/Publisher’s Note: The statements, opinions and data contained in all publications are solely those of the individual author(s) and contributor(s) and not of MDPI and/or the editor(s). MDPI and/or the editor(s) disclaim responsibility for any injury to people or property resulting from any ideas, methods, instructions or products referred to in the content. |
© 2023 by the authors. Licensee MDPI, Basel, Switzerland. This article is an open access article distributed under the terms and conditions of the Creative Commons Attribution (CC BY) license (https://creativecommons.org/licenses/by/4.0/).
Share and Cite
Dajbych, O.; Kabutey, A.; Mizera, Č.; Herák, D. Investigation of the Effects of Infrared and Hot Air Oven Drying Methods on Drying Behaviour and Colour Parameters of Red Delicious Apple Slices. Processes 2023, 11, 3027. https://doi.org/10.3390/pr11103027
Dajbych O, Kabutey A, Mizera Č, Herák D. Investigation of the Effects of Infrared and Hot Air Oven Drying Methods on Drying Behaviour and Colour Parameters of Red Delicious Apple Slices. Processes. 2023; 11(10):3027. https://doi.org/10.3390/pr11103027
Chicago/Turabian StyleDajbych, Oldřich, Abraham Kabutey, Čestmír Mizera, and David Herák. 2023. "Investigation of the Effects of Infrared and Hot Air Oven Drying Methods on Drying Behaviour and Colour Parameters of Red Delicious Apple Slices" Processes 11, no. 10: 3027. https://doi.org/10.3390/pr11103027
APA StyleDajbych, O., Kabutey, A., Mizera, Č., & Herák, D. (2023). Investigation of the Effects of Infrared and Hot Air Oven Drying Methods on Drying Behaviour and Colour Parameters of Red Delicious Apple Slices. Processes, 11(10), 3027. https://doi.org/10.3390/pr11103027