Article

Stochastic Approach for Increasing the PV Hosting Capacity of a Low-Voltage Distribution Network †

Faculty of Electrical Engineering and Information Technology, Slovak University of Technology in Bratislava, Ilkovičova 3, 81 219 Bratislava, Slovakia
*
Author to whom correspondence should be addressed.
This paper is an extended version of the paper published at the International Conference 22nd International Scientific Conference on Electric Power Engineering 2022 (EPE), Loučná nad Desnou, Czech Republic, 8–10 June 2022.
These authors contributed equally to this work.
Processes 2023, 11(1), 9; https://doi.org/10.3390/pr11010009
Submission received: 14 October 2022 / Revised: 12 December 2022 / Accepted: 16 December 2022 / Published: 21 December 2022
(This article belongs to the Special Issue Recent Advances in Electrical Power Engineering)

Abstract

:
In recent years, the emerging fear of an energy crisis in central Europe has caused an increased demand for distributed energy resources (DER), especially small photovoltaic rooftop installations up to 10 kWp. From a technical point of view, distributed PV in low-voltage networks is associated with the risk of power quality violation, overvoltage, voltage unbalance, harmonics, and violation of the thermal limit of phase conductors, neutral conductors, and transformers. Distribution system operators (DSO) are currently in a position to determine the amount of installed PV power for which reliable and safe network operation is ensured, also known as the photovoltaic hosting capacity (PVHC). The presented study describes a stochastic methodology for PVHC estimation and uses it to analyze a typical LV rural network in the Slovak Republic. Detailed and precise calculations are performed on the 4-wire LV model with accurate results. In this study, we, thus, profoundly analyze the problems with voltage violation, unbalanced voltage energy losses, and the thermal loading effect of increasing PV penetration. The results show that overvoltage events are the main factor limiting the PVHC in LV systems. This conclusion is in accordance with the experience of the DSO in the Slovak and Czech Republic. Subsequently, the study focuses on the possibilities of increasing PVHC using those tools typically available for DSO, such as changes in PV inverter power factors and no-load tap changer transformers. The results are compared with those derived from similar analyses, but we ultimately find that the proposed solution is problematic due to the high variability of approaches and boundary conditions. In conclusion, the paper discusses the issue of the acceptable risk of overvoltage violation in the context of PVHC and lowering losses in LV networks.

Graphical Abstract

1. Introduction

Distributed energy resources (DERs) are, according to the simple definition, described as relatively small-scale resources installed close to energy consumption sites [1]. They are represented by a variety of technologies, of which photovoltaic systems (PV), wind turbine power plants (WT), electric vehicles (EV), and battery energy storage (BESS) are the most prominent examples. Given the nature of DERs, they can generate, store, or manage energy at the point of consumption (PoC) to which they are connected. The greatest expansion of DERs in the past few years has been driven by “behind-the-meter” installations, which are more difficult to monitor or predict from the view of distribution system operators (DSOs), which, as a result, disrupts traditional electricity markets and results in the lack of proper regulation. Currently, DERs account for a small proportion of energy sources in the grid [2]. Some estimates suggest that by 2024, the global rated power of DERs will outnumber that of centralized energy generation by more than 5-to-1 [3]. However, this trend was noticeably slowed down by the outbreak of the COVID-19 pandemic [4] and the current geopolitical situation.

1.1. Current State of PV Systems

Power from DERs is not always produced with a zero carbon footprint. Still, renewable DERs are gaining increased popularity thanks to environmental policies and the falling cost of solar PV technology [5]. Over the past decades, we have witnessed an increase in energy generation from RES, and their share of world energy production reached almost 30% in 2021 [6]. These global trends are even more visible in the EU [7]. Energy consumption from RES in the Czech Republic has grown from 10.51% in 2010 to 17.30% in 2020 [8]. Prediction of RES growth is strongly supported by new EU targets, such as increasing the energy from renewables by up to 40% by 2030 [9].
In 2021, 172 GWp of PV capacity was added globally, bringing the cumulative total to 939 GWp, which is equal to a 19% rise compared with the addition of the previous year, whereas the top 10 countries installed 74% of global installations. China, the largest market, installed a record 55 GWp (309 GWp cumulative). Analysts project increased annual global PV installations over the next four years, with continued growth in China, the United States, Europe, and India. In addition, approximately 250 MW of concentrated solar power (CSP) was added in China and 110 MW in Chile in 2021. An additional 1.7 GW of CSP is currently under construction. From 2010 to 2021, global PV capacity additions grew from 17 to 172 GW, according to the International Energy Agency (IEA) [10,11].
A large portion of DERs is represented by 1 kW–5 MW rooftop PV installations, wind turbines, and battery storage systems. Due to the increasingly lower prices of these devices, they are often located on the side of consumers [12,13,14]. According to the IEA, another element contributing to the list of storage/consumption devices is EVs, especially in China, Europe, and the United States [6,11]. The combination of all these DERs, storage systems, and EVs brings the power system to the brink of slow but steady transformation [15,16,17,18,19,20].
All these technologies share the significant aspect of uncertainty in the means of power production, consumption, and topology [21] and have a direct impact on power systems such as through:
  • high penetration of PV, which can cause overloading of the transformers or overvoltages [13,22];
  • asymmetry in the voltage and current flow of neutral conductors in low-voltage distribution systems, which is caused by single-phase production/consumption devices;
  • improper integration of EVs into distribution systems, which can result in the technology not being reliable [15,23];
  • thermal effects caused by the high current in phase or neutral conductors, which increase losses.

1.2. Photovoltaic Hosting Capacity

The fundamental problem of DSOs is the determination of hosting capacity for individual DER technologies as well as for their combinations [24,25,26]. Traditional deterministic models are not reliable for modeling systems with a high level of unpredictability. Zain et al. have shown that stochastic approaches combining the probabilistic definitions of unpredictable parameters and the Monte Carlo method on unknown parameters must be applied to these problems [26]. This approach has been widely adopted in recent years by several research groups [15,24,27,28,29].
In general, HC represents an amount of DER that can be connected to any network while technical limits, the distribution network’s operational criteria, and thermal limits will not be violated, and the performance of the network will stay in the acceptable range. The concept of HC was first introduced by André Even [30]. Similar to HC, the photovoltaic HC (PVHC) defines the maximum PV penetration limit in the analyzed network [31]. This limit is dependent on several factors, such as:
  • the power of the installed PV;
  • type of network, voltage level, whether there is a 3- or 4-wire system;
  • PV connection, single or three-phase;
  • PV type, concentrated or distributed;
  • global irradiation, wind conditions, ambient temperature variations;
  • load type;
  • network characteristics such as rural or urban network, line impedances, feeder lengths, overhead power lines, or cable lines;
  • BESS integration;
  • transformer rating, construction, and regulation capabilities for tap changing [32].
The most common PVHC definitions based on different references are as follows [31]:
  • Peak load is the ratio of the PV system’s maximum capacity to the feeder’s peak load. It is estimated that 47% of all PVHC studies use this definition.
  • TR rating represents the ratio between the sum of PV production to the TR rated capacity [33]. This is used in around 20% PVHC studies.
  • PoC ratio is defined as the ratio of PoC equipped with PV to the total number of PoC [34]. PoC ratio is used in around 20% of PVHC studies.
  • Energy ratio is the ratio between yearly energy generation by PV system to energy consumption from all PoC [35]. It is used in around 7% of PVHC studies.
  • Active power ratio is the ratio of PV power output to the active power of load at PoC. Around 5% of PVHC studies use this definition.
  • Roof space PV is the roof space of PoC with PV installation in one feeder. Around 2% of PVHC studies use this definition.

1.2.1. Limitations of Photovoltaic Hosting Capacity

Three main factors determine the limits of the PVHC [36]:
  • power quality standards;
  • thermal limits of conductors and TR;
  • element fault current.
Hereafter, we focus only on power quality standards and thermal limits, which are crucial for LV networks [36]. A complex evaluation of PVHC criteria has been conducted by The Electric Power Research Institute (EPRI) in [37,38]. Different power quality standards of DSOs result in different values of PVHC. This is further analyzed in the Discussion section. The common power quality limitations are now discussed.

Voltage Violations

According to [31], the PVHC in 48% of all networks is limited by voltage violations, mostly overvoltages due to reverse power flow in the network. Several standards implement different voltage limits for LV networks, e.g., EN-50160:2010, which limits the nominal line to neutral voltage, in a 4-wire system, to 230 V ± 10% for all 10 min average values for 95% of the time in a week. Undervoltage of −15% is permissible in exceptional cases, such as when networks are disconnected from transmission grids and microgrids or in the case of remote network users. In this case, the limit must be 100% of the time in a week [39]. Several other standards are far more strict, e.g., American standard ANSI C84.1 allows a ±5% deviation from nominal voltage [40].
In the case of stochastic studies, such as this one, the voltage limit has an acceptable violation probability of typically 5% [41,42].

Voltage Unbalance

Voltage unbalance in the LV network increases with the extent of unequal load and generation distributed among phases. By definition, voltage unbalance, α V U F , is the ratio of the negative sequence voltage to the positive sequence voltage. In the case of a 4-wire network, α V U F is calculated from line to neutral voltages [43]. Voltage unbalances cause asymmetry in phase currents and results in an increased flow of current in the neutral conductor in 4-wire systems, which are often not designed to handle a large amount of current. Voltage unbalance can be increased in an LV network if single-phase distributed PV systems are preferably connected into one specific phase. The limit for voltage unbalance is 2% according to EN-50160:2010 [39], and 3% for ANSI C84.1 [40]. In the case of stochastic studies, voltage unbalance has an acceptable violation probability, typically 5% [41,42].

Harmonics and Supraharmonics

Modern nonlinear loads, PV inverters, or BESS inverters can represent the source of harmonics. International standards usually deal with harmonics up to 40th order [39]. EN-50160:2010 sets the limit for voltage total harmonic distortion (THD), defined by IEEE-519 [44], at 8%.
The newest modern inverts effectively suppress standard harmonic frequencies. However, they tend to emit at even higher frequencies, supraharmonics, up to 150 kHz [45]. Supraharmonic distortion limits have not yet been established [46]. Both harmonics and supraharmonics present possible limitations to PVHC.
Another category of PVHC limitation factors are the thermal limits of conductors and TR. Overall, it is estimated that ampacity is the second major factor limiting PVHC [31]. Thermal limits can be divided into:
  • Thermal limit of phase conductors—increased power flow from significant PV penetration results in reverse current flow in the phase conductor.
  • Thermal limit of neutral conductor—this is an issue only in a 4-wire LV network with a higher voltage unbalance. The neutral conductor is commonly designed with lower ampacity as in phase conductors.
  • Thermal limit of TR—can be violated in the case of reverse flow of power due to PC installations, e.g., from LV network to MV network.
Increasing PV in LV networks does not always lead to increased conductor currents and TR loading. If the PoC is capable of consuming most of the generated power, then the opposite is true, and line and transformer losses decrease [30,47].

1.2.2. Increasing PV Hosting Capacity

Most limit violation issues occur during the summer when there is peak generation of PV systems and where the load demand is usually the lowest (depending on the region), causing the voltage rise from the substation as the source. On the other hand, the residential PV systems, DERs connected to LV grids, change their operating characteristics from volatile demand-only to volatile demand and supply. With such a PV system, the standard load-driven voltage drop is attenuated, which leads to higher voltage values within the grid, potentially pushing it beyond the DSO limits [48,49]. Improvement of the PHVC has always had a regional character and, therefore, cannot be solved with a set of universal precautions. Instead, a detailed simulation should be carried out for each case [50,51].
(a)
Grid uprating
Grid uprating can effectively decrease the voltage rise in the PoC. The main drawback of grid reinforcement is the high cost associated with this method [50].
(b)
Dynamic line rating
Dynamic line rating (DLR) is represented by the reevaluation of the distribution line ampacity, taking the actual, real-time, meteorological data throughout the year into consideration, causing its allowable current rating to be a function of time. Therefore, it is sometimes referred to as real-time thermal rating [52]. This solution is only applicable to overhead power lines.
(c)
Reactive power management
Reactive power control by PV is a cost-effective solution, but it has limited potential for increasing the PVHC [53,54]. The possible mitigation of the voltage drop is lower in electrical grids with ground cables compared to grids with OPL because of the lower inductance per unit length values. Injecting reactive power into the grid increases the losses. The inverters that can support the grid with reactive power are not standard for residential PV systems. Another aspect discussed is that the change of PF at the PoC from 0.8 leading (generating reactive power) to 0.8 lagging (absorbing reactive power) can increase PVHC by nearly 7 times compared with the case with a PV inverter generating reactive power. More case studies regarding power quality improvements can be found in [31].
(d)
Active distribution transformers
The obvious choice, in this case, would be the on-load tap-changers (OLTCs) on supply transformers, which in this configuration are sometimes referred to as active transformers. Furthermore, modern solid-state OLTCs can operate in a range from 100 ms to seconds, which is very close to the standard BESS. The utilization of active MV/LV transformers in LV grids with high PV penetration is still uncommon.
(e)
Battery energy storage systems
BESS can be utilized to store a part of the PV-generated energy and minimize the amount of injected active power back into the grid, thus, overcoming overvoltage issues. This stored energy can be used later when electricity prices are high or during emergencies. The main problem with BESS is the initial investment. The main potential of customer-owned BESS as a distributed control strategy is in fully utilizing the active power potential of BESS. At the same time, centralized BESS are an efficient means to improve the PVHC in remote areas [55].

1.3. Our Contribution

A large number of studies deal with the topic of PVHC, some of which are summarized in the Introduction. In the region of the Slovak Republic, however, stochastic methods remain in the background. In this paper, we point out the wide possibilities of such modeling and its benefits for the upcoming development of DERs in the region. It is up to the DSOs to determine acceptable risks because they are the ones that ultimately define PVHC.
This paper presents the general stochastic methodology for modeling of power system with custom penetration of any DER. The analysis of such a model to properly determine HC and the possible future risk of DER on the power network is presented. It is shown that the resulting PVHC is highly dependent on permissible power quality limit violations. The limitation of the presented methodology is only the quality of the data on which the model is based. This approach can be applied to any level of model detail.
This paper is organized as follows. Section 2 presents a general stochastic methodology for calculating PVHC. Section 3 describes case study model parameters and analyzed scenarios. The presented model is based on a real rural LV network (230 V) in the Slovak Republic. We focus on PV sources defined as small sources (SS) in the Slovak Republic, which are only those up to kW [56]. SS are typically rooftop installations. Our approach is based on stochastic PVHC modeling of PV and load parameters. A detailed model of a 4-wire LV network with 139 unbalanced stochastic loads was built for analysis.
Section 4 presents the results of the analysis and deals with the question of increasing PVHC in conditions of Slovak DSOs through tap changes at DETC, and the static power factors of PV inverters are investigated and analyzed.

2. Materials and Methods

2.1. Determining Photovoltaic Hosting Capacity

There are two concepts for the calculation of PVHC, deterministic and stochastic. The deterministic approach can be characterized as a simple and relatively easy solution for which there is no requirement to process a large amount of data. PVHC is primarily represented as single values. Loads and PV sizes are deterministic, as well as their grid connection [57]. A typical variable in deterministic calculation is the number of PoC with PV connection. The deterministic analysis is valid only for the worst-case situation regardless of the probability of its occurrence [42].
Stochastic PVHC calculation considers the uncertainties of the characteristics of a custom object and its parameters, e.g., size of loads, distribution of 3-phase load among each phase, size of the PV system, and whether the PV system connection is single or 3-phase [42]. Using the stochastic approach, PVHC limits can also be expressed with probabilities of violation. In an ideal calculation, PVHC should be expressed in the form of a probability function [58] or defined together with the risk of limit violation, e.g., PVHC 30% with 1% risk of overvoltage.

Description of General PVHC Calculation Model

In this section, we describe the general concept of PVHC calculation used and developed by the authors. The PVHC calculation presented in this paper combines stochastic principles with deterministic descriptions of the selected model parameters.
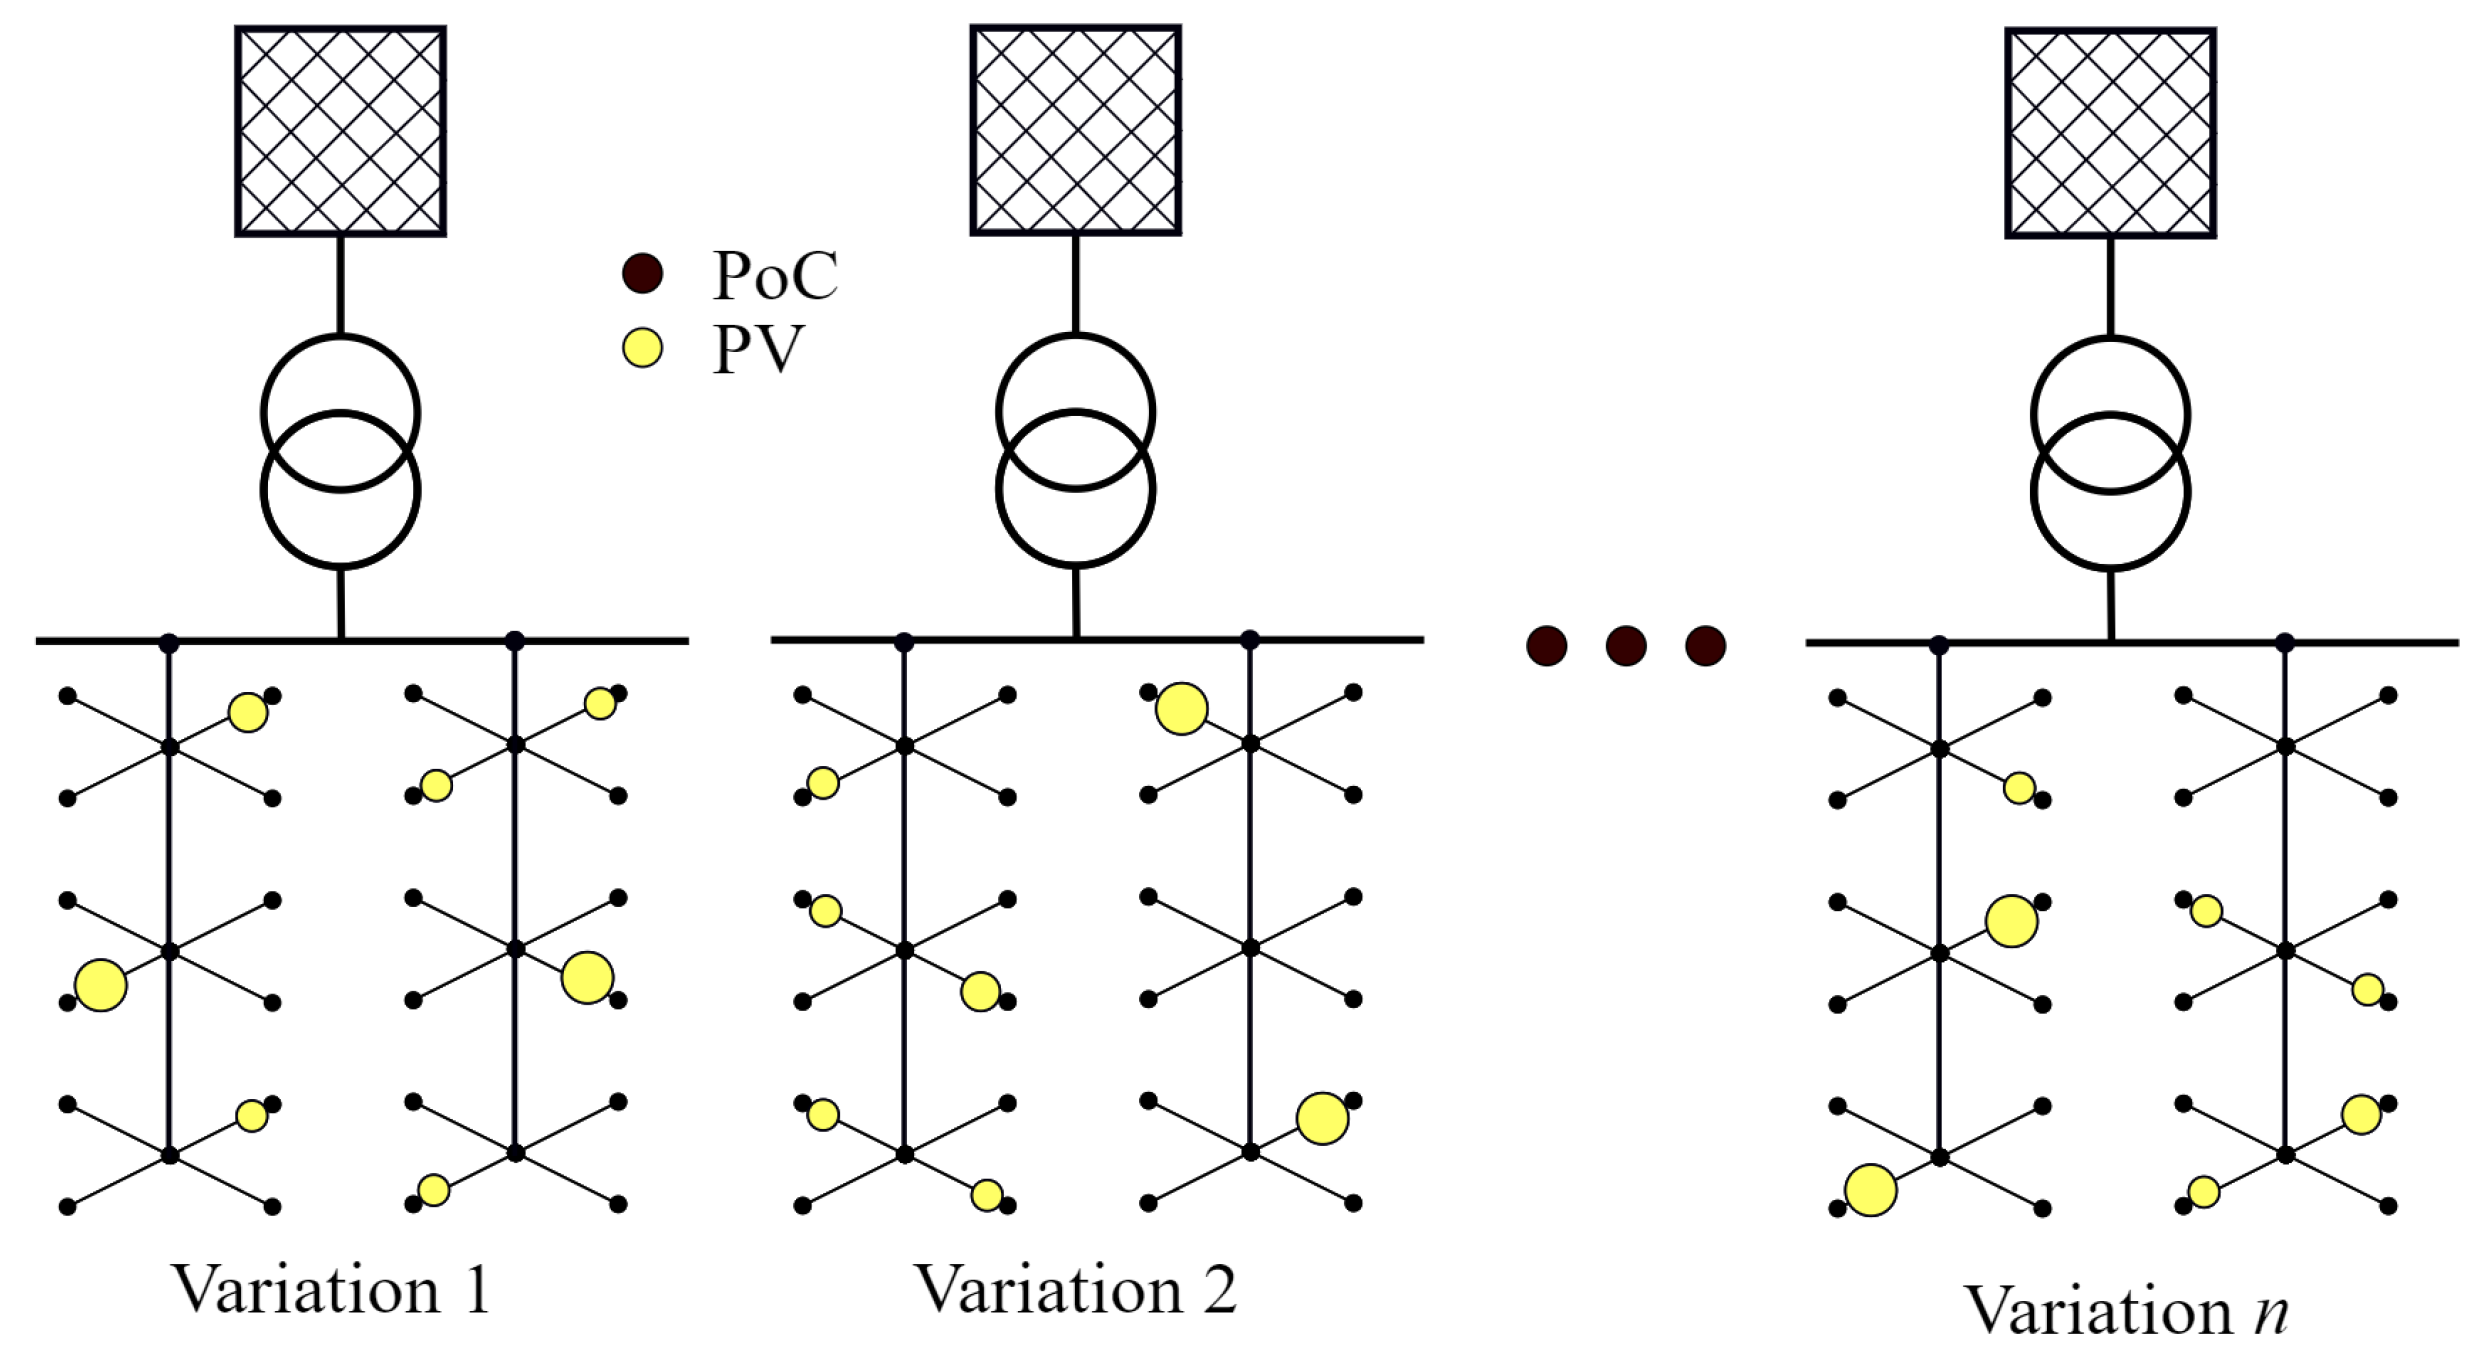
The primary model variable is a DER penetration index (DPI) for which any type of PVHC definition can be used. Typical PVHC definitions are listed in Section 1.2. The concept of the model is to calculate probabilistic power flow (PPF) for increasing values of DPI. Every single PPF calculation consists of multiple model variations (VR), Figure 1. Each model VR is generated using model probabilities (PV size, load distribution, etc.) and the Monte Carlo method (position of PV), Figure 2. Calculation of single model VR means conducting steady-state time-series calculation.
The results of PPF from multiple VR calculations for a single DPI are network quantities, powers, voltages, and currents. These quantities are investigated at different levels of DPI. PVHC is then calculated by comparing these network parameters and their probabilities with PVHC limits.
The number of generated and calculated VR for each DPI is an essential calculation parameter. The more VR that have been analyzed, the larger the number of possible grid configurations examined and the more realistic the results. On the other hand, computation with many VR is time-consuming in terms of calculation and data analysis, especially for large networks.A sufficient number of VR represents the stabilization of defined global network parameters, such as overvoltage probability in each incremental step. The model developed in this study was implemented using OpenDSS software with a COM interface and Python programming language.

2.2. Optimal Data

We distinguish two types of data required for stochastic PVHC modeling. The first is static information about the system topology and its parameters. It is necessary to know these data in the greatest possible detail and, in case of uncertainties, implement them in normal distributions. Simplifications such as 1-phase calculation should be avoided. The second category of data is time-evolving data. The optimal data for stochastic PVHC calculation are in the form of probability density function for each time step, e.g., PoC load shapes and meteorological data.

3. Description of Case Study

The analysis aims to determine the actual and possible future PVHC of the LV 0.4 kV network situated in a rural area of the Slovak Republic. The model is built on real topology, grid parameters, PoC characteristics, and meteorological data measured at the location of the network and small source PV probability distribution characteristics provided by DSO.
The main characteristics of the model are:
  • steady state time-series calculations are made for one year at 1-h time steps;
  • the LV network has static topology and is connected to a 22 kV MV system through two winding 22/0.4 kV 250 kVA DETC power transformers;
  • the model is built and calculated as a typical 4-wire LV European system with 3-phase conductors and one neutral conductor;
  • the model consists of 139 PoC separated into eight categories by their tariff, where each category is defined by a different yearly load shape;
  • the model combines probabilistic and deterministic parameters described in detail in the following section.

3.1. Analyzed Scenarios

The following scenarios of PVHC were performed on the presented LV network:
V0
basic state of the model;
V1
influence of different PV power factors on PVHC;
V2
influence of tap change on DETC power factor on PVHC;
V3
influence of BESS parallel to PV on PVHC.

3.2. Model Topology and Electrical Parameters

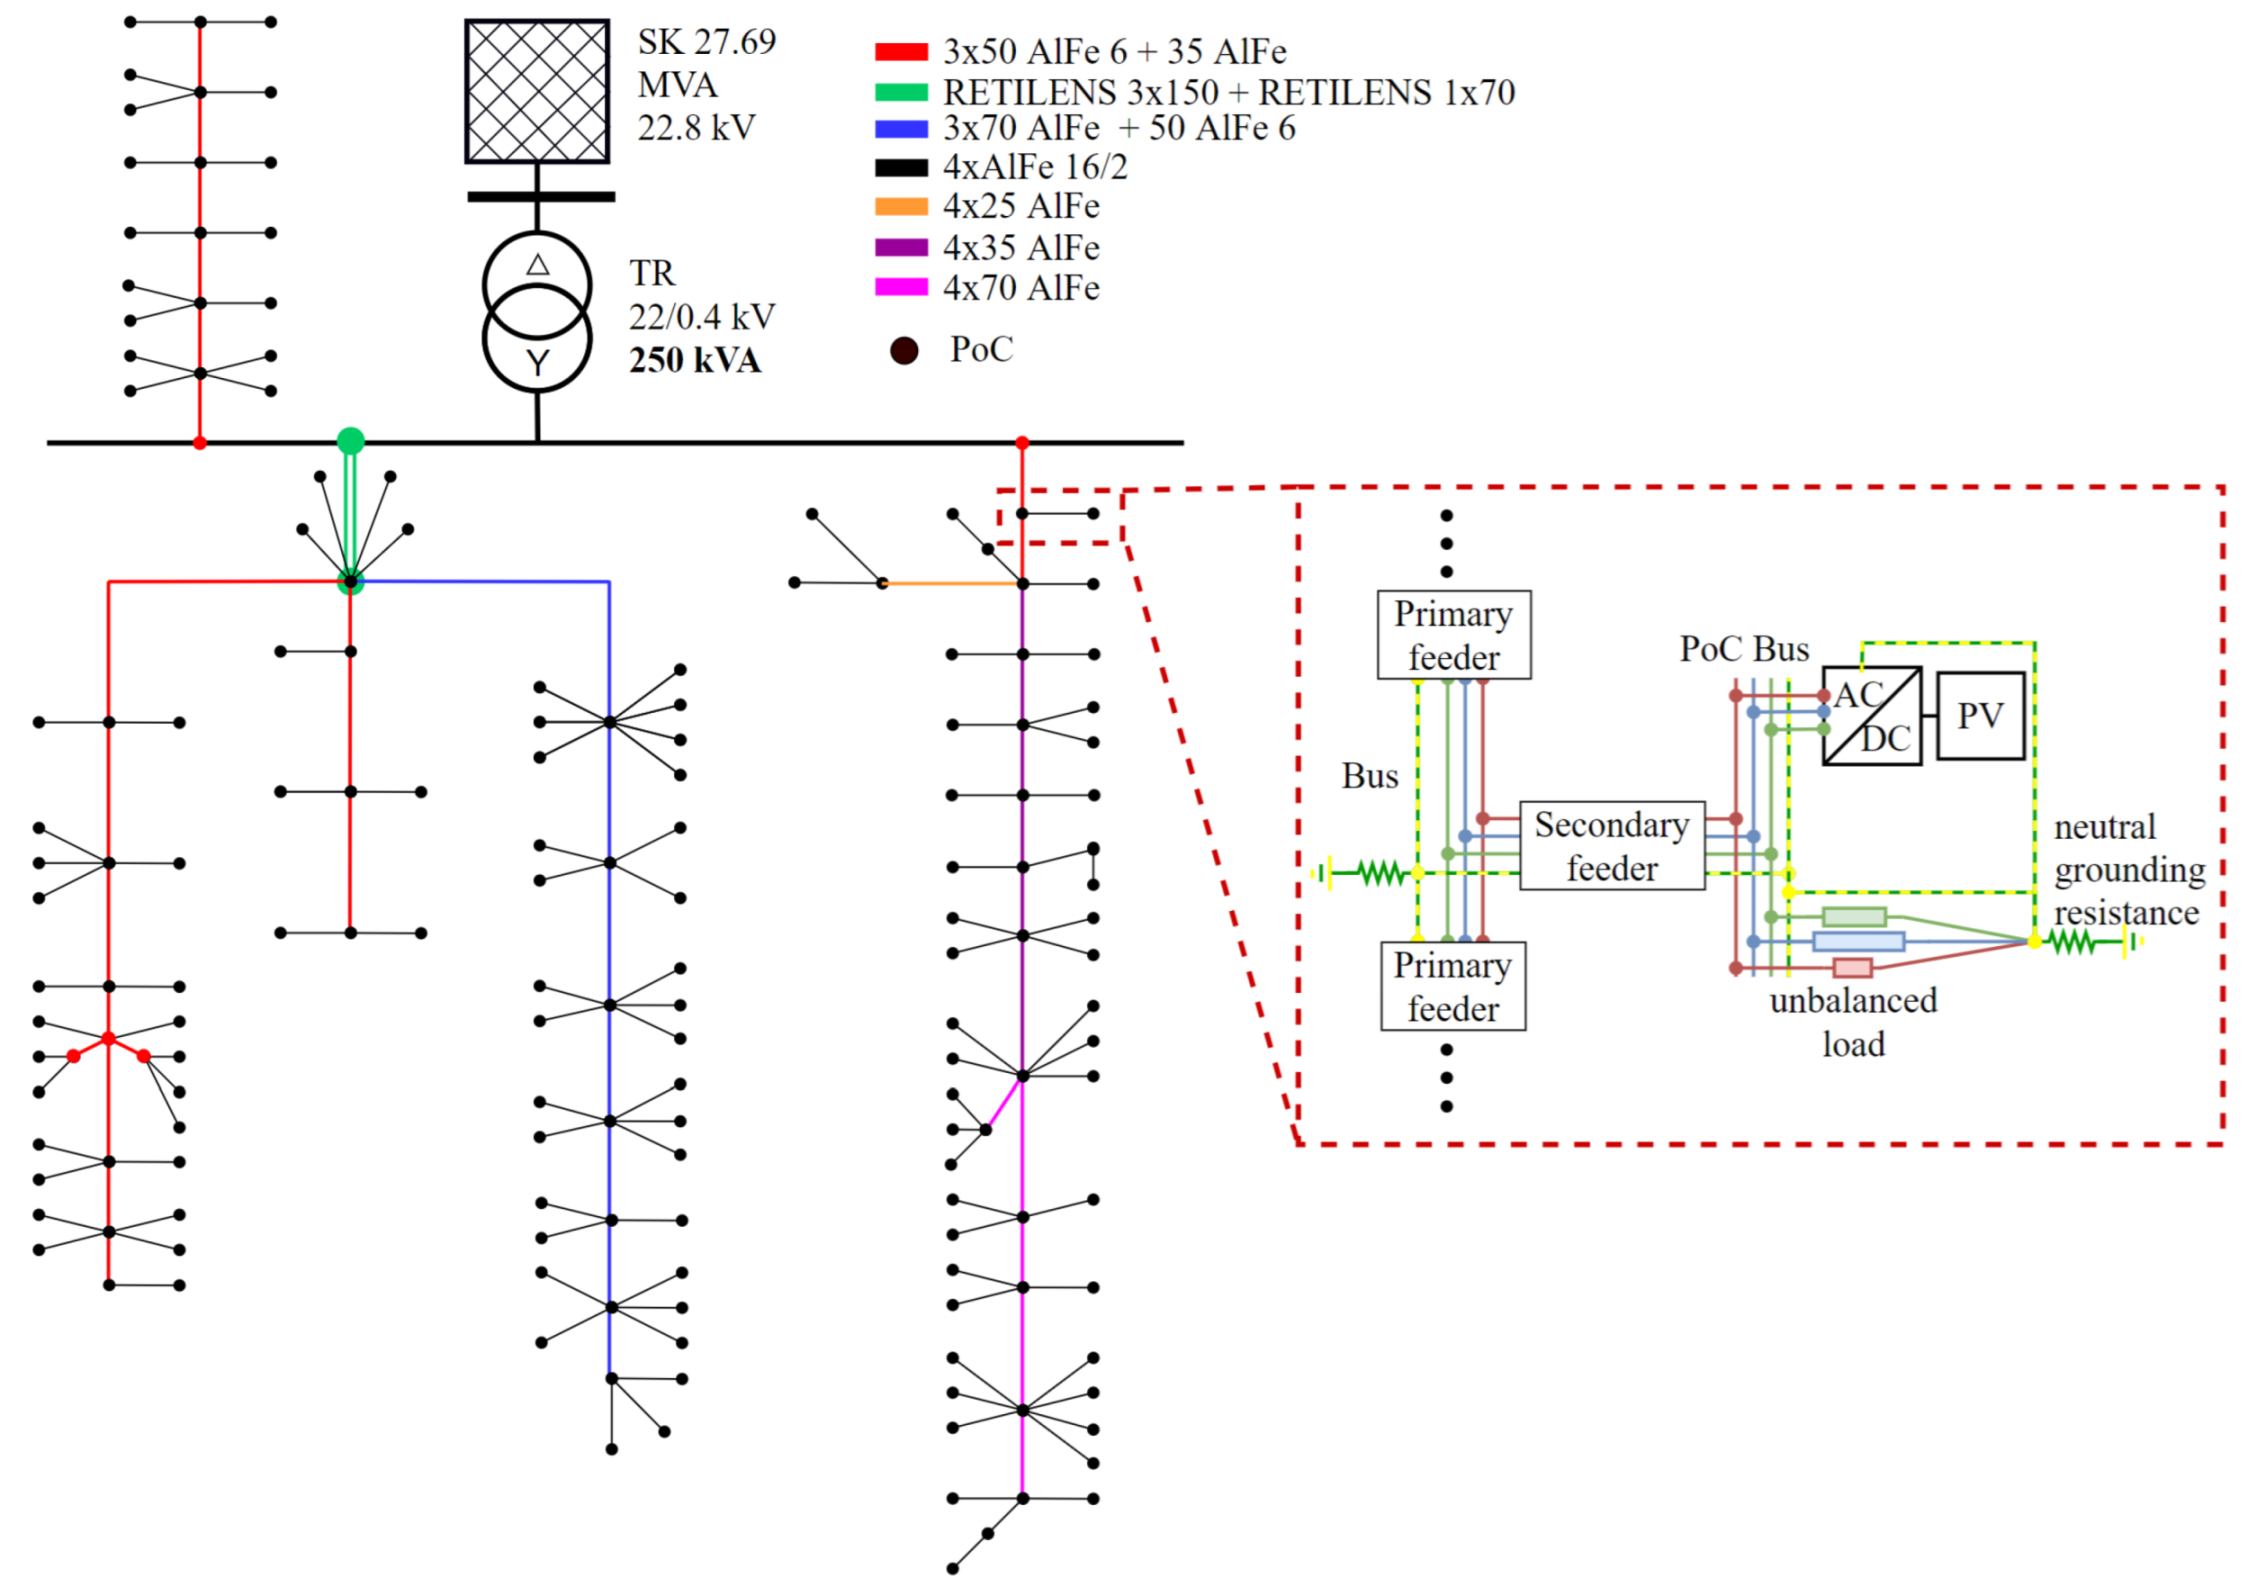
The analyzed network is a three-phase 4-wire radial 0.4 kV system. The topology of the LV network is shown in Figure 3. The grid consists of 163 overhead power lines with two additional cable lines (RETILENS 3 × 150 + RETILENS 1 × 70), Figure 3. The line parameters are shown in Table 1. The length of the lines varies from 0.01 to 0.14 km. The neutral conductor was grounded by 2 Ω grounding resistance at:
  • every bus between two lines of the primary feeder, with connection details shown in Figure 3;
  • the output terminal of the unbalanced load;
  • grounding of the LV side of the power transformer.
The LV network is connected to a 22 kV MV system through a 22/0.4 kV DETC power transformer. The tap changer is connected to the primary winding and has a regulation capacity of ±5% with a 2.5% step size. The default tap position in scenario V0 is −5%. This is the typical tap position used in LV networks to avoid undervoltage at the end of long feeders.

3.3. Loads and Load Shape Curves

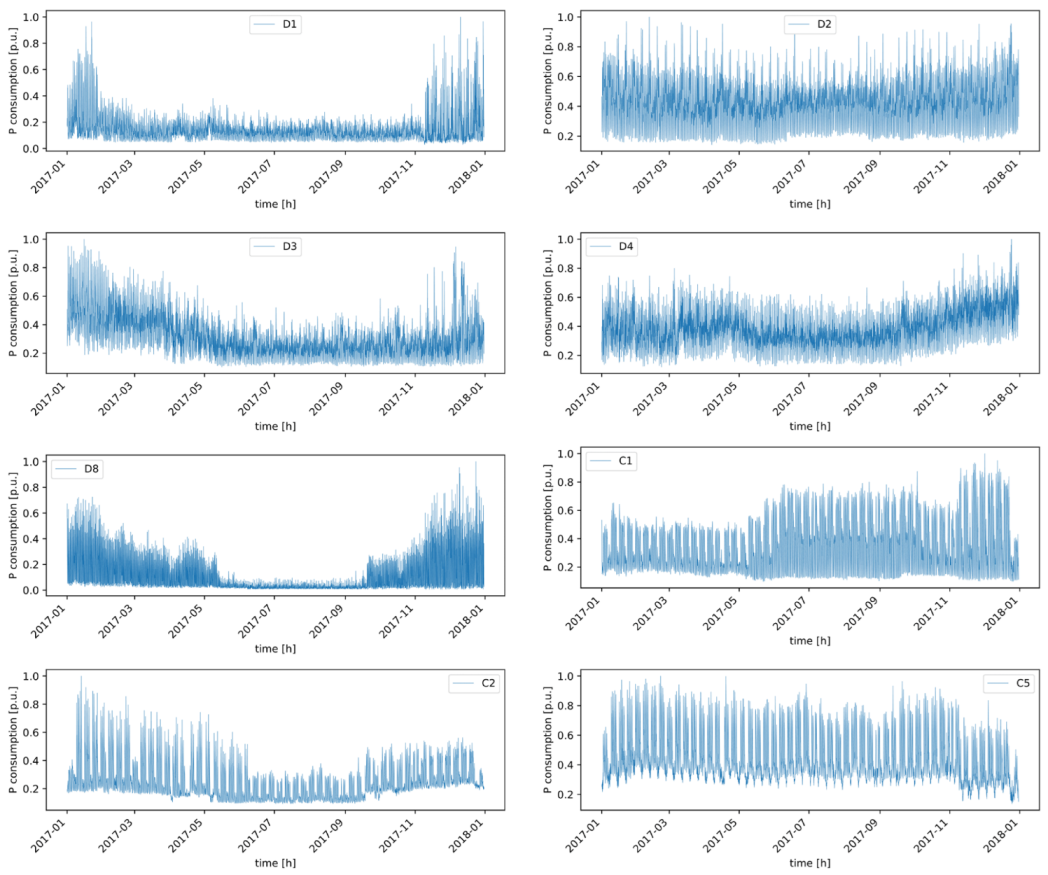
The network consists of 139 PoC categorized into eight different groups based on their tariff. Each category has its own yearly p.u. active power load shape curve, Figure 4.
The load shape curves are the result of IMS analyses of over 1000 individual PoC load curves. Using active power load shape curves and yearly power consumption, which is also a known parameter for each PoC, the maximum value of three-phase load P m a x 3 p is calculated. P m a x 3 p is then randomly divided among individual phases at a ratio of 2:3:5. This distribution was determined from the results of voltage unbalance measurements at PoC and transformer buses provided by DSO. The power factor for each phase is an unknown parameter. Random lagging PF is assigned to each single-phase load in a range of 0.9–1.

3.4. PV System

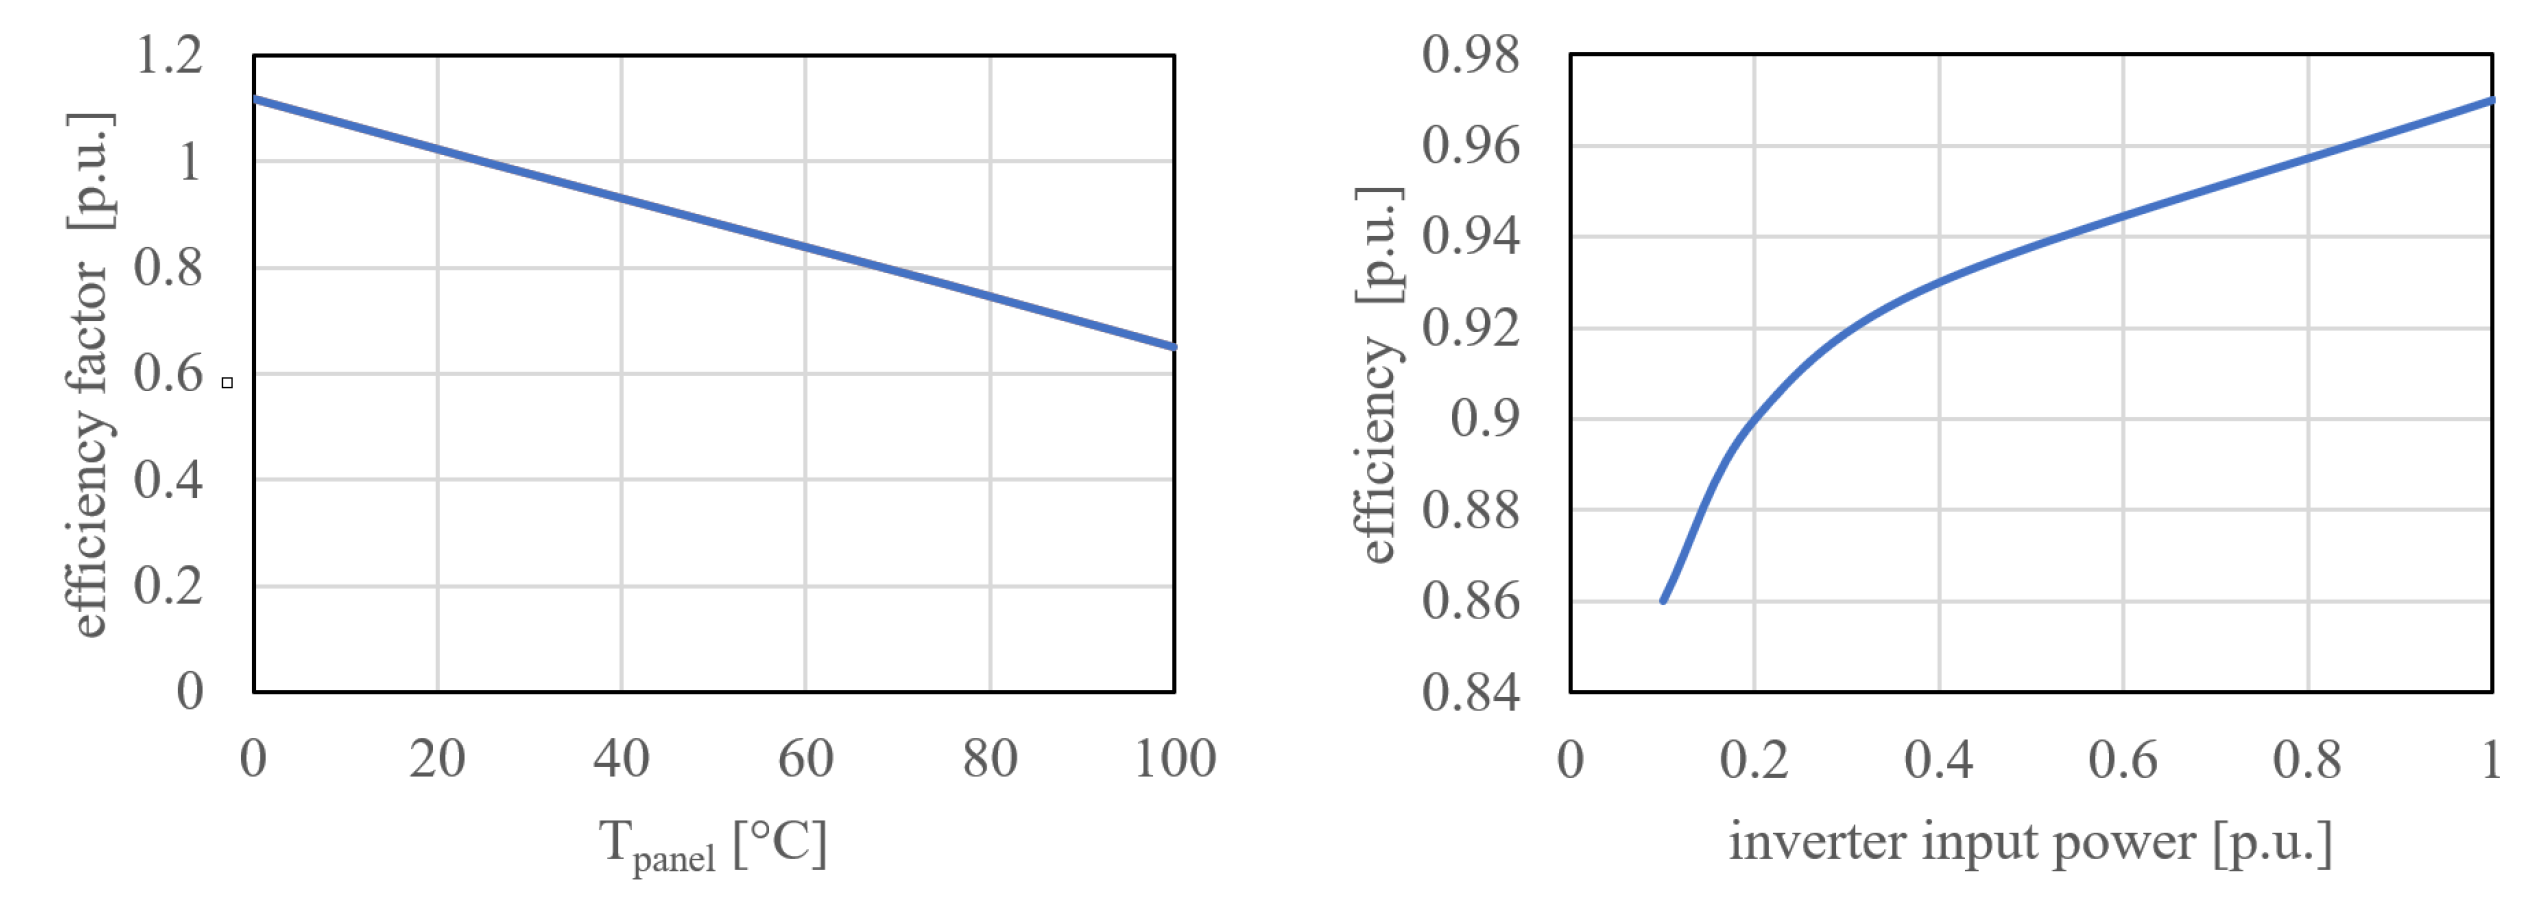
The OpenDSS element of the PV system was used in the simulation [59]. PV is represented by solar panels and inverters. The power output of solar panels is a result of global solar irradiation I g l o b a l , wind speed w, and ambient temperature T a . The generic efficiency factor of solar panels as a function of panel temperature and the generic efficiency of the power inverter as a function of its input were used, Figure 5.
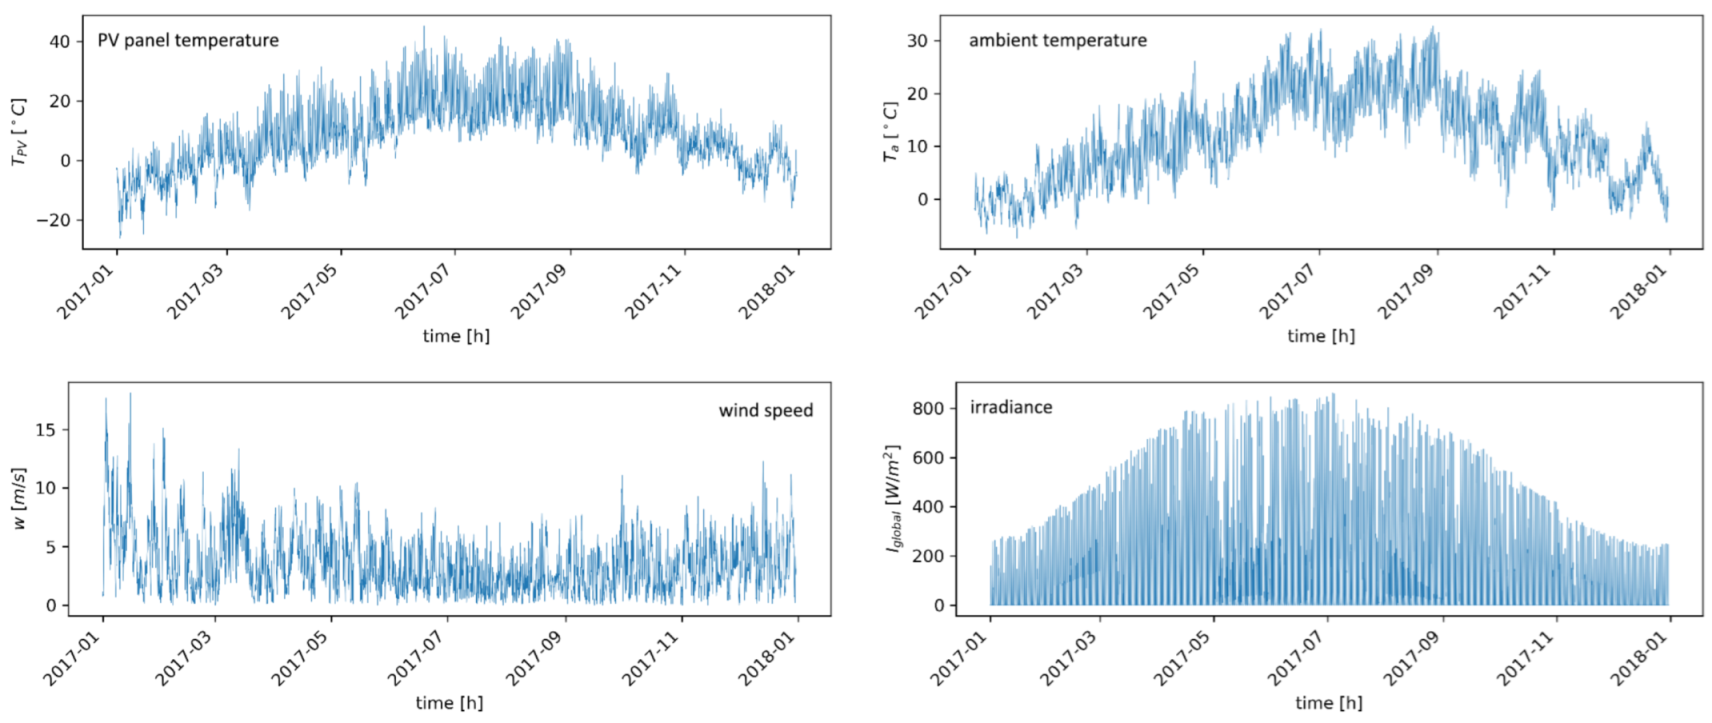
Meteorological data are from real measurements at the network location, Figure 6. The maximum measured irradiation was 906 W/m 2 . The calculated yearly production from 1 kWp of installed PV is 1080 kWh.
The probabilistic parameters of PV are
  • topological position (parallel connection to specific PoC), which is randomly selected in every VR;
  • installed power of PV system and type (single or 3-phase), which are selected according to discreet probabilities, Figure 7;
  • installed PV systems range from 0.2 up to 10 kW per single PoC, with only one PV per PoC possible in the model;
  • PF of an inverter is a constant, 1, for the basic state scenario V0;
  • in the case of a single-phase PV, a random phase is selected for the connection.

3.5. PVHC Limitations

The power quality limits of PVHC in our study are based on EN-50160:2010, which limits the nominal line to neutral voltage U n in a 4-wire system to:
  • 230 V ± 10% for all 10 min average values for 95% of the time in a week;
  • 230 V + 10%–15% for all 10 min average values.
In most of the studies, the 5% probability of exceeding the limit values is the benchmark and standard [42] from which we deviated in the first step. There is currently no consensus on the permissible risk, and it is up to DSO to define it. From the point of view of the safety and functionality of the devices, overvoltage conditions are much riskier than undervoltage conditions. That is why we used a much more conservative approach regarding the standard risk of overvoltage, with only 1% tolerance for overvoltage. The following voltage limitations were used for analysis:
  • max. U (phase-neutral) 253 V, with an acceptable 1% violation probability
    P ( U L n e u t r a l > 1.1 U n ) 0.01
  • min. U (phase-neutral)
    207 V, with an acceptable 5% violation probability
    P ( U L n e u t r a l < 0.9 U n ) 0.05
    195.5 V, with acceptable 0% violation probability
    P ( U L n e u t r a l < 0.85 U n ) 0
  • max. voltage unbalance α V U F 2%, with acceptable 5% violation probability
    P ( α V U F > 2 % ) 0.05
In addition, PVHC with 5% violation probability for all limitations was calculated to allow a comparison of the results with those of other studies.
Thermal limits of conductors and TR were also considered in the analysis. However, their values are strictly deterministic and have no violation of line ratings, Table 1, and the TR power limit (250 kVA) is permissible.
Limitations due to harmonics are not included in this proposed study due to the lack of information.

3.6. HC Definition and Calculation

In our study, DPI is defined as an energy ratio. DPI represents the total ratio of LV network production from PV, A G , to consumption in PoC A C . In all simulations, DPI varies from 0 to 0.5 in steps of 0.1.
D P I = A G A C
From the PPF results of each DPI, a cumulative distribution function (CDF) that defines the risk of voltage violation is constructed. PVHC is then calculated by comparing CDF with the limitation of PVHC.

4. Results

4.1. Scenario V0

Characteristics of scenario V0 that represents the LV network in its basic state are:
  • static tap −5% on 22/0.4 kV DETC power transformer;
  • PF of PV systems equals 1;
  • DPI varies from 0 to 0.5 in steps of 0.1.
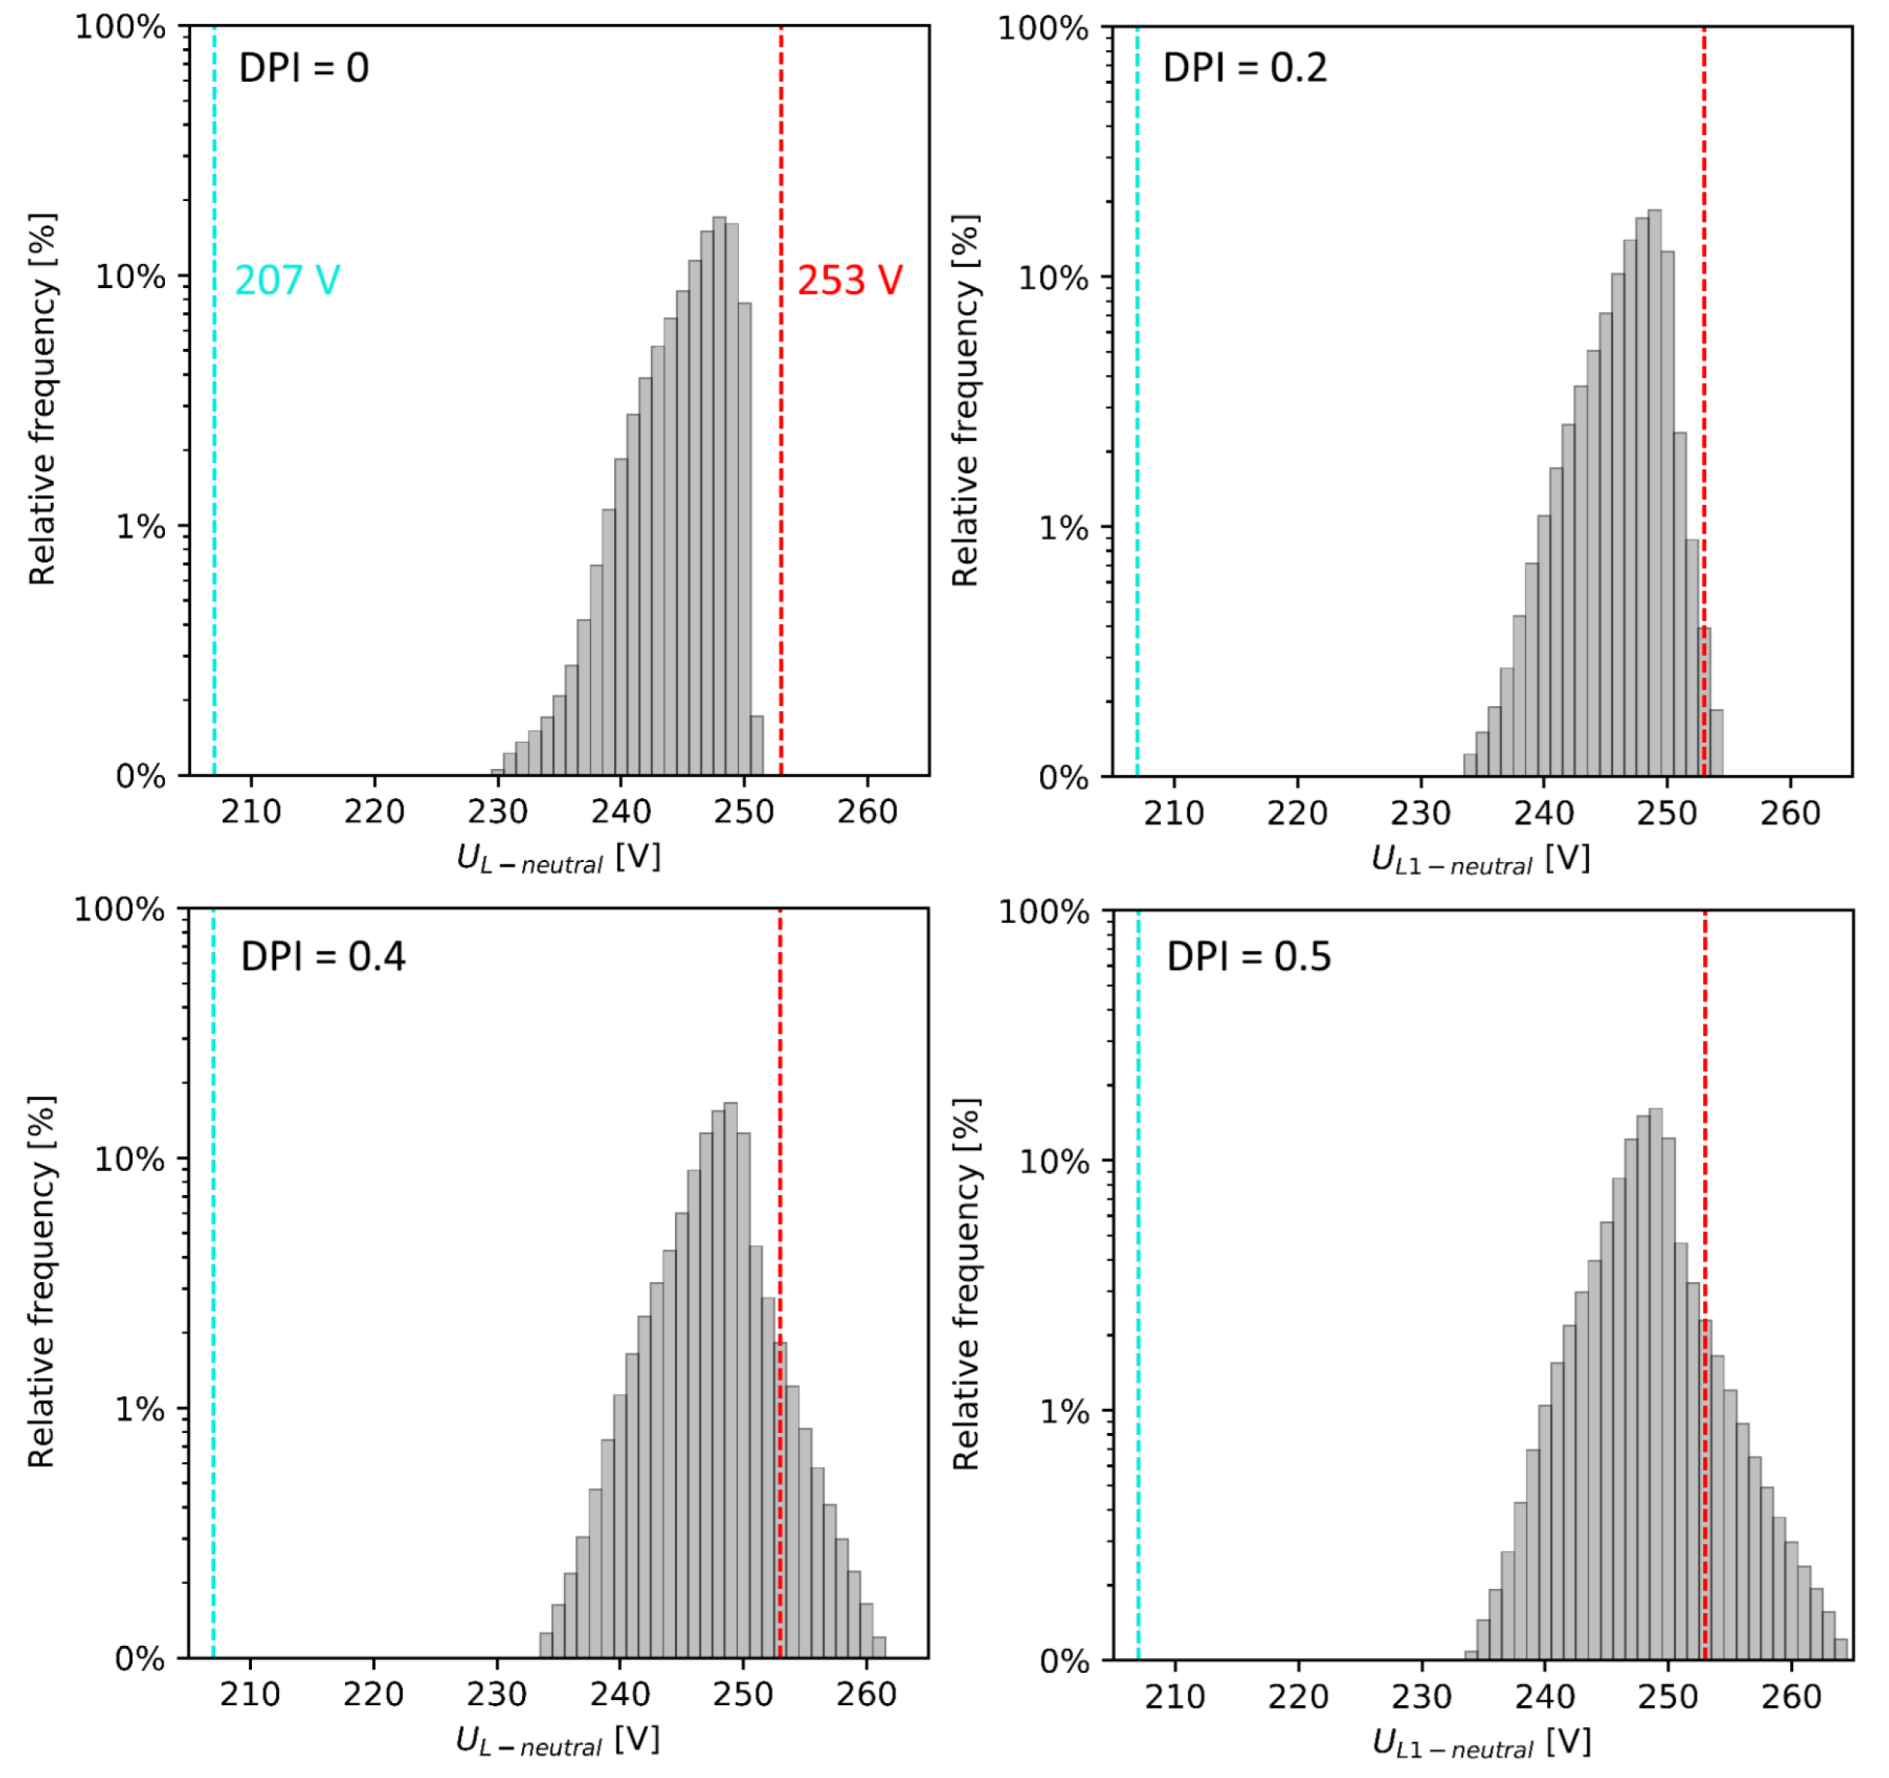
Figure 8 shows the histograms of voltage relative frequency in a year for different DPI. Each histogram is a result of a single PPF calculation consisting of 100 model VR.
Changes in overvoltage probability (COP) for different VR were used as a global stabilization parameter. The COP calculated for DPI 0.5 is stable (absolute change between interactions was less than 0.1%) for VR larger than 60. Total COP between 60 and 100 VR is less than 0.1%.
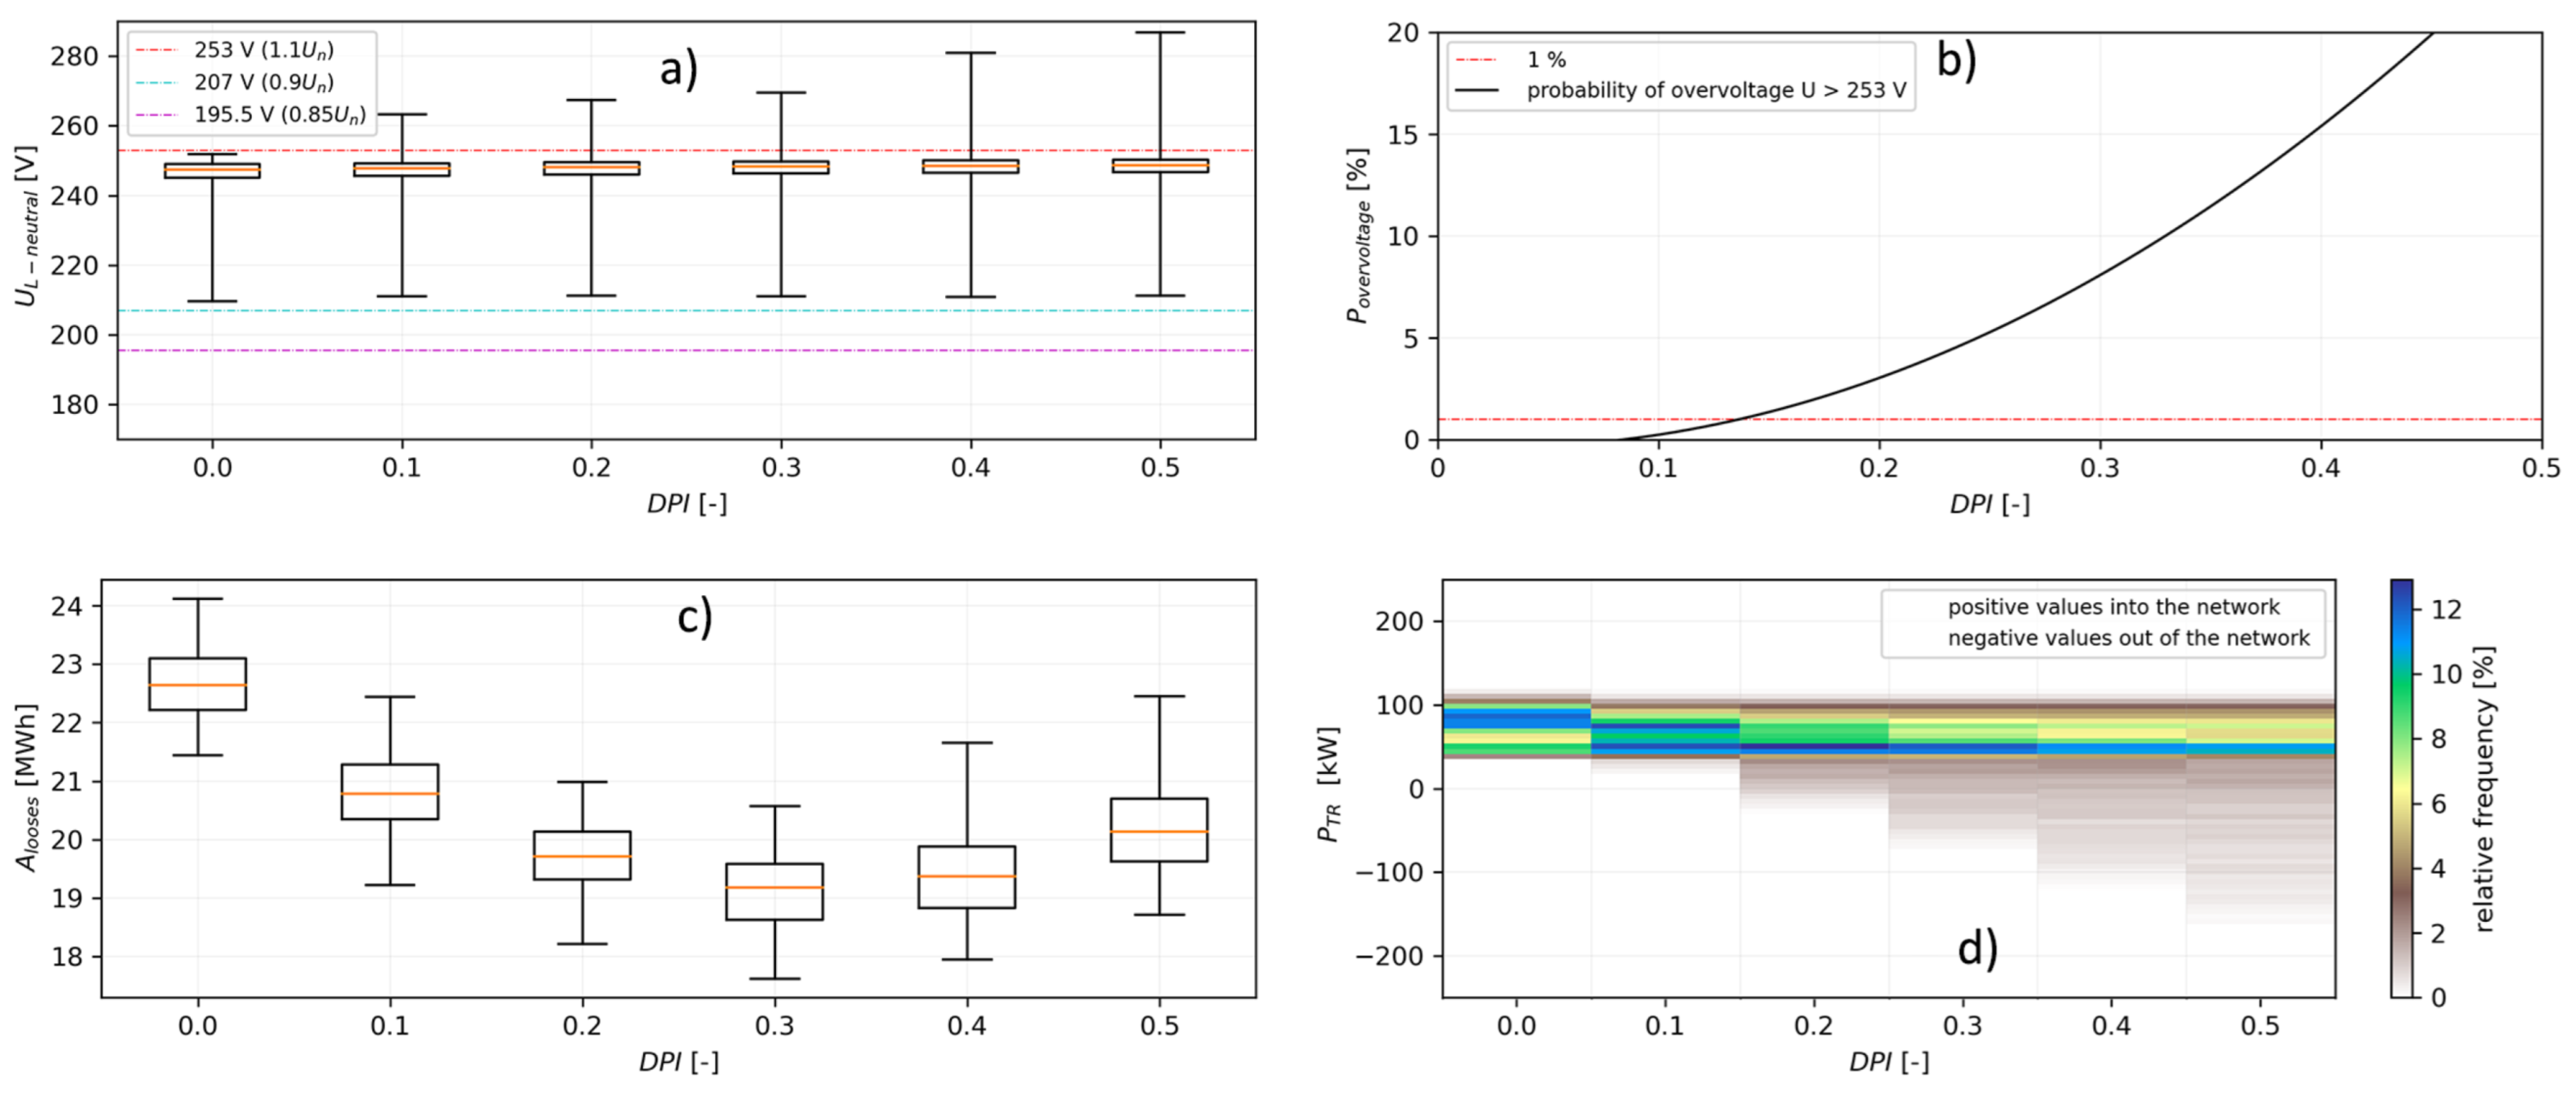
The results in Figure 9 are shown as:
(a)
A box plot of voltage distribution for increasing DPI. In the case with no PV in the system, all values are within the voltage limit range. Increasing DPI does not cause undervoltages.
(b)
CDF calculated for overvoltage in the network. PVHC defined by 1% probability of overvoltage is 13.6%. This is equal to the sum of 79.9 kW installed PV systems in the network. Continuous CDF was calculated from discreet data using a second-degree polynomial fit. In all CDF calculations, the residual sum of squares (RSS) is below 0.002.
(c)
A box plot of yearly losses, lines, and TR for increasing DPI. An average decrease of 15.6% in losses was calculated for DPI 0.3. Losses as a function of DPI form a typical bathtub curve. If PV represents up to 30% of consumed energy, a positive effect in lowering power losses is observed.
(d)
Power flow and relative frequency through the transformer. Increasing PV penetration causes significant reverse power flow. However, the TR power limit was not violated even for high DPI.
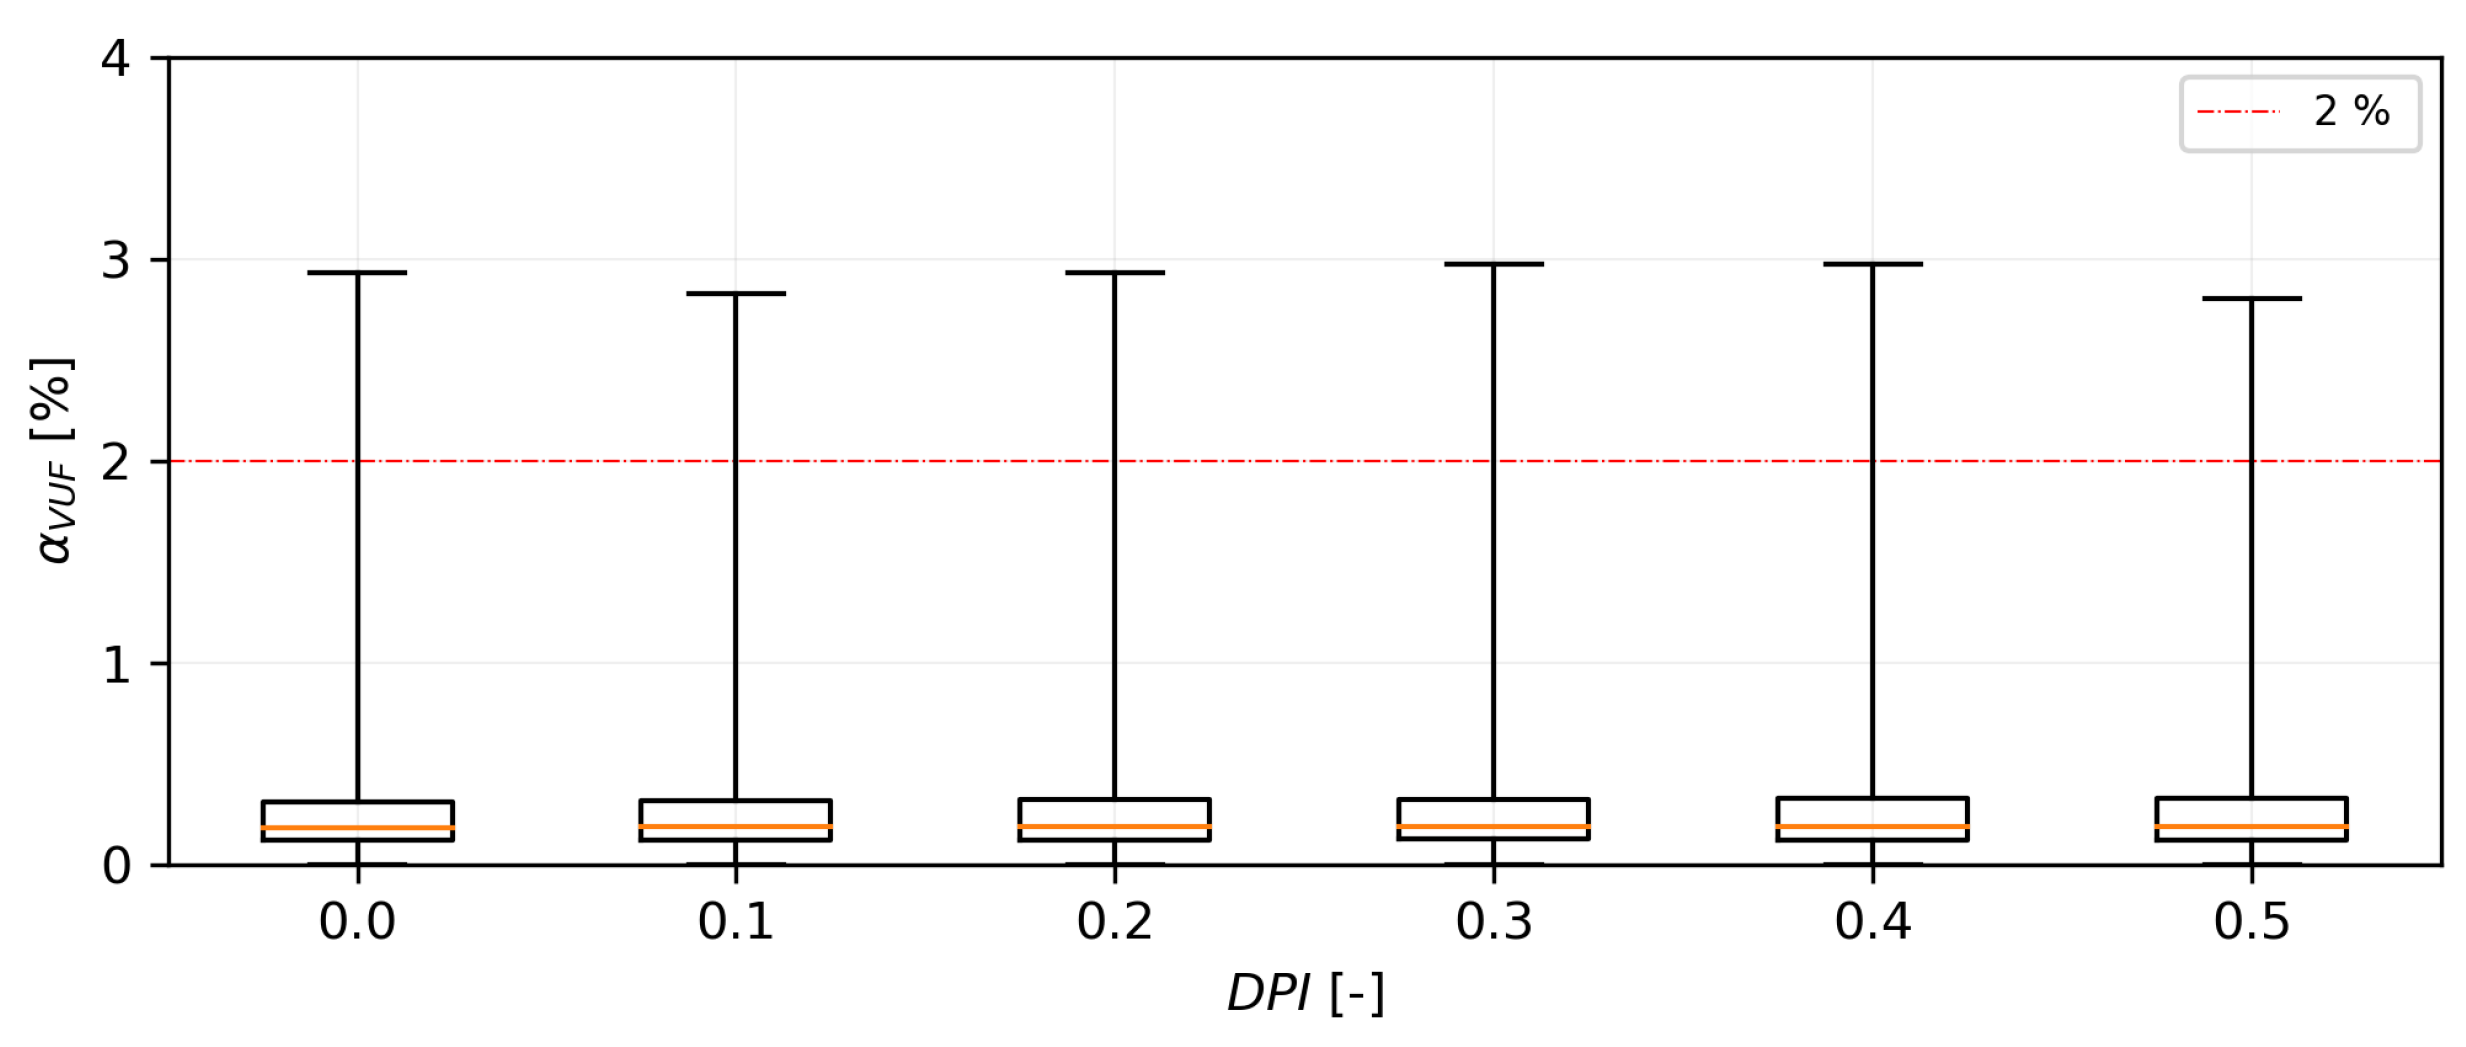
Figure 10 shows a box plot of calculated voltage unbalance α V U F . Increasing DPI does not significantly influence α V U F . This is due to the model’s equal distribution of single-phase PV systems. The 2% limit was violated in every case, but this is a result of load distribution. The probability of limit violation was below 0.1%, and increasing DPI even lowers the probability.
From the results, we can state that the biggest problem in this particular network is overvoltage. All other quantities did not reach their limits. Although there has been a significant increase in currents, the values are still below the maximum current carrying capacity of the lines.

4.2. Scenario V1

Characteristics of scenario V1 of the LV network are:
  • static tap –5% on 22/0.4 kV DETC power transformer;
  • PF of PV systems varies from 1 to 0.85 (absorbing reactive power);
  • DPI varies from 0 to 0.5 in steps of 0.1.
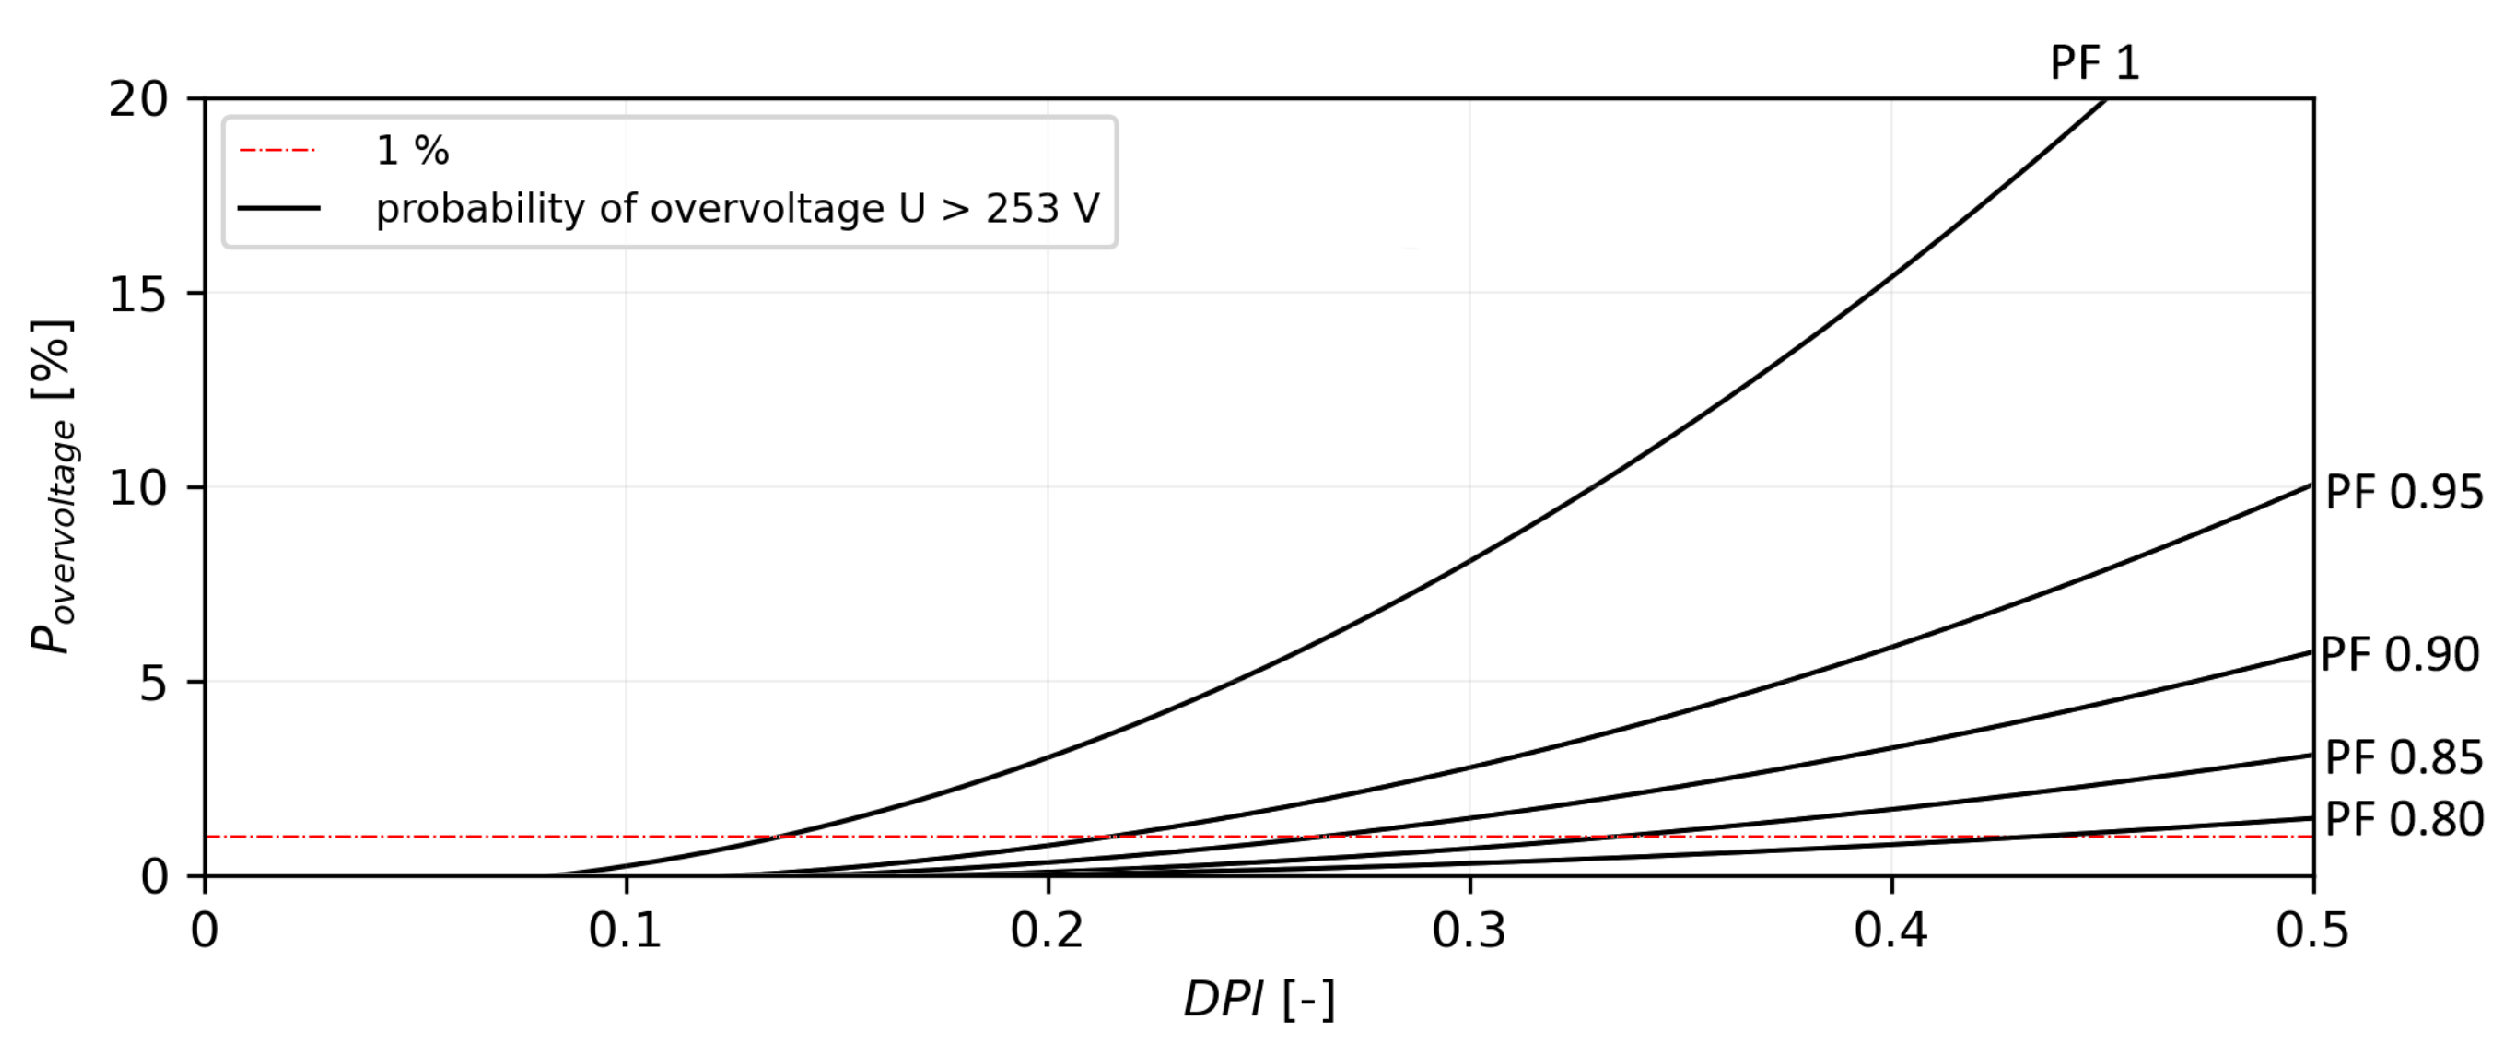
From the results, we can state that the biggest problem in scenario V1 is overvoltage, Figure 11. The lower voltage limit was not exceeded in any calculation. Similarly, as in the V0 scenario, increased DPI does not significantly influence α V U F . The probability of limit violation was below 0.1%. The currents in lines and TR loading did not reach their limitations.
In our study, PF helps to increase PVHC (Table 2), significantly. The price for this increase is a decrease in PV efficiency and increased losses, Figure 12. Compared with V0 at DPI, 0.3 power losses decreased on average by 9.04% for PF 0.95 instead of 15.6%. For PF 0.80, there was an even increase in losses, by 1.9% on average.

4.3. Scenario V2

Characteristics of scenario V2 of the LV network are:
  • tap changes from −5% −0% with 2.5% step on 22/0.4 kV DETC power transformer;
  • PF of PV systems equals 1;
  • DPI varies from 0 to 0.5 in steps of 0.1.
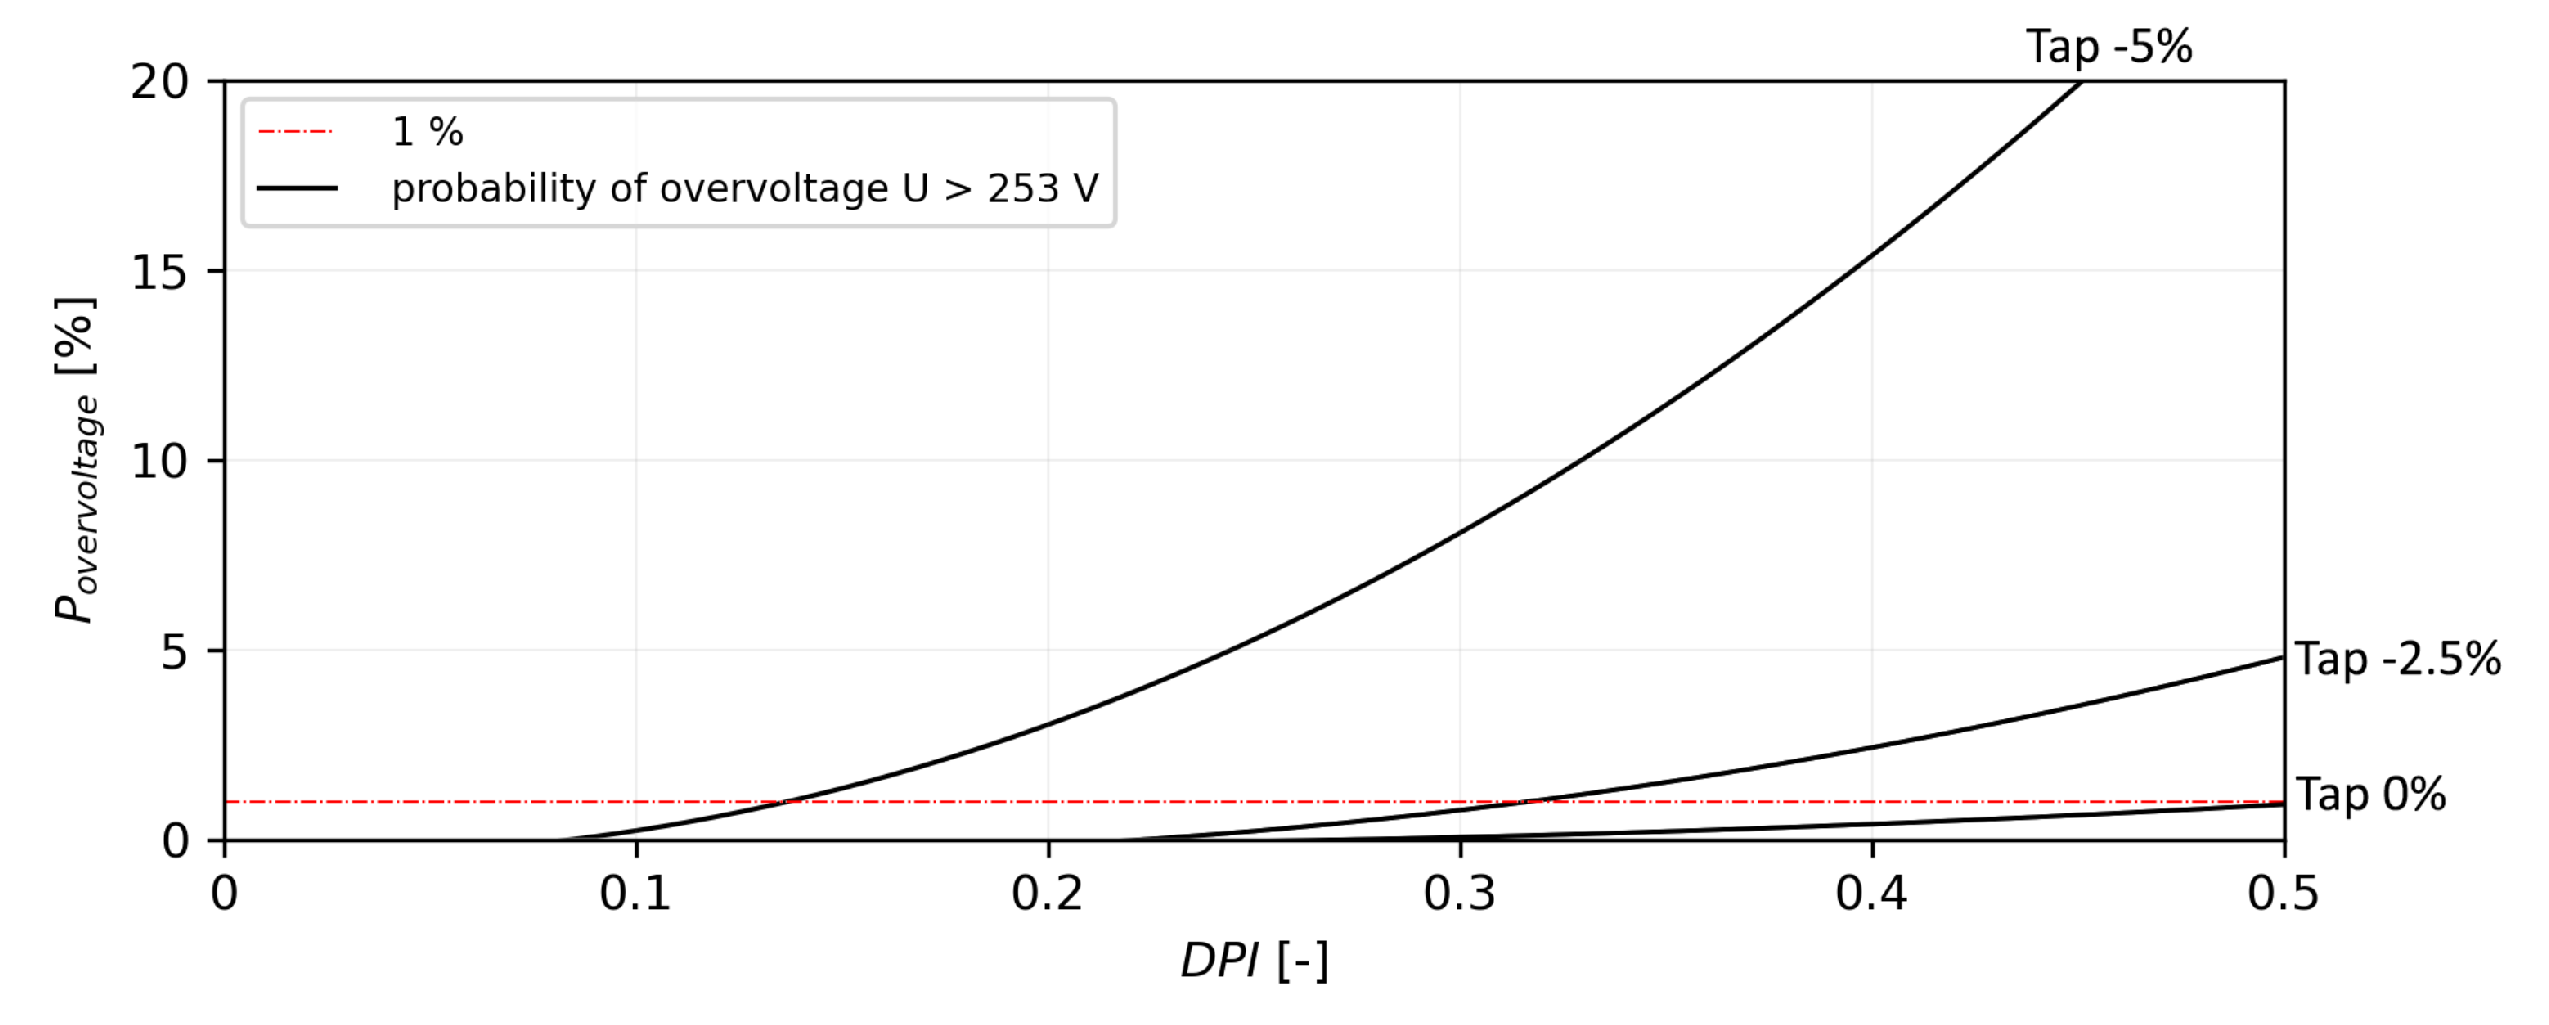
From the results, we can state that the limitations in scenario V2 are overvoltage, Figure 13, and undervoltage below 0.85 U n , Table 3. The problem with DETC TR is that its tap cannot be changed if energized. This results in a static tap position most of the year.
Undervoltages below 0.85 U n occurred for tap 0% even without any PV integration, Figure 14. This leaves only the possibility of using tap −2.5% for increasing PVHC to 31.5%, Table 3. In this tap position, there are significant undervoltages below 1.1 U n . However, their probability was lower than 0.01%.
Similarly, as in the V0 scenario, increasing the DPI does not significantly influence α V U F . The probability of limit violation was below 0.1%. Currents in lines and TR loading did not reach their limits. The tap position had negligible influence on the total power loss compared with the V0 scenario. The reduction in power losses remains at 15.5% on average for DPI 0.3.

5. Discussion

Here, we discuss the results using the PVHC limitations, provide recommendations for DSO, and present possible improvements in the PVHC calculation derived from analyses.
To summarize, in our study, the only limitations of the analyzed system are voltage violations. We used typical voltage limitations as defined by EN-50160:2010, which limits the nominal line to neutral voltage U n , in a 4-wire system, to 230 V ± 10%. In addition, we implemented the probability of permissible voltage violation of these limits (1% for overvoltage and 5% for undervoltage).
The probability limitations chosen for analysis are significantly more conservative than the commonly used limit. In the criteria of all examined studies, the permissible violation probability was 5% or more [41,42,60,61]. As can be seen from the results of the comparison, Table 4, the calculated PVHC values are significantly different if a permissible violation probability of only 5% is used.
The use of 1% probability for overvoltage is based on EN-50160:2010, which limits the nominal line to neutral voltage U n in a 4-wire system to:
  • 230 V ± 10% for all 10 min average values for 95% of the time in a week;
  • 230 V + 10%–15% for all 10 min average values.
Currently, a consensus on the acceptable risk is needed, and it is up to DSO to define this. From the point of the safety and functionality of devices, overvoltage conditions are much riskier than undervoltage conditions. This is why we used a much more conservative approach to the standard risk of overvoltage, with only 1% tolerance for overvoltages.

Comparison of the Results

Regarding the current state of art, many studies have already been carried out for the determination of PVHC. Probably the most extensive comparison of PVHC can be found in [31,42,62]. The PVHC can vary drastically from almost 0% up to several hundred, e.g., 30% PVHC was calculated for a typical United Kingdom urban medium voltage distribution network in [57] and 100% PVHC for an MV network in the United States (only 2.5 kW PV per PoC was considered) [63]. In another study conducted in 2020 in a suburban area of Finland, 233.5% PVHC was estimated [64]. These extensive reviews concluded that PVHC is extremely variable and depends not only on the aforementioned factors but also on the definitions and limiting factors. Comparing the results of other studies with ours is problematic due to this large variance, which is due to the large number of variables that are often specific to individual studies, such as:
  • characteristics of the network, whether urban, rural, or industrial;
  • impedances of lines typical of a specific region;
  • grounding resistance of the neutral conductor;
  • customs in TR ratings;
  • type of lines, whether cable, overhead, or hybrid lines;
  • latitude;
  • estimation value, percentage, or kWp of installed power;
  • definition of PVHC;
  • probability limits in the case of stochastic studies;
  • real synthetic typified networks;
  • voltage level.
Because of this, there are very few studies with which we can compare our results. We present the following as relevant examples:
  • A study in 2007 [57] in which 30% PVHC was calculated, with voltage limitation, in an LV of a United Kingdom network.
  • A study in 2010 [65] performed on a rural European network, with a calculated maximum installed power of 3.5 kWp per PoC. Overvoltages were also the PVHC limitation identified in this study. Our results, for 5% tolerance, allow connecting 1.2 kWp per PoC on average.
  • A study in 2016 [66] performed on a rural system with rooftop PV installations with a calculation of 13% PVHC, with overvoltages estimated as the limitation source.
  • A study in 2016 [67] performed on an LV network in Denmark with estimation of 40% PVHC.
  • A stochastic study in 2019 [68] performed on an IEEE 123-bus system with rooftop PV installations with a calculation of 16.48% PVHC with PV inverter PF 1 and 5% tolerance for overvoltage. By changing PF to 0.895, the PVHC was increased up to 32.3%.
As can be seen from these examples, the estimated PVHC values vary dramatically. We found that stochastic studies with highly specific and realistic input values for particular regions, such as the typical Slovak Republic, are rare.

6. Conclusions

In our research, we focused on the calculation of PVHC in conditions corresponding to rural areas of the Slovak Republic. This included the real topology and parameters of electrical devices. It was confirmed that the main problem in the analyzed network is overvoltage. The PVHC in the basic model, with conservative limitations of 1% overvoltage tolerance, was estimated to be 13.6%. This means that DSO can allow the installation of 79.9 kW of small PV systems (maximum size of 10 kW for a single installation). Implementing this size of distributed PV will reduce losses (lines and TR) by 8.2% on average. An additional increase in PV systems would violate the overvoltage conditions. We then analyzed the possibilities for mitigating overvoltages and increasing PVHC in the studied system. In this case, a simple solution to increase PVHC would be to implement a mandatory condition for the PF of PV to be 0.95% lagging (absorbing reactive power). This would increase PVHC up to 21.4%. As a result, losses would be reduced by approximately 10% on average. With a further decrease in PF, the DSO may encounter customer hesitation. Table 2 shows PVHC results for other PF. It is also important to mention that DSO often does not have control over the PF inverters, and in the current legislative setting, it cannot even order small customers to change the PF. Another possible solution identified from the analysis to increase PVHC is tap control of MV/LV transformers. It was shown that a change in the tap position of 22/04 TR is the simplest solution to increase the PVHC of the network. In our study, we estimated that changing a single tap from −5% to −2.5% will increase PVHC to 31.5% and reduce losses (lines and TR) by 15.5% on average. The downside of this solution is an increase in undervoltages, mostly at the end of the feeders. However, their probability is well below 0.1%. Further tap increase will cause permanent undervoltages lower than 0.85 U n , and this is not allowed by DSO. In all cases, increasing PV penetration does not significantly influence voltage to unbalance α V U F in the analyzed system. Due to the randomness of single-phase PV placement in the system, increasing the distributed energy resources penetration index resulted in a lower α V U F . The probability of limit violation was below 0.1% for all cases and models. All other quantities did not reach their limits. Although there has been a significant increase in current, the values are still below the maximum current carrying capacity of the lines. Our model can be characterized as a hybrid model because it includes deterministic and probabilistic parameters. A summary of these can be found in Table 5.
To improve the informative value of the model, it would be necessary to:
  • include all deterministic parameters as probabilities defined by mean value and standard deviation for specific time step;
  • use a smaller time step in the simulation, e.g., 10 min;
  • increase the number of VR per PPF, which would result in finding only the possible extremes in voltage deviation.
A current limitation results from our available computational ability and code effectiveness. Implementation of parallel processing would resolve this issue in future research. Thus, in our future research in this field, we will aim to:
  • improve the stochastic model;
  • implement decentralized and centralized BESS systems;
  • implement other DERs, such as EVs, into the model;
  • conduct harmonics analyses.

Author Contributions

Conceptualization J.B., M.C., B.C., and A.B.; formal analysis, M.C., P.J. and J.B.; funding acquisition, A.B.; Investigation, J.B., M.C., and Ž.E.; methodology, J.B., B.C., M.C., Ž.E., and A.B.; project administration, A.B.; software, J.B. and M.C.; supervision, A.B. and Ž.E.; validation, J.B., M.C., and B.C.; visualization, J.B.; writing—original draft, B.C., M.C., P.J., and J.B.; writing—review and editing, M.C., J.B. All authors have read and agreed to the published version of the manuscript.

Funding

This publication was created thanks to support under the Operational Program Integrated Infra-structure for the project: International Center of Excellence for Research on Intelligent and Secure Information and Communication Technologies and Systems—II. stage, ITMS code 313021W404, co-financed by the European Regional Development Fund.

Informed Consent Statement

Not applicable.

Data Availability Statement

Data are contained within the article.

Acknowledgments

We would like to thank the electricity distribution company (DSO) Stredoslovenská distribučná, a.s. for providing data.

Conflicts of Interest

The authors declare no conflict of interest.

Abbreviations

The following abbreviations are used in this manuscript:
DERdistributed energy resource
RESrenewable energy sources
PVphotovoltaic
WTwind turbine
EVelectric vehicle
CSPconcentrated solar power
HChosting capacity
PVHCphotovoltaic hosting capacity
SSsmall source
BESSbattery energy storage systems
OLTCon-load tap changer
DETCdeenergized tap changer
TRtransformer
LVlow-voltage network
MVmedium voltage network
PoCpoint of consumption
DSOdistribution system operator
PPFprobabilistic power flow
DPIdistributed energy resources penetration index
VRmodel variation
IMSintelligent metering system
CDFcumulative distribution function
RSSresidual sum of squares

References

  1. IEA. Unlocking the Potential of Distributed Energy Resources. Technical Report; IEA: Paris, France, 2022. [Google Scholar]
  2. IRENA. Innovation Landscape for a Renewable-Powered Future: Solutions to Integrate Variable Renewables; International Renewable Energy Agency: Abu Dhabi, United Arab Emerites, 2019. [Google Scholar]
  3. Funicello-Paul, L.; Maupin, M. Installed Distributed Energy Resources Capacity Is Expected to Total $1.9 Trillion in Investment from 2015 to 2024, According to Navigant Research, 2016. Available online: https://bit.ly/3hJx29o (accessed on 11 October 2022).
  4. Tsagkari, M. Impact of Coronavirus on Distributed Energy Generation with the Application of Demand-Side Management. 2020. IAEE Energy Forum. Available online: https://www.iaee.org/newsletter/issue/104 (accessed on 11 October 2022).
  5. Noonan, E.; Fitzpatrick, E. Will Distributed Energy Resources (DERs) Change How We Get Our Energy? 2020. European Parliamentary Research Service, Europian Union. European Parliamentary Research Service, Europian Union. Available online: https://bit.ly/3HQ0t4C (accessed on 11 October 2022).
  6. IEA. Global Energy Review 2021; IEA: Paris, France, 2021. [Google Scholar]
  7. European Commission. The Average Share of Electricity from Renewable Energy Sources in the EU; Technical Report; European Commission: Brussels, Belgium, 2021; Available online: https://https://bit.ly/3BO2TNk (accessed on 12 October 2022).
  8. Ministerstvo průmyslu a obchodu. Vývoj podílů obnovitelné energie. Available online: https://bit.ly/3G3Dodi (accessed on 11 October 2022).
  9. European Commission. Renewable Energy Targets; European Commission: Brussels, Belgium, 2021; Available online: https://bit.ly/3G3A9Cu (accessed on 10 October 2022).
  10. Feldman, D.; Dummit, K.; Zuboy, J.; Heeter, J.; Xu, K.; Margolis, R. Spring 2022 Solar Industry Update, 2022. NREL. Available online: https://bit.ly/3BPgOm8 (accessed on 10 October 2022).
  11. IEA. Snapshot of Global PV Markets 2022. Technical Report IEA-PVPS T1-42: 2022; IEA: Paris, France, 2022. [Google Scholar]
  12. Ackermann, T.; Andersson, G.; Söder, L. Distributed generation: A definition. Electr. Power Syst. Res. 2001, 57, 195–204. [Google Scholar] [CrossRef]
  13. Peppanen, J.; Taylor, J.; Fonseca, D.; Snodgrass, J.; Chen, S.; Strasser, T.I. Distributed Energy Resource Benchmark Models for Distribution Impact Assessment—Update of Activities by CIGRE Working Group C6.36. In Proceedings of the CIRED 2021—The 26th International Conference and Exhibition on Electricity Distribution, Online, 20–23 September 2021; pp. 1988–1992. [Google Scholar] [CrossRef]
  14. König, A.; Nicoletti, L.; Schröder, D.; Wolff, S.; Waclaw, A.; Lienkamp, M. An Overview of Parameter and Cost for Battery Electric Vehicles. World Electr. Veh. J. 2021, 12, 21. [Google Scholar] [CrossRef]
  15. Polat, O.; Eyüboglu, O.H.; Gül, O. Monte Carlo simulation of electric vehicle loads respect to return home from work and impacts to the low voltage side of distribution network. Electr. Eng. 2021, 103, 439–445. [Google Scholar] [CrossRef]
  16. Han, X.; Sandels, C.; Zhu, K.; Nordström, L.; Söderström, P. Empirical analysis for Distributed Energy Resources’ impact on future distribution network. In Proceedings of the 2012 IEEE International Energy Conference and Exhibition (ENERGYCON), Florence, Italy, 9–12 September 2012; pp. 731–737. [Google Scholar] [CrossRef] [Green Version]
  17. Leou, R.C.; Su, C.L.; Lu, C.N. Stochastic Analyses of Electric Vehicle Charging Impacts on Distribution Network. IEEE Trans. Power Syst. 2014, 29, 1055–1063. [Google Scholar] [CrossRef]
  18. Medved, D.; Kolcun, M.; Pavlík, M.; Bena, L.; Mešter, M. Analysis of Prosumer Behavior in the Electrical Network. Energies 2021, 14, 8212. [Google Scholar] [CrossRef]
  19. Vrana, M.; Drapela, J.; Topolanek, D.; Vycital, V.; Jurik, M.; Blahusek, R.; Kurfirt, M. Battery Storage and Charging Systems Power Control Supporting Voltage in Charging Mode. In Proceedings of the 2020 19th International Conference on Harmonics and Quality of Power (ICHQP), Dubai, United Arab Emirates, 6–7 July 2020. [Google Scholar]
  20. Kumar, P.; Nikolovski, S.; Ali, I.; Thomas, M.S.; Ahuja, H. Impact of Electric Vehicles on Energy Efficiency with Energy Boosters in Coordination for Sustainable Energy in Smart Cities. Processes 2022, 10, 1593. [Google Scholar] [CrossRef]
  21. Akinyele, D.O.; Rayudu, R.K. Review of energy storage technologies for sustainable power networks. Sustain. Energy Technol. Assessments 2014, 8, 74–91. [Google Scholar] [CrossRef]
  22. Alanazi, A.; Alanazi, M.; Abdelaziz, A.Y.; Kotb, H.; Milyani, A.H.; Azhari, A.A. Stochastic Allocation of Photovoltaic Energy Resources in Distribution Systems Considering Uncertainties Using New Improved Meta-Heuristic Algorithm. Processes 2022, 10, 2179. [Google Scholar] [CrossRef]
  23. Oliinyk, M.; Džmura, J.; Kolcun, M.; Humeník, J.; Kanálik, M.; Pavlík, M.; Pál, D.; Medved’, D. Impact of electric vehicles and demand management systems on electrical distribution networks. Electr. Eng. 2022, 104, 667–680. [Google Scholar] [CrossRef]
  24. Grabner, M.; Souvent, A.; Suljanović, N.; Košir, A.; Blažič, B. Probabilistic Methodology for Calculating PV Hosting Capacity in LV Networks Using Actual Building Roof Data. Energies 2019, 12, 4086. [Google Scholar] [CrossRef] [Green Version]
  25. Hasan, K.N.; Preece, R.; Milanović, J.V. Existing approaches and trends in uncertainty modelling and probabilistic stability analysis of power systems with renewable generation. Renew. Sustain. Energy Rev. 2019, 101, 168–180. [Google Scholar] [CrossRef]
  26. Zain ul Abideen, M.; Ellabban, O.; Al-Fagih, L. A Review of the Tools and Methods for Distribution Networks’ Hosting Capacity Calculation. Energies 2020, 13, 2758. [Google Scholar] [CrossRef]
  27. Moon, J.H.; Gwon, H.N.; Jo, G.R.; Choi, W.Y.; Kook, K.S. Stochastic Modeling Method of Plug-in Electric Vehicle Charging Demand for Korean Transmission System Planning. Energies 2020, 13, 4404. [Google Scholar] [CrossRef]
  28. Ichoua, S. A stochastic approach for the integration of distributed energy resources. In Proceedings of the 2014 IEEE International Technology Management Conference, Chicago, IL, USA, 12–15 June 2014; pp. 1–4. [Google Scholar] [CrossRef]
  29. Zhang, Y.; Ren, S.; Dong, Z.Y.; Xu, Y.; Meng, K.; Zheng, Y. Optimal placement of battery energy storage in distribution networks considering conservation voltage reduction and stochastic load composition. IET Gener. Transm. Distrib. 2017, 11, 3862–3870. [Google Scholar] [CrossRef]
  30. Ismael, S.M.; Abdel Aleem, S.H.E.; Abdelaziz, A.Y.; Zobaa, A.F. State-of-the-art of hosting capacity in modern power systems with distributed generation. Renew. Energy 2019, 130, 1002–1020. [Google Scholar] [CrossRef]
  31. Fatima, S.; Püvi, V.; Lehtonen, M. Review on the PV Hosting Capacity in Distribution Networks. Energies 2020, 13, 4756. [Google Scholar] [CrossRef]
  32. Aydin, M.S.; Alnaser, S.W.; Althaher, S.Z. Using OLTC-Fitted Distribution Transformer to Increase Residential PV Hosting Capacity: Decentralized Voltage Management Approach. Energies 2022, 15, 4836. [Google Scholar] [CrossRef]
  33. Aziz, T.; Ketjoy, N. PV Penetration Limits in Low Voltage Networks and Voltage Variations. IEEE Access 2017, 5, 16784–16792. [Google Scholar] [CrossRef]
  34. Kitworawut, P.B.; Azuatalam, D.T.; Collin, A.J. An investigation into the technical impacts of microgeneration on UK-type LV distribution networks. In Proceedings of the 2016 Australasian Universities Power Engineering Conference (AUPEC), Brisbane, QLD, Australia, 25–28 September 2016; pp. 1–5. [Google Scholar] [CrossRef]
  35. Hasanpor Divshali, P.; Söder, L. Improving PV Hosting Capacity of Distribution Grids Considering Dynamic Voltage Characteristic. In Proceedings of the 2018 Power Systems Computation Conference (PSCC), Dublin, Ireland, 11–15 June 2018; pp. 1–7. [Google Scholar] [CrossRef]
  36. Martin, W.; Stauffer, Y.; Ballif, C.; Hutter, A.; Alet, P.J. Automated Quantification of PV Hosting Capacity In Distribution Networks Under User-Defined Control and Optimisation Procedures. In Proceedings of the 2018 IEEE PES Innovative Smart Grid Technologies Conference Europe (ISGT-Europe), Sarajevo, Bosnia and Herzegovina, 21–25 October 2018; pp. 1–6. [Google Scholar] [CrossRef]
  37. Rylander, M.; Smith, J. Stochastic approach for distribution planning with distributed energy resources. In Proceedings of the CIGRE Grid of the Future Symposium, Kansas City, MO, USA, 28–30 October 2012. [Google Scholar]
  38. Rylander, M.; Smith, J. Comprehensive Approach for Determining Distribution Network Hosting Capacity for Solar PV. In Proceedings of the 2nd International Workshop on Integration of Solar Power Into Power Systems, Lisbon, Portugal, 13–15 November 2012. [Google Scholar]
  39. EN 50160:2010; Voltage Characteristics of Electricity Supplied by Public Electricity Networks. CENELEC: Brussels, Belgium, 2010.
  40. ANSI C84.1-2011; American National Standard for Electric Power Systems and Equipment—Voltage Ratings (60 Hertz). National Electrical Manufacturers Association: Arlington, VA, USA, 2011.
  41. Klonari, V.; Toubeau, J.F.; Lobry, J.; Vallee, F. Photovoltaic Integration in Smart City Power Distribution— A Probabilistic Photovoltaic Hosting Capacity Assessment based on Smart Metering Data. In Proceedings of the 5th International Conference on Smart Cities and Green ICT Systems-SMARTGREENS, Rome, Italy, 27–29 April 2022; pp. 166–178. [Google Scholar]
  42. Koirala, A.; Van Acker, T.; D’hulst, R.; Van Hertem, D. Hosting capacity of photovoltaic systems in low voltage distribution systems: A benchmark of deterministic and stochastic approaches. Renew. Sustain. Energy Rev. 2022, 155, 111899. [Google Scholar] [CrossRef]
  43. Definitions of Voltage Unbalance. IEEE Power Eng. Rev. 2001, 21, 49–51. [CrossRef]
  44. IEEE Std 519-2014; IEEE Recommended Practice and Requirements for Harmonic Control in Electric Power Systems. IEEE: Manhattan, NY, USA, 2014; pp. 1–29. [CrossRef]
  45. Menti, A.; Barkas, D.; Kaminaris, S.; Psomopoulos, C.S. Supraharmonic emission from a three-phase PV system connected to the LV grid. Energy Rep. 2021, 7, 527–542. [Google Scholar] [CrossRef]
  46. Alkahtani, A.A.; Alfalahi, S.T.Y.; Athamneh, A.A.; Al-Shetwi, A.Q.; Mansor, M.B.; Hannan, M.A.; Agelidis, V.G. Power Quality in Microgrids Including Supraharmonics: Issues, Standards, and Mitigations. IEEE Access 2020, 8, 127104–127122. [Google Scholar] [CrossRef]
  47. Bendík, J.; Cenký, M.; Eleschová, Z.; Beláň, A.; Cintula, B.; Janiga, P. Stochastic Concept for Modeling Distributed Energy Resources in Power Systems. In Proceedings of the 2022 22nd International Scientific Conference on Electric Power Engineering (EPE), Kouty nad Desnou, Czech Republic, 8–10 June 2022; pp. 1–6. [Google Scholar] [CrossRef]
  48. Singh, N.K.; Wanik, M.; Jabbar, A.A.; Sanfilippo, A. Enhancing PV hosting Capacity of a Qatar Remote Farm Network using Inverters Ability to Regulate Reactive Power-a Case Study. In Proceedings of the 2019 IEEE PES Innovative Smart Grid Technologies Europe (ISGT-Europe), Bucharest, Romania, 29 September–2 October 2019; pp. 1–5. [Google Scholar] [CrossRef]
  49. Ruf, H. Limitations for the feed-in power of residential photovoltaic systems in Germany—An overview of the regulatory framework. Sol. Energy 2018, 159, 588–600. [Google Scholar] [CrossRef]
  50. Hashemi, S.; Østergaard, J. Methods and strategies for overvoltage prevention in low voltage distribution systems with PV. IET Renew. Power Gener. 2017, 11, 205–214. [Google Scholar] [CrossRef] [Green Version]
  51. Zhang, D.; Jiang, S.; Liu, J.; Wang, L.; Chen, Y.; Xiao, Y.; Jiao, S.; Xie, Y.; Zhang, Y.; Li, M. Stochastic Optimization Operation of the Integrated Energy System Based on a Novel Scenario Generation Method. Processes 2022, 10, 330. [Google Scholar] [CrossRef]
  52. Karunarathne, E.; Wijethunge, A.; Ekanayake, J. Enhancing PV Hosting Capacity Using Voltage Control and Employing Dynamic Line Rating. Energies 2022, 15, 134. [Google Scholar] [CrossRef]
  53. Pecenak, Z.K.; Kleissl, J.; Disfani, V.R. Smart inverter impacts on california distribution feeders with increasing pv penetration: A case study. In Proceedings of the 2017 IEEE Power & Energy Society General Meeting, Chicago, IL, USA, 16–20 July 2017; pp. 1–5. [Google Scholar] [CrossRef] [Green Version]
  54. Dvoracek, J.; Klusacek, J.; Drapela, J.; Topolánek, D. Dispatch Reactive Power Sharing Concept for Power Generating Plants in Medium Voltage Distribution Systems. In Proceedings of the 2022 22nd International Scientific Conference on Electric Power Engineering (EPE), Kouty nad Desnou, Czech Republic, 8–10 June 2022; pp. 1–6. [Google Scholar] [CrossRef]
  55. Gong, Q.; Fang, J.; Qiao, H.; Liu, D.; Tan, S.; Zhang, H.; He, H. Optimal Allocation of Energy Storage System Considering Price-Based Demand Response and Dynamic Characteristics of VRB in Wind-PV-ES Hybrid Microgrid. Processes 2019, 7, 483. [Google Scholar] [CrossRef] [Green Version]
  56. 309/2009 Z. z. Zákon o podpore obnoviteľných zdrojov energie a vysoko úcinnej kombinovanej výroby. Available online: https://bit.ly/3jjHG7v (accessed on 13 October 2022).
  57. Thomson, M.; Infield, D. Impact of widespread photovoltaics generation on distribution systems. IET Renew. Power Gener. 2007, 1, 33–40. [Google Scholar] [CrossRef]
  58. Arshad, A.; Püvi, V.; Lehtonen, M. Monte Carlo-Based Comprehensive Assessment of PV Hosting Capacity and Energy Storage Impact in Realistic Finnish Low-Voltage Networks. Energies 2018, 11, 1467. [Google Scholar] [CrossRef]
  59. EPRI. OpenDSS PVSystem Element Model. Version 1. Tech. rep. Technical report, Electric Power Research Institute. Available online: https://bit.ly/3G5rijD (accessed on 13 October 2022).
  60. Dubey, A.; Santoso, S. On Estimation and Sensitivity Analysis of Distribution Circuit’s Photovoltaic Hosting Capacity. IEEE Trans. Power Syst. 2017, 32, 2779–2789. [Google Scholar] [CrossRef]
  61. Navarro, A.; Ochoa, L.F.; Randles, D. Monte Carlo-based assessment of PV impacts on real UK low voltage networks. In Proceedings of the 2013 IEEE Power & Energy Society General Meeting, Vancouver, BC, Canada, 21–25 July 2013; pp. 1–5. [Google Scholar] [CrossRef] [Green Version]
  62. Fatima, S.; Püvi, V.; Arshad, A.; Pourakbari-Kasmaei, M.; Lehtonen, M. Comparison of Economical and Technical Photovoltaic Hosting Capacity Limits in Distribution Networks. Energies 2021, 14, 2405. [Google Scholar] [CrossRef]
  63. Tonkoski, R.; Turcotte, D.; El-Fouly, T. Impact of high PV penetration on voltage profiles in residential neighborhoods. IEEE Trans. Sustain. Energy 2012, 3, 518–527. [Google Scholar] [CrossRef]
  64. Ferdowsi, F.; Mehraeen, S.; Upton, G.B. Assessing distribution network sensitivity to voltage rise and flicker under high penetration of behind-the-meter solar. Renew. Energy 2020, 152, 1227–1240. [Google Scholar] [CrossRef]
  65. Stetz, T.; Yan, W.; Braun, M. Voltage control in distribution systems with high level PV-penetration. In Proceedings of the 25th European PV Solar Energy Conference, Valencia, Spain, 6–10 September 2010; pp. 5000–5006. [Google Scholar]
  66. Heinrich, C.; Fortenbacher, P.; Fuchs, A.; Andersson, G. PV-integration strategies for low voltage networks. In Proceedings of the 2016 IEEE International Energy Conference (ENERGYCON), Leuven, Belgium, 4–8 April 2016; pp. 1–6. [Google Scholar] [CrossRef]
  67. Hu, J.; Marinelli, M.; Coppo, M.; Zecchino, A.; Bindner, H.W. Coordinated voltage control of a decoupled three-phase on-load tap changer transformer and photovoltaic inverters for managing unbalanced networks. Electr. Power Syst. Res. 2016, 131, 264–274. [Google Scholar] [CrossRef] [Green Version]
  68. Atmaja, W.Y.; Sarjiya; Lesnanto, M.P.; Pramono, E.Y. Hosting Capacity Improvement Using Reactive Power Control Strategy of Rooftop PV Inverters. In Proceedings of the 2019 IEEE 7th International Conference on Smart Energy Grid Engineering (SEGE), Oshawa, ON, Canada, 12–14 August 2019; pp. 213–217. [Google Scholar] [CrossRef]
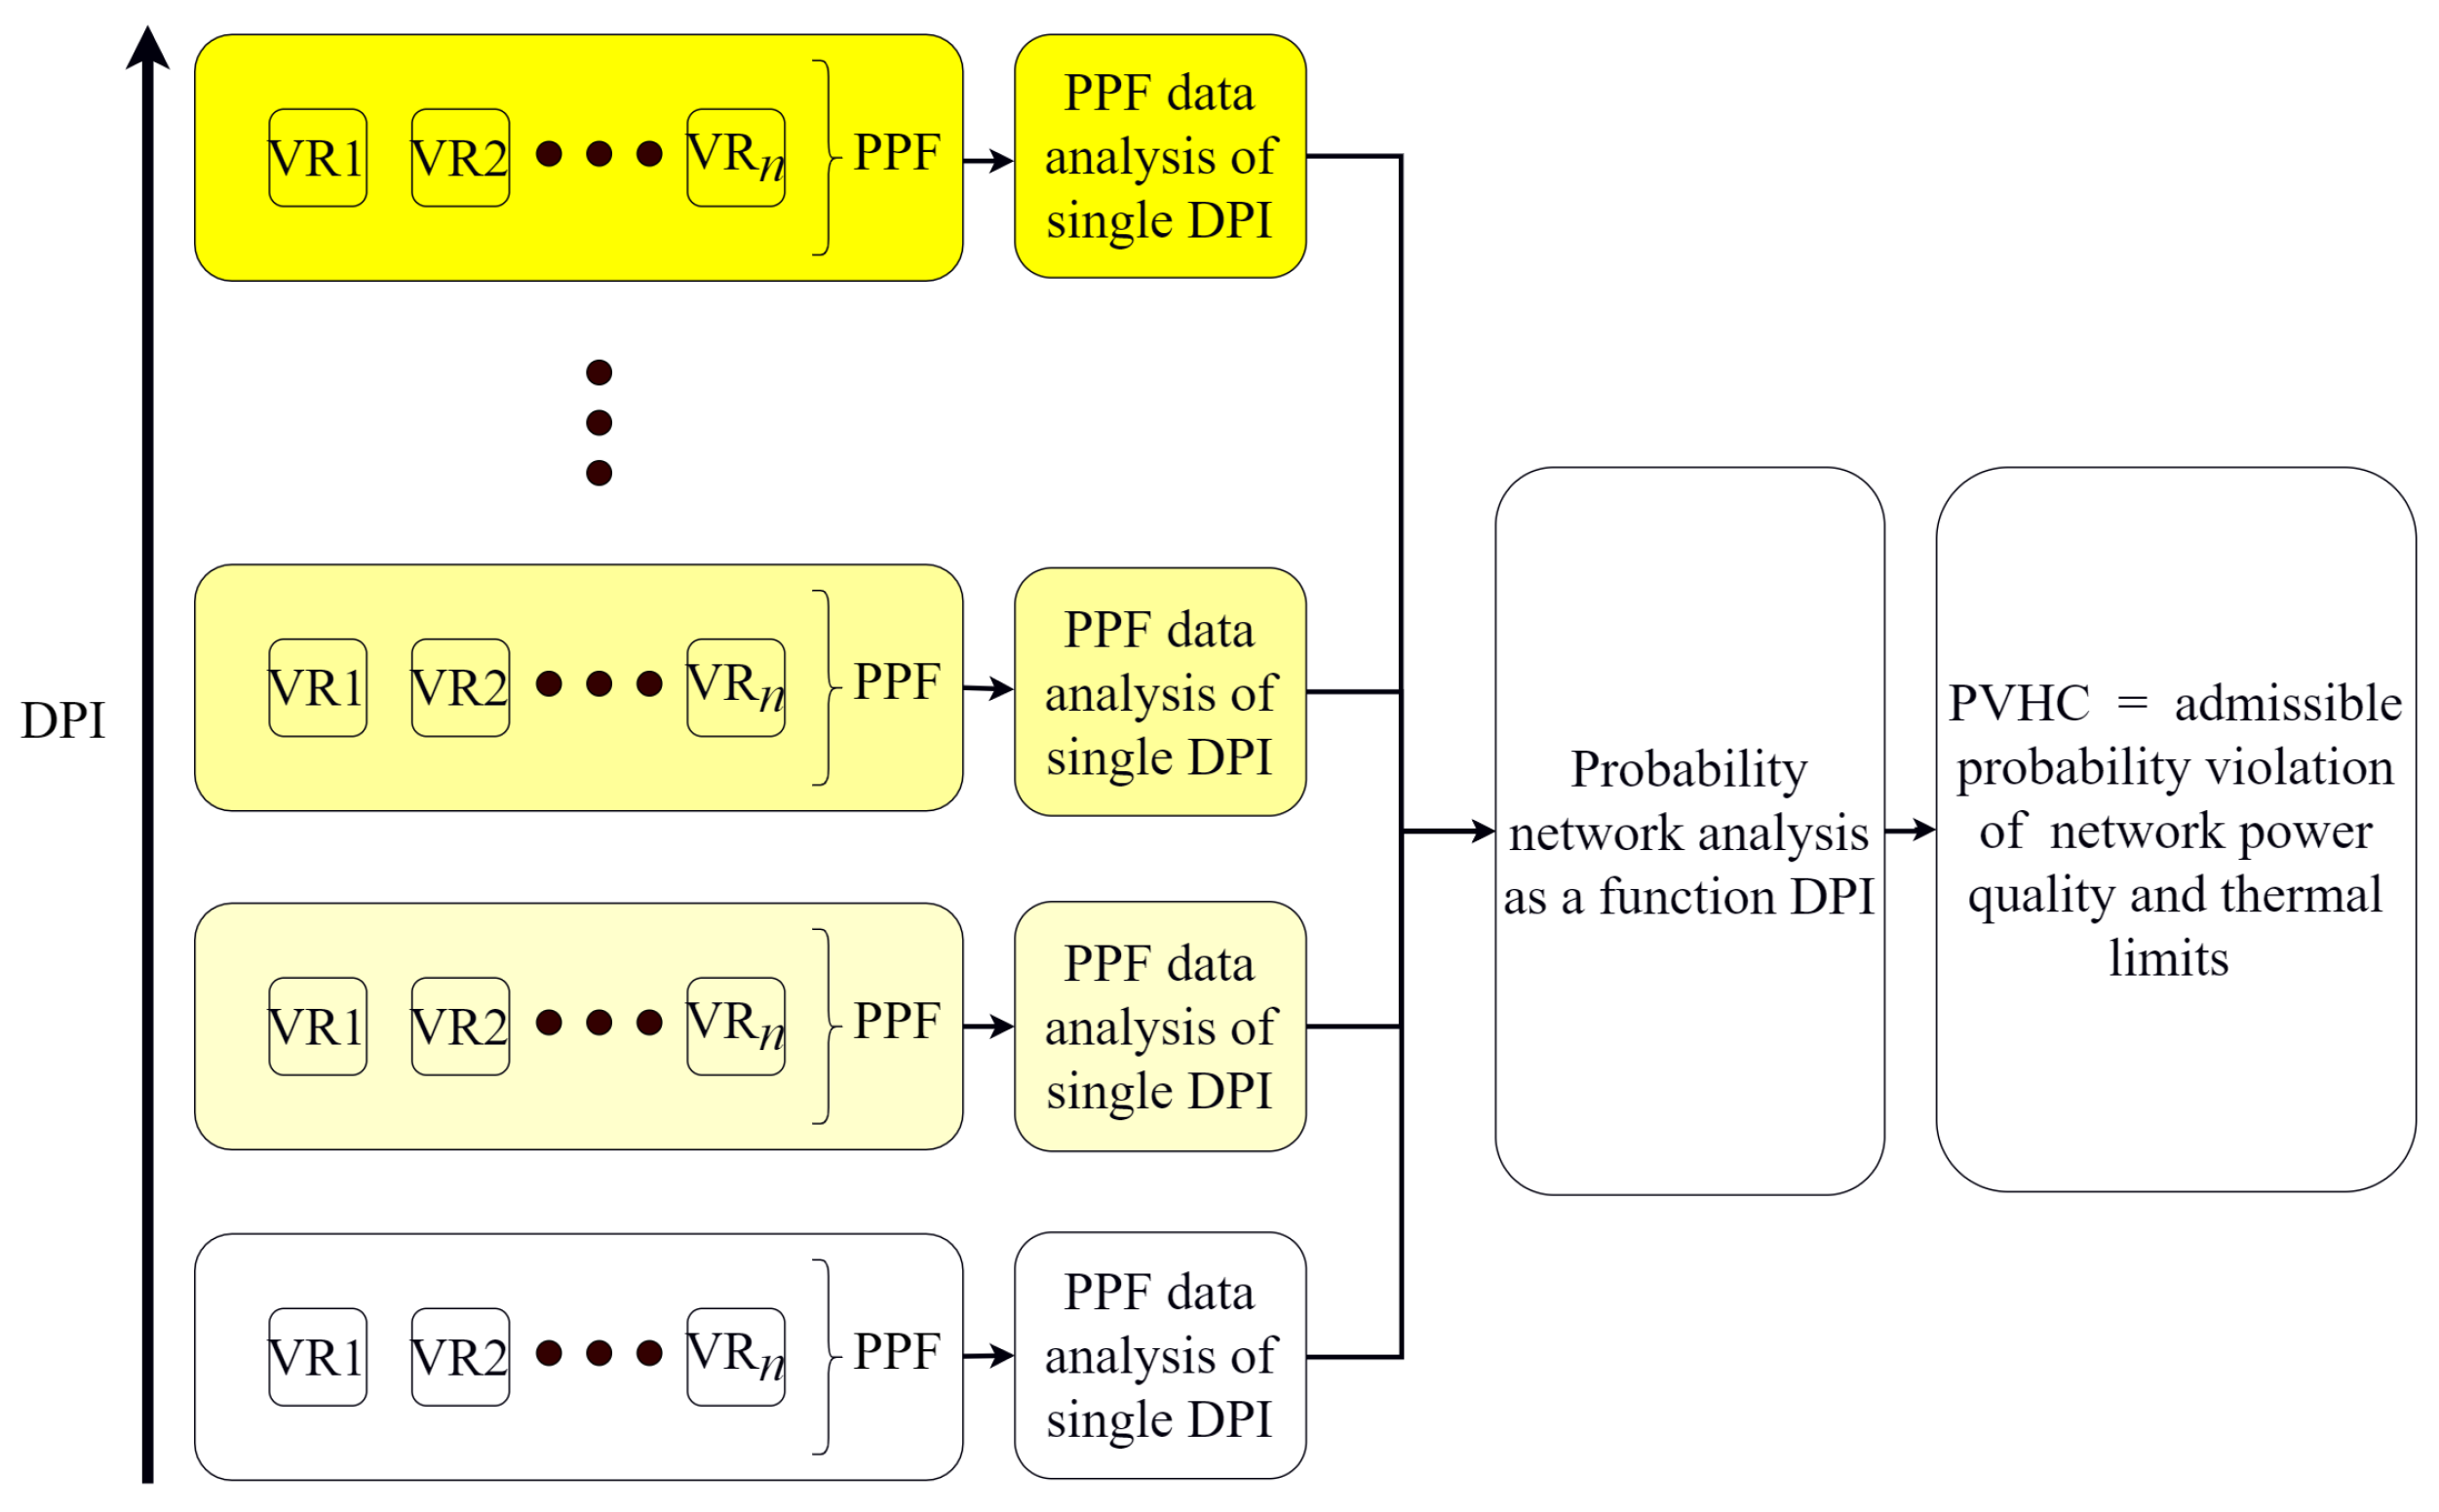
Figure 1. Multiple model VR for single DPI, e.g., the sum of power from PV installations.
Processes 11 00009 g001
Figure 2. Multiple model VR for single DPI, e.g., the sum of power from PV installations.
Processes 11 00009 g002
Figure 3. Topology of the analyzed LV network.
Processes 11 00009 g003
Figure 4. Yearly load shape curves used in the model.
Processes 11 00009 g004
Figure 5. PV system efficiency characteristics.
Processes 11 00009 g005
Figure 6. Meteorological data.
Processes 11 00009 g006
Figure 7. PV parameter probabilities.
Processes 11 00009 g007
Figure 8. Histograms of voltage relative frequency in a year for different DPI.
Processes 11 00009 g008
Figure 9. Results of V0 scenario analysis (a) box plot of voltage distribution, (b) DF of overvoltage, (c) box plot of calculated looses distribution, (d) heat map of power flow through TR 22/04 power TR.
Processes 11 00009 g009
Figure 10. Results of voltage unbalance for V0 scenario.
Processes 11 00009 g010
Figure 11. CDF calculated for overvoltage in the network for V1 scenario.
Processes 11 00009 g011
Figure 12. Total power losses for PV PF 0.95 (left) and 0.80 (right).
Processes 11 00009 g012
Figure 13. CDF calculated for overvoltage in the network for V2 scenario.
Processes 11 00009 g013
Figure 14. Box plot of voltage distribution for increasing DPI for two different tap positions of DETCTR.
Processes 11 00009 g014
Table 1. Electrical parameters of used conductors.
ConductorNo. PhasesR [ Ω /km]X [ Ω /km]B [mS/km] I max [A]
50 AlFe 610.7740.4032.980200
35 AlFe10.9800.4112.921153
RETILENS 3 × 15030.2060.079-250
RETILENS 1 × 7010.4430.082-170
AlFe 16/211.8790.312-67
25 AlFe11.5310.4252.816122
70 AlFe10.5060.272-241
Table 2. PVHC results for different reactive power absorbing PF of PV systems.
PFPVHC [%]PV Power Equivalent [kW]Improvement over V0 [%]Limitation
113.679.9-overvoltage
0.9521.4127.757.35overvoltage
0.926.415594.12overvoltage
0.8533.3195.7144.85overvoltage
0.843.2253.4217.65overvoltage
Table 3. PVHC results for different DETC tap position of MV/LV TR.
TapPVHC [%]PV Power Equivalent [kW]Improvement over V0 [%]Limitation
−5%13.679.9-overvoltage
−2.5%31.5185.1131.62overvoltage
0%00-undervoltages below 0.85 U n
Table 4. Differences in PVHC results due to different limit definitions.
PFPVHC [%]
P ( U L neutral > 1.1 U n ) 0.01 P ( U L neutral > 1.1 U n ) 0.05
113.624.4
0.9521.437.5
0.926.447.2
0.8533.360
0.843.282.2
tap
−5%13.624.4
−2.5%31.550.6
0%00
Table 5. Summary of model parameters and their characteristics.
Probabilistic ParametersDeterministic Parameters
size of PVsize of load
type of PV (single-phase or 3-phase)load shapes of power consumption
phase selection for single-phase PV connectionmeteorological parameters
topological position of PV (Monte Carlo)loads topological position
distribution of 3-phase load among phases-
PF of each single-phase load-
Disclaimer/Publisher’s Note: The statements, opinions and data contained in all publications are solely those of the individual author(s) and contributor(s) and not of MDPI and/or the editor(s). MDPI and/or the editor(s) disclaim responsibility for any injury to people or property resulting from any ideas, methods, instructions or products referred to in the content.