Abstract
The satisfactory construction of regional building energy planning models is a key technology in effective energy allocation. At present, the selection of energy planning is only based on artificial judgment criteria, which leads to a high subjectivity in energy planning. This research innovatively introduces the network flow theory into the urban regional building energy planning model. Combined with the actual characteristics of regional building energy planning, the regional building energy planning model was constructed and the regional energy distribution mode was optimized. The model includes the energy supply layer, energy conversion layer, and energy demand layer. At the same time, the minimum cost and maximum flow problem of the model was solved with the help of the BG iterative algorithm. The model includes the energy supply layer, energy conversion layer, and energy demand layer. We used the BG iterative algorithm to solve the minimum cost and maximum flow problem of the model. The accuracy, accuracy, recall rate, and specificity of the four minimum cost maximum flows tended to be stable with the increase of the number of iterations. After the application of BG iterative algorithm, the cost consumption of each part of the regional building energy planning model in summer will be significantly reduced, and the total consumption cost is 929 million dollars. The research results verify the high applicability of introducing the network flow theory and BG iterative algorithm to construct and solve the regional building energy planning model, which can be applied to the rational allocation of resources in the region.
1. Introduction
“Building energy” generally considers the energy necessary to meet the heating, cooling, and domestic hot water needs of buildings in the area, rather than energy used for transportation and production. The program achieves energy saving goals for the region through appropriate energy distribution and energy saving meters. Currently, when considering district building plans, the selection and evaluation process is often based solely on human judgment, and specific strategies are not well correlated with the goal of controlling district energy. District energy planning is based on new and existing buildings in the region, and mainly considers the energy use of heating, cooling and hot water in the process of building operation, as well as the use of building electricity and electrical equipment [1,2,3,4]. The planning model also includes the production, transportation and other aspects of energy use. The research content includes all the processes of energy production, transportation, conversion and exchange, transmission, distribution, and use. Regional construction planning usually only considers conversion, distribution, and domestic electricity consumption in the region. Therefore, the energy planning model used in regional energy planning is too large to meet the needs of domestic electricity consumption [5,6]. Most of the current energy planning models directly refer to foreign standards or make corresponding modifications. Therefore, the data format in the model is very different from the statistical data in China, and the relevant data in China are not statistically available or difficult to obtain. Therefore, it is difficult to create an energy planning model that conforms to the actual situation in China when there are conflicting data in the application of the model. Aiming to solve the issue of building energy planning model in urban areas, this research focuses on the minimum cost and maximum flow problem under the innovative concept of a network combined with the characteristics of regional power construction planning to create a regional power production mode in Shanghai, improve the regional power distribution, and reduce the impact of people on decision-making. In order to solve the problems of excessive waste of resources and high economic cost of building energy in urban areas, the network flow theory is innovatively introduced into the urban regional building energy planning model. This method combines the actual characteristics of regional building energy planning to build a model, and optimizes the regional energy distribution mode. The designed model includes the energy supply layer, energy conversion layer, and energy demand layer. At the same time, the minimum cost and maximum flow problem of the model is solved with the help of the BG iterative algorithm, which is of positive significance for the rational planning of regional building energy.
2. Literature Review
The classical maximum flow problem only pays attention to the circulation capacity of the network flow, without considering the circulation cost. In fact, the cost factor is very important. As the most basic network flow model, the minimum cost flow refers to finding a flow value from the sending point to the receiving point in a given network to minimize its cost. It is applied in many fields such as construction, energy, transportation, etc. Li G and other scholars proposed to introduce the maximum network flow problem to analyze the path problem in order to solve the problem of how to allocate the minimum number of control sources to ensure the target controllability of a given system. The research has proved that after introducing the cost of each edge in the flow network, this kind of problem can be effectively solved by applying the maximum (minimum) cost maximum flow algorithm. At the same time, it is found that the maximum (minimum) controllable node set covers the directed path and circle for the control source based on the minimum number of allocated nodes [7]. Guo Q and other researchers introduced network flow theory to build a new energy-saving backhaul path planning problem to achieve path planning with minimum energy consumption and maximum throughput. The simulation results confirm that, compared with the current path planning, the backhaul throughput is effectively improved by nearly 70% [8,9]. Boykov Y and other scholars compared the maximum flow minimum cost algorithm with different polynomial time complexities for visual energy. The comparison of the experimental results shows that the algorithm proposed in the study has an ideal effect in terms of operating efficiency and convergence [10]. Mamo G E and other researchers proposed to determine the number, install the capacity and design flow of hydraulic turbines through mathematical models, and optimize the configuration based on the optimal operation rules of runoff hydropower stations in view of the fact that the selected flow of maximum energy output provided by traditional runoff hydropower stations is not the optimal design flow. It can be seen from the test results from the real data that this model can provide support tools for relevant responsible persons in the process of hydropower station development [11,12]. Sathaporn and other scholars studied a meta heuristic algorithm combining the principle of a noise genetic algorithm to verify the shortest time network flow problem and introduced random variables with time-varying distribution function as capacity and arc traversal times. Hierarchical sampling technology is adopted in the sample set selection process. The method described in the study can be applied to many fields, however, the best evacuation tips for large structures or buildings should be considered in advance when a quick escape is required [13].
Effendi R and his team used the method of combining descriptive analysis with economic and financial analysis to deeply study the relevant data and information of renewable wood particles. The research results show that the improvement and management of the supply chain and value chain should be emphasized in the development of the wood particle industry [14]. Petrichenko K proposed a new technology to build an integrated solar energy model to solve the problem regarding the net zero energy consumption standard of building types at the current stage. The hanging technology can be applied to the classification of different types of buildings, climates, and regions at a high resolution. The model test results shows high resolution in terms of year, building type, climate type, geographical region, etc. [15]. Chen S et al. discussed the multi-region coordinated development scheme under the background of air pollutant emission constraints, and considered an hourly power-dispatching multi-region interconnected power system, air pollution emission constraints, and other conditions. The scenario analysis results show that existing actions, including long-distance transmission lines and corresponding coal power plants in resource rich regions, will significantly help to reduce emissions in load concentrated areas and achieve the national emission reduction goal [16]. Wang J J and other scholars put forward a green building energy efficiency evaluation model based on the entropy weight and fuzzy comprehensive evaluation methods according to the current status of green building energy efficiency evaluation. Based on the comprehensive analysis of the factors affecting green building energy efficiency technology, they established a green building energy efficiency technology evaluation index system [17]. Kalogirou SA proposed an evaluation system of ecological civilization construction based on the analytic hierarchy process (AHP) of entropy weight correction, which uses entropy weight to modify the hierarchical model. At the same time, different entropy weight values are used in the time and space dimensions for weight correction so as to achieve the greater aim of adapting to the actual social and economic development. This method can evaluate the construction of an ecological civilization in real time with accuracy and speed, provide a reliable reliability evaluation, and has a high practical value [18].
Combined with the research status of many scholars at home and abroad, the network flow theory has been widely applied in finance, engineering, education, and other related fields, and the research results have achieved remarkable results. At present, there are some problems in the research of the urban regional building energy planning model, such as single construction, low rationalization, and weak pertinence. At the same time, few studies have focused on urban regional building energy planning, rational resource allocation, and other fields. Hence, follow-up research should be done to conduct an in-depth analysis to solve the problem of a lack of scientific and reasonable resource allocation. Therefore, this study introduces the network flow theory into the urban regional building energy planning model and uses an iterative algorithm to solve the model to ensure the reasonable allocation of resources.
3. Research Method
3.1. Network Flow Theory and Energy Circulation in Regional Building Energy System
The network flow theory was originally applied to the minimum cost flow problem and then gradually applied in the decomposition and synthesis of network flow and multi-commodity flow, multi-terminal flow, flow with gain, and so on. The network flow theory points out that the binary group composed of sets and components is Equation (1) [19].
In Equation (1), where the vertex set of the graph is and the edge set composed of the elements in it is the set . A graph with a direction on each edge can be called a directed graph, and an edge with a direction can also be called a directed edge or arc . At the same time, the network points out sources and sinks, and each directed edge is given a weighted directed graph of non-negative integers, which can be expressed as Equation (2).
In Equation (2), where the source point set of the network is , the sink set is , and the other points are referred to as transit points in the network. The capacity function of the network is , which is a non-negative function in the set of arcs, which represents the constraints of the transmission capacity on each arc .
Assuming that the network includes only one sink and source, the network can be regarded as a single-source single-sink network, which can be expressed as Equation (3).
In the actual application process, in order to simplify the calculation of the multi-source multi-sink network, the single-source and single-sink network is usually used for alternative calculation. The specific operation method is as follows, adding artificial sinks and artificial sources in the multi-source multi- sink network. Connecting an arc, the corresponding capacity is or is the sum of the capacities of the arcs at the origin, and has similar inferences for.
Suppose that each arc of the network is given a non-negative real number that represents the cost of flowing a unit of traffic on the arc. The cost function is , also known as the cost network, as shown in Figure 1. The triples in each arc represent the flow, capacity, and cost per flow on the arc.
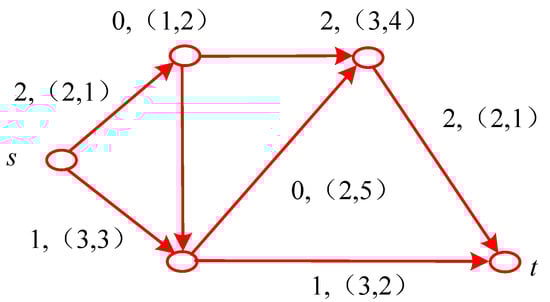
Figure 1.
Schematic diagram of fee network.
The energy flow and network flow problems of regional building energy systems have similarities. Referring to the relevant regulations on the conversion, distribution and consumption of building energy in China, the network flow theory is applied to solve the energy circulation of regional building energy system. The solution to the minimum cost maximum flow in the network flow problem is to find the feasible flow with the minimum total cost in the cost network, and the feasible flow also refers to the maximum flow of the cost network [20,21]. For the energy circulation of the regional building energy system, it means that on the basis of reaching the regional load standard, try to make the hot water configuration, air conditioning, heating, and other aspects of the buildings in the region scientific and the energy consumption is the lowest. The research analyzes the regional building energy system of Shanghai, and the data is from the local statistical yearbook. Figure 2 refers to a schematic diagram of the energy flow of the regional building energy system. The main realization methods of energy allocation are energy demand, energy conversion, and energy supply, and the relationship between them is connected by directed line segments. The characteristics of regional building energy circulation include three levels, namely directionality, capacity, and hierarchy. For the directionality, the regional building energy mainly completes a series of processes such as energy supply, conversion, distribution and consumption through the three processes of energy supply, energy conversion and energy demand, so that the energy utilization process has a certain directionality. The energy flowing in each directed line segment has an upper limit and a lower limit. The upper limit of energy generally refers to the maximum value that a certain energy can supply and use in a region, and the lower limit is generally 0. Affected by policies and other factors, some regions have different needs for energy consumption, and the upper and lower limits of energy capacity have recently changed. According to the different types of elements, the energy cycle process can be divided into three different layers: energy supply layer, energy conversion layer and energy demand layer. The network flow theory shares several similarities with the regional building energy cycle process: a network is a weighted directed graph that determines sources and sinks, and each directed edge is assigned a non-negative integer weight such that each edge has a direction.
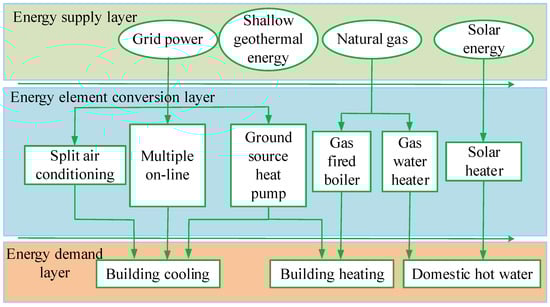
Figure 2.
Schematic diagram of energy circulation of regional building energy system.
3.2. Construction of Summer Regional Building Energy Planning Model
Based on the network flow theory, referring to the relevant regulations on the conversion, distribution and consumption of building energy in China, the network flow theory is applied to solve the energy circulation of regional building energy system, the network flow theory is introduced into the regional building energy planning to construct a regional building energy planning model. In the energy circulation stage of regional buildings, the energy supply layer refers to the types of energy that can be provided in the region, the energy conversion layer refers to the conversion method of all resources, and the energy demand layer refers to considering the hot water, heating, and air conditioning needs of different types of buildings in the region. The research takes ordinary residential buildings in summer as an example, and the flow diagram of the cooling network of ordinary residential buildings constructed is shown in Figure 3. The forms of energy conversion include split air conditioners, multi-line air conditioners, ground source heat pumps, etc. In the energy supply layer, grid electricity can be used to meet the realization of split air conditioners and online air conditioners, while ground source heat pumps need to use shallow geothermal energy and electricity can be achieved through the joint action of the grid, and domestic hot water can be achieved through solar water heaters. Provided that the elements are connected by straight line segments according to the mutual relationship, finally, the network flow graph is obtained [22,23,24]. Referring to the construction method in Figure 3, the elements of each layer in the summer regional building energy planning are arranged in layers, and the elements between different layers are connected by line segments directed according to the energy flow relationship, from the energy outflow element to the inflow element.
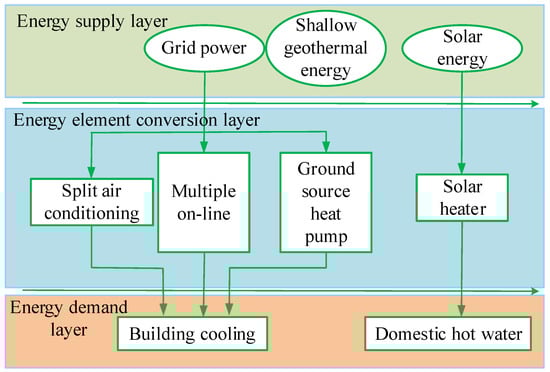
Figure 3.
Flow diagram of cooling network for ordinary residential buildings.
The elements in the energy supply layer can be referred to as , the elements in the energy conversion layer can be referred to as , and the elements in the energy demand layer can be referred to as , and artificial sinks and artificial sources can be added . The summer regional building energy planning model is shown in Figure 4. The energy planning model constructed in Figure 4 illustrates all possible energy allocation scenarios. Each energy supply, conversion and demand form in the model corresponds to a node in the network, each directed segment corresponds to an arc in the network, and each directed segment corresponds to an arc in the network. The energy flow in the directed channel segment corresponds to the arc capacity in the network, and there is also an energy consumption per unit flow in each directed channel segment, corresponding to the cost in the network.
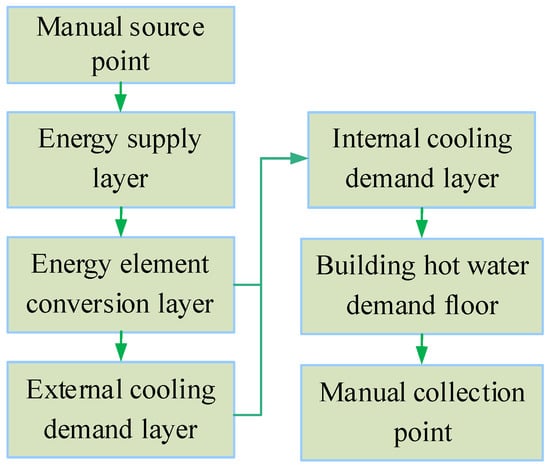
Figure 4.
Regional energy planning model.
Energy supply layer to the energy conversion layer is the usable amount of various energy sources. The usable amount of natural gas and electricity is obtained according to the relevant upper-level planning. The renewable utilization amount of geothermal energy and solar energy in the pool layer can be obtained according to actual investigation and calculation. The capacity of each arc converted from the energy conversion layer to the energy demand layer is the energy contained in the hot water, cold water, etc. provided by all the energy conversion equipment. The capacity of each arc from the energy demand layer to the artificial sink is the load demand of each building, which is estimated by software simulation or the unit area load index. The formula for calculating the capacity of each arc from the artificial source to the energy supply layer is as follows. Taking the arc as an example, the corresponding capacity is formula (4).
In formula (4), are the end points of the connection and arc, and , and are the points of the corresponding arc.
The total energy consumption of the model is the total energy output by the energy supply layer , and the cost of each arc from the energy supply layer to the energy conversion layer is given.
3.3. Busacker-Gowan Iterative Method to Solve the Model
The method of solving the minimum cost maximum flow problem is applied in the model solving process, and the method used is the Busacker Gowan (BG) iterative method. For the summer regional building energy planning model, the network minimum cost flow problem can be understood as follows [25]. Set the directed graph to be represented by, and the upper and lower capacity functions of any arc are respectively expressed as sum , where, . The cost per unit of flow in the arc is, which can be viewed as a cost function. For any vertex , its demand or supply can be expressed as a supply and demand function, and it needs to satisfy Equation (5).
Therefore, the capacity-cost network can be represented by the network. Similarly to the maximum flow network, the definition of the feasible flow of the capacity-cost network is as follows, set a flow on the network as , and satisfy Equation (6) at the same time.
Then a feasible flow in the network can be considered as , and the total cost of this flow can be expressed as Equation (7).
Therefore, the minimum-cost flow problem can be regarded as obtaining the feasible flow with the minimum total cost in the network. The minimum cost flow problem can also be regarded as a linear programming problem, see Equation (8).
Based on this, the study sets the capacity-cost network as . First, the criterion of minimum cost is given as . A hypothetical circle is that, if the direction of the pair is set, the radians on the upper can be divided into two categories with respect to the direction. Suppose a flow on is , when , satisfies , then it can be called the augmenting circle of . It is worth noting that the direction of and together determine whether it is an augmentation circle. Assuming that the augmenting circle in relation to is , set the Equation (9), then .
Then construct a new stream, see Equation (10).
can be regarded as obtained by translation processing on the circle, which can be recorded as . For any vertex , Equation (11) exists.
This transformation can be regarded as maintaining the “outflow as much as possible” constant at each point, and satisfies Equation (12) [26,27].
Therefore, if the feasible flow on is , it can be regarded as a feasible flow as well. The cost change of and is Equation (13).
The cost of the circle can be considered as , can be recorded as . It can be seen that when there is a difference in the orientations, the difference is one sign. By formula (11), the following conclusions can be obtained. When the minimum cost flow is, then the related augmentation circles exist .
The specific steps of the BG iterative algorithm are shown in Figure 5, and the details are as follows, setting , initial . First of all, it is necessary to establish a directed weighted network , which satisfies Equation (12) for, and .
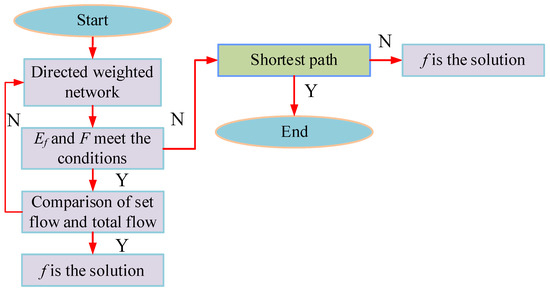
Figure 5.
Specific steps of BG iterative algorithm.
When the formula (12) is satisfied, the second stage is entered. The shortest path from the starting point to the end point in all directed weighted networks is , if it exists , the process is terminated, otherwise the solution is . In the second stage, Equations (13) and (14) need to be satisfied.
Define a new flow as Equation (18).
When the obtained solution exceeds the value of the estimated flow, it needs to be slightly adjusted to ensure that the set flow is the same as the final total flow. At this time, the optimal solution can be obtained. The minimum cost allocation scheme is , otherwise, return to the first stage.
The scheme first takes zero flow as the initial flow of the network, finds the augmented chain from the source to the sink, and ensures that this augmented chain is the chain with the least cost. If an incremental chain exists, adding a stream to that stream produces a new stream. Using the new flow as the initial flow, repeat the above process until no new incremental chain can be found, and the current feasible flow is the minimum and maximum cost flow. The characteristic of this method is to maintain the optimality of the solution and gradually approach the feasible solution [28,29,30]. For the actual calculation, due to the variety of energy sources, suitable energy conversion forms, and different building needs in the area, manual calculation using the BG iterative method will be too complicated and must be assisted by the MATLAB software. When the MATLAB program uses the iterative method of BG, the model must be a matrix for the computer to recognize. The input of this program is the cost matrix and the cost network capacity matrix, and the output is the minimum cost maximum flow matrix.
4. Result
4.1. Performance Verification of Regional Building Energy Planning Model
The experimental platform set by the research institute is as follows, the operating system is Windows 7, the memory size is 8.0 GB, the system type is 64-bit operating system, and the programming language is Java. The experiment first analyzes the performance of the BG algorithm to verify its superiority in the regional building energy planning model. Figure 6 refers to the loss values for different training times and different batches. In order to further enhance the credibility of the research results, the experiments set the minimum cost and maximum flow comparison algorithms as the belief propagation algorithm, shortest path algorithm, and improved collaborative optimization algorithm. The loss value of the four min-cost max-flow algorithms gradually decreases with the increase of training times, and finally converges to a fixed value. When the number of training times is 20, the error convergence values of BG algorithm, belief propagation algorithm, shortest path algorithm, and improved collaborative optimization algorithm are 0.456, 0.625, 0.689, and 0.721, respectively. Compared with the belief propagation algorithm, the shortest path algorithm, and the improved collaborative optimization algorithm, the reduction ratio of the error convergence value of the BG algorithm is 46.35%, 62.26%, and 76.58%. For the training batch, when the training batch size is 100 per time, the error convergence values of the four algorithms are 0.898, 1.035, 1.234, and 1.563. Compared with the other three algorithms, the reduction ratio of the error convergence value of the BG algorithm is 26.35%, 52.31%, and 89.36%. Therefore, the BG algorithm has certain advantages in the process of calculating the minimum cost and maximum flow.
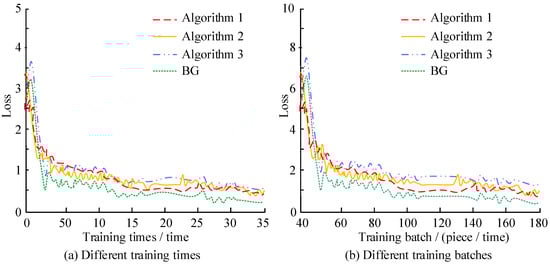
Figure 6.
Loss value under different training times and different batches. ((a) When the training times are 20, the error convergence values of BG algorithm, belief propagation algorithm, shortest path algorithm and improved cooperative optimization algorithm are 0.456, 0.625, 0.689 and 0.721 respectively. (b) When the training batch size is 100 times, the error convergence values of the four algorithms are 0.898, 1.035, 1.234 and 1.563 respectively).
The experiment then analyzes the accuracy and precision of the four minimum-cost maximum flows under different iterations, and the results are shown in Figure 7. It can be seen from the figure that the accuracy and precision of the four minimum cost and maximum flows gradually tend to be stable with the increase of the number of iterations. Among them, the BG iteration algorithm has the highest accuracy and precision, and the stable convergence values are 88.56% and 89.12%. The accuracy rate range of the other three minimum cost maximum flow algorithms is 72.36–83.24%, and the accuracy rate value range is 73.56–82.15%, and the accuracy and precision rate of the collaborative optimization and improvement algorithm are the lowest, and the remaining two Algorithms are second. Therefore, the accuracy and precision of the BG iterative algorithm can reach an ideal level, because compared with other algorithms, the algorithm simplifies the process through computer software in actual operation.
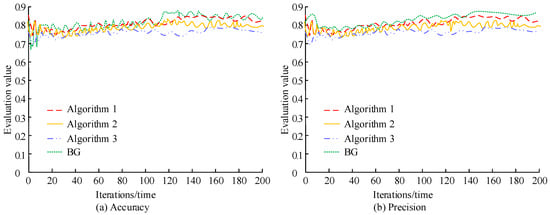
Figure 7.
Accuracy and precision of four minimum cost maximum flows under different iterations. ((a) The BG iterative algorithm has the highest accuracy, with the stable convergence values of 88.56% respectively. The accuracy range of the other three minimum cost maximum flow algorithms is 72.36–83.24%. (b) The BG iterative algorithm has the highest accuracy and precision. The stable convergence value is 89.12%, and the accuracy range is 73.56–82.15%).
At the end of the experiment, the recall rate and specificity of the four minimum-cost maximum flows under different iteration times are shown in Figure 8. It can be seen from the figure that the recall rate and specificity of the four minimum-cost maximum flows gradually become stable with the increase of the number of iterations. Among them, compared with the other three minimum cost maximum flow algorithms, the recall of the BG iteration algorithm has the highest rate and specificity. The stable recall rate of the other three minimum cost and maximum flow algorithms ranges from 65.58% to 78.96%, while the stable specificity value ranges from 66.83% to 78.35%, and the improved algorithm has the lowest recall rate and specificity. For the next two algorithms, the recall rate and specificity stable convergence value of BG iterative algorithm are 87.43% and 82.03%, respectively. Therefore, both the recall and specificity of the BG iterative algorithm can achieve the best performance under the same conditions. The performance test results of four minimum cost maximum flows show that the BG iterative algorithm presented in this study has obvious advantages in maximum flow and minimum cost analysis, and can be used to solve the regional building energy planning model to obtain the best model parameters.
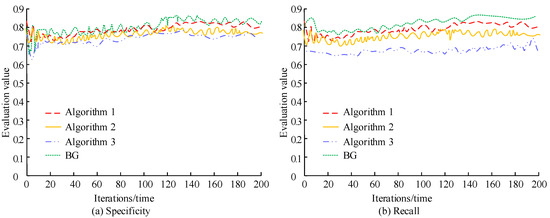
Figure 8.
Recall rate and specificity of four minimum cost maximum flows under different iterations. (It can be seen from the figure that with the increase of iteration times, the recall rate and specificity of the four minimum cost maximum flows gradually become stable. Among them, compared with the other three minimum cost maximum flow algorithms. (a) BG iterative algorithm has the highest specificity. The stable recall rate of the other three minimum cost and maximum traffic algorithms is between 65.58% and 78.96%. (b) The specificity of the BG iteration algorithm is the highest, and the stability specificity of the other three algorithms is between 66.83% and 78.35%).
4.2. Application Effect of Regional Building Energy Planning Model
After determining the performance of the BG iterative algorithm, the application effect of the experimental algorithm in the summer energy model of ordinary residential buildings is analyzed. Table 1 refers to the minimum cost and maximum flow of energy model for ordinary residential buildings in summer. The table shows the minimum cost and maximum flow of each level of the regional building energy planning model in summer, with the value range of 0.41–3.17 million dollars and 1023–2654, respectively. The corresponding residential building energy types are different, and the overall minimum cost is 929 million dollars.

Table 1.
Minimum cost and maximum flow of energy model for ordinary residential buildings in summer.
Figure 9 shows the cost of energy planning for each part of the summer regional building energy planning model after applying the BG iterative algorithm. With the increase of time, the cost consumption of Shanghai’s annual energy supply layer, energy conversion layer, and energy demand layer shows a decrease year by year. As a whole, it can be seen that after the application of the BG iterative algorithm, the cost consumption of each part of the regional building energy planning model in summer will be greatly reduced, which will help to achieve a reasonable allocation of resources and make the overall energy consumption within the regional requirements.
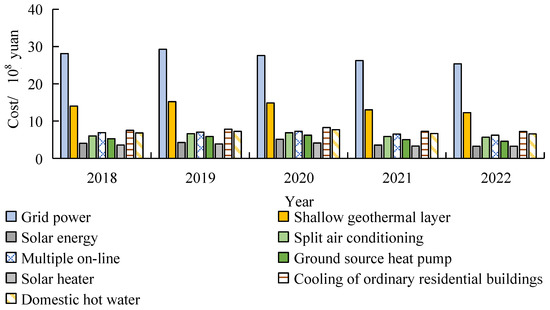
Figure 9.
The cost of each part of the summer regional building energy planning model.
In terms of environmental protection and energy conservation, the study takes a district in this area as an example for analysis. The operation time of air conditioning in summer is 90 days, and the daily working time is 24 h, totaling 2160 h. The input power of the original energy planning model and the existing energy planning model in summer is 4.3 kW and 12.2 kW, respectively, and the results are shown in Table 2. The existing energy planning model and the original energy planning model are 4925 kWh and 15,810 kWh. The annual power consumption yuan of the existing energy planning model is lower than that of the original energy planning model, saving 18,879 kWh. Research and creatively introduce the network flow theory into the urban regional building energy planning model to solve the problem of excessive waste of building energy and high economic cost in urban areas.
Table 2.
Results of the original energy planning model and the existing energy planning model.
5. Discussion
The formulation of building energy planning objectives should include four aspects: building energy conservation, renewable energy penetration, carbon emission accounting in the operation phase and smart energy control. The solution results of the building energy planning model show that compared with the belief propagation algorithm, the shortest path algorithm, and the improved collaborative optimization algorithm, the loss values of the four minimum cost maximum flow algorithms gradually decrease with the increase of training times, and eventually converge to a fixed value. When the training times are 40, the error convergence values of BG algorithm, belief propagation algorithm, shortest path algorithm, and improved cooperative optimization algorithm are 0.456, 0.625, 0.689, and 0.721, respectively. The recall rate and specificity of the four minimum cost maximum flow algorithms tend to be stable with the increase of the number of iterations. Compared with the other three minimum cost maximum flow algorithms, the recall rate and specificity of the BG iteration algorithm are the highest. This is because the BG algorithm is an effective heuristic algorithm that is suitable for single constraint problems and can obtain suboptimal solutions. The cost and time of other algorithms are too long, and the results are not ideal.
The existing energy planning model and the original energy planning model are 4925 kWh and 15,810 kWh. The annual power consumption yuan of the existing energy planning model is lower than that of the original energy planning model, saving 18,879 kWh. Although the energy planning model presented in the study has a positive impact on energy conservation and environmental protection, it can be applied to the planning and design process of urban buildings. Green buildings protect the environment, improve human living and working comfort, and create a healthy space for use. Such indirect benefits are not generated by a single technology, but by green buildings built by applying a complete set of green technology combination schemes. It is necessary to propose a scientific evaluation system in the future to study the building energy planning process based on the principle of efficient utilization of building energy, including planning preparation, planning goal formulation, energy demand analysis, resource potential evaluation, energy system configuration, intelligent energy management and control, comprehensive planning evaluation and results list. The research content can provide basis and theoretical support for building energy planning in China. Subsequent research needs to improve the energy planning model with the help of relevant technologies, improve the feasibility of the energy planning results, and guide the technical implementation scheme so as to promote the research and development of energy technologies and provide a technical guarantee and feasibility for the sustainable development strategy of energy. In the case of limited time and energy, the study did not further verify the scope of application of the model, which requires further discussion by subsequent researchers. At the same time, personalized building energy planning models should be designed according to the characteristics of different regions to further improve the accuracy of the models.
6. Conclusions
In view of the low accuracy of the current energy planning model in the regional building energy planning, the network flow theory was applied to reconstruct and solve the model, and the following conclusions were drawn.
(1) The network flow theory is similar to the characteristics and solving problems of regional building energy planning. Hence, it can be introduced into regional building energy planning. When the training times are 20, compared with the belief propagation algorithm, the shortest path algorithm and the improved cooperative optimization algorithm, the error convergence value of BG algorithm decreases by 46.35%, 62.26%, and 76.58%, respectively; When the training batch size is 100/time, the error convergence value of BG algorithm decreases by 26.35%, 52.31%, and 89.36% respectively.
(2) The regional building energy planning model is divided into three layers: energy supply, energy conversion, and energy demand. The elements of each layer are connected by arcs according to the energy circulation, and each arc is assigned to capacity and cost. After applying the BG iterative algorithm, the cost of each category of the regional building energy planning model in summer shows a downward trend.
(3) The model can be solved by BG iteration method and its MATLAB program, and the solution is not a one-time process, but a process of calculation, analysis, optimization, and recalculation.
The physical model of regional building energy can realize reasonable resource allocation and meet the requirements of the overall energy cost in the region. Based on the global scope, the regional building energy planning model can be applied to any country or region in the world. It can not only accurately assess the energy use of the country or region, but also make a contribution to the construction of a world of energy conservation and environmental protection, as well as provide a support for the development of the regional economy. In the case of limited time and energy, the study did not further verify the scope of application of the model, which requires further discussion by subsequent researchers.
Author Contributions
Conceptualization, P.Z. and Y.Z.; methodology, P.Z. and Y.Z.; software, J.L. and Y.Z.; validation, Z.L. and J.L.; formal analysis, J.L.; investigation, Z.S. All authors have read and agreed to the published version of the manuscript.
Funding
This research received no external funding.
Institutional Review Board Statement
Not applicable.
Informed Consent Statement
Not applicable.
Data Availability Statement
The data used to support the findings of this study are available from the corresponding author upon request.
Conflicts of Interest
The authors declare that they have no competing interest.
Abbreviations
| Index | Abbreviation | Unit |
| Busacker Gowan | BG | / |
| Maximum flow | / | piece |
| Minimum cost | / | 100 million dollar |
| Accuracy, accuracy, recall rate and specificity | / | % |
| Power consumption | / | kWh |
| Load percentage | / | % |
| Time percentage | / | % |
| Grid power | / | / |
| Shallow geothermal layer | / | / |
| Solar energy | / | / |
| Split air conditioning | / | / |
| Multiple on-line | / | / |
| Ground source heat pump | / | / |
| Solar heater | / | / |
| Cooling of ordinary residential buildings | / | / |
| Domestic hot water | / | / |
References
- Perera, P.; Hewage, K.; Alam, M.S.; Merida, W.; Sadiq, R. Scenario-based economic and environmental analysis of clean energy incentives for households in Canada: Multi criteria decision making approach. J. Clean. Prod. 2018, 198, 170–186. [Google Scholar] [CrossRef]
- Wang, Y.; Yuan, Q. Morphological characteristics of rural settlements from morphogenesis perspective: A case study of rural settlements in Heilongjiang Province, China—ScienceDirect. Energy Procedia 2019, 157, 1266–1277. [Google Scholar] [CrossRef]
- Nam, H.R.; Kim, S.H.; Han, S.Y.; Lee, S.J.; Hong, W.H.; Kim, J.H. Statistical methodology for the definition of standard model for energy analysis of residential buildings in Korea. Energies 2020, 13, 5796. [Google Scholar] [CrossRef]
- Cao, B.; Yan, Y.; Wang, Y.; Liu, X.; Lin, J.C.-W.; Sangaiah, A.K.; Lv, Z. A multiobjective intelligent decision-making method for multistage placement of PMU in power grid enterprises. IEEE Trans. Ind. Inform. 2022, 1–9. [Google Scholar] [CrossRef]
- Downs, T.J.; Zimmerman, M.; Altonaga, N. Unlocking high sustainable energy potential in Zambia: An integrative collaborative project approach. J. Sustain. Dev. 2020, 13, 59–77. [Google Scholar] [CrossRef]
- Zhao, J.; Yuan, Y.; Haghighat, F.; Lu, J.; Feng, G. Investigation of energy performance and operational schemes of a Tibet-focused PCM-integrated solar heating system employing a dynamic energy simulation model. Energy 2019, 172, 141–154. [Google Scholar] [CrossRef]
- Li, G.; Tang, P.; Chen, X.; Xiao, G.; Meng, M.; Ma, C.; Shi, L. Target control and expandable target control of complex networks. J. Frankl. Inst. 2019, 357, 3541–3564. [Google Scholar] [CrossRef]
- Guo, Q.; Wang, X.G.; Yang, W.M.; Ma, Z.Y. A network flow based energy-efficient backhauling algorithm for mm-wave small cell networks. J. Comput. Sci. 2019, 30, 155–167. [Google Scholar]
- Chen, P.Z.; Pei, J.A.; Lu, W.Q.; Li, M.Z. A deep reinforcement learning based method for real-time path planning and dynamic obstacle avoidance. Neurocomputing 2022, 497, 64–75. [Google Scholar] [CrossRef]
- Boykov, Y.; Kolmogorov, V. An experimental comparison of min-cut/max-flow algorithms for energy minimization in vision. IEEE Trans. Pattern Anal. Mach. Intell. 2004, 26, 1124–1137. [Google Scholar] [CrossRef]
- Mamo, G.E.; Marence, M.; Hurtado, J.; Franca, M.J. Optimization of run-of-river hydropower plant capacity. Dam Eng. 2018, 29, 29–39. [Google Scholar]
- Wang, J.; Meng, Q.; Zou, Y.; Qi, Q.; Tan, K.; Santamouris, M.; He, B.-J. Performance synergism of pervious pavement on stormwater management and urban heat island mitigation: A review of its benefits, key parameters, and co-benefits approach. Water Res. 2022, 221, 118755. [Google Scholar] [CrossRef] [PubMed]
- Sathaporn, O.; Elise, M.H. Noisy genetic algorithm for stochastic, time-varying minimum time network flow problem. Transp. Res. Rec. J. Transp. Res. Board 2010, 2196, 75–82. [Google Scholar]
- Mamo, G.E.; Marence, M.; Hurtado, J.; Franca, M.J. Development of wood pellets processing industry for renewable energy. IOP Conf. Ser. Earth Environ. Sci. 2020, 487, 012014–012124. [Google Scholar]
- Petrichenko, K.; Urge-Vorsatz, D.; Cabeza, L.F. Modeling global and regional potentials for building-integrated solar energy generation. Energy Build. 2019, 198, 329–339. [Google Scholar] [CrossRef]
- Chen, S.; Liu, P.; Li, Z. Multi-regional power generation expansion planning with air pollutants emission constraints. Renew. Sustain. Energy Rev. 2019, 112, 382–394. [Google Scholar] [CrossRef]
- Wang, J.J.; Jing, Y.Y.; Zhang, C.F.; Zhang, X.T.; Shi, G.H. Integrated evaluation of distributed triple-generation systems using improved grey incidence approach. Energy 2008, 33, 1427–1437. [Google Scholar] [CrossRef]
- Kalogirou, S.A. Seawater desalination using renewable energy sources. Prog. Energy Combust. Sci. 2005, 31, 242–281. [Google Scholar] [CrossRef]
- Seo, Y.; Lee, H.; Na, H.S. Automatic multi-drone path planning using network flow algorithms. J. Inst. Control 2019, 25, 303–311. [Google Scholar]
- Valickova, P.; Elms, N. Potential gains from regional integration to reduce costs of electricity supply and access in Southern Africa. Energy Sustain. Dev. 2021, 62, 82–100. [Google Scholar] [CrossRef]
- Kalua, A. Urban residential building energy consumption by end-use in Malawi. Buildings 2020, 10, 31. [Google Scholar] [CrossRef]
- Shao, Z.T.; Zhai, Q.Z.; Han, Z.H.; Guan, X.H. A linear AC unit commitment formulation: An application of data-driven linear power flow model. Int. J. Electr. Power Energy Syst. 2023, 145, 108673. [Google Scholar] [CrossRef]
- Taylor, Z.T.; Xie, Y.; Burleyson, C.D.; Voisin, N.; Kraucunas, I. A multi-scale calibration approach for process-oriented aggregated building energy demand models. Energy Build. 2019, 191, 82–94. [Google Scholar] [CrossRef]
- Wang, A.; Li, R.; You, S. Development of a data driven approach to explore the energy flexibility potential of building clusters. Appl. Energy 2018, 232, 89–100. [Google Scholar] [CrossRef]
- Gliesch, A.; Ritt, M. A hybrid heuristic for the maximum dispersion problem. Eur. J. Oper. Res. 2020, 288, 721–735. [Google Scholar] [CrossRef]
- Tarroja, B.; Shaffer, B.P.; Samuelsen, S. Resource portfolio design considerations for materially-efficient planning of 100% renewable electricity systems. Energy 2018, 157, 460–471. [Google Scholar] [CrossRef]
- Song, S.; Li, Z.; Liu, Y.; Bai, Z. Research on abundance adaptive frequency control strategy of household temperature-control load. J. Phys. Conf. Ser. 2020, 1449, 012085–012093. [Google Scholar] [CrossRef]
- Du, L.; Song, G.; Wang, Y.; Huang, J.; Ruan, M.; Yu, Z. Traffic events oriented dynamic traffic assignment model for expressway network: A network flow approach. IEEE Intell. Transp. Syst. Mag. 2018, 10, 107–120. [Google Scholar] [CrossRef]
- He, K.; Wang, D.; Wang, B.; Feng, B.; Li, C. Foreground extraction combining graph cut and histogram shape analysis. IEEE Access 2019, 7, 176248–176256. [Google Scholar] [CrossRef]
- Nesticò, A.; Elia, C.; Naddeo, V. Sustainability of urban regeneration projects: Novel selection model based on analytic network process and zero-one goal programming. Land Use Policy 2020, 99, 104831. [Google Scholar] [CrossRef]
Disclaimer/Publisher’s Note: The statements, opinions and data contained in all publications are solely those of the individual author(s) and contributor(s) and not of MDPI and/or the editor(s). MDPI and/or the editor(s) disclaim responsibility for any injury to people or property resulting from any ideas, methods, instructions or products referred to in the content. |
© 2022 by the authors. Licensee MDPI, Basel, Switzerland. This article is an open access article distributed under the terms and conditions of the Creative Commons Attribution (CC BY) license (https://creativecommons.org/licenses/by/4.0/).