Article

Omega Phase Formation and Mechanical Properties of Ti–1.5 wt.% Mo and Ti–15 wt.% Mo Alloys after High-Pressure Torsion

by
Alena S. Gornakova
1,*,
Anna Korneva
2,
Alexander I. Tyurin
3,
Natalia S. Afonikova
1,
Askar R. Kilmametov
1 and
Boris B. Straumal
1
1
Osipyan Institute of Solid State Physics of the Russian Academy of Sciences, Ac. Osipyan Str. 2, 142432 Chernogolovka, Russia
2
Institute of Metallurgy and Materials Science Polish Academy of Sciences, Reymonta Str. 25, 30-059 Cracow, Poland
3
G.R. Derzhavin Research Institute “Nanotechnologies and Nanomaterials” TSU, Internazionalnaja Str. 30, 392000 Tambov, Russia
*
Author to whom correspondence should be addressed.
Processes 2023, 11(1), 221; https://doi.org/10.3390/pr11010221
Submission received: 7 December 2022 / Revised: 22 December 2022 / Accepted: 6 January 2023 / Published: 10 January 2023
(This article belongs to the Special Issue Recent Advances in Functional Materials Manufacturing and Processing)

Abstract

:
The paper analyzes the effect of severe plastic deformation by the high-pressure torsion (HPT) on phase transformations, in particular, on the formation of the ω-phase, and on mechanical properties, such as hardness and Young’s modulus, in Ti alloys with 1.5 and 15 wt.% Mo. Both alloys were pre-annealed at 1000 °C for 24 h and quenched. The microstructure of the initial Ti–1.5 wt.% Mo alloy consisted of the α-phase and α’-martensite, and the initial Ti–15 wt.% Mo alloy contained polycrystalline β solid solution. The hardness tests of the samples were carried out under the load of 10 and 200 mN. The annealed alloys were subjected to HPT, and the micro- and nanohardness of both deformed samples increased up to ~1 GPa compared to their initial state. It turned out that the values of hardness (H) and Young’s modulus (E) depend on the applied load on the indenter: the higher the applied load, the lower H and higher E. It was also found that the HPT leads to the 30% increase in E for an alloy with 1.5 wt.% Mo and to the 9% decrease in E for the alloy with 15 wt.% Mo. Such a difference in the behavior of the Young’s modulus is associated with phase transformations caused by the HPT.

1. Introduction

Currently, titanium alloys have a wide range of applications from mechanical engineering to biomedicine, all because of the combination of the unique mechanical characteristics and good biocompatibility of titanium. Despite the wide range of applications of titanium alloys as bone and dental implants, they have a limited service life and imperfect biocompatibility [1,2,3]. Currently, the leaders of titanium alloys in biomedical applications are Ti4V6Al, stainless steel, CoCrMo, and TiNi alloys [4,5,6]. However, some alloying elements, including vanadium and nickel, can have a serious long-term negative effect due to the release of metal ions [7]. Another disadvantage is the difference in the elasticity modules of the implant and the host bone, which can lead to bone resorption and, as a result, the failure of the prosthesis. Therefore, alloying elements have been gaining more and more interest lately: non-toxic, non-allergenic, and providing the stabilization of the phase with a lower modulus of elasticity, one of which is molybdenum [8,9,10].
Asl et al. observed on a series of Ti–Mo alloys manufactured by the spark plasma sintering of pure powders that the maximum hardness is reached at 16 wt.% Mo [1]. With the help of nanoindentation, it was found that the hardest (β-phase) and the softest (α-phase) belong to a sample with 12 wt.% Mo. Cast Ti–Mo alloys prepared from high-purity powders contained three phases, namely α’ (martensite), β, and ω, in various combinations [2]. The hardness and yield strength of the studied Ti–Mo alloys decreased with an increase in the molybdenum content, while the modulus of elasticity increased. Verestyuk et al. succeeded in achieving a significant improvement in mechanical properties, i.e., they lowered the elasticity modulus and hardness of the Ti–15 wt.% Mo alloy by adding one percent of silicon [3]. They managed to achieve positive bone remodeling in the vicinity of the periosteum and the implant area. This alloy has shown good biocompatibility and has become one of the likely candidates for new orthopedic implants. In [11], the Ti–10 wt.% Mo alloy was investigated with various additions of copper. The Vickers microhardness measurements showed that the alloys harden with an increase in the copper content. In [12], Mohan et al. added 6 wt.% Zr to the Ti–(12–15) wt.% Mo alloys, and observed the strength increase of 8% (from 283 to 308 HV) and 4% (from 309 to 322 HV), respectively. The elasticity modulus decreased from 104 to 103 GPa with an increase in the molybdenum content from 12 to 15%; the addition of zirconium leads to an even greater decrease in elasticity from 102 to 98 GPa [12].
From the above literature review, it can be seen that titanium–molybdenum-based alloys have the potential for application in medicine, and the difference in the starting materials and methods of processing alloys gives a different combination of hardness and Young’s modulus. In our work, we use the levitation melting method, heat treatment, and the high-pressure torsion (HPT) method for the preparation of the alloy, which is a promising method for the mechanical processing of materials. HPT causes such deformations that the material becomes extremely enriched with a high density of defects, such as grain boundaries, dislocation fragments, vacancies, etc. The continuous compression mode in combination with torsion in the Bridgman cell enhances also the strain-driven diffusion [13].
HPT in combination with heat treatment expands the capabilities of titanium alloys and areas of their applications, since they allow one to control the phase transformations [14]. It is known that the phase composition, microstructure, and mechanical properties of alloys after HPT are affected by the applied pressure [15], the temperature during deformation [16], impurities [17,18], the number of anvil revolutions [17,19], the rotation speed [20], as well as the orientation of the grains in the starting material [19].
The aim of this work is to investigate the influence of the method of alloy manufacturing, the content of the second component (molybdenum), heat treatment, and, in particular, HPT treatment on the phases and microstructure, as well as the mechanical properties of titanium–molybdenum alloys.
Further, in Section 2Section aSection detailedSection descriptionSection ofSection theSection studiedSection alloys and Section theSection methodsSection usedSection forSection theirSection investigationSection isSection presented.Section 3 shows the microstructures, the phase composition of the samples before and after the HPT, and the results of indentation. In Section 4, we describe the data obtained and compare it with those previously presented in the literature.

2. Materials and Methods

2.1. Materials

Two binary titanium alloys Ti–1.5 wt.% Mo (98.3 ± 1.1 wt.% Ti, 1.7 ± 0.5 wt.% Mo) and Ti–15wt.% Mo (85.3 ± 1.09 wt.% Ti, 14.7 ± 0.9 wt.% Mo) were melted in the form of cylindrical ingots with a diameter of 10 mm, in an induction furnace by levitation melting in an atmosphere of pure argon. For the preparation of alloys, Ti-I (iodide titanium 99.98 wt.%) and molybdenum (99.97 wt.%) were used. The 0.7 mm thick discs were cut off from the ingot. After removing the deformed surface layer with grinding paper, the samples were annealed in evacuated quartz ampoules, with residual pressure about 4 × 10⁻⁴ Pa. Four samples were annealed in a single-phase region (βTi, Mo) at 1000 °C for 24 h.

2.2. Methods

The component analysis was carried out on a scanning electron microscope Tescan Vega TS 5130 MM, equipped with an energy-dispersion spectrometer LINK (Oxford Instruments) (SEM). The analysis of the ingots showed their structural and chemical uniformity in cross-section and length. After annealing, the samples were quenched in water. Further, the annealed samples were subjected to HPT at room temperature: 5 revolutions of the plunger under pressure of 7 GPa at a rotation speed of 1 revolution per minute, in a Bridgman anvil-type computer-controlled machine manufactured by W. Klement GmbH, Lang, Austria. After the HPT, the thickness of the samples was 0.35 mm. Measurements of micro- and nanohardness of the sample surface were carried out on the TI-950 Triboindenter equipped with a Berkovich indenter. Measurements were carried out along the diameter of the samples; the loading rate was constant and equal to dP/dt = 40 mN/s. Before the measurements, the surface of the samples was polished on a diamond paste with a grain size of 1 microns. Numerical values of hardness (H) and Young’s modulus (E) of the studied samples were determined using the Oliver–Farr method based on characteristic P-h diagrams [21,22,23]. The microstructure of the samples after annealing and HPT was taken using a FEI ESEM XL30 (Hillsboro, OR, USA) scanning electron microscope (SEM) equipped with an EDAX Genesis EDS spectrometer. The backscattered electron (BSE) mode was used to obtain the phase contrast. X-ray diffractograms obtained using a Siemens D-500 X-ray diffractometer were used for structural-phase analysis of samples. The study was conducted in Cu-Kα radiation. The phase analysis and calculation of the lattice parameters were carried out using the PowderCell program for MS Windows V. 2.4.08.03.2000.

3. Results

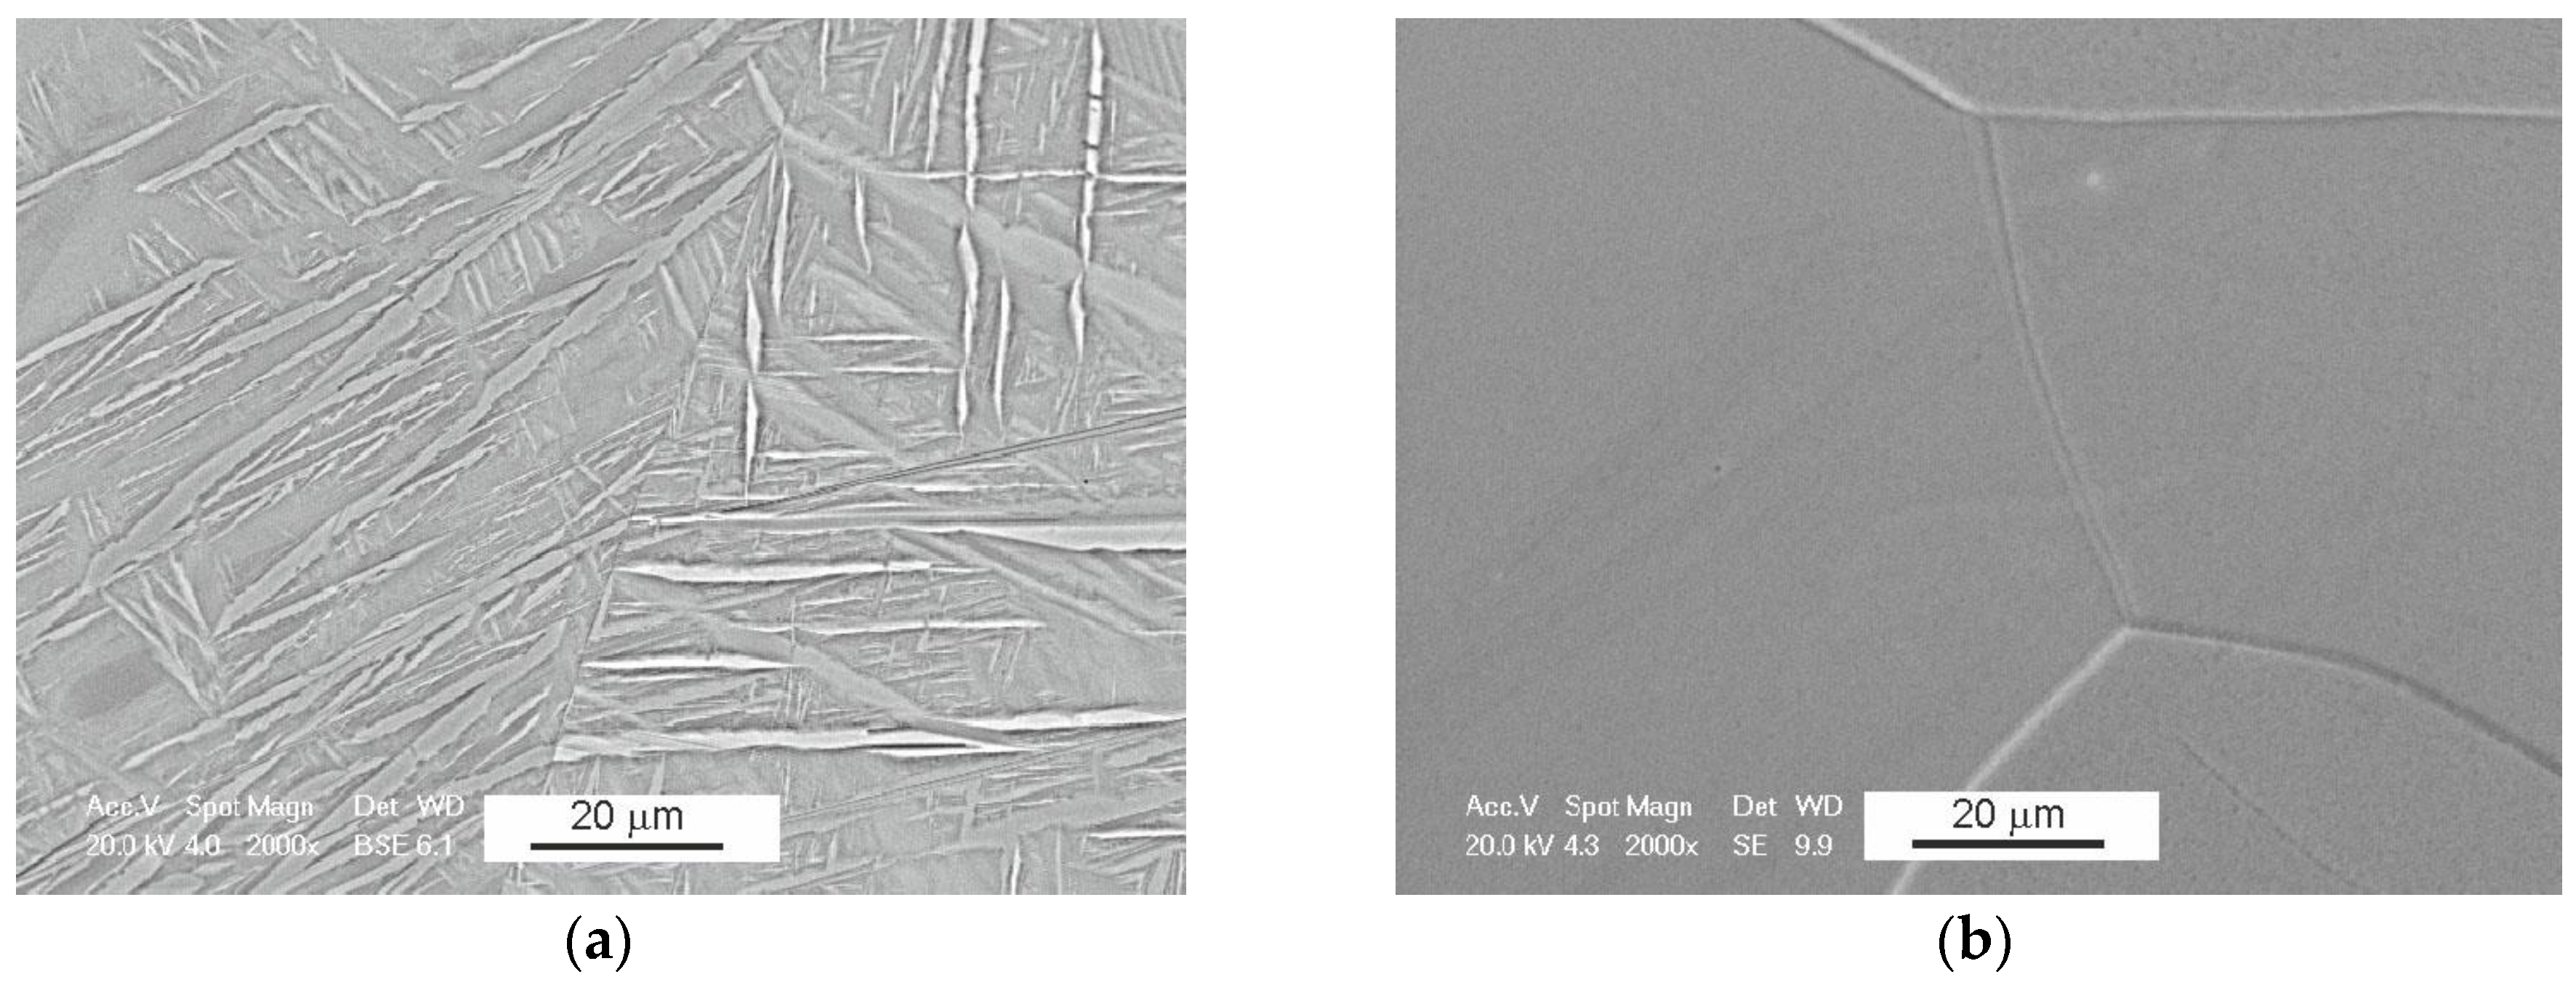
3.1. Microstructure and Phase Composition of Samples after Annealing

Figure 1 shows the microstructure of Ti–1.5 wt.% Mo and Ti–15 wt.% Mo alloy samples obtained after annealing at a temperature of 1000 °C and quenching. Annealed samples have a coarse-crystalline structure with grains elongated from the center to the edge (grain size ~200 μm); such a microstructure is formed during the casting of an alloy ingot. A titanium alloy with a content of 1.5 wt.% Mo has a martensitic structure as in [13] (Figure 1a), and an alloy with a content of 15 wt.% Mo possesses the polycrystalline single-phase microstructure of β solid solution (Figure 1b). The presence of these phases in the studied alloys was confirmed by X-ray phase analysis.
Table 1 presents the data of X-ray phase analysis: lattice parameters and the fraction of phases for samples after annealing. The samples are of interest because after annealing, only one phase is present in them (α′Ti) in Ti–1.5 wt.% Mo and (βTi) in Ti–15 wt.% Mo, i.e., conducting further mechanical tests for micro/nanohardness and modulus of elasticity, we will say that these properties manifest this phase in this alloy.
In pure titanium, only the α-phase is present. The addition of a β-stabilizer to molybdenum leads to the formation of a β-phase in the Ti–15 wt.% Mo alloy. The addition of 1.5 wt.% Mo to titanium leads to a slight change in the lattice parameters, namely, to the increase of a by 0.0005 nm and decrease of c by 0.001 nm. Most likely, this is due to the fact that we have two faintly distinguishable phases α’ and α.

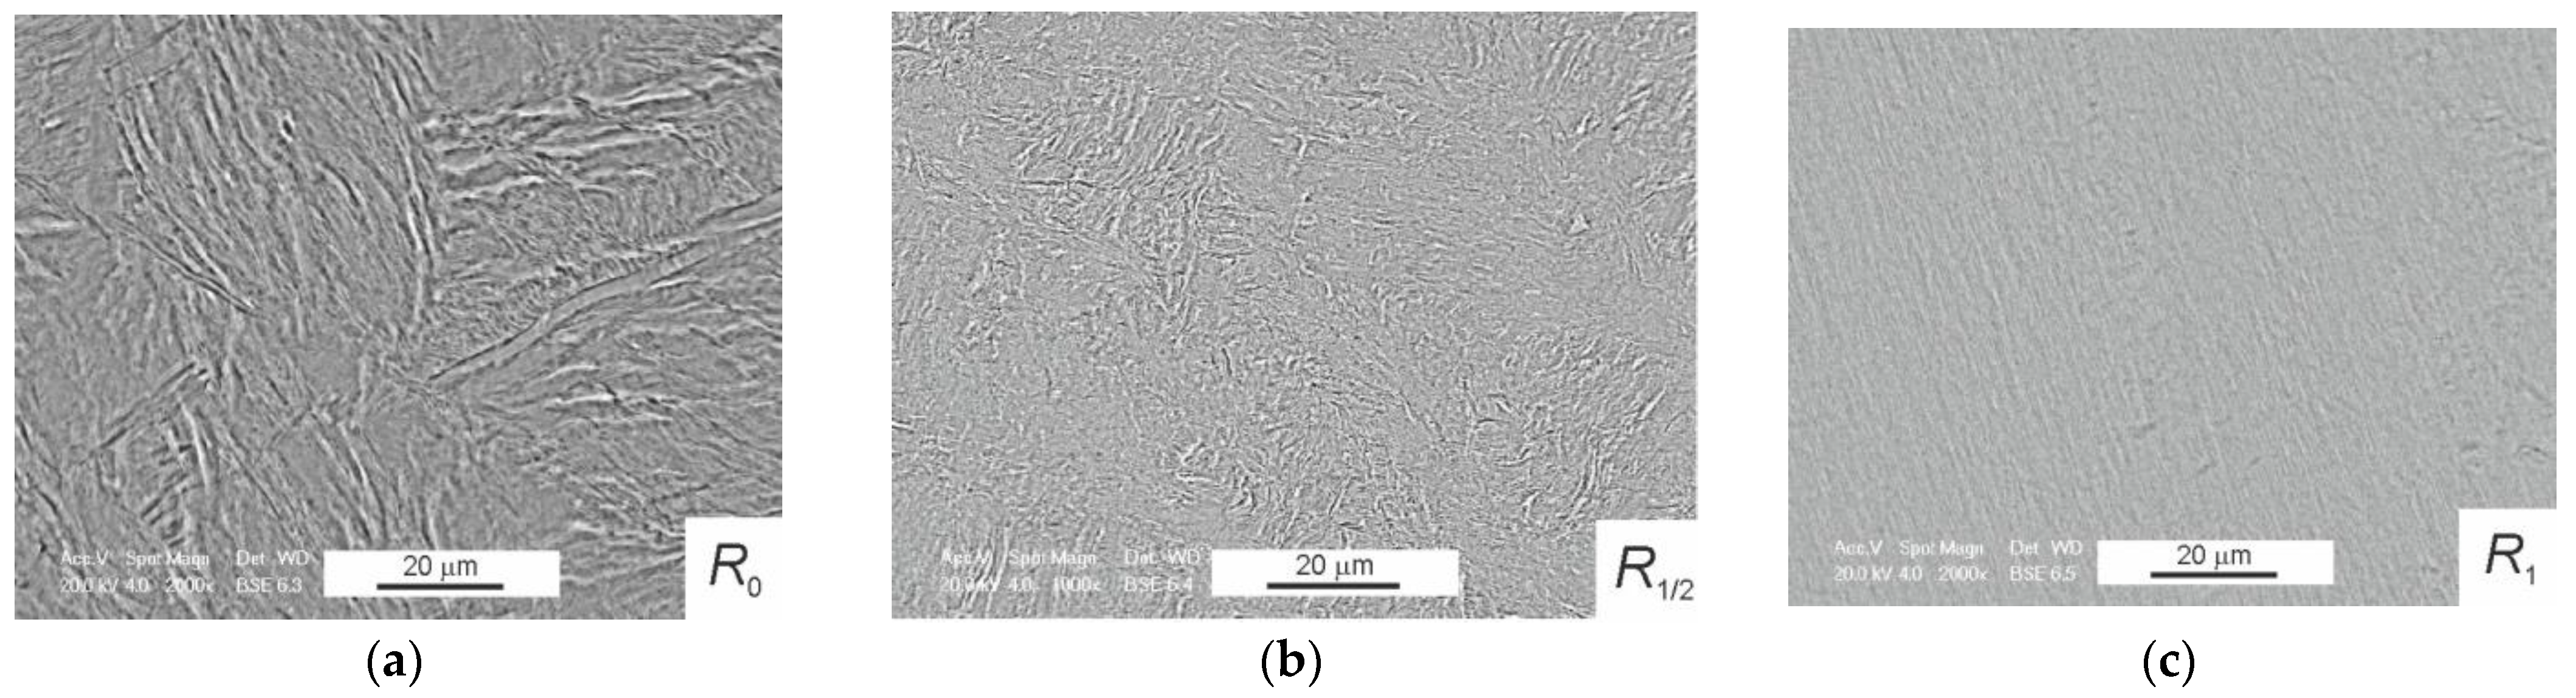
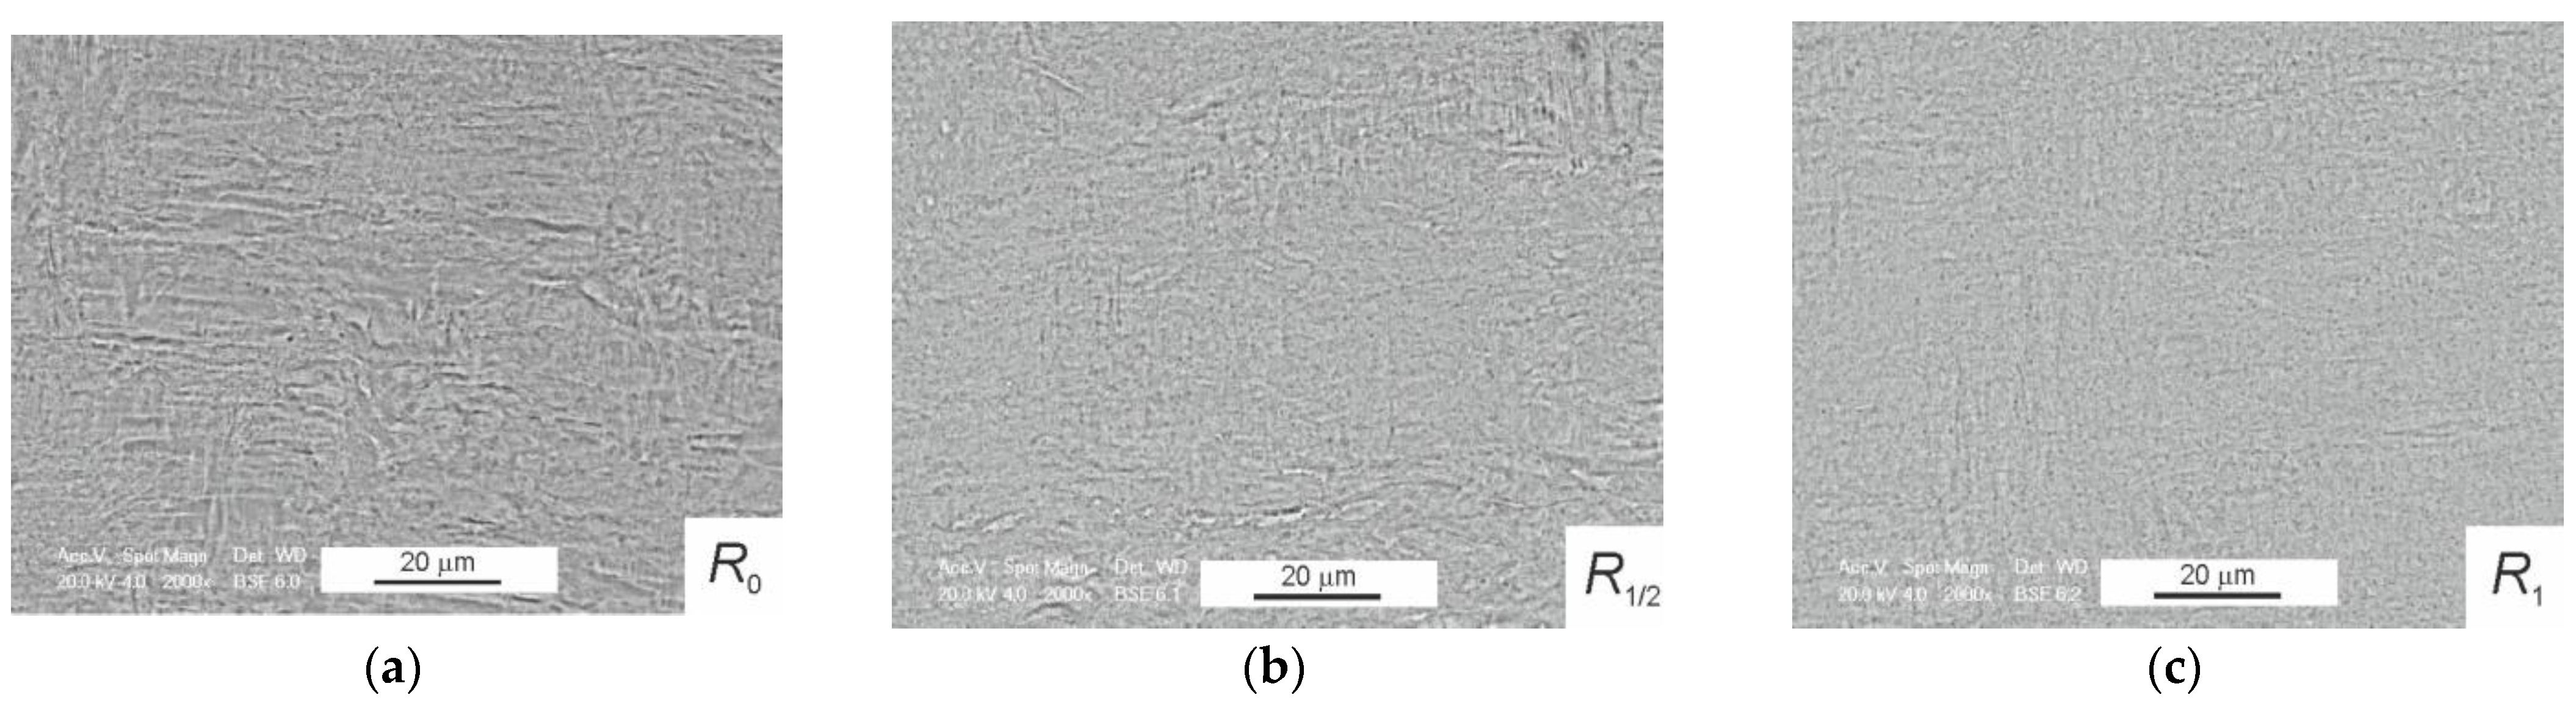
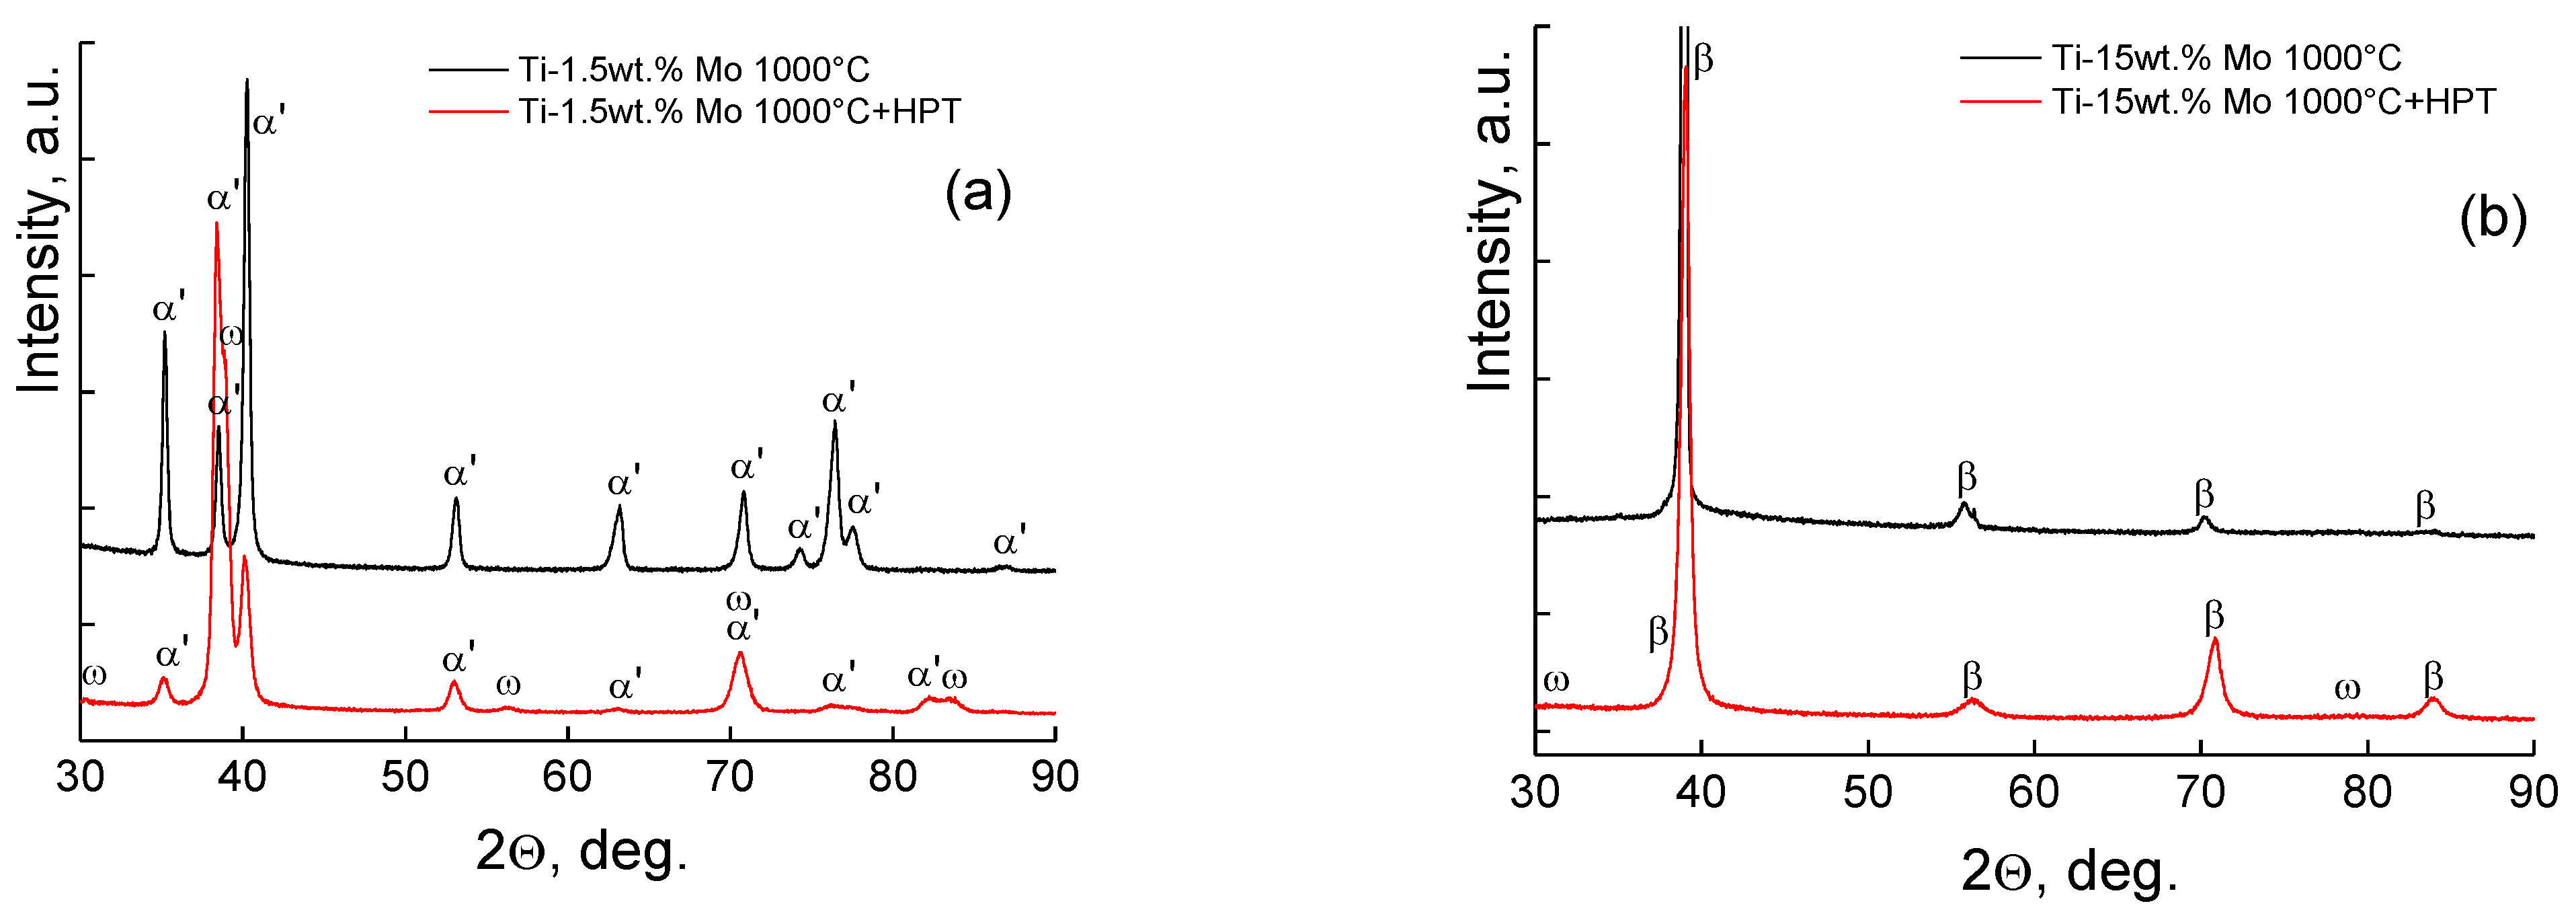
3.2. Microstructure and Phase Composition of Samples after Annealing and HPT

Figure 2 and Figure 3 show SEM micrographs of Ti–1.5 wt.% Mo and Ti–15 wt.% Mo alloys after the HPT, for the samples cut from the central part (Figure 2a and Figure 3a), the middle of the radius (Figure 2b and Figure 3b), and the edge of the samples (Figure 2c and Figure 3c). It can be noticed that the microstructure of the deformable Ti–1.5 wt.% Mo alloy (Figure 2) along the radius is inhomogeneous. In the central part of the sample (Figure 2a), where the deformation proceeds weakly, partially destroyed martensite plates can be seen, while on the periphery of the sample, in the place of more severe plastic deformation (Figure 2c), the microstructure is homogeneous, and only weakly expressed microstructure elements in the form of thin strips oriented in the direction of torsion are visible.
The deformation of the large-crystal Ti–15 wt.% Mo alloy with β-phase passed more evenly along the radius of the sample (Figure 3). In addition, if in Figure 3a one can still see “large” microstructural defects, in Figure 3c, there is an almost uniform grey field.
Figure 4 shows the XRD patterns of samples before and after the HPT: the black curves correspond to the states after annealing, and the red curves to those after HPT. HPT leads to a broadening of peaks and to the decrease in their intensity. In addition, HPT leads to the α′ → ω phase transition in the Ti–1.5 wt.% Mo alloy and to the β → ω transformation in the Ti–15 wt.% Mo alloy. Table 2 presents data on the volume fraction of phases, lattice parameters, and the average grain size of the phases after HPT. Note that the volume fraction of the ω phase in the Ti–15 wt.% Mo alloy is small; therefore, the peak intensities of this phase are small too.
Analysis of the lattice parameters from Table 1 and Table 2 showed that after the HPT, the parameters c and a for (α′Ti) and (βTi), respectively, increase by 0.0006 nm; therefore, the free volume in the lattices increased.
After HPT, two phases α and ω are formed in pure titanium; a similar situation is observed with the addition of 1.5 wt.% Mo. The difference in the lattice parameters for the α-phase between pure Ti and Ti–1.5 wt.% Mo alloy is insignificant. However, for the ω-phase, we observe a significant discrepancy: both lattice parameters increase, namely, a by 0.0025 nm and c by 0.0006 nm. It is because the Mo solubility in α-phase is low, while in the ω-phase, it is quite high. As a result, the additional Mo solves in the ω-phase, and its lattice parameter changes stronger than that of α-phase. At the same time, comparing the data from Table 1 and Table 2, we see that the HPT leads to an increase in the lattice parameters.

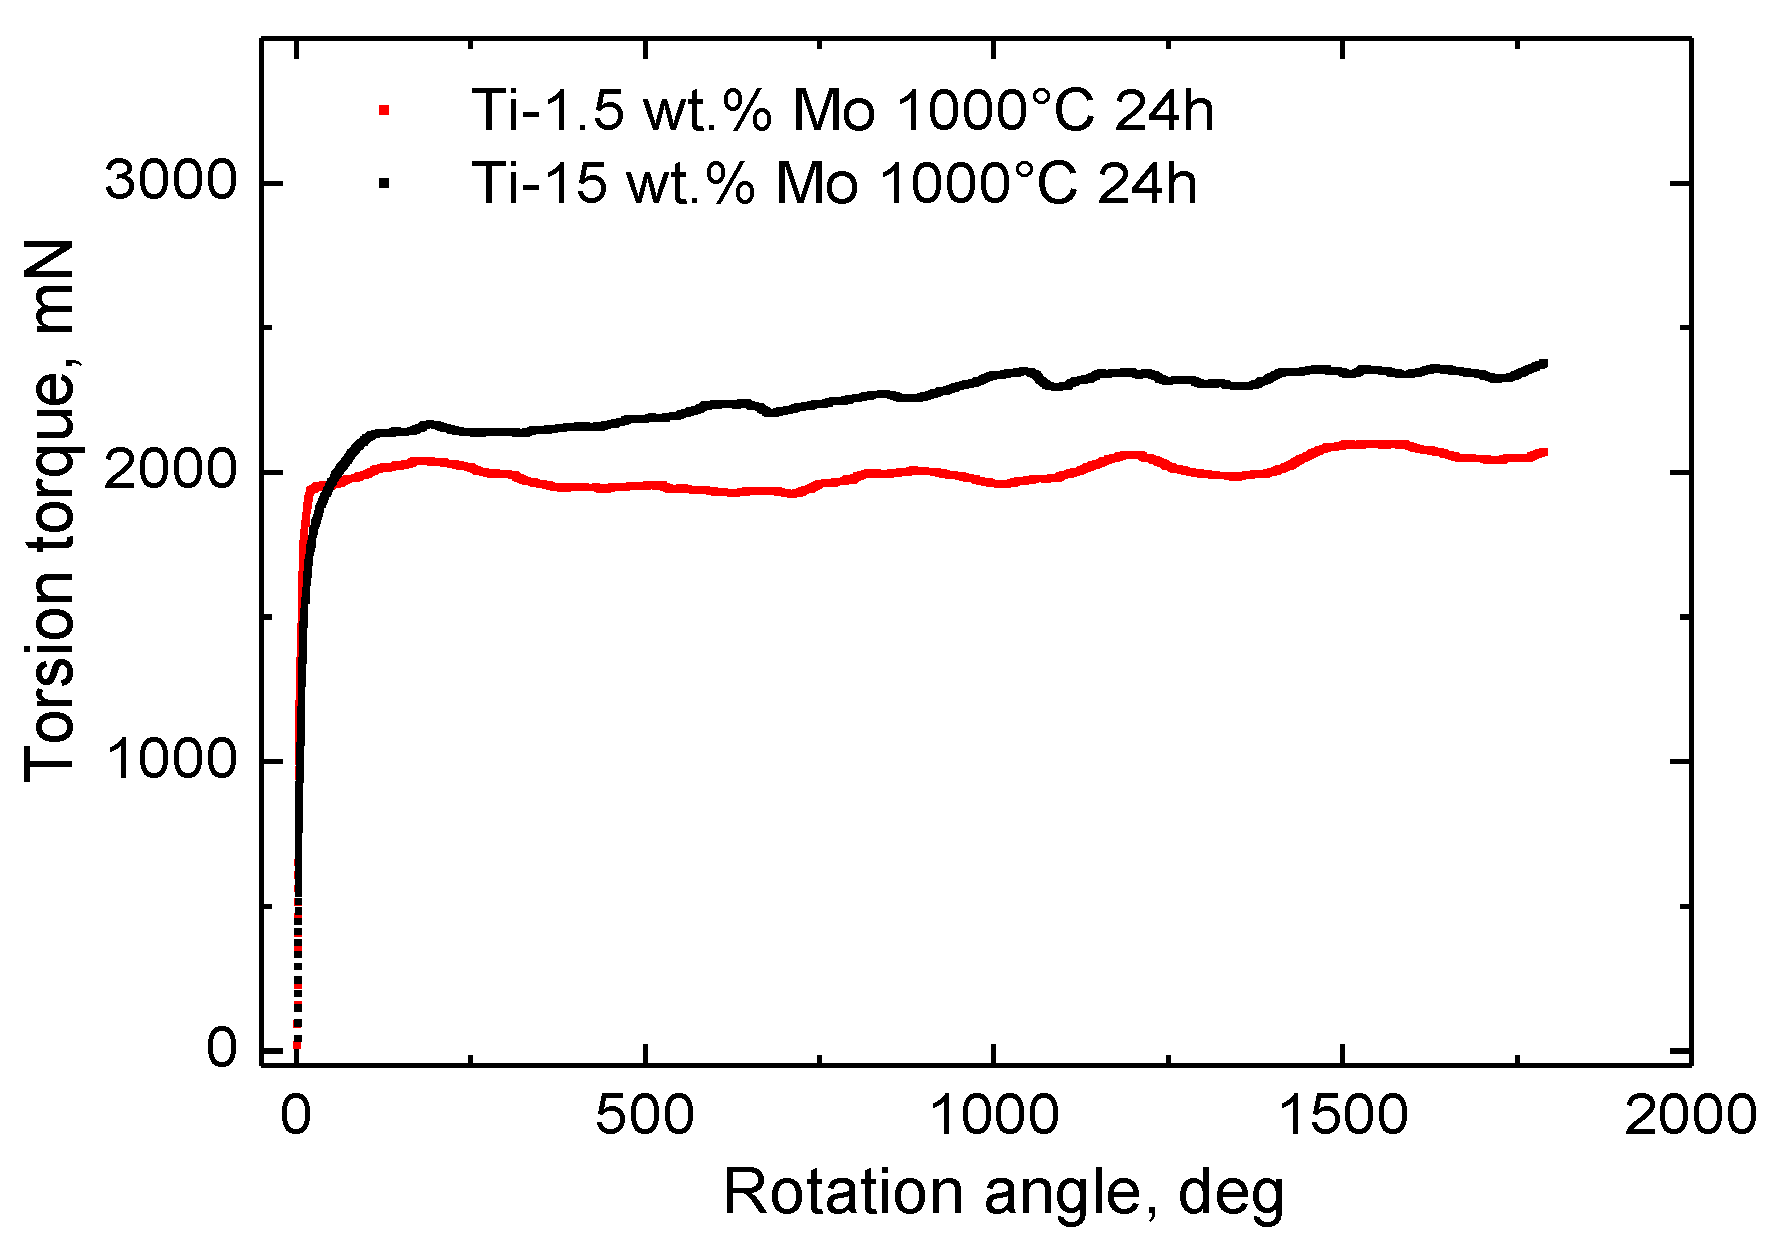
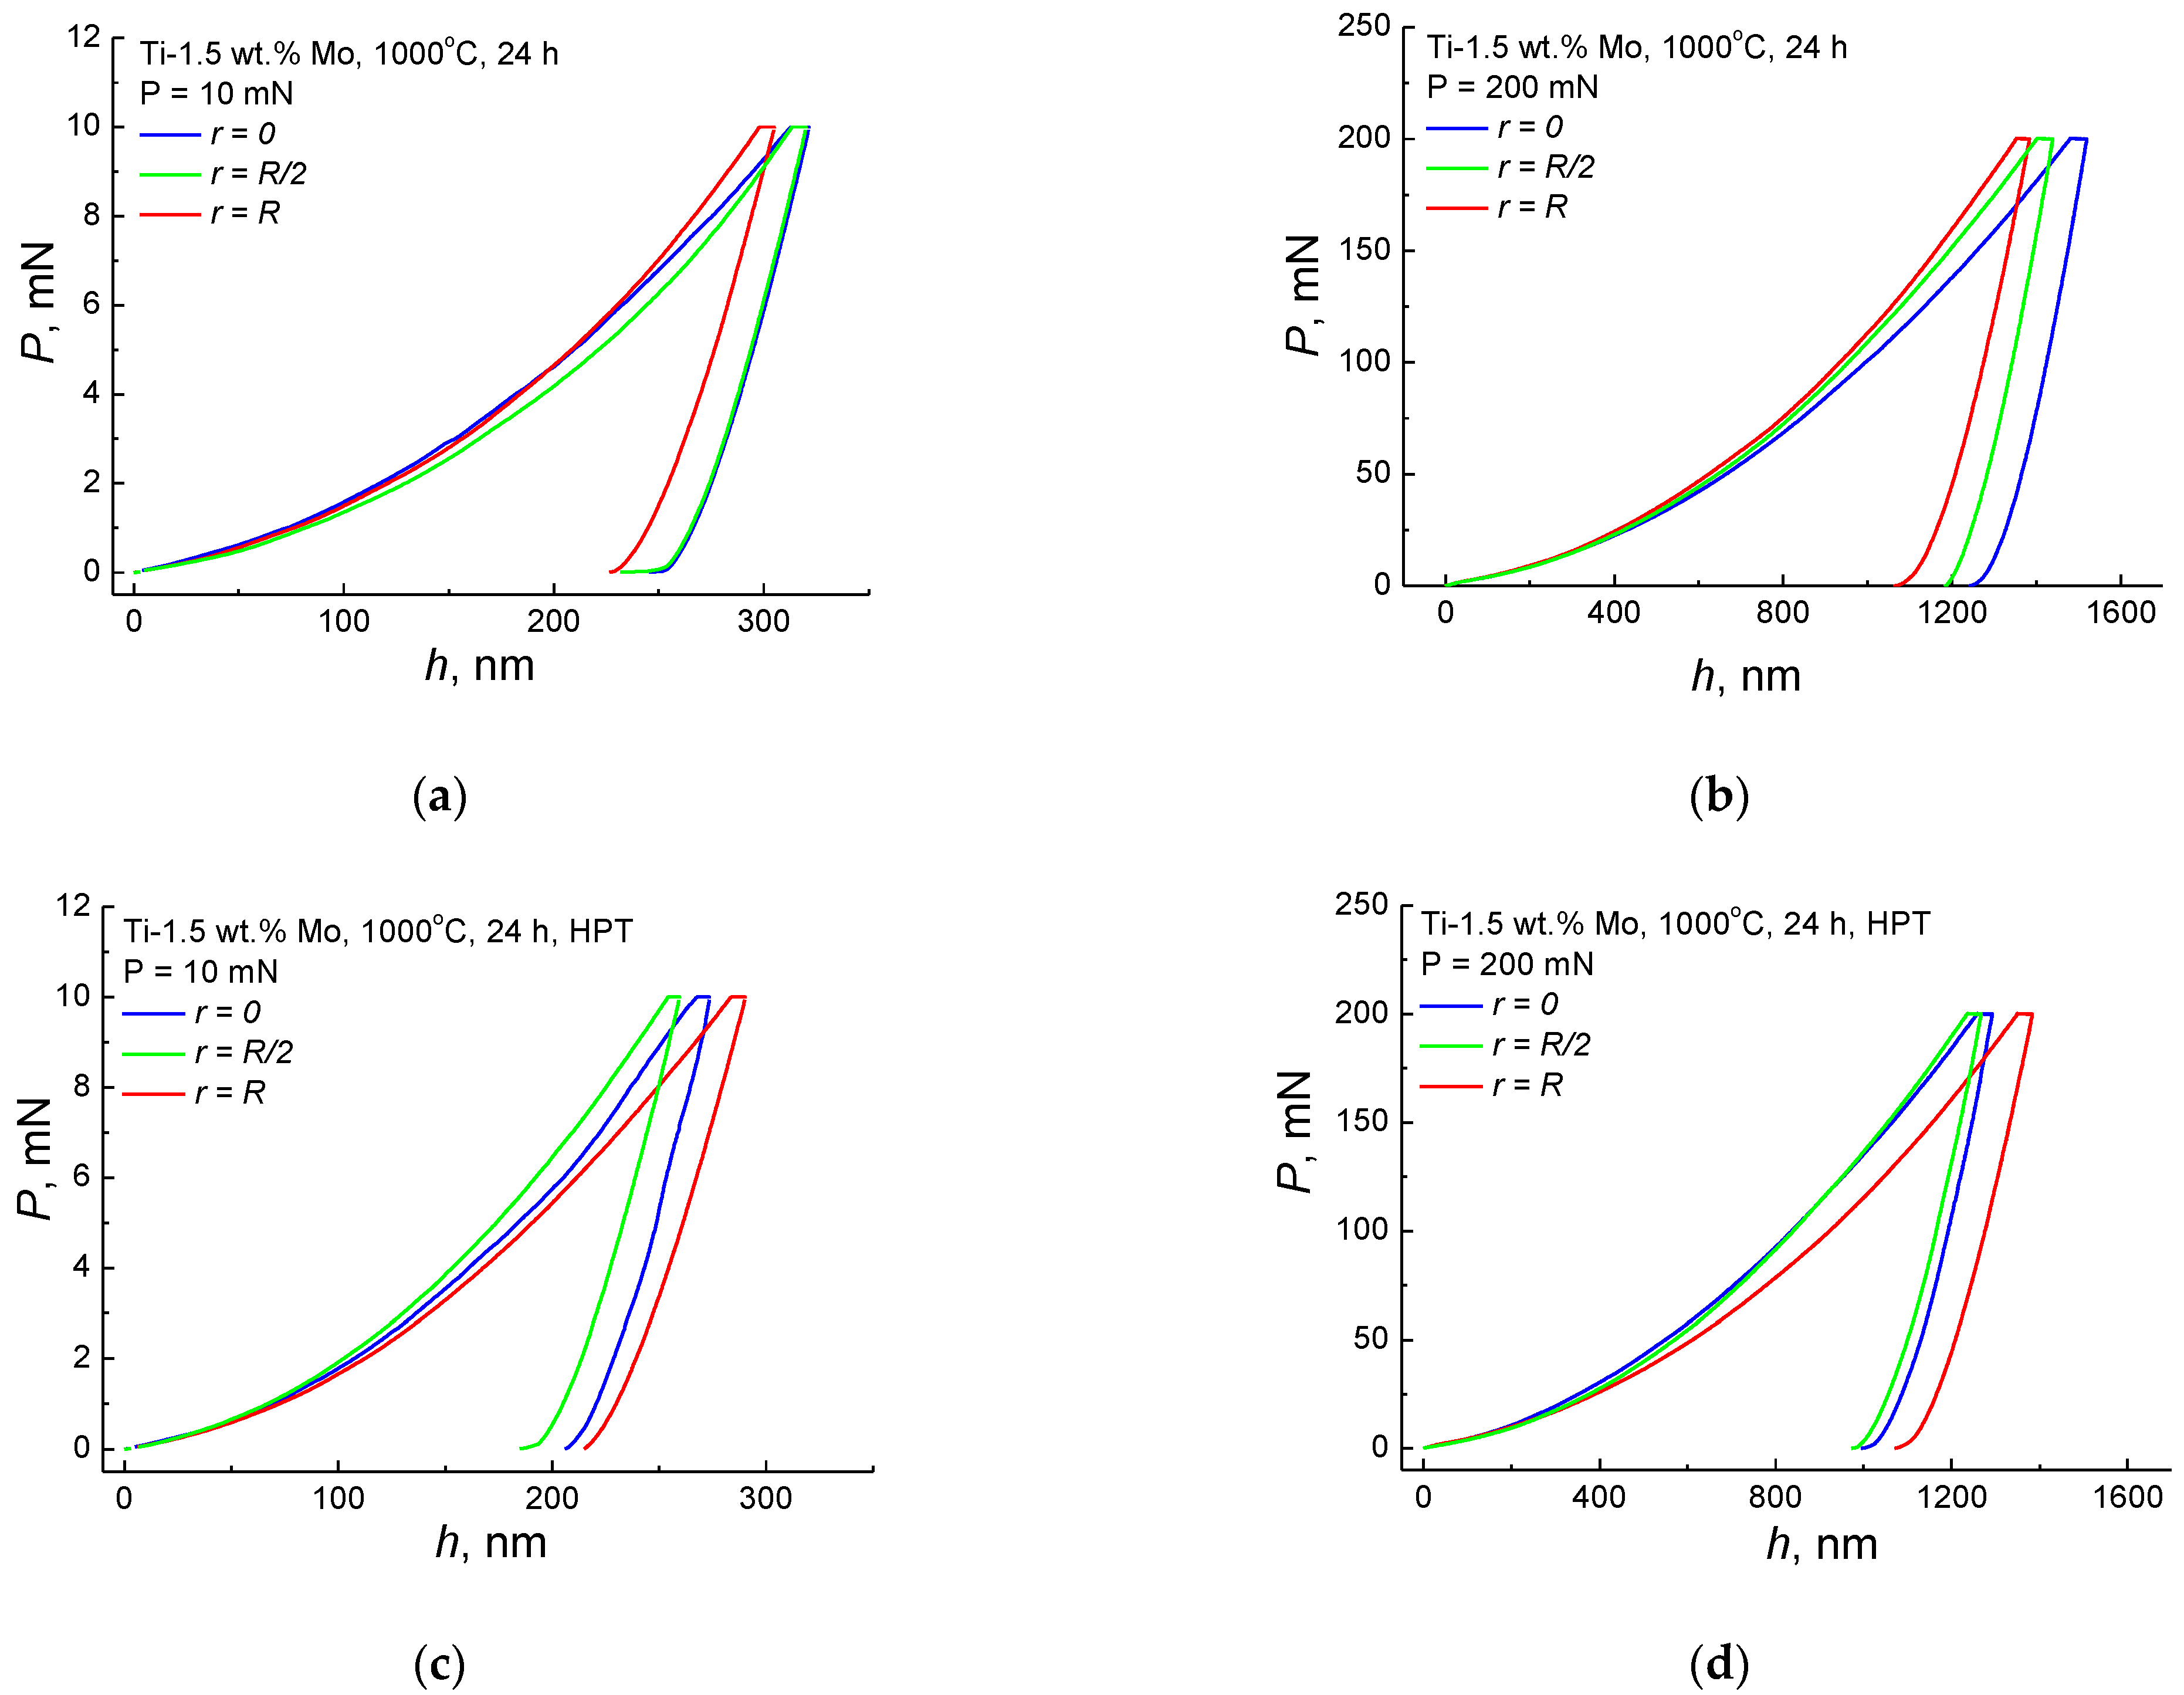
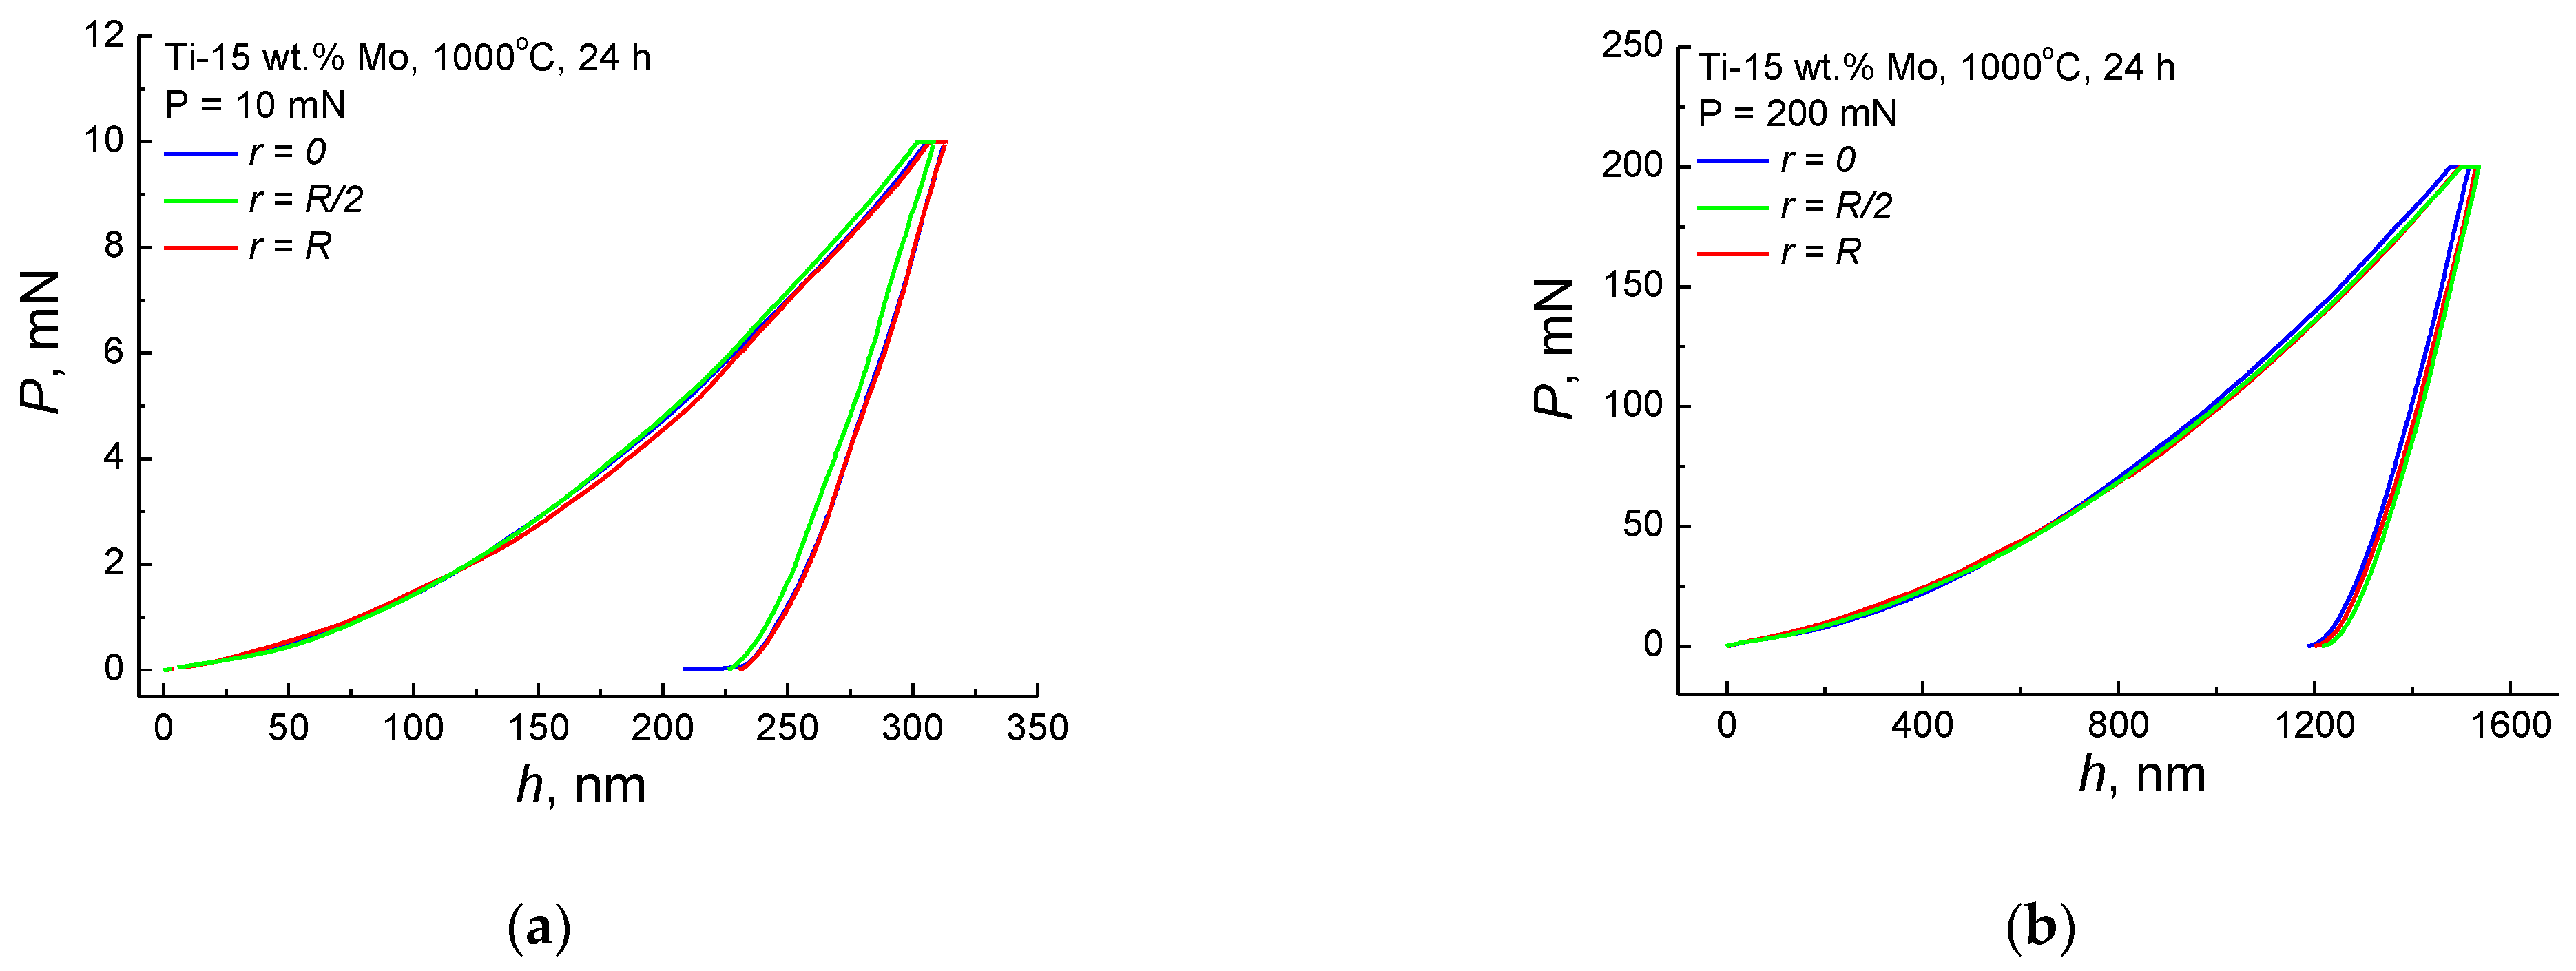
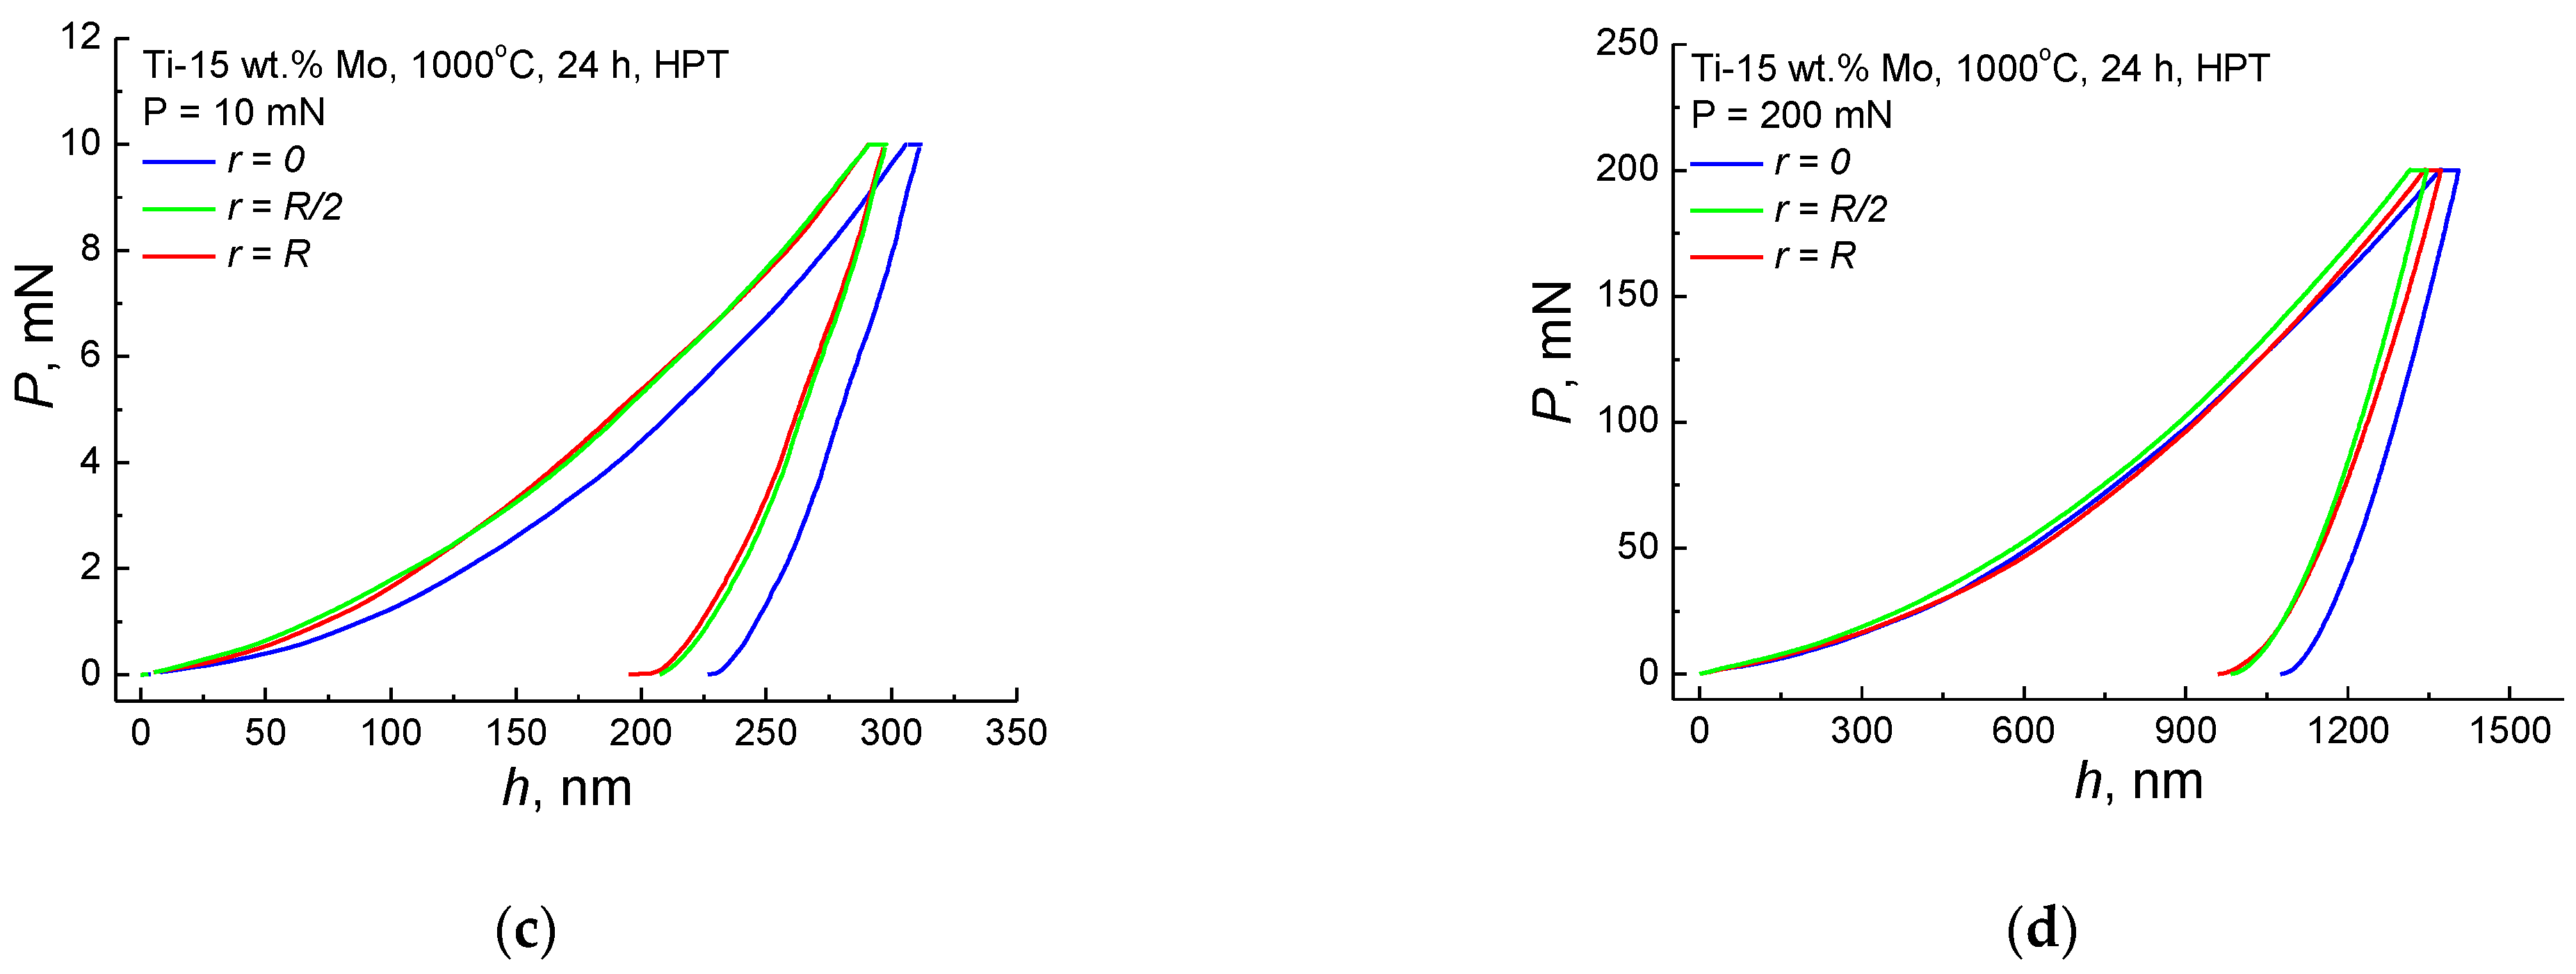
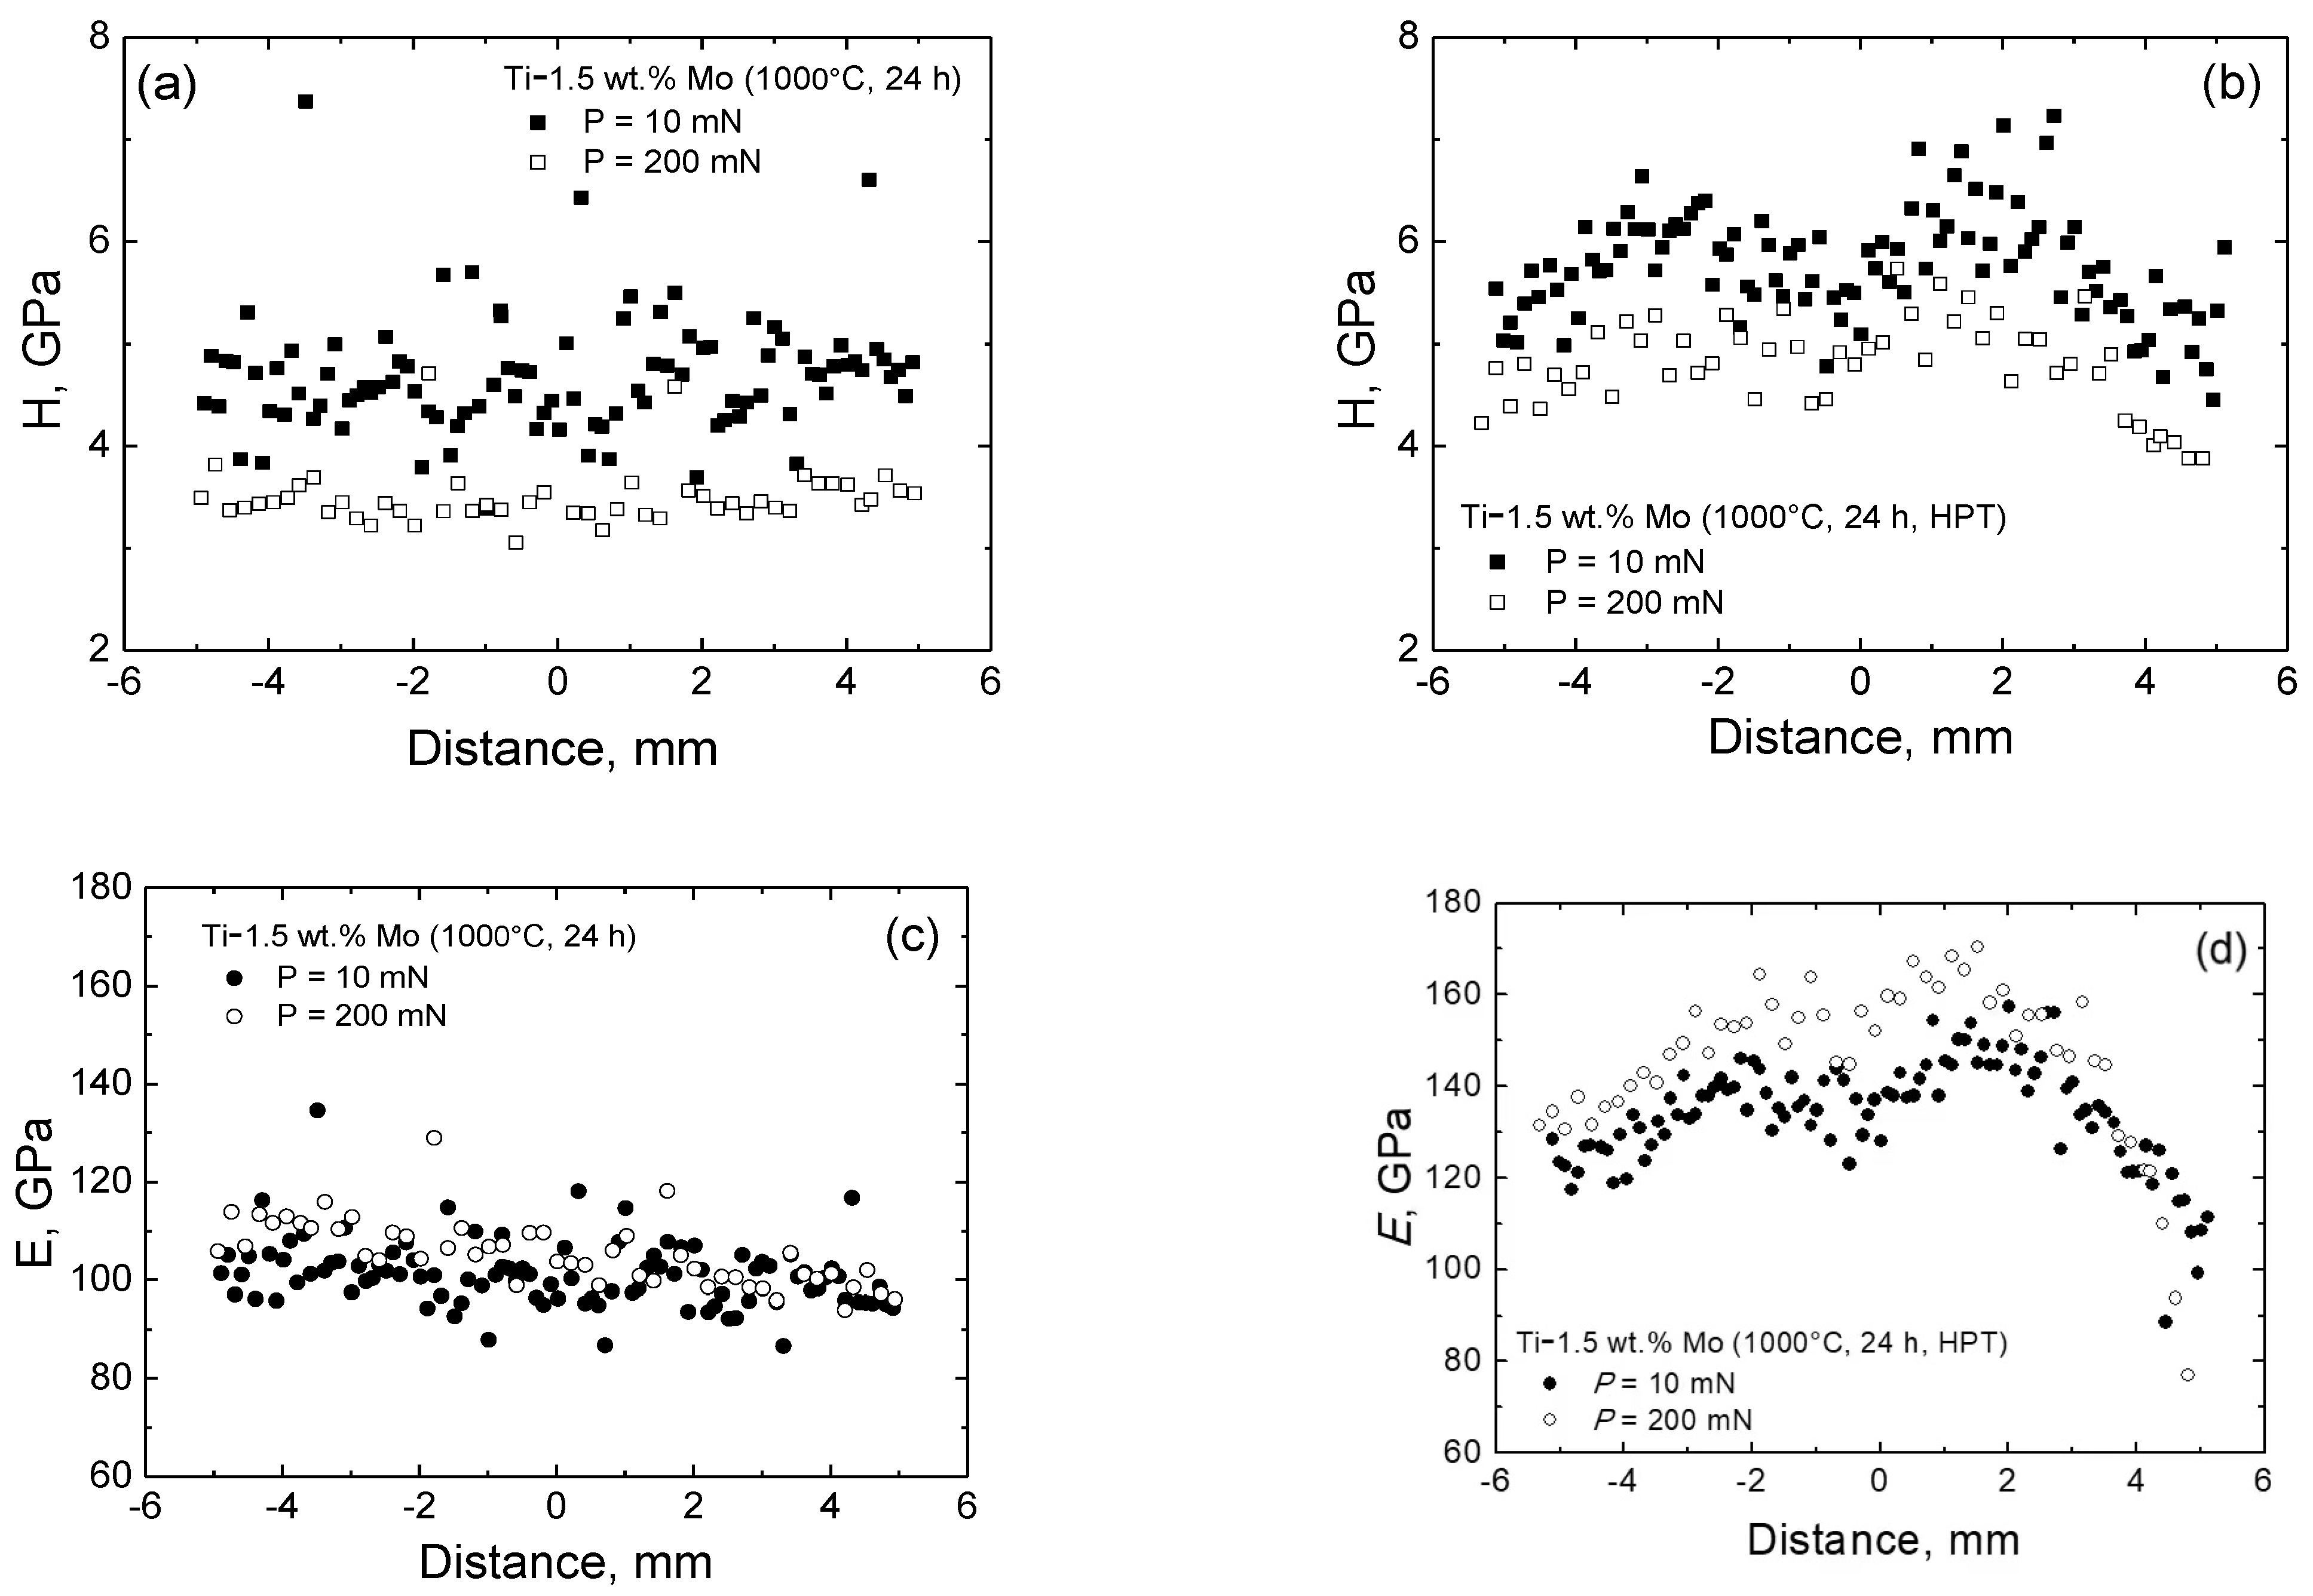
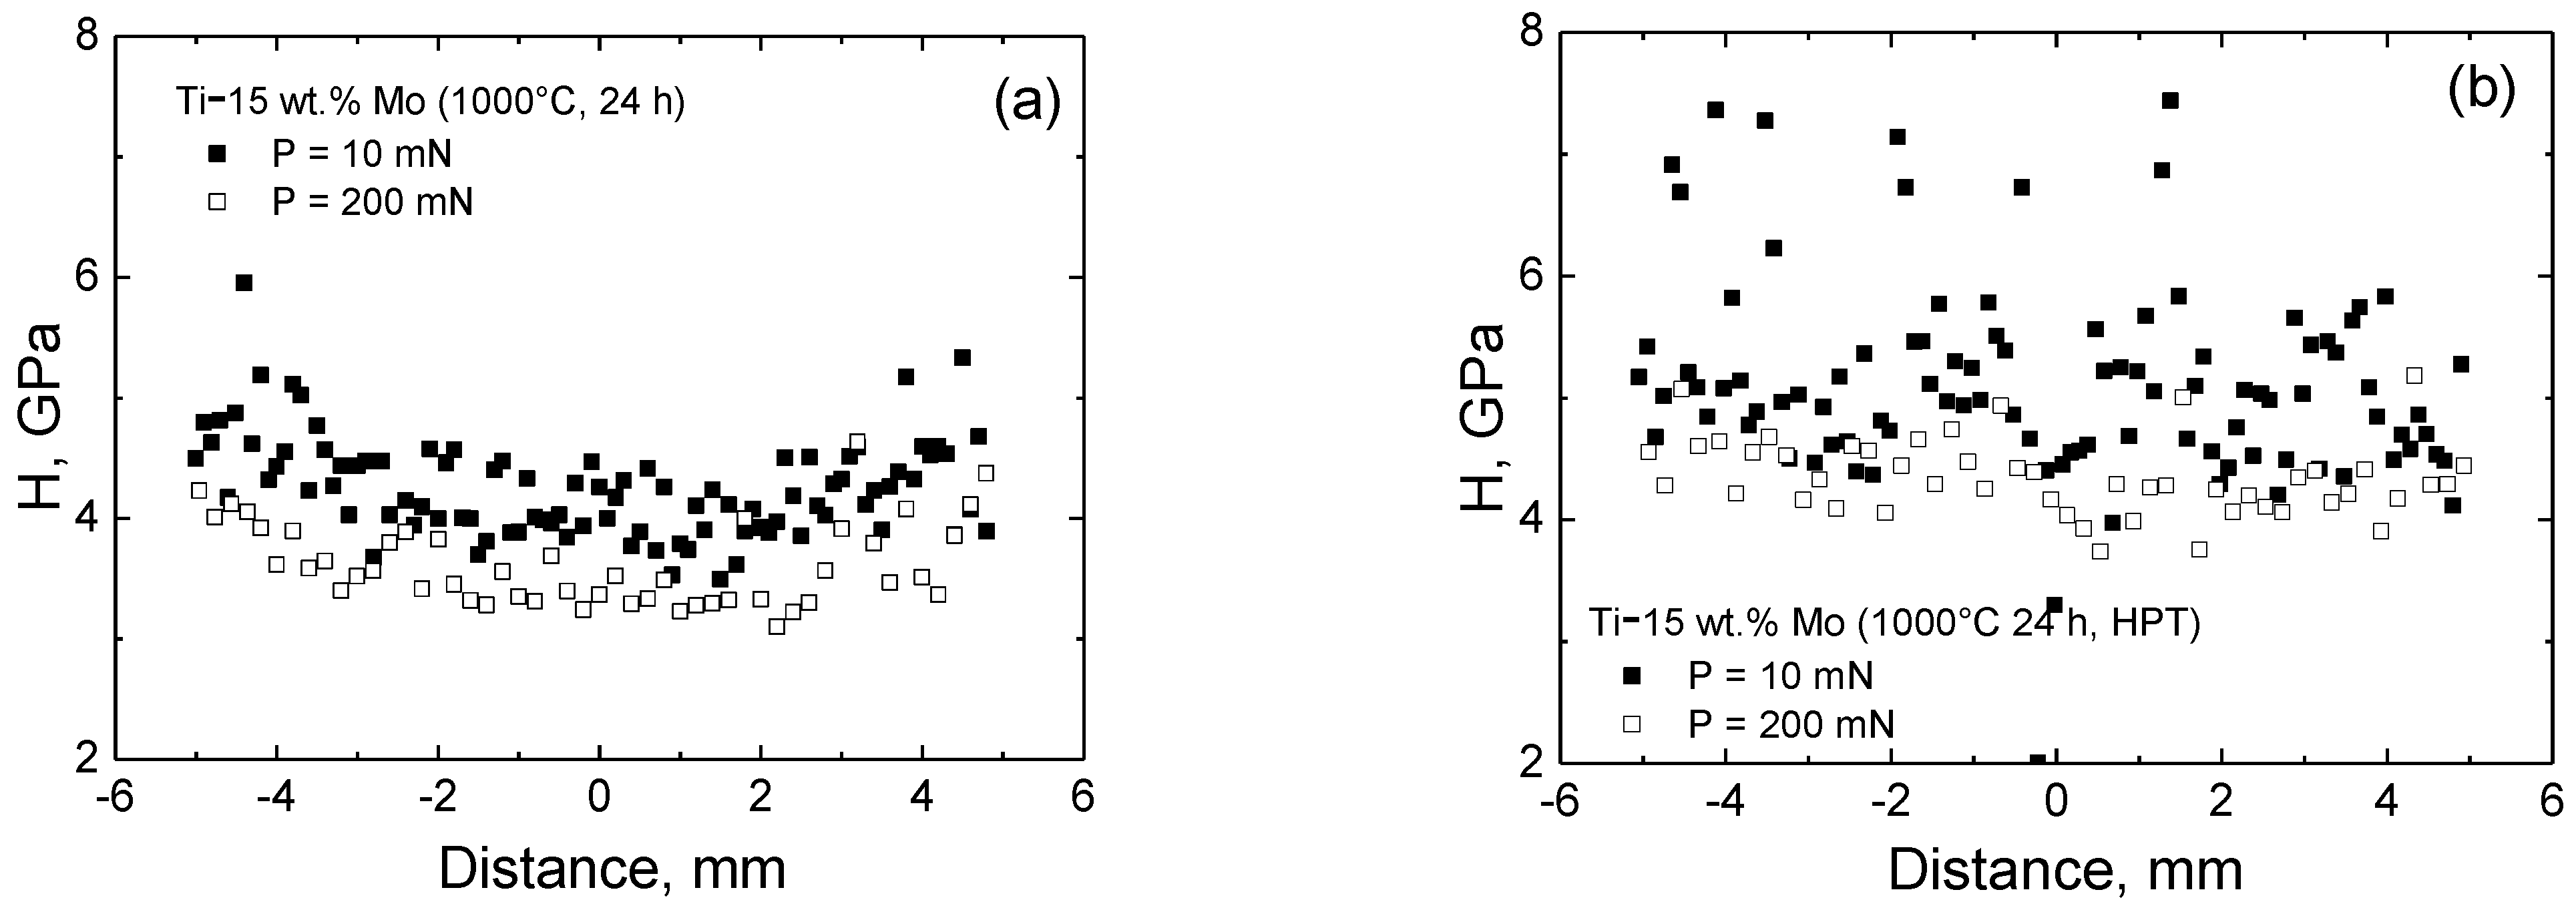
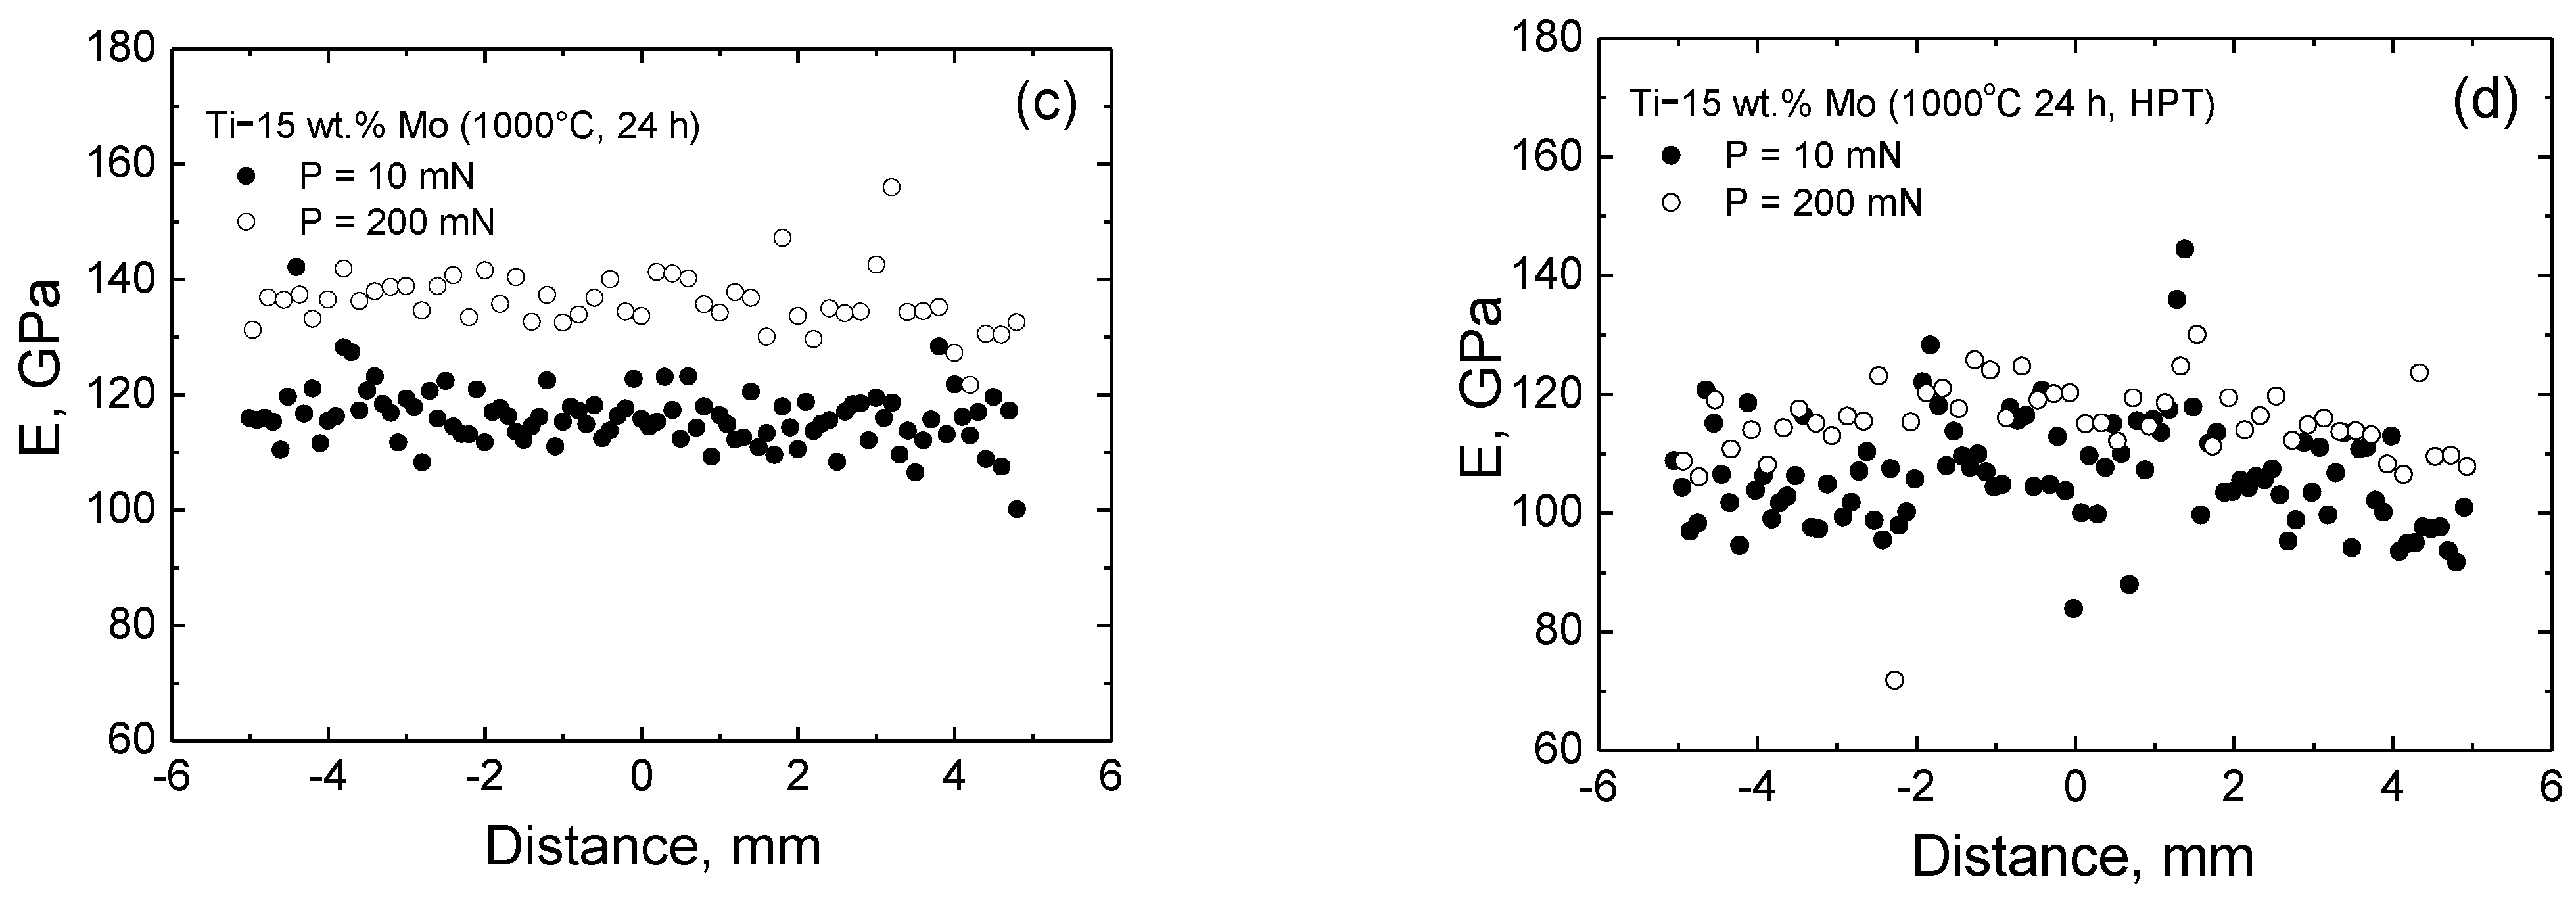
3.3. HPT and Indentation

Figure 5 shows the dependence of the torsion torque on the anvil rotation angle during HPT deformation of the studied alloys. The torsion torque increases with increasing rotation angle and reaches a certain steady state [25,26]. An alloy with a lower molybdenum content reaches a steady state faster: there is a noticeable jump at a turning angle of 20° and at a torque of 1950 mN. The alloy with a higher molybdenum content smoothly comes to a steady state at an angle of ~110° and a torque of 2150 mN. Although the proportion of molybdenum in alloys differs by 10 times, and the phase composition is also different (namely, 100% of α’ or β-phases), the steady state torsion torque of the samples differs only slightly. As one can expect, the sample with a higher content of molybdenum also has a higher steady state torsion torque.
The nano- and microindentation of the samples of the studied alloys before and after the HPT were carried out under two types of load: 10 mN (nanoscale) and 200 mN (microlevel). For each load, Ph diagrams (P is the magnitude of the load, h is the depth of the imprint) were taken from the central part (R0), the middle of the radius (R1/2), and the edge (R1) of the studied samples (Figure 6 and Figure 7). It was found that in the case of the annealed and deformed Ti–1.5 wt.% Mo alloy, the hardness values depend on the location of the measurements (Figure 6). The loading curves do not coincide with each other. For the annealed Ti–15 wt.% Mo alloy, the values of micro- and nanohardness do not depend on the localization of the measurement along the radius (Figure 7a,b), and after the HPT, the middle of the radius and the edge have higher hardness values than the central part of the sample (Figure 7c,d).

4. Discussion

By starting the discussion of our results, we have to underline that our alloys were made from high-purity components. In the literature, one can mainly find results obtained with alloys of commercial purity. The difference in purity can affect the component distribution and phase composition. Our aim was to possibly exclude the influence of (non-controllable) impurities on the studied phenomena. In addition, the combination of heat treatment and HPT treatment propoesed by us in this work was not studied before in the Ti–Mo alloy (to the best of our knowledge).
Figure 8 and Figure 9 show the results of the measurements of micro-/nanohardness and Young’s modulus. It can be seen from Figure 8a,b and Figure 9a,b that the values of nanohardness are higher those of microhardness. In the annealed Ti–1.5 wt.% Mo alloy, this difference is most significant and reaches 1.2 GPa. For an alloy with 15 wt.% Mo, the difference in hardness values is approximately 0.6 GPa. Concerning the Young’s modulus, the situation is reversed. At high loads, its values are higher than at low loads. The difference reaches about 20 GPa (Figure 8c,d and Figure 9c,d). Analyzing all the presented dependencies in Figure 8 and Figure 9, it can be seen that the spread of the measured values for annealed alloys is less than after the HPT. These dependencies are close to a linear form. When measuring hardness, regardless of the type of load, the indenter falls either into the grain volume, or on the grain boundary, or on the interphase boundary. Thus, the indenter can capture a different proportion of grains/phases close to the boundary. In the case of indentation of annealed samples, we are dealing with only two types of microstructural components: either grain or grain boundary. It is because such samples contain only one phase. As a result, the spread of measured values is small. After HPT, interphase boundaries also appear in the sample. It is because such samples contain two phases, and two types of interphase boundaries, not to mention the characteristics of the boundaries themselves. As a result, the spread of values increases.
Table 3 shows the average values of the measured micro/nanohardness and Young’s modulus. The smallest variation in H and E values is observed for annealed Ti–15 wt.% Mo alloy, and the largest for deformed Ti–1.5 wt.% Mo alloy, as well as in the shape of two peaks with maxima in the middle of the radius. Most likely, the presence of even a small fraction of the misalignment of the plungers at the HPT leads to their distortion and increased deformation at the edges of the samples. As a result, with a stronger heating of the sample edge, which leads to a decrease in segregation at the grain boundaries, and in general, with an increase in the proportion of “clean” grain boundaries and the transition of the second component into the grain volume, the alloy at the edge becomes more “soft”. The effect of the misalignment of plungers is most clearly reflected in an alloy with a small fraction of molybdenum. A number of studies have shown the influence of temperature [27,28] on the HPT process, but the question remains to what temperatures the titanium samples themselves are heated during torsion.
From the tabular data, it can be noted that the average values of nanohardness are higher than the values of microhardness. The increase of molybdenum content in the alloy does not lead to an increase in the hardness of the material, but rather reduces it. The highest values of Young’s modulus are obtained in Ti–1.5wt.% Mo alloy after a combination of heat treatment and HPT, and the lowest in the same alloy after heat treatment. Microindentation gives lower hardness values, but at the same time higher values of Young’s modulus. In [1], the authors studied titanium and molybdenum powders sintered under pressure, in different proportions. They showed how this changes the macro-, micro-, and nanohardness of samples and the amount of α and β phases. In [1], the data with calculated values of nanohardness of individual phases α’ = 3.96 GPa and β = 5.97 GPa for TM12 alloy (Ti–12 wt.% Mo) are also presented. However, the nanohardness of α’/α’ and β/β grain boundaries was not measured. The data obtained in our work differ from the calculated values in [1]. Most likely, this is due to the different methods of material preparation and processing of the alloys. It can also be noticed that the hardness values of α’ and β-phases, in our work, under the same processing conditions, are close to each other.
Based on the data from Table 3, dependences of hardness H (Figure 10a) and Young’s modulus E (Figure 10b) in the middle of the radius R1/2 for the samples of Ti–1.5 wt.% Mo and Ti–15 wt.% Mo alloys before and after HPT were plotted.
For clarity of tabular data, we present Figure 10. From this figure, it can be seen that HPT leads to a hardening of the material, and the values of nanohardness are higher than microhardness. When all other conditions (such as annealing, HPT, and indentation) are equal, the alloy with 1.5 wt.% Mo shows higher hardness values. This fact can be explained by the phase composition and the presence of interphase and intergrain boundaries. It is especially remarkable, since the torsion torque of the Ti–1.5 wt.% Mo alloy is lower than that of the Ti–15 wt.% Mo alloy (cf. Figure 5).
After annealing, the alloys contain only one phase, α’ or β. After HPT, they contain two phases, respectively, (α’ + ω) or (β + ω). The more phases there are in the sample and the closer their ratio is to 50/50, the higher the hardness of the material, because in this case the proportion of interfacial boundaries increases. We assume that the increase in the hardness value of the deformed Ti–1.5 wt.% Mo alloy compared to the deformed Ti–15 wt.% Mo alloy may be due to a greater proportion of interfacial boundaries and the presence of a harder omega phase, the volume fraction of which is almost five times higher than in the alloy containing 15 wt.% Mo. Since the Young’s modulus of the omega phase exceeds the Young’s modulus of martensite and beta phases [29,30], the large proportion of omega phase in the Ti–1.5 wt.% Mo alloy after HPT also explains the increased value of the Young’s modulus in this alloy.

5. Conclusions

Severe plastic deformation by the HPT method of single-phase Ti–1.5 wt.% Mo and Ti–15 wt.% Mo alloys with the initial microstructure containing α/α’ and β phases, respectively, led to a partial phase transformation of these phases into the ω-phase.
(1)
The volume fraction of the ω-phase was about 64 and 13 % for Ti–1.5 wt.% Mo and Ti–15 wt.% Mo alloys, respectively.
(2)
Measurements of micro- and nanohardness along the diameter of deformed samples showed an increase in hardness in both alloys by about 1 GPa compared to the initial state. This fact can be explaineds by the refinement of the microstructure, the increase in the volume fraction of interphase and intergrain boundaries, and the formation of a metastable high-pressure ω-phase.
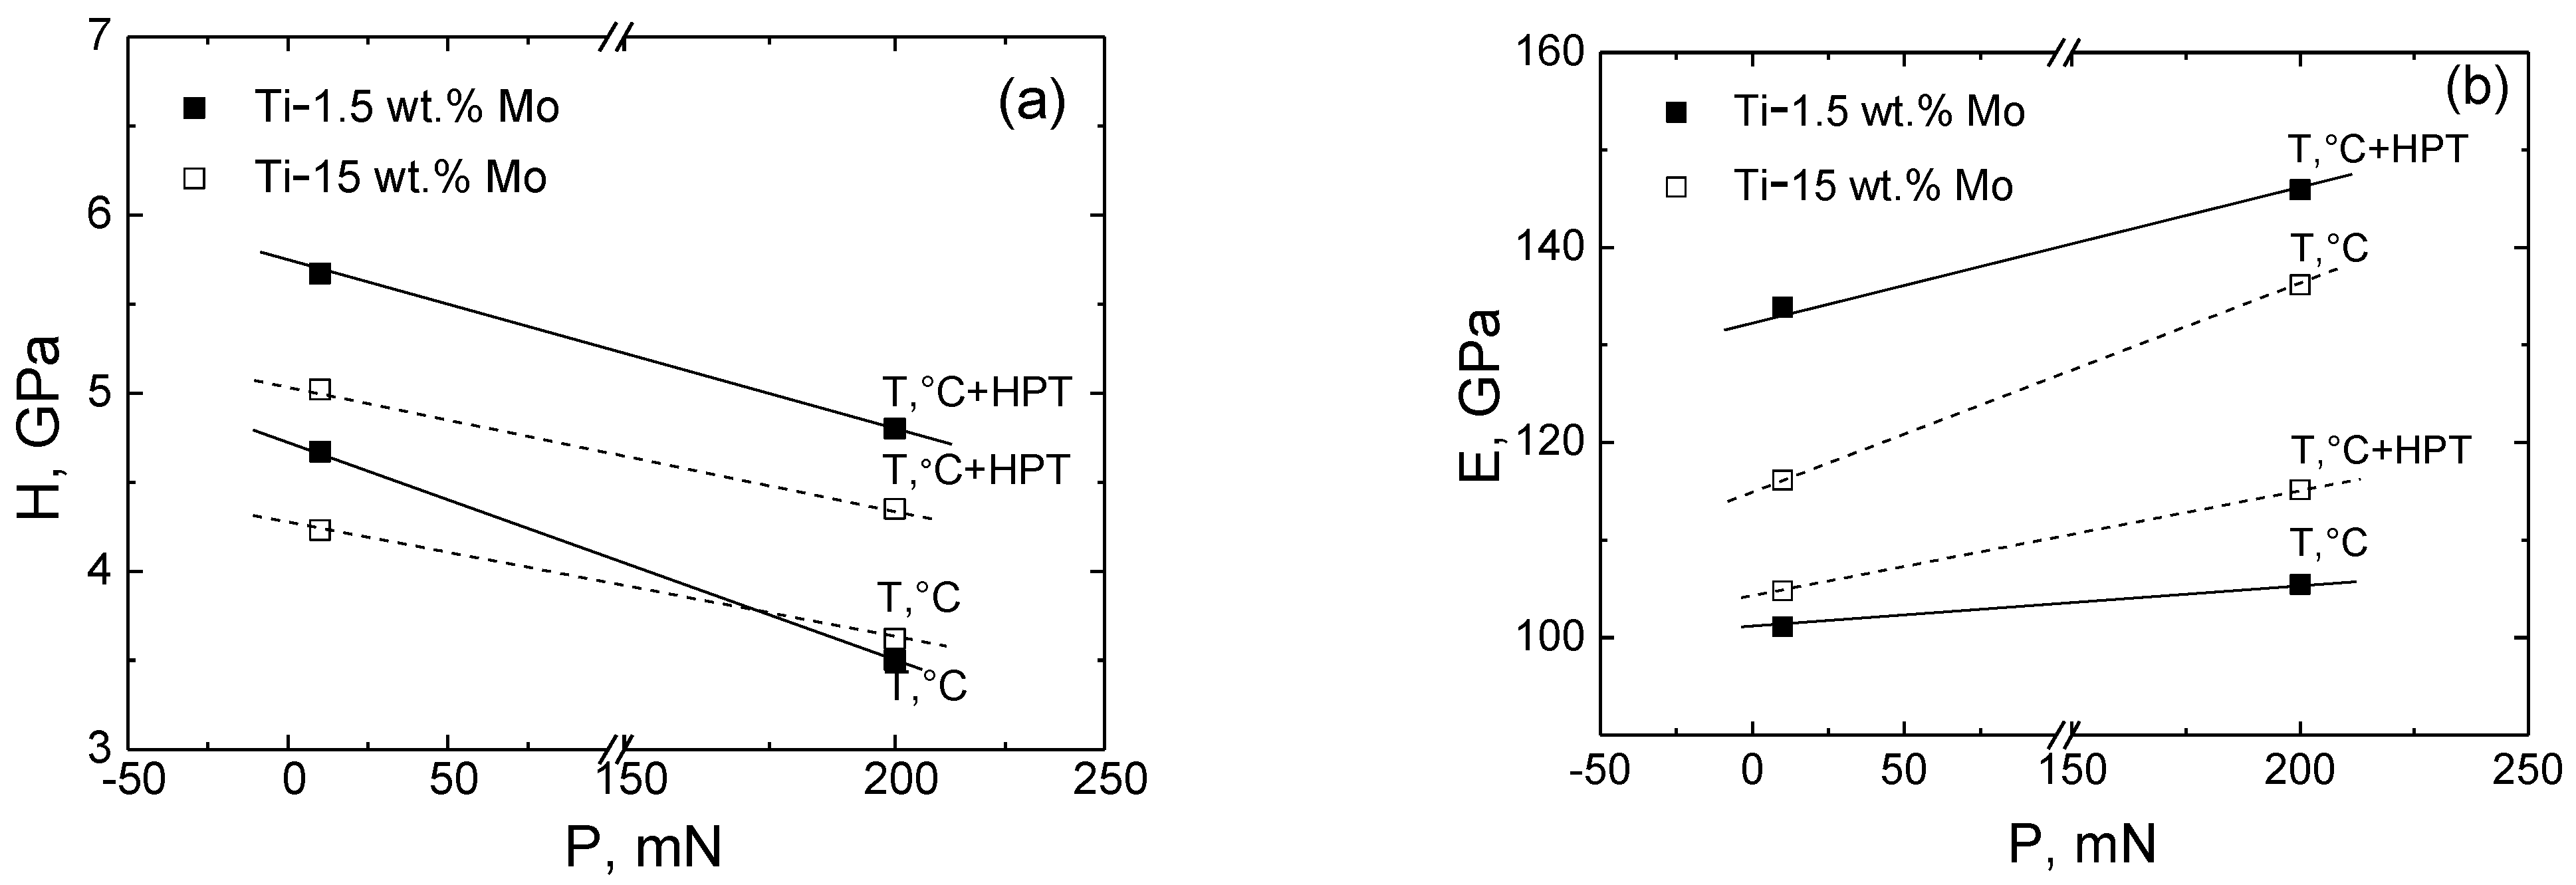
(3)
It was shown that the values of hardness (H) and Young’s modulus (E) depend on the applied load on the indenter. The higher the applied load, the lower the H and the higher the E. It has been shown that HPT leads to an increase in E for an alloy with a lower molybdenum content by 30% and to a decrease in E for an alloy with a high molybdenum content by 9%. Such a difference in the behavior of the Young’s modulus is associated with the presence of a ω-phase, the Young’s modulus of which exceeds the Young’s moduli of the α/α’ and β phases. The high proportion of the ω-phase in the alloy with 1.5wt.% Mo correlates with the increase of the E parameter.

Author Contributions

Conceptualization, A.S.G. and B.B.S.; methodology, A.I.T., A.R.K., N.S.A. and A.K.; software, A.I.T., A.R.K. and A.K.; validation, A.I.T. and A.K.; formal analysis, N.S.A.; investigation, A.S.G., A.I.T., N.S.A. and A.K.; resources, A.S.G.; data curation, A.S.G.; writing—original draft preparation, A.S.G.; writing—review and editing, B.B.S.; visualization, A.I.T. and A.K.; supervision, B.B.S.; project administration, A.S.G.; funding acquisition, A.S.G. All authors have read and agreed to the published version of the manuscript.

Funding

This research was funded by the Russian Ministry of Science and Higher Education (contract no. 075-15-2021-945 grant no. 13.2251.21.0013).

Data Availability Statement

The data presented in this study are available on request from the corresponding author.

Conflicts of Interest

The authors declare no conflict of interest.

References

  1. Asl, M.S.; Delbari, S.A.; Azadbeh, M.; Namini, A.S.; Mehrabian, M.; Nguyen, V.-H.; Van Le, Q.; Shokouhimehr, M.; Mohammadia, M. Nanoindentational and conventional mechanical properties of spark plasma sintered Ti–Mo alloys. J. Mater. Res. Technol. 2020, 9, 10647–10658. [Google Scholar]
  2. Moshokoa, N.; Raganya, L.; Obadele, B.A.; Machaka, R.; Makhatha, M.E. Microstructural and mechanical properties of Ti-Mo alloys designed by the cluster plus glue atom model for biomedical application. Int. J. Adv. Manuf. Technol. 2020, 111, 1237–1246. [Google Scholar] [CrossRef]
  3. Verestiuc, L.; Spataru, M.-C.; Baltatu, M.S.; Butnaru, M.; Solcan, C.; Sandu, A.V.; Voiculescu, I.; Geanta, V.; Vizureanu, P. New Ti–Mo–Si materials for bone prosthesis applications. J. Mech. Behav. Biomed. Mater. 2021, 113, 104198. [Google Scholar] [CrossRef]
  4. Lütjering, G.; Williams, J.C. Titaniu, 2nd ed.; Springer: Berlin/Heidelberg, Germany, 2007; p. 454. [Google Scholar]
  5. Sun, W.; Tan, A.W.Y.; Marinescu, I.; Toh, W.Q.; Liu, E. Adhesion, tribological and corrosion properties of cold-sprayed CoCrMo and Ti6Al4V coatings on 6061-T651 Al alloy. Surf. Coat. Technol. 2017, 326, 291–298. [Google Scholar] [CrossRef]
  6. Kumar, S.T.; Devi, S.P.; Krithika, C.; Raghavan, R.N. Review of metallic biomaterials in dental applications. J. Pharm. Bioallied Sci. 2020, 12, S14–S19. [Google Scholar] [CrossRef]
  7. Navarro, M.; Michiardi, A.; Castaño, O.; Planell, J.A. Biomaterials in orthopaedics. J. R. Soc. Interface 2008, 5, 1137–1158. [Google Scholar] [CrossRef] [Green Version]
  8. Zhang, W.; Liu, Y.; Wu, H.; Song, M.; Zhang, T.; Lan, X.; Yao, T. Elastic modulus of phases in Ti-Mo alloys. Mater. Charact. 2015, 106, 302–307. [Google Scholar] [CrossRef]
  9. Ho, W.F.; Ju, C.P.; Lin, J.H.C. Structure and properties of cast binary Ti-Mo alloys. Biomaterials 1999, 20, 2115–2122. [Google Scholar] [CrossRef]
  10. Zhou, Y.-L.; Luo, D.-M. Microstructures and mechanical properties of Ti–Mo alloys cold-rolled and heat treated. Mater. Charact. 2011, 62, 931–937. [Google Scholar] [CrossRef]
  11. Lu, X.; Zhang, D.; Xu, W.; Yu, A.; Zhang, J.; Tamaddon, M.; Zhang, J.; Qu, X.; Liu, C.; Su, B. The effect of Cu content on corrosion, wear and tribocorrosion resistance of Ti-Mo-Cu alloy for load-bearing bone implants. Corros. Sci. 2020, 177, 109007. [Google Scholar] [CrossRef]
  12. Mohan, P.; Rajak, D.K.; Pruncu, C.I.; Behera, A.; Amigo-Borras, V.; Elshalakany, A.B. Influence of β-phase stability in elemental blended Ti-Mo and Ti-Mo-Zr alloys. Micron 2021, 142, 102992. [Google Scholar] [CrossRef] [PubMed]
  13. Kilmametov, A.; Ivanisenko, Y.; Straumal, B.B.; Mazilkin, A.A.; Gornakova, A.S.; Kriegel, M.J.; Fabrichnaya, O.B.; Rafaja, D.; Hahn, H. Transformations of α’ martensite in Ti–Fe alloys under high pressure torsion. Scr. Mater. 2017, 136, 46–49. [Google Scholar] [CrossRef]
  14. Edalati, K.; Matsuda, J.; Arita, M.; Daio, T.; Akiba, E.; Horita, Z. Mechanism of activation of TiFe intermetallics for hydrogen storage by severe plastic deformation using high-pressure torsion. Appl. Phys. Lett. 2013, 103, 143902. [Google Scholar] [CrossRef]
  15. Edalati, K.; Matsubara, E.; Horita, Z. Processing pure Ti by high-pressure torsion in wide ranges of pressure and strain. Metall. Mater. Trans. A 2009, 40, 2079–2086. [Google Scholar] [CrossRef]
  16. Edalati, K.; Daio, T.; Arita, M.; Lee, S.; Horita, Z.; Togo, A.; Tanaka, I. High pressure torsion of titanium at cryogenic and room temperatures: Grain size effect on allotropic phase transformation. Acta Mater. 2014, 68, 207–213. [Google Scholar] [CrossRef]
  17. Deng, G.Y.; Bhattacharjee, T.; Chong, Y.; Zheng, R.; Bai, Y.; Shibata, A.; Tsuji, N. Characterization of microstructure with different Fe addition processed by severe plastic deformation and subsequent annealing. IOP Conf. Ser. Mater. Sci. Eng. 2017, 194, 012020. [Google Scholar] [CrossRef] [Green Version]
  18. Wang, C.T.; Fox, A.G.; Langdon, T.G. Microstructural evolution in ultrafinegrained titanium processed by high-pressure torsion under different pressures. J. Mater. Sci. 2014, 49, 6558–6564. [Google Scholar] [CrossRef]
  19. Sinha, S.; Sahu, V.K.; Beura, V.; Sonkusare, R.; Kalsar, R.; Das, A.K.L.; Basu, J.; Gurao, N.P.; Biswas, K. Initial texture dependence of nanocrystalline omega phase formation during high pressure torsion of commercially pure titanium. Mater. Sci. Eng. A 2021, 802, 140687. [Google Scholar] [CrossRef]
  20. Zaher, G.; Lomakin, I.; Enikeev, N.; Jouen, S.; Saiter-Fourcin, A.; Sauvage, X. Influence of strain rate and Sn in solid solution on the grain refinement and crystalline defect density in severely deformed Cu. Mater. Today Commun. 2021, 26, 101746. [Google Scholar] [CrossRef]
  21. Oliver, W.C.; Pharr, G.M. Measurement of hardness and elastic modulus by instrumented indentation: Advances in understanding and refinements to methodology. J. Mater. Res. 2004, 19, 3–20. [Google Scholar] [CrossRef]
  22. Golovin, Y.I.; Tyurin, A.I.; Aslanyan, E.G.; Pirozhkova, T.S.; Vasyukov, V.M. The physical and mechanical properties and local deformation micromechanisms in materials with different dependence of hardness on the depth of print. Phys. Solid State 2017, 59, 1803–1811. [Google Scholar] [CrossRef]
  23. Golovin, Y.I.; Tyurin, A.I.; Iunin, Y.L. Strain-rate sensitivity of the hardness of crystalline materials under dynamic nanoindentation. Dokl. Physic 2003, 48, 505–508. [Google Scholar] [CrossRef]
  24. Kilmametov, A.; Ivanisenko, Y.; Mazilkin, A.; Straumal, B.; Gornakova, A.; Fabrichnaya, O.; Kriegel, M.; Rafaja, D.; Hahn, H. The α→ω and β→ω phase transformations in Ti-Fe alloys under high-pressure torsion. Acta Mater. 2018, 144, 337–351. [Google Scholar] [CrossRef]
  25. Straumal, B.B.; Kilmametov, A.R.; Kucheev, Y.O.; Kurmanaeva, L.; Ivanisenko, Y.; Baretzky, B.; Korneva, A.; Zięba, P.; Molodov, D.A. Phase transitions during high pressure torsion of Cu–Co alloys. Mater. Lett. 2014, 118, 111–114. [Google Scholar] [CrossRef]
  26. Straumal, B.B.; Kilmametov, A.R.; Ivanisenko, Y.; Mazilkin, A.A.; Kogtenkova, O.A.; Kurmanaeva, L.; Korneva, A.; Zięba, P.; Baretzky, B. Phase transitions induced by severe plastic deformation: Steady-state and equifinality. Int. J. Mater. Res. 2015, 106, 657–664. [Google Scholar]
  27. Permyakova, E.; Glezer, A.M.; Kovalev, A.I.; Vakhrushev, V.O. Three-stage evolution of the structure and the effect of nonadditive hardening of layered composites of amorphous alloys under high-pressure torsion. JETP Lett. 2021, 113, 471–476. [Google Scholar] [CrossRef]
  28. Shen, D.P.; Zhou, H.B.; Tong, W.P. Influence of deformation temperature on the microstructure and thermal stability of HPT-consolidated Cu-1%Nb alloys D. J. Mater. Res. Technol. 2019, 8, 6396–6399. [Google Scholar]
  29. Zhilyaev, A.P.; Sergeev, S.N.; Langdon, T.G. Electron backscatter diffraction (EBSD) microstructure evolution in HPT copper annealed at a low temperature. J. Mater. Res. Technol. 2014, 3, 338–343. [Google Scholar]
  30. Panigrahi, A.; Bönisch, M.; Waitz, T.; Schafler, E.; Calin, M.; Eckert, J.; Skrotzki, W.; Zehetbauer, M. Phase transformations and mechanical properties of biocompatible Ti–16.1Nb processed by severe plastic deformation. J. Alloys. Comp. 2015, 628, 434–441. [Google Scholar] [CrossRef]
Figure 1. SEM micrographs of alloys annealed at 1000 °C for 24 h: (a) Ti–1.5 wt.% Mo and (b) Ti–15 wt.% Mo.
Processes 11 00221 g001
Figure 2. SEM micrographs of Ti–1.5 wt.% Mo alloy annealed at 1000 °C for 24 h and after HPT: (a) R0 is the center, (b) R1/2 is the middle of the radius, (c) R1 is the edge of the sample.
Processes 11 00221 g002
Figure 3. SEM micrographs of Ti–15 wt.% Mo alloy annealed at 1000 °C for 24 h and after HPT: (a) R0 is the center, (b) R1/2 is the middle of the radius, (c) R1 is the edge of the sample.
Processes 11 00221 g003
Figure 4. XRD patterns for the (a) Ti–1.5 wt.% Mo and (b) Ti–15 wt.% Mo alloys; black curves (top ones) correspond to the samples annealed at 1000 °C before HPT, red curves (bottom ones) correspond to the annealed samples after HPT.
Processes 11 00221 g004
Figure 5. Dependence of the torsion torque during HPT on the rotation angle for the Ti–1.5 wt.% Mo (bottom curve, red) and Ti–15 wt.% Mo (top curve, black) alloys.
Processes 11 00221 g005
Figure 6. P–h diagrams (P is the magnitude of the load, h is the depth of the imprint) for the Ti–1.5 wt.% Mo alloy in the center of the disc (r = R0), in the middle of radius (r = R1/2), and at the edge of the sample (r = R1): (a,b) annealed at 1000 °C for 24 h; (c,d) annealed and subjected to HPT. Loads (a,c) P = 10 mN and (b,d) P = 200 mN.
Processes 11 00221 g006
Figure 7. P–h diagrams (P is the magnitude of the load, h is the depth of the imprint) for the Ti–15 wt.% Mo alloy in the center of the disc (r = R0), in the middle of radius (r = R1/2), and at the edge of the sample (r = R1): (a,b) annealed at 1000 °C for 24 h; (c,d) annealed and subjected to HPT. Loads (a,c) P = 10 mN and (b,d) P = 200 mN.
Processes 11 00221 g007aProcesses 11 00221 g007b
Figure 8. The dependences of nano- and microhardness H (a,b), as well as Young’s modulus E (c,d) on the distance across the sample (0 corresponds to the disc center) for the Ti–1.5 wt.% Mo alloy before and after HPT.
Processes 11 00221 g008
Figure 9. The dependences of nano- and microhardness H (a,b), as well as Young’s modulus E (c,d) on the distance across the sample (0 corresponds to the disc center) for the Ti–15 wt.% Mo alloy before and after HPT.
Processes 11 00221 g009aProcesses 11 00221 g009b
Figure 10. Dependences of hardness H (a) and Young’s modulus E (b) in the middle of the radius R1/2 for the samples of Ti–1.5 wt.% Mo and Ti–15 wt.% Mo alloys before and after the HPT.
Processes 11 00221 g010
Table 1. Phase composition, lattice parameters, and phase fraction for Ti–1.5 wt.% Mo and Ti–15 wt.% Mo alloys annealed at 1000 °C for 24 h.
AlloyPhaseLattice Parameters (nm)Phase Fraction (Vol. %)
Ti–1.5 wt.% Mo(α′Ti)/(αTi)a = 0.2949, c = 0.4680100
Ti–15 wt.% Mo(βTi)a = 0.3250100
Pure Ti [24](αTi)a = 0.2954, c = 0.4690100
Table 2. Phase composition, lattice parameters, phase fraction, and the average grain size for each phase for the Ti–1.5 wt.% Mo and Ti–15 wt.% Mo alloys annealed at 1000 °C for 24 h and subjected to HPT.
AlloyPhaseLattice Parameters (nm)Phase Fraction (Vol. %)Average Grain Size (nm)
Ti–1.5 wt.% Mo(ωTi)a = 0.4652, c = 0.28116422
(α′Ti)a = 0.2949, c = 0.46863631
Ti–15 wt.% Mo(ωTi)a = 0.4637, c = 0.28151322
(βTi)a = 0.32568730
Pure Ti [24](αTi)a = 0.2959, c = 0.469040
(ωTi)a = 0.4627, c = 0.283060
Table 3. Average values of the hardness and elastic modulus of the studied alloys before and after the HPT, depending on the load on the indenter.
AlloyTreatmentLoad (mN)H, EAverage Values
H, E (GPa)
Ti–1.5 wt.% Moannealing10H4.7
2003.5
annealing + HPT105.7
2004.8
annealing10E101.1
200105.5
annealing + HPT10133.9
200145.9
Ti–15 wt.% Moannealing10H4.2
2003.6
annealing + HPT105.0
2004.4
annealing10E116.1
200136.2
annealing + HPT10104.8
200115.1
Disclaimer/Publisher’s Note: The statements, opinions and data contained in all publications are solely those of the individual author(s) and contributor(s) and not of MDPI and/or the editor(s). MDPI and/or the editor(s) disclaim responsibility for any injury to people or property resulting from any ideas, methods, instructions or products referred to in the content.

