Abstract
Currently, nanotechnology is considered a promising strategy to enhance drug solubility and other physicochemical properties. Albumin is a biopolymer that can be used in drug delivery systems due to its biodegradability and biocompatibility. The aim of this study was to prepare and characterize albumin nanoparticles with chlorambucil as a controlled drug delivery system. Different concentrations of chlorambucil were incubated with bovine serum albumin (BSA) in order to prepare nanoparticles using the desolvation method. As a result, nanoparticles in sizes ranging from 199.6 to 382.6 nm exhibiting high encapsulation efficiency of chlorambucil were obtained. A spectroscopic study revealed concentration-dependent changes in secondary structure of the albumin chain and in the hydrophobicity of chlorambucil. Based on the results obtained, it was concluded that the investigated structures may be used in the development of a drug delivery system.
1. Introduction
Many potential drug substances are water insoluble, for example, carvedilol [1], minoxidil [2], diosmin [3] and dimethylcurcumin [4]. Various strategies have been developed to improve the solubility, such as salt formation, pH modification, surfactant solubilization and nanoparticles encapsulation [5]. The last mentioned is characterized by an increase in drug solubility and the capability of controlled drug release [6].
Chlorambucil (CLB) is water-insoluble nitrogen mustard derivative characterized by low specificity toward cancer cells, resulting in severe side effects [7]. The molecular mechanism of CLB activity is based on DNA alkylation, which can be used with other drugs with a different action mechanism for polytherapy or target therapy, applying nanocarriers where the two drugs are encapsulated [8]. CLB was found to bind at Subdomain IIIA in Sudlow’s Site II of BSA. Interaction of CLB with BSA can exhibit both hydrophobic interactions and hydrogen bonds [9]. Despite the high effectiveness in chronic lymphocytic leukemia, Hodgkin and non-Hodgkin lymphoma human treatment, CLB is being replaced with other drugs that cause less unpleasant side effects [7]. Moreover, CLB is very effective in polytherapy with methotrexate in cancer treatment due to different mechanisms of action, and in combination with prednisolone for the treatment of chronic enteropathy with concurrent protein-losing enteropathy in dogs [10]. Owing to the unpleasant side effects of CLB, designing a drug delivery system would minimize these effects and improve the patients’ quality of life.
The main challenge for patients (both humans and animals) is a high daily intake of medicines. Moreover, some drugs require a lead-in dose, which can be provided by drug carriers with a controlled drug-releasing mechanism. The development and application of nanoparticles in therapy results in a decrease in drug administration frequency and a minimization of side effects [11].
Polymeric nanoparticles are suitable carriers for drug delivery systems owing to their biodegradability, biocompatibility and nontoxicity. Albumin is a biodegradable polymer with the capability of efficient drug binding. Both human serum albumin (HSA) and bovine serum albumin (BSA) can be used in such a scenario due to their nontoxicity and possibility for surface modifications, such as PEGylation [12], coating with chitosan [11] or lipids [13,14,15]. Albumin-based nanocarriers are easily obtained through the precipitation method in an organic solvent such as ethanol, which is also a preferable solvent for many drugs. Albumin also easily cross-links with different agents, among which the most popular is glutaraldehyde due to its low cost and the possibility for swift removal of any unreacted residue from the sample. Moreover, glutaraldehyde can be used in a very low concentration range, depending on the primary amino groups present in the protein molecule [16]. The mechanism behind cross-linking of albumin by glutaraldehyde is based on the reaction with nonprotonated amino acids such as lysine. At first, glutaraldehyde molecules form unsaturated aldehydes with simultaneous elimination of water molecules according to the aldol condensation mechanism. Secondly, nonprotonated amines (nucleophiles) react with a double bond of the glutaraldehyde oligomer in the Michael-type addition [17].
This study aims at the preparation and characterization of bovine serum nanoparticles (BSA NPs) with entrapped CLB in different concentration ranges. The encapsulation of the drug into nanoparticles is an established method preventing a rapid release in the body and providing additional protection for photosensitive drugs [18]. Albumin is the most abundant protein in the human blood plasma, which is related to the fact that it is used as a part of critical-care treatment [19]. For this reason, the study also focuses on the effect of the preparation method selection and the influence of CLB on BSA secondary structure. This research may serve as a platform for the future development of a drug delivery system with simultaneous delivery of peptides.
2. Materials and Methods
2.1. Materials
Bovine serum albumin, fraction V (purity minimum 96%) was purchased from Sigma Aldrich (Steinheim, Germany). Chlorambucil was obtained from ICN Biomedicals Inc. (Aurora, OH, USA). Ethanol was supplied by P. P. H “STANLAB” Sp. z o. o. (Lublin, Poland). Glutaraldehyde was purchased from Warchem (Warsaw, Poland). All chemicals were analytical grade and used without further purification.
2.2. Preparation of BSA NPs
BSA nanoparticles were prepared by the desolvation method [18,20]. Forty milligrams of BSA was dissolved in 2 mL of distilled water for each sample. CLB solutions were prepared by dissolving 0.25 mg (BSA CLB-0.25 NPs), 0.5 mg (BSA CLB-0.5 NPs), 1 mg (BSA CLB-1 NPs), 1.5 mg (BSA CLB-1.5 NPs) and 2 mg (BSA CLB-2 NPs) of the drug in 1 mL of 96% ethanol, incubated and magnetically stirred for 2 h with the BSA solutions. After incubation, 96% ethanol was added to reach 8 mL of ethanol per sample. To achieve cross-linked nanoparticles, 11.8 µL of 8% aqueous glutaraldehyde solution was added, which corresponds to 51% of the theoretical amount of BSA amino groups [21]. The process was performed for 14 h with magnetic stirring. The suspension obtained was purified 3 times by centrifugation in distilled water, 20 °C, 12,000 g, then redispersed by vortex and ultrasonication. Blank nanoparticles (BSA NPs) were prepared according to the procedure presented but without the drug. All steps were performed at room temperature. Nanoparticles were stored at 4 °C for further analysis.
2.3. Encapsulation Efficiency and Drug Release Study
The percentage of the encapsulated drug was determined immediately after the preparation process. The concentration of drug in the supernatant was determined with the use of fluorescence spectroscopy (λex 260 nm) using a quartz cuvette with an optical path of 10 mm. The encapsulation efficiency (EE) was calculated using the following equation:
where total drug (mg) denotes the amount of the drug added during the preparation (in mg), whereas free drug (mg) is the amount present in the supernatant (in mg).
In vitro CLB release from BSA nanoparticles was studied using a dialysis method with a cellulose dialysis sack retaining proteins with M.W. > 12,000 kDa. The experiment was conducted by diluting the nanoparticle solution in phosphate buffer saline (PBS, pH 7.4, 0.05 M) under constant gentle stirring at 37 °C to mimic physiological condition. The samples were collected at arbitrary time intervals for 48 h.
A standard calibration curve was plotted to correlate fluorescence intensity and the concentration of free CLB (R2 > 0.99) (at λmax 356 nm).
To determine the kinetics and the release mechanisms of CLB, zero-order model (Equation (2)), first-order model (Equation (3)) and Korsmeyer–Peppas model (Equation (4)) kinetic models were used:
where Cr is the concentration of the released drug, C0 is the initial concentration before the active release in time t (C0 = 0), t is the release time and K0 is the zero-order constant [22].
where Q1 is the amount of an active agent released in time t, t is the release time, Q0 is the initial amount of dissolved drug and K1 is the first-order rate constant [22].
where is the fractional solute release, t is the release time, KKP is the Korsmeyer–Peppas release constant and n is the diffusional exponent indicating the transport mechanism [23].
Cr = C0 + K0 × t,
2.4. Structural and Morphological Characterization of BSA NPs
The morphological studies of BSA nanoparticles were carried out with the use of a Nova Nano SEM 200 scanning electron microscope (FEI, Eindhoven, The Netherlands) in low vacuum conditions using an ultrahigh resolution Helix detector (SE), with an acceleration voltage of 10 kV. The specimens were deposited onto a conductive carbon tape and coated with a 10 nm carbon layer (EM ACE600 sputter coater, Leica Microsystems, Wetzlar, Germany).
2.5. Circular Dichroism (CD) Measurements
Circular dichroism (CD) spectra of BSA nanoparticles, in the presence (BSA CLB-0.25 NPs-BSA CLB-2 NPs) and absence of CLB (BSA NPs), native BSA (BSA) and native BSA in the presence of CLB (CLB–BSA), were recorded using a JASCO J-1500 spectropolarimeter (Hachioji, Tokyo, Japan). The spectrum of free CLB was recorded as a reference (data not shown). The measurements were conducted at 20 °C, in quartz cuvettes with an optical path of 0.1 mm. The spectra were recorded in the wavelength range of 200 to 250 nm (secondary structure image). The accuracy of the wavelength measurement was ± 0.1 nm, the wavelength repeatability was ± 0.05 nm and scanning speed was 20 nm/min.
2.6. Emission Fluorescence and Absorption Measurements (Qualitative and Quantitative Studies)
For qualitative and quantitative studies, emission fluorescence and absorption spectra were conducted using a JASCO FP-6500 spectrofluorimeter and JASCO V-760 spectrophotometer (Hachioji, Tokyo, Japan), respectively, with quartz cuvette at 10 mm pathlength and ±1.5 nm wavelength repeatability. The scattering spectrum for the solvent was subtracted from the samples’ spectra. Parameters of the emission spectra for CLB, BSA NPs, BSA CLB-0.25 NPs, BSA CLB-0.5 NPs, BSA CLB-1 NPs, BSA CLB-1.5 NPs and BSA CLB-2 NPs were taken in the range from 305 to 420 nm at the excitation wavelength (λex) of 260 nm. The absorption spectra were recorded in the range between 230 and 320 nm.
2.7. Statistics
Samples were prepared and measured in at least triplicate. Results were expressed as an arithmetic mean with relative standard deviation (mean ± RSD) using OriginPro software version 8.5 SR1 (Northampton, MA, USA).
3. Results
3.1. Characterization of Nanoparticles, Determination of Encapsulation Efficiency and In Vitro Drug Release
Spherical BSA nanoparticles were obtained using the desolvation method (Table 1).

Table 1.
Encapsulation efficiency (n = 3; average ± RSD *).
According to the release values (Figure 1), release kinetics of CLB from BSA NPs have been calculated (Table 2).
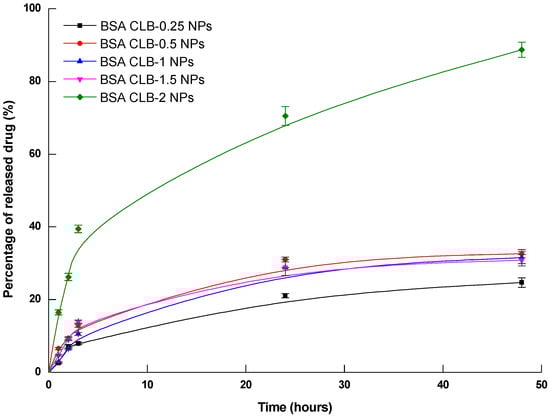
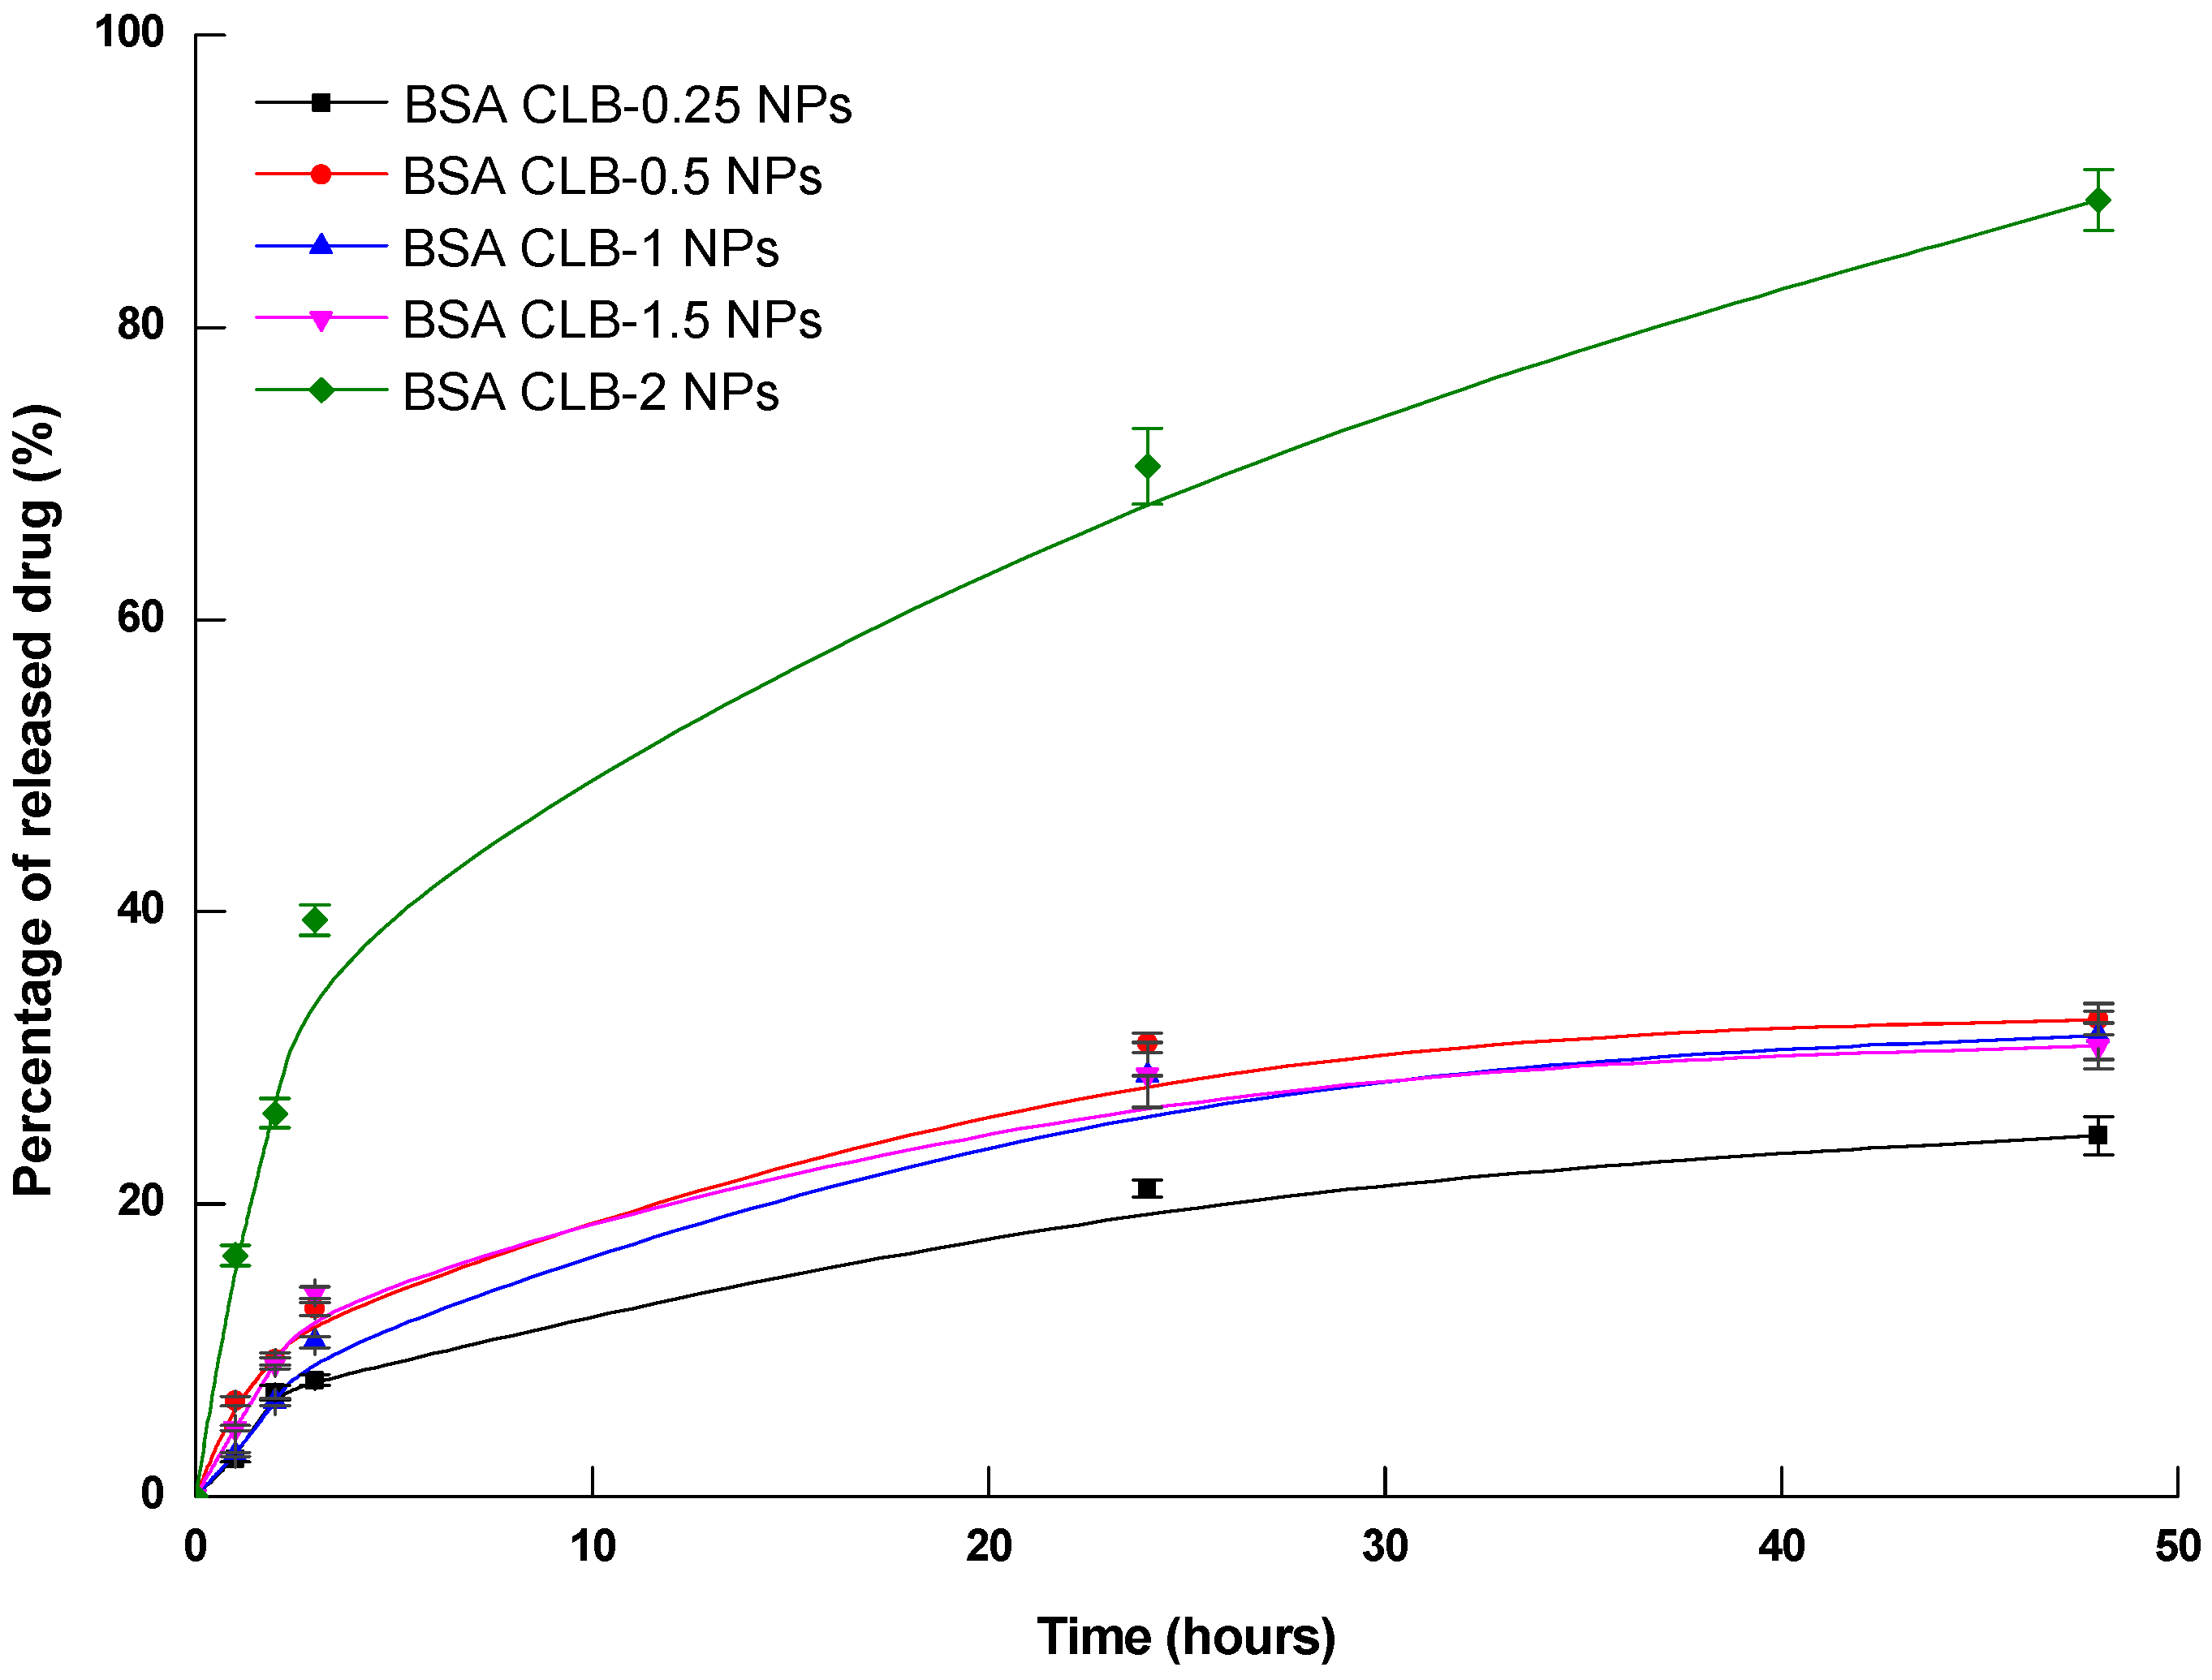
Figure 1.
CLB release from BSA nanoparticles (n = 3 ± average RSD—relative standard deviation).
Table 2.
Release kinetics of CLB from BSA NPs system.
Morphology and size (nanoparticle diameter) were determined using scanning electron microscopy (SEM) imaging. Results of the analysis for the prepared samples are presented in Figure 2 and Table 3.
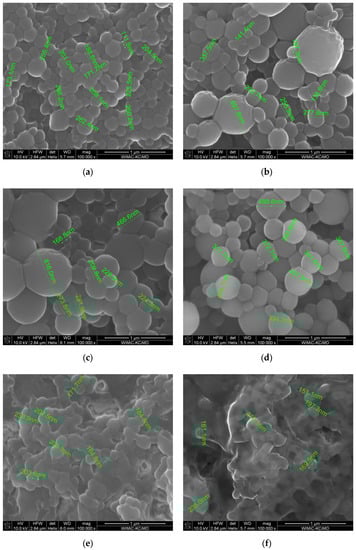
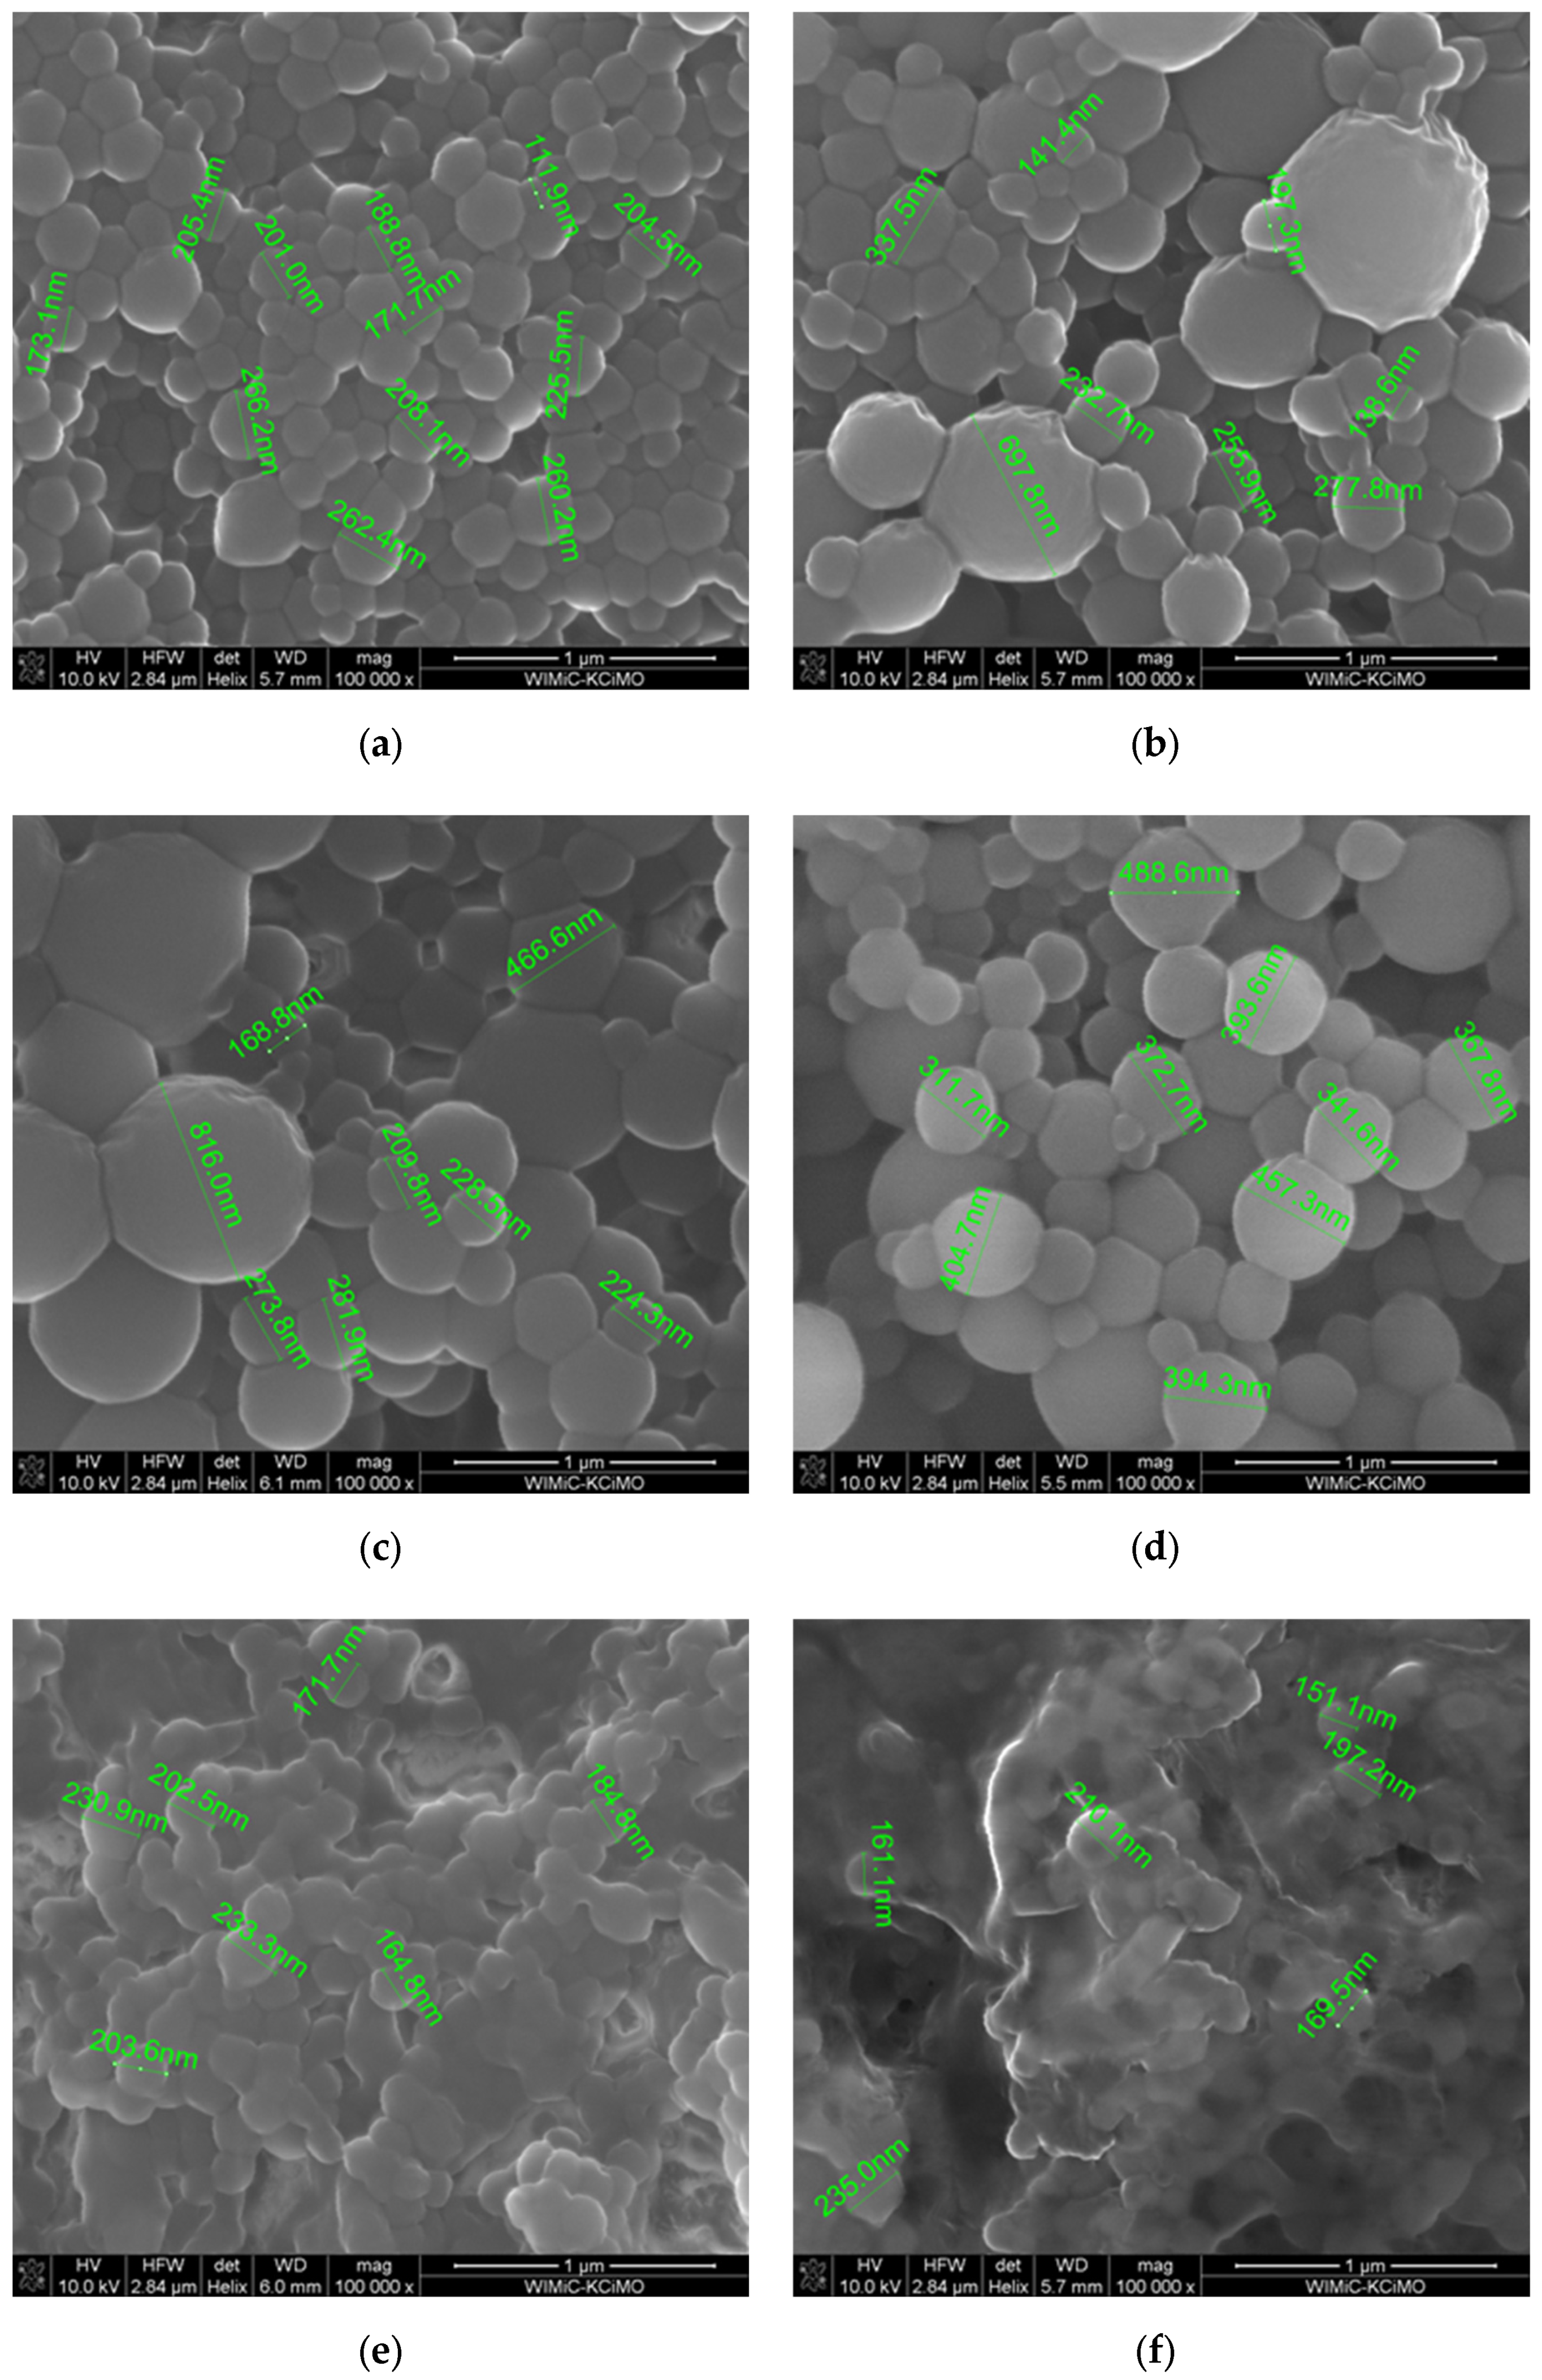
Figure 2.
SEM images: (a) BSA NPs; (b) BSA CLB-0.25 NPs; (c) BSA CLB-0.5 NPs; (d) BSA CLB-1 NPs; (e) BSA CLB-1.5 NPs; (f) BSA CLB-2 NPs.
Table 3.
Nanoparticle diameter and median. (n = 200; average ± RSD *).
CLB released from nanoparticles was analyzed with the use of fluorescence spectroscopy. To mimic physiological conditions, solutions of BSA–CLB nanoparticles in dialysis sacks were introduced into the releasing medium (PBS, pH 7.4) and gently stirred at 37 °C. The results are shown in Figure 1.
The highest rate of CLB release from BSA NPs was observed within the first hour from the start of the experiment and stabilized after 24 h for BSA CLB-0.25 NPs (24% in the 24th h and 25% in the 48th h) and BSA CLB-0.5 NPs (31% in the 24th h and 33% in the 48th h). Interestingly, in the 3rd h releasing profile for BSA CLB-1.5 NPs surpasses (14%) the one for BSA CLB-1 NPs (10%), but in the 24th and 48th h the amount of drug released for these two groups overlapped and was equal to 29% for BSA CLB-1 NPs and 29% for BSA CLB-1.5 NPs in the 24th h, and 31% for BSA CLB-1 NPs and 31% for BSA CLB-1.5 NPs in the 48th h. The highest amount of drug in the shortest time was released from the BSA CLB-2 NPs sample. It started in the 1st h with a release equal to 16% and ended in the 48th h with a release value of about 89%, without reaching the equilibrium.
Different models were fitted for the profiles recorded within the first three hours (due to their linearity) to determine the kinetics and the release mechanisms of CLB (Table 2). Based on the regression coefficient (R2) and rate constant values (K), the best kinetics model was assigned to each scenario.
Despite the relatively broad diameter distribution (Table 2, Figure 1), the morphology of BSA NPs is smooth and comparable for samples from BSA NPs to BSA CLB-1 NPs. Samples BSA CLB-1.5 NPs and BSA CLB-2 NPs show strong interparticle cross-linking. Owing to this phenomenon, the particle size was not determinable. In addition, as the CLB content increases, the particle size decreases from BSA NPs sample up to the BSA CLB-1 NPs sample. The higher CLB content also affected deformation of the shape and surface of the nanoparticles. All values are within the standard deviation range.
3.2. Circular Dichroism (CD) Measurements
Circular dichroism (CD) was used to study BSA and BSA NPs secondary structure, both in the absence and presence of CLB (BSA CLB-0.25 NPs-BSA CLB-2 NPs) (Figure 3a–f).
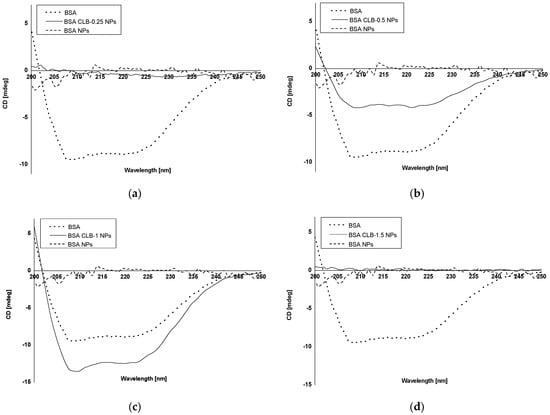
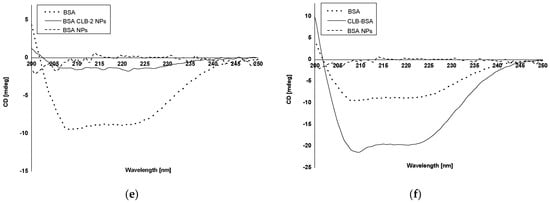
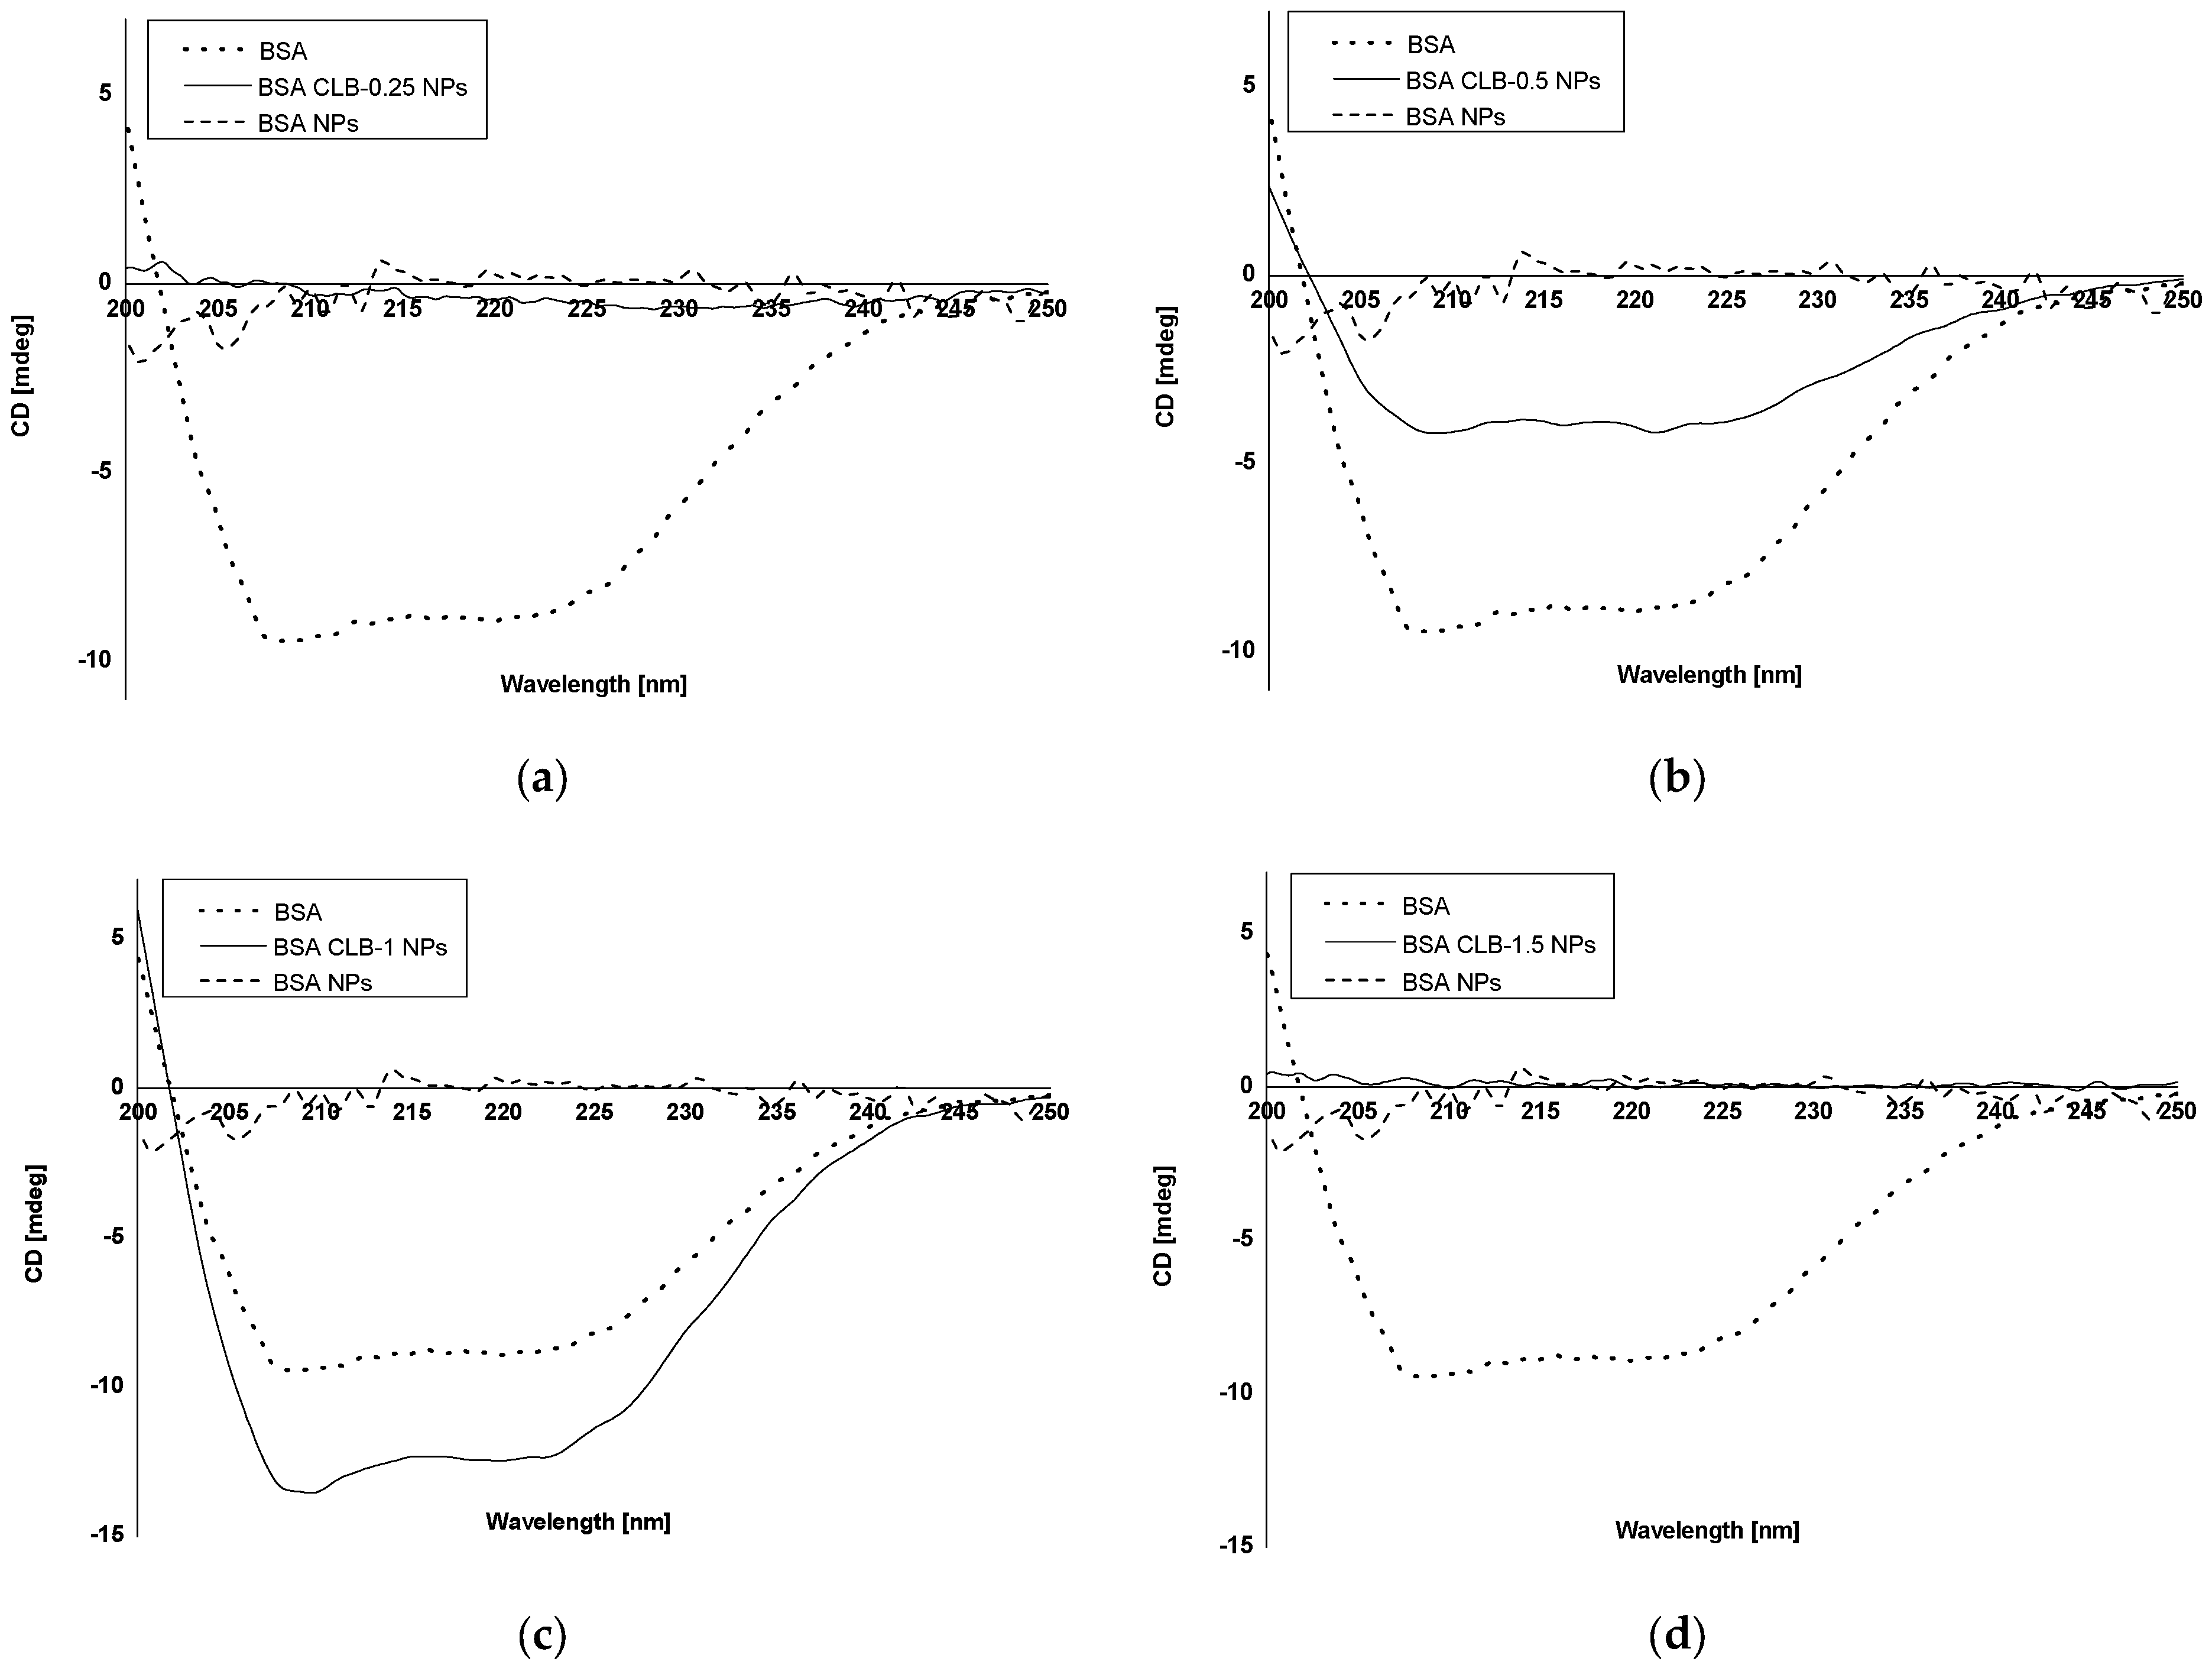
Figure 3.
CD spectra: (a) native BSA, BSA CLB-0.25 NPs and BSA NPs; (b) native BSA, BSA CLB-0.5 NPs and BSA NPs; (c) native BSA, BSA CLB-1 NPs and BSA NPs; (d) native BSA, BSA CLB-1.5 NPs and BSA NPs; (e) native BSA, BSA CLB-2 NPs and BSA NPs; (f) native BSA, CLB–BSA complex and BSA NPs.
The mean residue ellipticity (ΘMRW) and the percentage content of the secondary structure elements are provided in Table 4 and Table 5, respectively.
Table 4.
The mean residue ellipticity (ΘMRW).
Table 5.
The percentage (%) content of BSA secondary structure elements based on Yang’s reference model.
In most cases, the percentage of BSA NPs exhibiting α-helix structure increases with the increase in CLB concentration, except BSA CLB-1.5 NPs and BSA CLB-0.5 NPs, which was achieved through the cross-linking process [24]. The BSA CLB-0.25 NPs sample exhibits 100% α-helix structure, in contrast to other samples: 61.7% for BSA CLB-2 NPs, 45.8% for BSA CLB-0.5 NPs, 36.7% for BSA CLB-1 NPs and 20.0% for BSA CLB-1.5 NPs. The percentage content of β-sheet for BSA NPs is 4.0%, while only BSA CLB-1 NPs reached 13.2%—the other systems acquire no β-sheet structure. In contrast, the percentage content is opposite for α-helix: for BSA NPs it is 41.4%, and for others: 0.0% for BSA CLB-0.25 NPs, 17.2% for BSA CLB-2 NPs, 21.5% for BSA CLB-1 NPs, 25.0% for BSA CLB-0.5 NPs and 80.0% for BSA CLB-1.5 NPs. The percentage content for random is not related to the abovementioned content of the structures—for BSA NPs it is 54.4%, which is the highest value for this sample. Starting with the higher values, the results are distributed as follows: 29.2% for BSA CLB-0.5 NPs, 28.7% for BSA CLB-1 NPs, 21.1% for BSA CLB-2 NPs and 0.0% for BSA CLB-1.5 NPs. There is no random structure for the BSA CLB-0.25 NPs sample.
3.3. Emission Fluorescence and Absorption Spectra Measurements for Qualitative Research
Spectrofluorescence (Figure 4a–e) and absorption spectroscopy (Figure 5a–e) were used to investigate changes in the CLB environment.
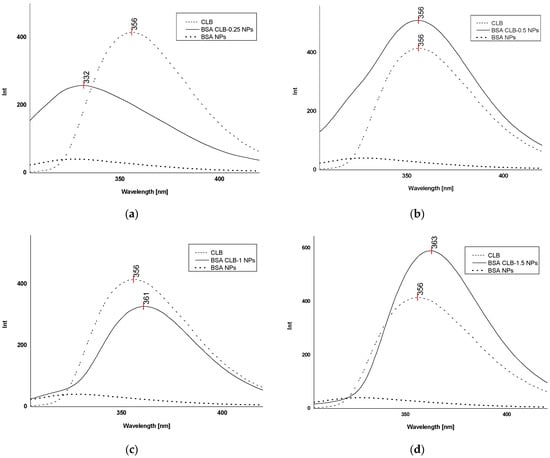
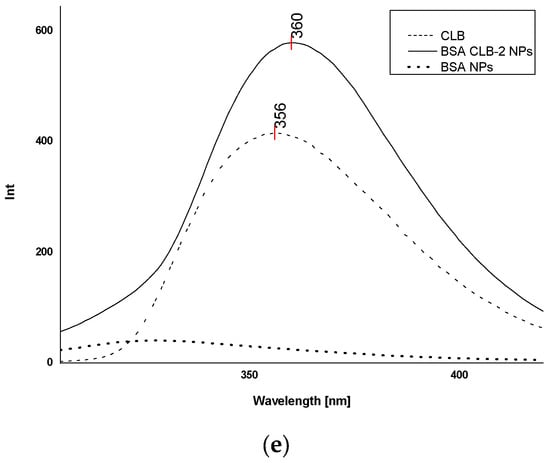
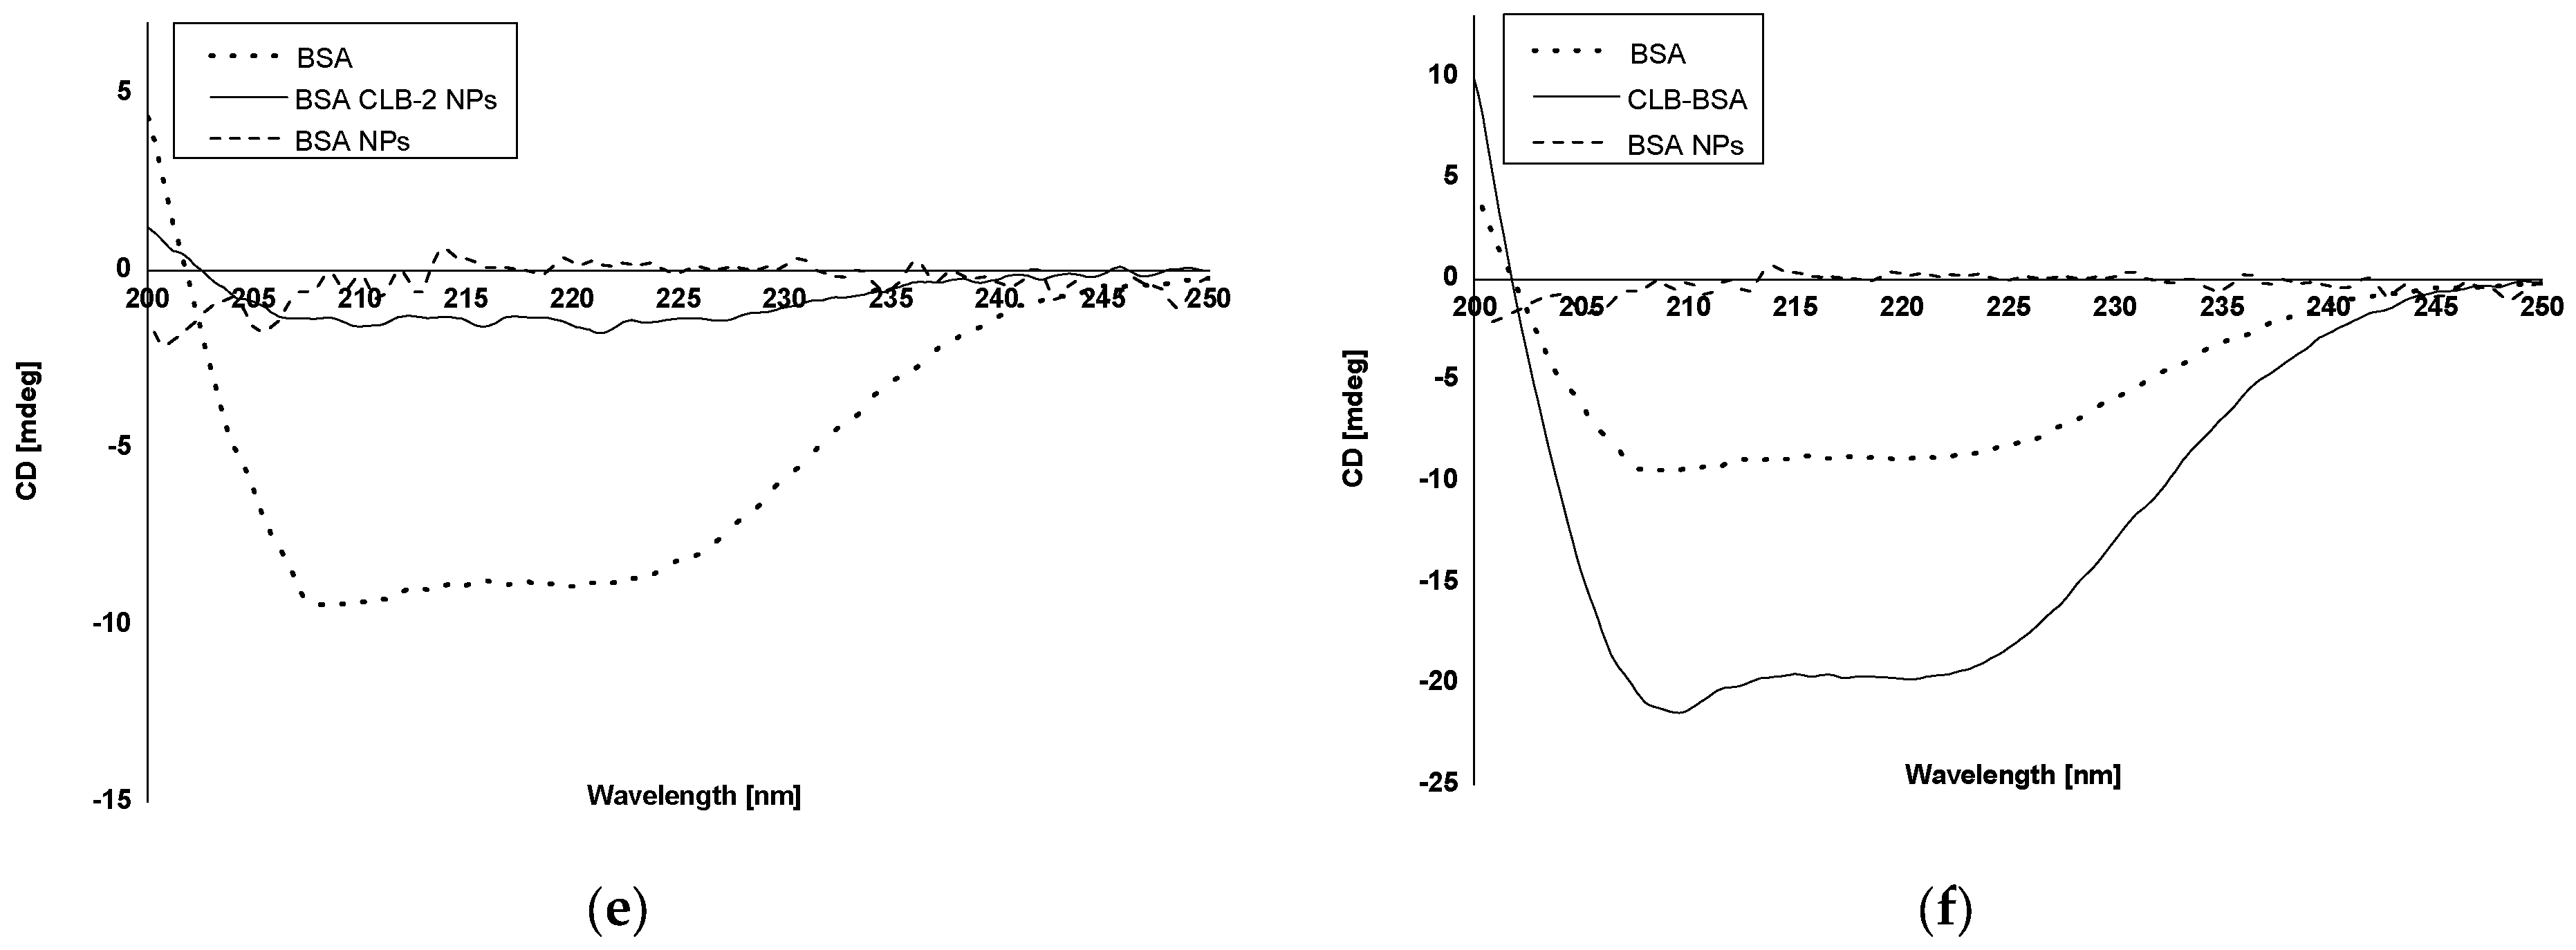
Figure 4.
Fluorescence spectra (λex 260 nm): (a) free CLB, BSA CLB-0.25 NPs and BSA NPs; (b) free CLB, BSA CLB-0.5 NPs and BSA NPs; (c) free CLB, BSA CLB-1 NPs and BSA NPs; (d) free CLB, BSA CLB-1.5 NPs and BSA NPs; (e) free CLB, BSA CLB-2 NPs and BSA NPs.
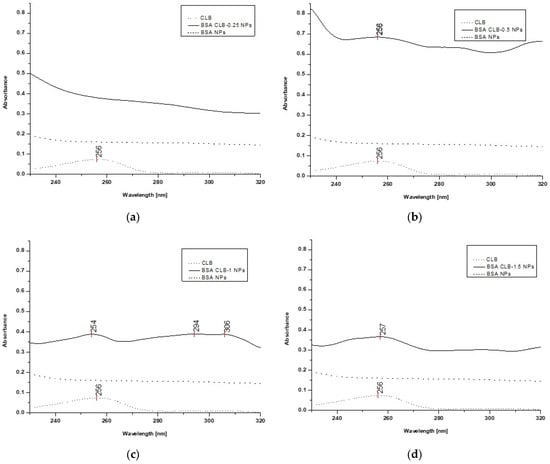

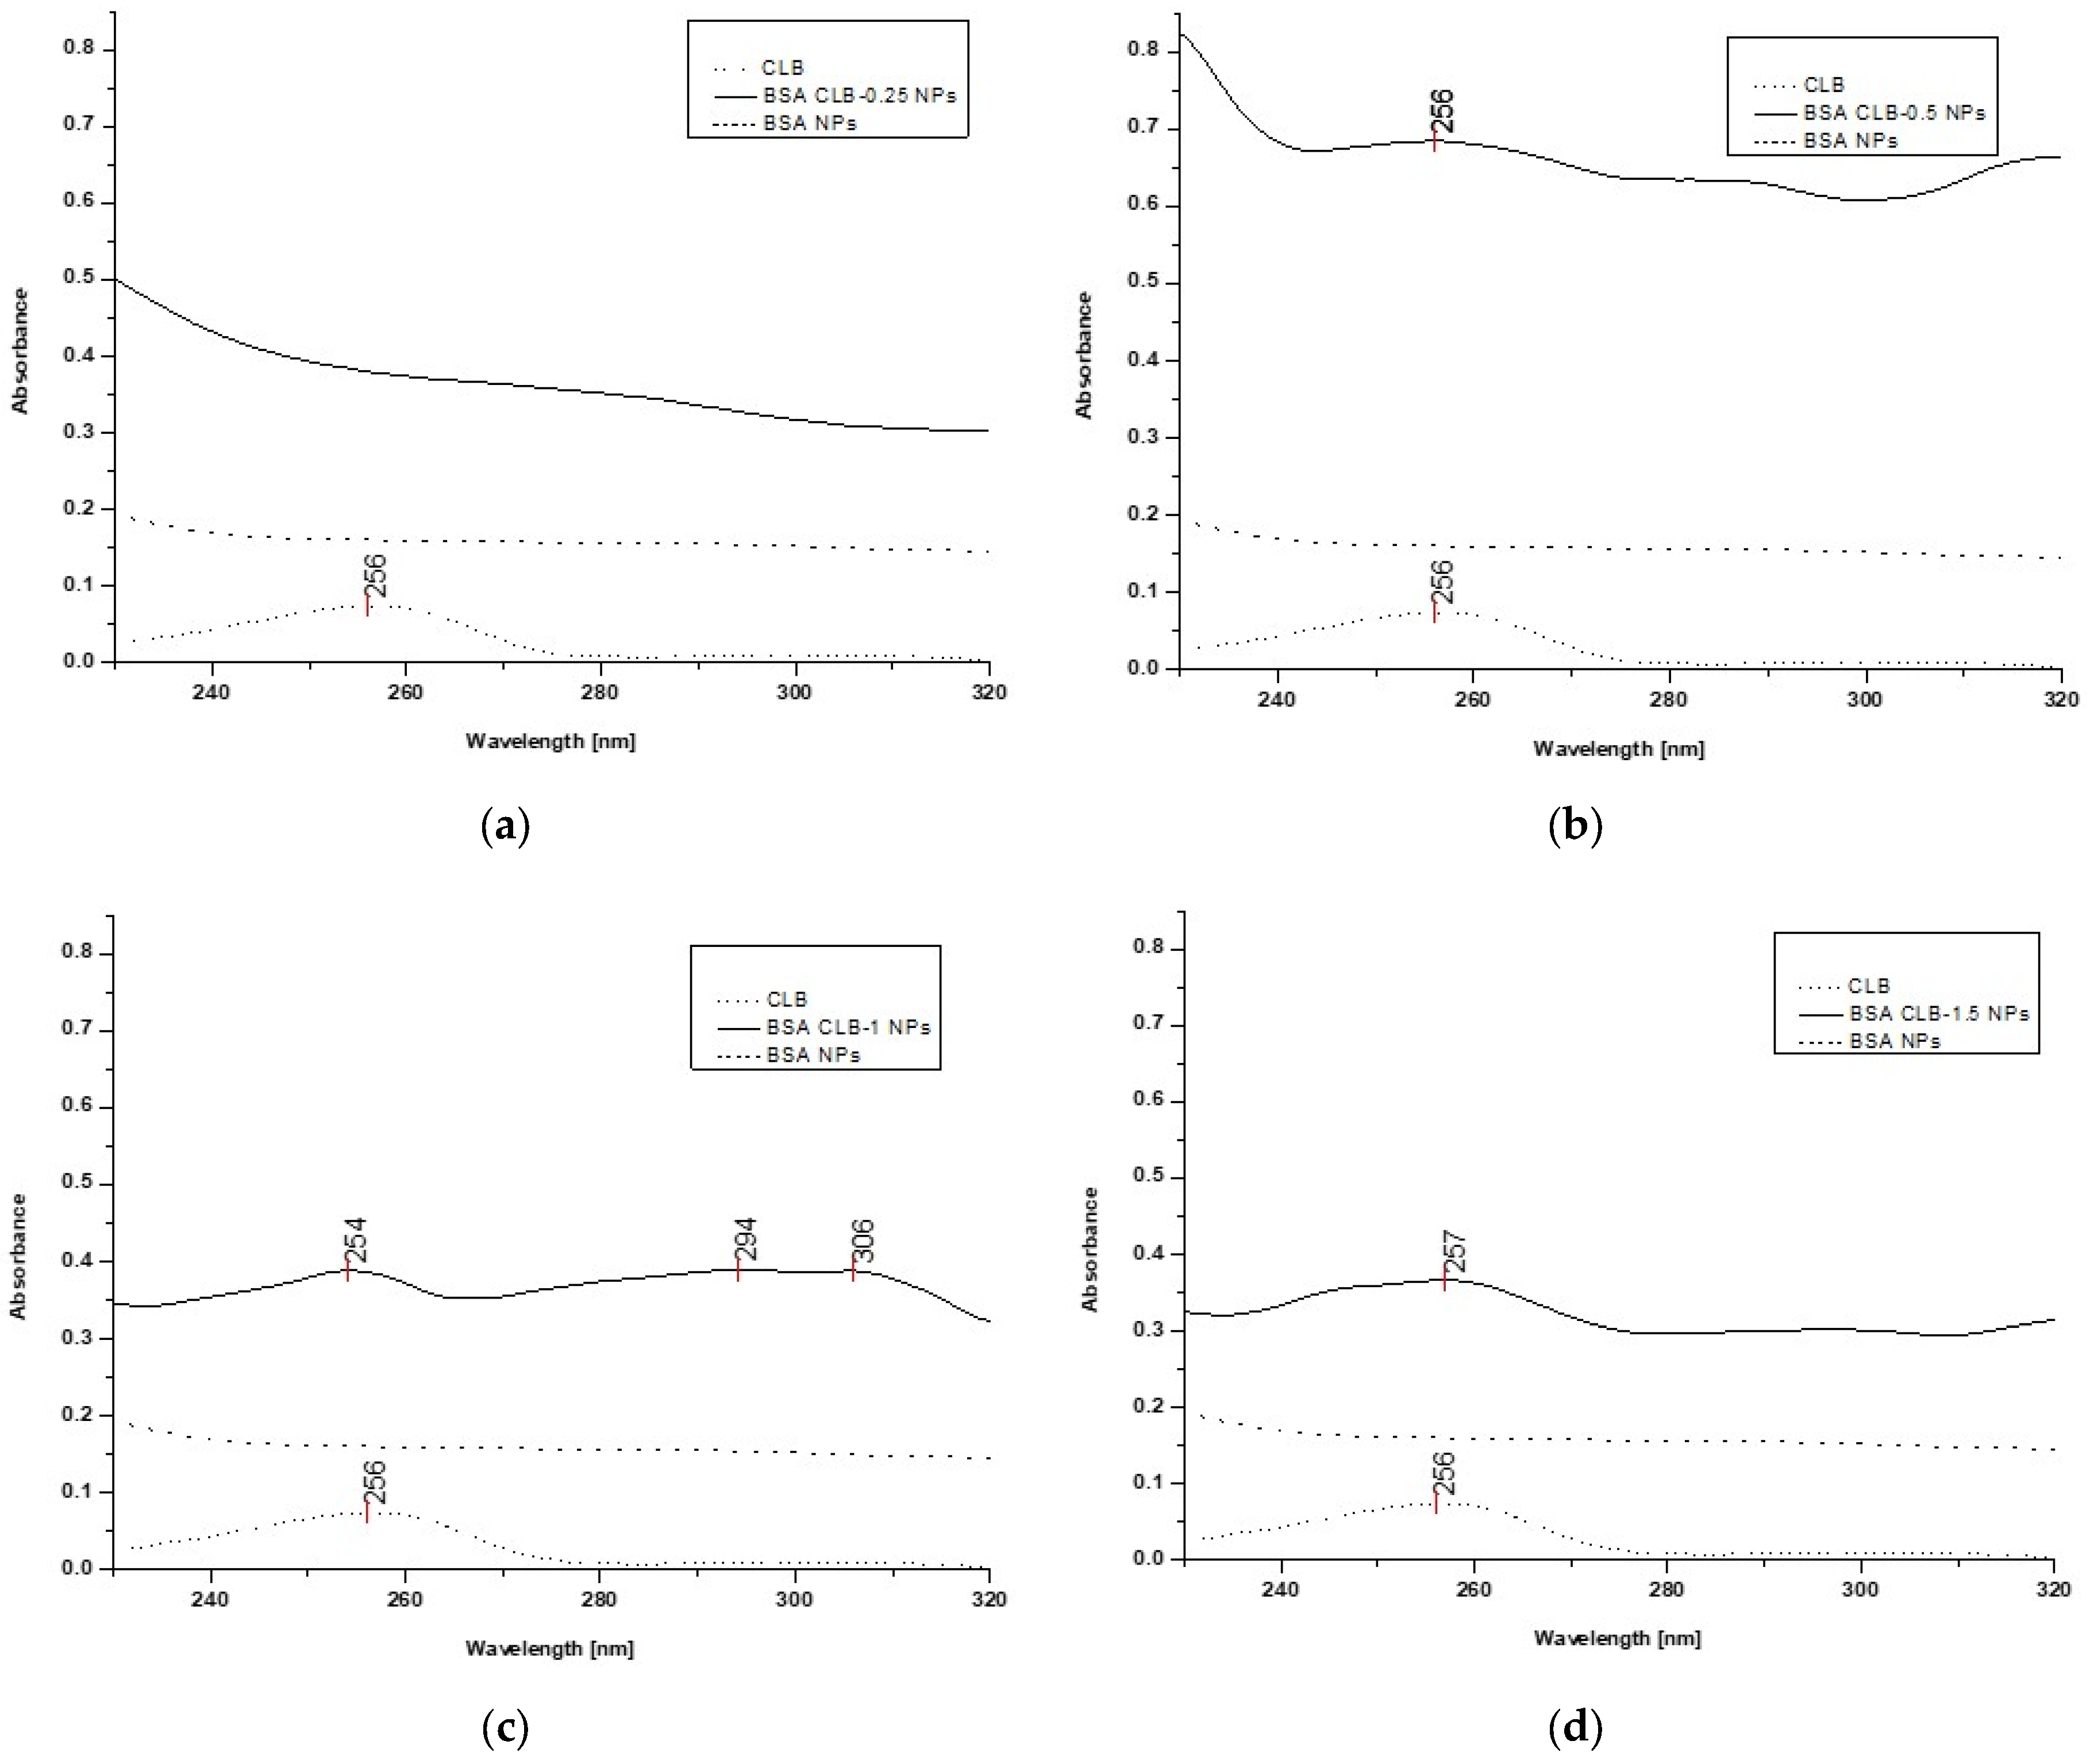
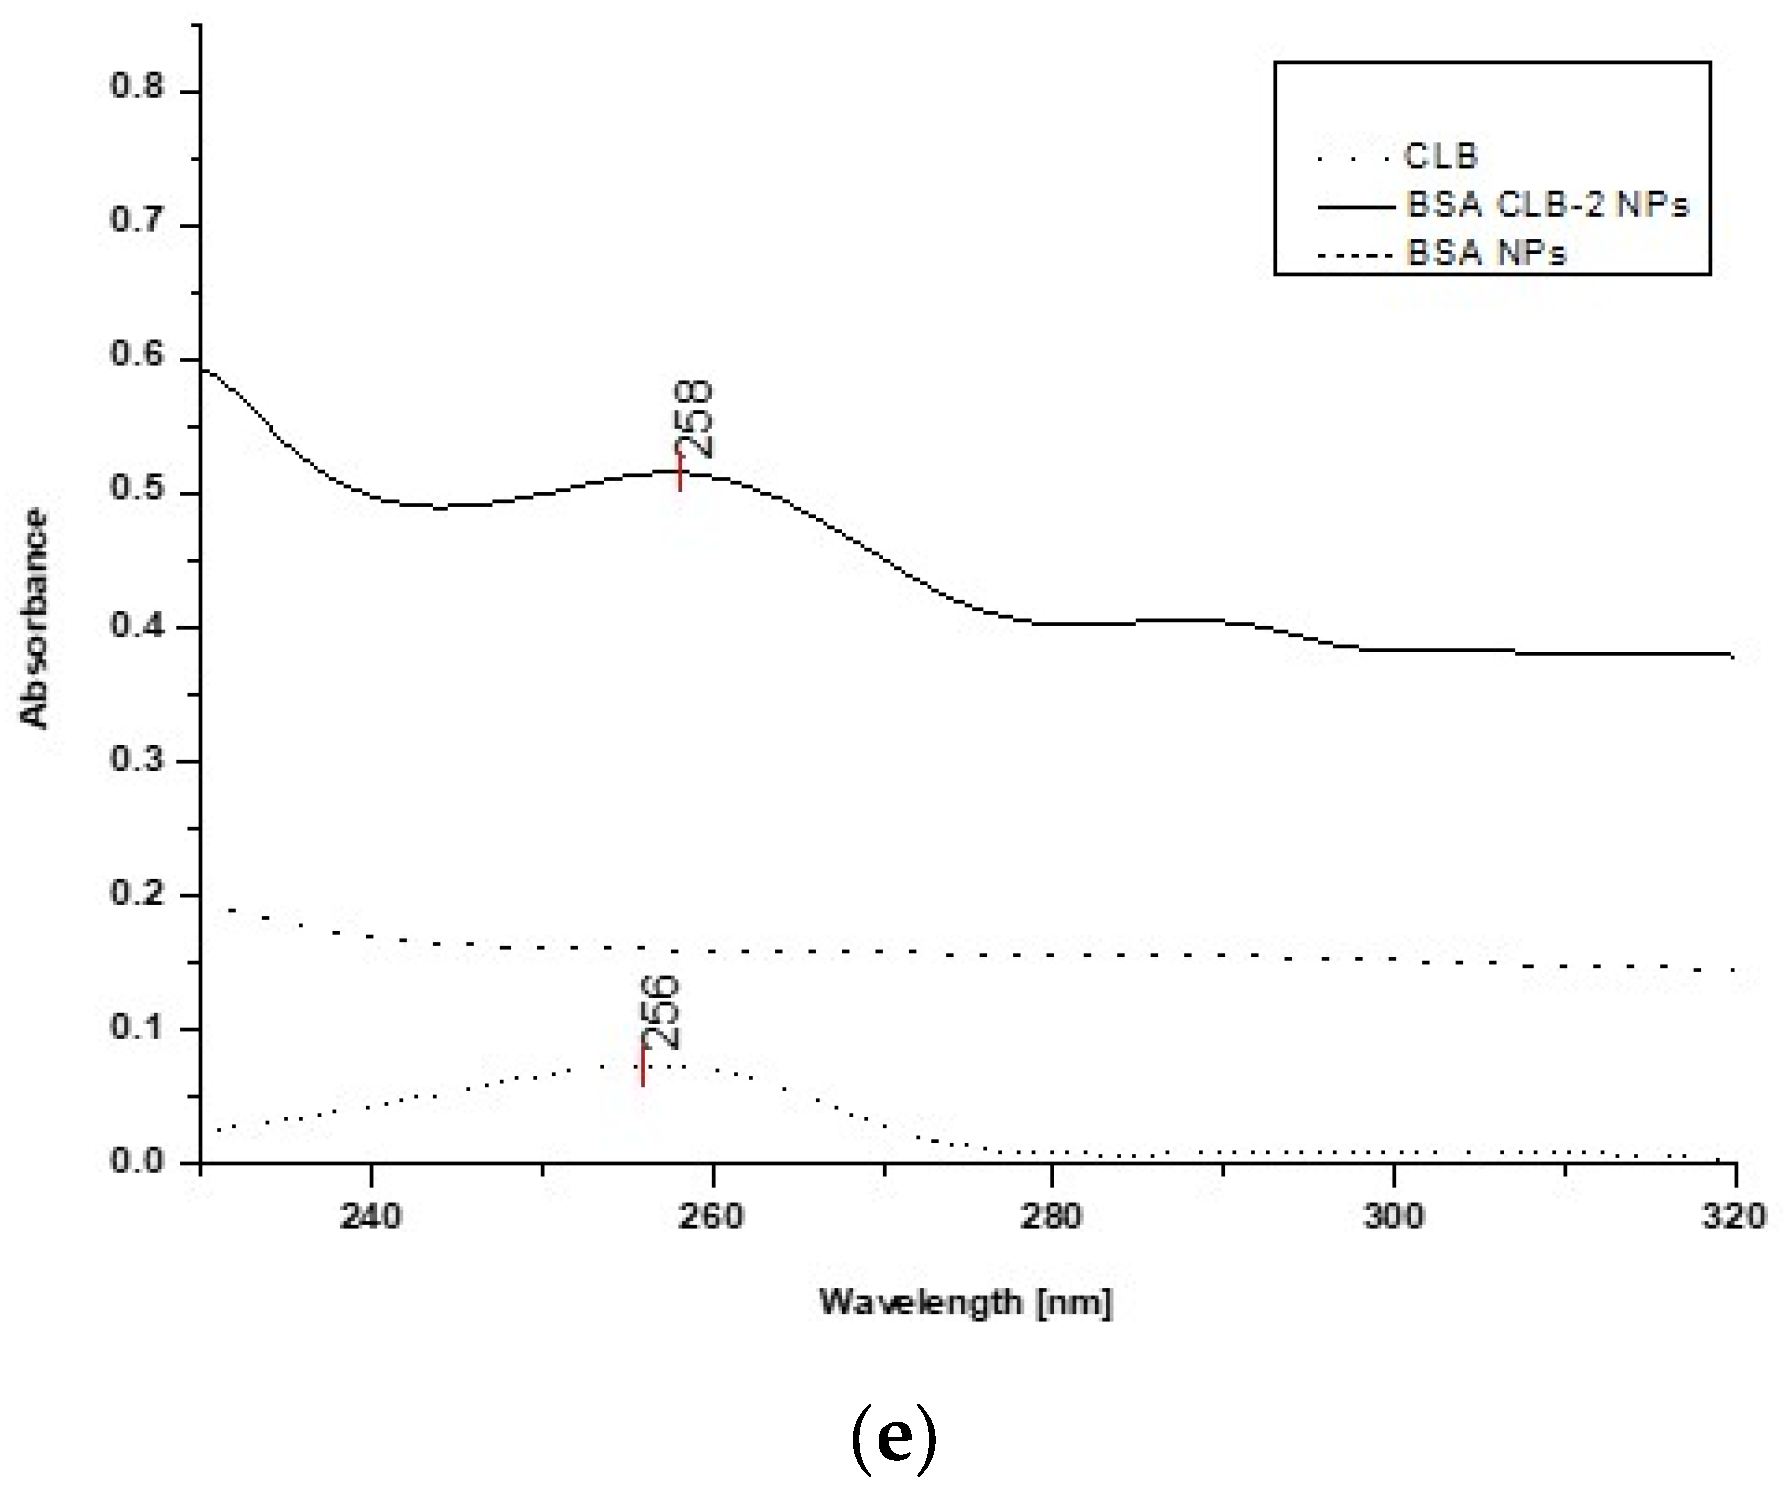
Figure 5.
UV spectra: (a) free CLB, BSA CLB-0.25 NPs and BSA NPs; (b) free CLB, BSA CLB-0.5 NPs and BSA NPs; (c) free CLB, BSA CLB-1 NPs and BSA NPs; (d) free CLB, BSA CLB-1.5 NPs and BSA NPs; (e) free CLB, BSA CLB-2 NPs and BSA NPs.
As shown in Figure 4a, BSA CLB-0.25 NPs is the only group where CLB emission is characterized by the shift toward the shortwave region (blueshift). The BSA CLB-0.5 NPs sample (Figure 4b) exhibits no shift in the spectrum for CLB, while BSA CLB-1 NPs, BSA CLB-1.5 NPs and BSA CLB-2 NPs (Figure 4c–e) show significant shifts toward the longwave region for CLB fluorescence band (redshift). The blueshift of the CLB emission band is probably associated with the successful entrapment of the drug at the nanoparticle preparation stage. In contrast, the redshift occurs most probably due to the presence of CLB molecules on the surface of nanoparticles or between fragments of polypeptides formed during denaturation. The interplay between these two opposing effects yields the final shift of the CLB band. The spectrum of BSA NPs was recorded as a reference. As shown in Figure 4a–e, the fluorescence intensity at the excitation wavelength of λex = 260 nm is insignificant in this case.
The CLB absorption spectrum (control) exhibits one band at 256 nm. Based on the spectra presented in Figure 5a–e, overlapping peaks of CLB in the BSA CLB-0.5 NPs, BSA CLB-1 NPs, BSA CLB-1.5 NPs and BSA CLB-2 NPs systems are observed. The BSA NPs and BSA CLB-0.25 NPs samples do not show any well-defined absorption bands. The lack of significant peak (associated with the presence of CLB) for the BSA CLB-0.25 NPs system probably results from the low concentration of the drug. The spectra presented in Figure 5c (BSA CLB-1 NPs) show additional peaks at 294 and 306 nm, which are probably related to the presence of modified albumin or various changes in the structure of the albumin chain during the nanoparticle formation.
The fluorescence emission spectrum recorded for the BSA CLB-0.25 NPs system exhibits strongly blueshifted signals (Figure 4a) while no significant shift is observed on the UV spectrum (Figure 5a). Comparison of these two methods may suggest that the CLB w encapsulated into the core of nanoparticles, but the amount of entrapped drug is too low; therefore, the encapsulation process caused no significant peak on the UV spectrum. The maximum in fluorescence emission and absorption spectra of BSA CLB-0.5 NPs and CLB (Figure 4b and Figure 5b) overlaps, which simply suggests polymer–drug interaction. Release profile and R2 values for samples of BSA CLB-1 NPs, BSA CLB-1.5 NPs and BSA CLB-2 NPs suggest zero-order kinetics of release.
4. Discussion
In most the cases, albumin-based nanoparticles are characterized by a high encapsulation efficiency (EE) and loading capacity value (LC) [11,20,25,26,27]; in our study, we focused on the former parameter. The highest value of EE was 99.69% (±0.05) for the BSA CLB-1 NPs system. As it is given in the literature, EE of BSA NPs is reported to be 45.5% (±3.7) for curcumin and 75.0% (±4.6) for doxorubicin, in the case for modification through the albumin-bound (nab™) technology [20]. Onafuye et al. [25] obtained doxorubicin HSA nanoparticles with different glutaraldehyde concentration, which corresponded to a theoretical cross-linking of 0%, 40%, 100% and 200% HSA amino groups. Interestingly, the differences in loaded doxorubicin concentration were not significant, except for a sample with 0% cross-linked amino groups, where the loaded amount was higher [25].
The size of BSA NPs obtained with and without entrapped CLB ranges from 199.6 to 382.6 nm (average value) and remains within the limits of measurement uncertainty. The median value for all the series suggests that the size does depend on the amount of encapsulated drug (especially for BSA CLB-0.5 NPs to BSA CLB-1 NPs); however, the distribution of size varies between different systems—it was the largest for BSA CLB-1 NPs and the smallest for BSA CLB-0.25 NPs. BSA CLB-1.5 NPs and BSA CLB-2 NPs samples have an unidentifiable size due to its aggregation and inner-particle cross-linking. The size of albumin-based nanoparticles depends on the preparation method. Motevalli et al. [20] prepared BSA nanoparticles loaded with curcumin, doxorubicin and both drugs together by mixing them with solutions of BSA. The authors obtained spherically shaped nanoparticles with sizes in the range 20 to 30 nm (measured using a scanning electron microscope) and from 80 to 100 nm (in dynamic light-scattering measurements). Kufleitner et al. [26,28] compared the incorporation and adsorption of obidoxime. The nanoparticle size distribution was unaffected by the variations in the drug concentration [26], but it depended on the pH during the preparation process [28].
Based on the other reports, the size of paclitaxel albumin-bound NP formulation (Abraxane®), described as nanoformulation, was estimated at ca. 130 nm [29,30]. Nanoparticles for medical applications should be larger than 50 nm due to possible interactions of smaller nanostructures with hepatocytes. Moreover, small particles can accumulate in the lungs, although lung accumulation is more common in children than adults. On the other hand, particles in the size range of 200–500 nm are filtered by the spleen. Because of their smaller surface area, smaller nanoparticles (approximately 80 nm) exhibit lower protein absorption on the surface when compared to larger particles [31]. The drug delivery systems presented in the paper were designed as injectable systems. As previously mentioned, the size distribution of BSA nanoparticles obtained in this study may not be satisfactory, while some nanoformulations approved by the Food and Drug Administration (FDA) are characterized by approximate sizes ~130 nm for Abraxane® [30], ~100 nm for Caelyx® 24 [32] and between 2500 and 4500 μm [33] for Optison.
According to the literature data, albumin nanoparticles are characterized by different kinetics of drug release. The analysis of release profiles for the investigated systems showed that for the most feasible model, i.e., zero-order kinetics, the values of the R2 parameter are 0.917 for BSA CLB-0.25 NPs, 0.991 for BSA CLB-1 NPs and 0.999 for BSA CLB-1.5 NPs. It probably means that release of CLB does not depend on the concentration. At the same time, the BSA CLB-0.5 NPs and BSA CLB-2 NPs sample release profiles seem to be described by the first-order kinetics model (with R2 = 0.996 and R2 = 0.997, respectively). This discrepancy may be connected with no significant changes in hydrophobicity/hydrophilicity within the CLB environment, which is perfectly consistent with a lack of strong interactions in the system, as suggested previously based on the results of emission and absorption spectroscopy. In addition, the different nanoparticle size distribution and shape modifications in the samples result in a heterogeneous drug release mechanism (Figure 2a–f, Table 1).
Owing to the Korsmeyer–Peppas model for noncylindrical geometry and nonthin film layers of matrices, the values of the diffusional exponent n were found. What is interesting, every sample can be defined by a different drug release mechanism. According to power law, samples BSA CLB-0.5 NPs and BSA CLB-1.5 NPs are described as anomalous transport (0.50 < n < 1) and the mechanism of drug release is diffusion and swelling, where these two processes are comparable. Samples BSA CLB-1 NPs and BSA CLB-2 NPs where n = 1 are defined by the Case II diffusion mechanism wherein release of the drug is forced by swelling or relaxation of cross-linked BSA chains. Based on the n value, it also can be confirmed that the release of CLB from BSA CLB-1 NPs is described by zero-order kinetics [22,23]. BSA CLB-0.25 NPs release the drug in a nonswellable matrix-diffusion mechanism, where the CLB is transported due to quasi-Fickian diffusion. Differences in the results obtained are caused by the different size of each sample, as evidenced by the size and RSD values (Table 3). Moreover, the constant concentration of glurathaldehyde and the varying amount of CLB, which was combined with the carriers at high efficiency (Table 1), may have changed the physicochemical properties of the sample, resulting in interactions and aggregation of the nanoparticles. The entire process may have caused differences in the rate of drug release and its mechanism. Wilson et al. have obtained first-order release kinetics of 5-fluorouracil from BSA nanoparticles with Fickian diffusion [34]. Differences observed between this study (Figure 1 and Table 2) and data from the literature may be caused by using different drugs. As a molecule, 5-fluorouracil has almost three times lower molecular weight than CLB and is hydrophilic, whereas CLB is hydrophobic [34,35]. Additionally, a study using BSA–abacavir nanoparticles showed first-order release kinetics and diffusion-controlled release. As the authors explain, it may be related to the drug binding to nanoparticle surfaces, due to the hydrophilic nature of abacavir [36]. A greater percentage of CLB released, as indicated for the sample BSA CLB-2 NPs, may be caused by the incorporation of CLB and adsorption of the remaining CLB to the surface of the NPs. Furthermore, there is visible inner-particle cross-linking effect, which may cause a different release mechanism. According to Kufleitner et al. [26], obidoxime incorporated into albumin-based nanoparticles showed a slower release profile compared to the NPs with obidoxime adsorbed onto the nanocarrier surface. At the same time, it must be pointed out that the data obtained and the cited literature studies rely on the dialysis method. Among other in vitro tests for release studies, the same methods should be compared due to controversies in the results [37]. For now, there is lack of standardization and universal protocols for in vitro release studies. It may influence the results of mathematical kinetics modeling [37,38].
Circular dichroism (CD) is a spectropolarimetric method that allows for studying the chiral molecules and secondary structure of proteins [39]. In the present study, CD was used to determine changes in the secondary structure of bovine serum albumin (BSA) due to the preparation process, where 51% of the theoretical amount of BSA amino groups had been cross-linked. BSA CLB-0.5 NPs and BSA CLB-1 NPs partially retained their secondary structure while other samples (BSA NPs, BSA CLB-0.25 NPs, BSA CLB-1.5 NPs and BSA CLB-2 NPs) lost peptide bonds and secondary structure. No significant differences between native bovine serum albumin (BSA), BSA CLB-1 NPs and BSA-chlorambucil complex (CLB–BSA) were observed. This probably suggests that in this case CLB did not change the chain of albumin secondary structure. The percentage of β-sheet structure was reduced to zero, except for BSA NPs and BSA CLB-1 NPs. The percentage content of secondary structure elements is comparable for BSA and CLB–BSA samples, which means that CLB does not affect the changes in secondary structure of BSA. The lack of secondary structure for BSA NPs is caused by the cross-linking process due to using 51% of the amino acid residues in the cross-linking reaction, which led to the destruction of the secondary structure in other samples. Moreover, owing to no significant changes observed in the CD spectrum, BSA nanoparticles are still biocompatible as a native albumin. The course of CD spectrum showed that both BSA CLB-0.25 NPs and BSA NPs systems do not have peptide bonds in their structure, and this fact probably means that the protein structure was destroyed or denatured during the preparation process. In contrast to BSA CLB-1 NPs, some peptide bonds were destroyed during denaturation cross-linking using glutaraldehyde processes. It is worth noting that 0.25 mg of CLB in 1 mL of ethanol was not enough to save the secondary structure before the denaturation process. The BSA CLB-0.5 NPs spectrum showed subtle peaks (with low intensity) characteristic for BSA secondary structure, which may indicate that the preparation process is still too aggressive for secondary structure of BSA. On the other hand, adding 0.5 mg of CLB in 1 mL of ethanol and maintaining proportions to glutaraldehyde may be a better solution than 0.25 mg if the secondary structure of the protein needs to be maintained. Interestingly, BSA nanoparticles with the higher concentration of CLB (BSA CLB-1.5 NPs and BSA CLB-2 NPs) also showed no peptide bonds in the structure. It could have been caused by adding too much CLB, which reacted too aggressively in combination with ethanol denaturation or a different mechanism of drug binding to albumin compared to samples with lower CLB concentration. Additionally, these samples showed inner-particle cross-linking (Figure 2e,f) So far, research studies of polymers during the nanoparticle preparation process have not been widely reported. Morozova et al. [40] obtained albumin-based nanoparticles using a nanoprecipitation method without glutaraldehyde, whose secondary structure was preserved; nevertheless, the authors did not provide information concerning the content of BSA secondary structure elements. Ciepluch et al. [12] studied the interaction between cationic poly-(propylene imine) dendrimers and polyethylene glycol (PEG)-albumin, where PEGylation or titration with dendrimers was carried out. Despite modifications, the authors did not observe significant changes in the albumin secondary structure [12]. In the present study, changes in BSA secondary structure may also be related to the amount of drug added. An increase in the percentage of α-helix structure was caused by the cross-linking process. It allowing for the production of glutaraldehyde-stable forms. In connection with this, the effect was not observed in the studies cited, except for Onafuye et al. [25], where only cross-linked nanoparticles were described as stable. Comparing the percentage content of the secondary structure elements of BSA (Table 5) with nanoparticle sizes (Table 3) may suggest dependence between size and changes in secondary structure. The number of α-helices is comparable between BSA CLB-1 NPs (36.7%) and native albumin (36.8%). Additionally, the content of β-sheet and turn are similar for these samples (13.2% β-sheet for BSA and 13.2% β-sheet for BSA CLB-1 NPs; 21.0% turn for BSA and 21.5% turn for BSA CLB-1 NPs). As noted previously, only BSA CLB-1 NPs and BSA CLB-0.5 NPs spectra did not show changes in the chain of albumin secondary structure (Figure 3). Despite that nanoparticle sizes do not differ statistically from each other, it is worth mentioning that the highest median can be noted for the sample BSA CLB-1 NPs (384.5 nm). This finding may suggest that preservation of the secondary structure of the protein could influence the size and its repeatability between individual nanospheres (Figure 1). Additionally, these conclusions should be taken into consideration due to few reports on the use of CD in the analysis of changes in the secondary structure of the biopolymer chain after conjugation/encapsulation with the drug.
Changes in absorption maximum spectra or fluorescence emission maximum are connected with changes in a fluorophores’ environment. Spectral shift toward lower wavelengths is called a blueshift, whereas shift toward longer wavelengths is called a redshift. This relation may be observed in drug delivery systems research and depends on the character of drug molecules and the place where the drug binds to the polymeric nanocarriers. In the present study, spectral shift depends on the amount of added CLB (Figure 4 and Figure 5). Changes in polarity occur due to the modifications in environment polarity of the drug, which may be connected with different sites of binding. Huge blueshift in absorption spectra was also observed in the study of polymeric nanoparticles with curcumin, which suggests the presence of the strongly hydrophobic curcumin environment [41]. This phenomenon is common with polymeric micelles [42,43]. Alves et al. [44] observed redshift on the UV–Vis spectrum after encapsulation of IR780 into BMA-g-BSA nanoparticles.
Emission and absorption spectroscopy are convenient methods that allow for estimating the location of a drug in nanocarriers. Similar to the present work, many researchers have successfully confirmed the formation of carrier–drug conjugate using high concentrations of drugs, such as 4 mg × mL−1 and 10 mg × mL−1 [45,46,47]. Despite only a few reports concerning the use of spectrofluorometric methods to study changes in the environment of the drug encapsulated into the carrier, emission spectroscopy is widely used in ligand–protein interaction studies. Based on the study by Owczarzy et al. [48], redshift of the fluorescence band was observed after exposure of human gamma globulin and control normal serum into 5-methyl-12(H)-quino [3,4-b][1,4]benzothiazinium chloride (Salt1). Moreover, Maciążek-Jurczyk et al. [49] investigated different shifts of fluorescence emission spectra, which were probably caused by exposure of tryptophanyl and tyrosyl residues of oxidized HSA to the solvent. Using similar methods, Banerjee et al. [41] confirmed curcumin encapsulation into a polymeric matrix.
5. Conclusions
The main aim of this study was to prepare and characterize bovine serum albumin (BSA) nanoparticles with encapsulated chlorambucil (CLB) through the desolvation method. Spectroscopic techniques and scanning electron microscopy (SEM) imaging were applied for the nanoparticle characterization.
The desolvation method with ethanol was used as a denaturation factor and glutaraldehyde was the cross-linking agent. These conditions were found suitable for the preparation of stable spherical formulations. The release profiles of CLB were described by the zero-order kinetics model (except for two samples, for which first-order kinetics were applied). The differences in possible interactions between biopolymer and the drug depending on the amount of the former in the system were discussed.
The results show that albumin nanoparticles may be a promising candidate for the development of a controlled drug release system or even simultaneous drug and protein delivery. However, further work is required to develop these solutions.
Author Contributions
Writing—original draft preparation, K.K.; supervision, editing and linguistic assistance, M.M.-J.; SEM experiment investigation, M.Z.; SEM experiment investigation, review and data discussion, linguistic assistance, K.P.; fluorescence and UV–Vis spectroscopy experiment investigation, K.K.; CD spectroscopy experiment investigation, K.K.; formal analysis, A.O. and W.R. All authors have read and agreed to the published version of the manuscript.
Funding
This research was funded by Medical University of Silesia, grant number KNW-1-033/N/9/O, KNW-2-O-25/N/9/N, PCN-2-007/N/0/F, PCN-2-010/N/1/F, PCN-2-008/N/1/F, PCN-2-009/K/1/F, PCN-2-033/N/1/F, and PCN-1-031/K/1/F.
Institutional Review Board Statement
Not applicable.
Informed Consent Statement
Not applicable.
Data Availability Statement
Not applicable.
Acknowledgments
We thank Jadwiga Pożycka for the invaluable help with getting the first author’s feet wet in spectroscopic study. Moreover, the authors thank Kapela Pilaka for fruitful discussions and much valuable advice.
Conflicts of Interest
The authors declare no conflict of interest.
References
- Han, C.; Huang, H.; Dong, Y.; Sui, X.; Jian, B.; Zhu, W. A Comparative Study of the Use of Mesoporous Carbon and Mesoporous Silica as Drug Carriers for Oral Delivery of the Water-Insoluble Drug Carvedilol. Molecules 2019, 24, 1770. [Google Scholar] [CrossRef] [PubMed] [Green Version]
- Suchonwanit, P.; Thammarucha, S.; Leerunyakul, K. Minoxidil and its use in hair disorders: A review. Drug Des. Devel. Ther. 2019, 13, 2777–2786. [Google Scholar] [CrossRef] [PubMed] [Green Version]
- Abd El Hady, W.E.; Mohamed, E.A.; Soliman, O.A.E.; El-Sabbagh, H.M. In vitro-in vivo evaluation of chitosan-PLGA nanoparticles for potentiated gastric retention and anti-ulcer activity of diosmin. Int. J. Nanomed. 2019, 14, 7191–7213. [Google Scholar] [CrossRef] [PubMed] [Green Version]
- Das, R.P.; Singh, B.G.; Kunwar, A.; Priyadarsini, K.I. Interaction of a Model Hydrophobic Drug Dimethylcurcumin with Albumin Nanoparticles. Protein J. 2019, 38, 649–657. [Google Scholar] [CrossRef] [PubMed]
- Kalepu, S.; Nekkanti, V. Insoluble drug delivery strategies: Review of recent advances and business prospects. Acta Pharm. Sin. B 2015, 5, 442–453. [Google Scholar] [CrossRef] [PubMed] [Green Version]
- Najahi-Missaoui, W.; Arnold, R.D.; Cummings, B.S. Safe Nanoparticles: Are We There Yet? Int. J. Mol. Sci. 2020, 22, 385. [Google Scholar] [CrossRef]
- Seixas, N.; Ravanello, B.B.; Morgan, I.; Kaluđerović, G.N.; Wessjohann, L.A. Chlorambucil Conjugated Ugi Dendrimers with PAMAM-NH₂ Core and Evaluation of Their Anticancer Activity. Pharmaceutics 2019, 1, 59. [Google Scholar] [CrossRef] [Green Version]
- Liu, C.; Li, H.; Li, P.; Liu, C.; Bai, Y.; Pang, J.; Wang, J.; Tian, W. A dual drug-based hyperbranched polymer with methotrexate and chlorambucil moieties for synergistic cancer chemotherapy. Polym. Chem. 2020, 11, 5810–5818. [Google Scholar] [CrossRef]
- Saufi, A.N.M.; Ridzwan, N.F.W.; Mohamad, S.B.; Tayyab, S.; Halim, A.A.A. Fluorometric and Docking Analysis of the Complex Formation between an Anti-Cancer Drug, Chlorambucil and Bovine Serum Albumin. Indian J. Pharm. Educ. Res. 2019, 53, 682–687. [Google Scholar] [CrossRef] [Green Version]
- Dandrieux, J.R.; Noble, P.J.; Scase, T.J.; Cripps, P.J.; German, A.J. Comparison of a chlorambucil-prednisolone combination with an azathioprine-prednisolone combination for treatment of chronic enteropathy with concurrent protein-losing enteropathy in dogs: 27 cases (2007–2010). J. Am. Vet. Med. Assoc. 2013, 242, 1705–1714. [Google Scholar] [CrossRef]
- Piazzini, V.; Landucci, E.; D’Ambrosio, M.; Tiozzo Fasiolo, L.; Cinci, L.; Colombo, G.; Pellegrini-Giampietro, D.E.; Bilia, A.R.; Luceri, C.; Bergonzi, M.C. Chitosan coated human serum albumin nanoparticles: A promising strategy for nose-to-brain drug delivery. Int. J. Biol. Macromol. 2019, 129, 267–280. [Google Scholar] [CrossRef] [PubMed]
- Ciepluch, K.; Biehl, R.; Bryszewska, M.; Arabski, M. Poly(propylene imine) dendrimers can bind to PEGylated albumin at PEG and albumin surface: Biophysical examination of a PEGylated platform to transport cationic dendritic nanoparticles. Biopolymers 2020, 111, 23386. [Google Scholar] [CrossRef] [PubMed]
- Alavi, M.; Hamidi, M. Passive and active targeting in cancer therapy by liposomes and lipid nanoparticles. Drug Metab. Pers. Ther. 2019, 34, 1. [Google Scholar] [CrossRef] [PubMed]
- Li, H.; Quan, J.; Zhang, M.; Yung, B.C.; Cheng, X.; Liu, Y.; Lee, Y.B.; Ahn, C.H.; Kim, D.J.; Lee, R.J. Lipid-Albumin Nanoparticles (LAN) for Therapeutic Delivery of Antisense Oligonucleotide against HIF-1α. Mol. Pharm. 2016, 13, 2555–2562. [Google Scholar] [CrossRef] [PubMed]
- Notabi, M.K.; Arnspang, E.C.; Andersen, M.Ø. Antibody conjugated lipid nanoparticles as a targeted drug delivery system for hydrophobic pharmaceuticals. Eur. J. Pharm. Sci. 2021, 161, 105777. [Google Scholar] [CrossRef]
- Amighi, F.; Emam-Djomeh, Z.; Labbafi-Mazraeh-Shahi, M. Effect of different cross-linking agents on the preparation of bovine serum albumin nanoparticles. J. Iran. Chem. Soc. 2020, 17, 1223–1235. [Google Scholar] [CrossRef]
- Delrue, I.; Verzele, D.; Madder, A.; Nauwynck, H.J. Inactivated virus vaccines from chemistry to prophylaxis: Merits, risks and challenges. Expert Rev. Vaccines 2012, 11, 695–719. [Google Scholar] [CrossRef] [Green Version]
- Dreis, S.; Rothweiler, F.; Michaelis, M.; Cinatl, J., Jr.; Kreuter, J.; Langer, K. Preparation, characterization and maintenance of drug efficacy of doxorubicin-loaded human serum albumin (HSA) nanoparticles. Int. J. Pharm. 2007, 341, 207–214. [Google Scholar] [CrossRef]
- Mazzaferro, E.M.; Edwards, T. Update on Albumin Therapy in Critical Illness. Vet. Clin. N. Am. Small Anim. Pract. 2020, 50, 1289–1305. [Google Scholar] [CrossRef]
- Langer, K.; Balthasar, S.; Vogel, V.; Dinauer, N.; von Briesen, H.; Schubert, D. Optimization of the preparation process for human serum albumin (HSA) nanoparticles. Int. J. Pharm. 2003, 12, 169–180. [Google Scholar] [CrossRef]
- Yedomon, B.; Fessi, H.; Charcosset, C. Preparation of Bovine Serum Albumin (BSA) nanoparticles by desolvation using a membrane contactor: A new tool for large scale production. Eur. J. Pharm. Biopharm. 2013, 85, 398–405. [Google Scholar] [CrossRef]
- Bruschi, M.L. Strategies to Modify the Drug Release from Pharmaceutical Systems; Woodhead Publishing: Cambridge, UK, 2015. [Google Scholar]
- Peppas, N.A.; Sahlin, J.J. A simple equation for the description of solute release. III. Coupling of diffusion and relaxation. Int. J. Pharm. 1989, 57, 169–172. [Google Scholar] [CrossRef]
- Kutchukian, P.S.; Yang, J.S.; Verdine, G.L.; Shakhnovich, E.I. All-atom model for stabilization of alpha-helical structure in peptides by hydrocarbon staples. J. Am. Chem. Soc. 2009, 131, 4622–4627. [Google Scholar] [CrossRef] [PubMed] [Green Version]
- Onafuye, H.; Pieper, S.; Mulac, D.; Cinatl, J., Jr.; Wass, M.N.; Langer, K.; Michaelis, M. Doxorubicin-loaded human serum albumin nanoparticles overcome transporter-mediated drug resistance in drug-adapted cancer cells. Beilstein J. Nanotechnol. 2019, 14, 1707–1715. [Google Scholar] [CrossRef] [PubMed] [Green Version]
- Kufleitner, J.; Worek, F.; Kreuter, J. Incorporation of obidoxime into human serum albumin nanoparticles: Optimization of preparation parameters for the development of a stable formulation. J. Microencapsul. 2010, 27, 594–601. [Google Scholar] [CrossRef] [PubMed]
- Gao, H.; Cao, S.; Yang, Z.; Zhang, S.; Zhang, Q.; Jiang, X. Preparation,-Characterization and Anti-Glioma Effects of Docetaxel-Incorporated Albumin-Lipid Nanoparticles. J. Biomed. Nanotechnol. 2015, 11, 2137–2147. [Google Scholar] [CrossRef]
- Kufleitner, J.; Wagner, S.; Worek, F.; von Briesen, H.; Kreuter, J. Adsorption of obidoxime onto human serum albumin nanoparticles: Drug loading, particle size and drug release. J. Microencapsul. 2010, 27, 506–513. [Google Scholar] [CrossRef]
- Kim, B.; Seo, B.; Park, S.; Lee, C.; Kim, J.O.; Oh, K.T.; Lee, E.S.; Choi, H.G.; Youn, Y.S. Albumin nanoparticles with synergistic antitumor efficacy against metastatic lung cancers. Colloids Surf. B Biointerfaces 2017, 158, 157–166. [Google Scholar] [CrossRef]
- Ma, P.; Mumper, R.J. Paclitaxel Nano-Delivery Systems: A Comprehensive Review. J. Nanomed. Nanotechnol. 2013, 4, 1000164. [Google Scholar] [CrossRef] [Green Version]
- Yellepeddi, V.K.; Joseph, A.; Nance, E. Pharmacokinetics of nanotechnology-based formulations in pediatric populations. Adv. Drug Deliv. Rev. 2019, 151, 44–55. [Google Scholar] [CrossRef]
- European Medicines Agency. Available online: https://www.ema.europa.eu/en/documents/comments/overview-comments-received-pegylated-liposomal-doxorubicin-hydrochloride-concentrate-solution-2-mg/ml-product-specific-bioequivalence-guidance-ema/chmp/800775/2017_en.pdf (accessed on 1 April 2022).
- European Medicines Agency. Available online: https://www.ema.europa.eu/en/documents/product-information/optison-epar-product-information_en.pdf (accessed on 1 April 2022).
- Wilson, B.; Ambika, T.V.; Patel, R.D.; Jenita, J.L.; Priyadarshini, S.R. Nanoparticles based on albumin: Preparation, characterization and the use for 5-flurouracil delivery. Int. J. Biol. Macromol. 2012, 51, 874–878. [Google Scholar] [CrossRef] [PubMed]
- Fang, S.; Niu, Y.; Zhu, W.; Zhang, Y.; Yu, L.; Li, X. Liposomes assembled from a dual drug-tailed phospholipid for cancer therapy. Chem. Asian. J. 2015, 10, 1232–1238. [Google Scholar] [CrossRef] [PubMed]
- Wilson, B.; Paladugu, L.; Priyadarshini, S.R.; Jenita, J.J. Development of albumin-based nanoparticles for the delivery of abacavir. Int. J. Biol. Macromol. 2015, 81, 763–767. [Google Scholar] [CrossRef] [PubMed]
- Weng, J.; Tong, H.H.Y.; Chow, S.F. In Vitro Release Study of the Polymeric Drug Nanoparticles: Development and Validation of a Novel Method. Pharmaceutics 2020, 12, 732. [Google Scholar] [CrossRef]
- Modi, S.; Anderson, B.D. Determination of Drug Release Kinetics from Nanoparticles: Overcoming Pitfalls of the Dynamic Dialysis Method. Mol. Pharm. 2013, 10, 3076–3089. [Google Scholar] [CrossRef]
- Yao, H.; Wynendaele, E.; Xu, X.; Kosgei, A.; De Spiegeleer, B. Circular dichroism in functional quality evaluation of medicines. J. Pharm. Biomed. Anal. 2018, 5, 50–64. [Google Scholar] [CrossRef]
- Morozova, O.V.; Pavlova, E.R.; Bagrov, D.V.; Barinov, N.A.; Prusakov, K.A.; Isaeva, E.I.; Podgorsky, V.V.; Basmanov, D.V.; Klinov, D.V. Protein nanoparticles with ligand-binding and enzymatic activities. Int. J. Nanomed. 2018, 13, 6637–6646. [Google Scholar] [CrossRef] [Green Version]
- Banerjee, C.; Maiti, S.; Mustafi, M.; Kuchlyan, J.; Banik, D.; Kundu, N.; Dhara, D.; Sarkar, N. Effect of Encapsulation of Curcumin in Polymeric Nanoparticles: How Efficient to Control ESIPT Process? Langmuir 2014, 30, 10834–10844. [Google Scholar] [CrossRef]
- Banerjee, C.; Ghosh, S.; Mandal, S.; Kuchlyan, J.; Kundu, N.; Sarkar, N. Exploring the Photophysics of Curcumin in Zwitterionic Micellar System: An Approach to Control ESIPT Process in the Presence of Room Temperature Ionic Liquids (RTILs) and Anionic Surfactant. J. Phys. Chem. B 2014, 118, 3669–3681. [Google Scholar] [CrossRef]
- Adhikary, R.; Carlson, P.J.; Kee, T.W.; Petrich, J.W. Excited-State Intramolecular Hydrogen Atom Transfer of Curcumin in Surfactant Micelles. J. Phys. Chem. B 2010, 114, 2997–3004. [Google Scholar] [CrossRef] [Green Version]
- Alves, C.G.; de Melo-Diogo, D.; Lima-Sousa, R.; Correia, I.J. IR780 loaded sulfobetaine methacrylate-functionalized albumin nanoparticles aimed for enhanced breast cancer phototherapy. Int. J. Pharm. 2020, 30, 119346. [Google Scholar] [CrossRef] [PubMed]
- Su, C.; Liu, S.; Cao, S.; Yin, S.; Zhou, C.; Gao, S.; Jia, C.; Ji, Y.; Liu, Y. Self-assembled bovine serum albumin nanoparticles as pesticide delivery vectors for controlling trunk-boring pests. J. Nanobiotechnol. 2020, 18, 165. [Google Scholar] [CrossRef] [PubMed]
- Sun, S.; Xiao, Q.R.; Wang, Y.; Jiang, Y. Roles of alcohol desolvating agents on the size control of bovine serum albumin nanoparticles in drug delivery system. J. Drug Deliv. Sci. Technol. 2018, 47, 193–199. [Google Scholar] [CrossRef]
- Bronze-Uhle, E.S.; Costa, B.C.; Ximenes, V.F.; Lisboa-Filho, P.N. Synthetic nanoparticles of bovine serum albumin with entrapped salicylic acid. Nanotechnol. Sci. Appl. 2016, 10, 11–21. [Google Scholar] [CrossRef] [Green Version]
- Owczarzy, A.; Zięba, A.; Pożycka, J.; Kulig, K.; Rogóż, W.; Szkudlarek, A.; Maciążek-Jurczyk, M. Spectroscopic Studies of Quinobenzothiazine Derivative in Terms of the In Vitro Interaction with Selected Human Plasma Proteins. Part 1. Molecules 2021, 26, 4776. [Google Scholar] [CrossRef]
- Maciążek-Jurczyk, M.; Morak-Młodawska, B.; Jeleń, M.; Kopeć, W.; Szkudlarek, A.; Owczarzy, A.; Kulig, K.; Rogóż, W.; Pożycka, J. The Influence of Oxidative Stress on Serum Albumin Structure as a Carrier of Selected Diazaphenothiazine with Potential Anticancer Activity. Pharmaceuticals 2021, 14, 285. [Google Scholar] [CrossRef]

Publisher’s Note: MDPI stays neutral with regard to jurisdictional claims in published maps and institutional affiliations. |
© 2022 by the authors. Licensee MDPI, Basel, Switzerland. This article is an open access article distributed under the terms and conditions of the Creative Commons Attribution (CC BY) license (https://creativecommons.org/licenses/by/4.0/).