Article

Investigation on Vibration Signal Characteristics in a Centrifugal Pump Using EMD-LS-MFDFA

Jiangxi Province Key Laboratory of Precision Drive and Control, Nanchang Institute of Technology, Nanchang 330099, China
*
Author to whom correspondence should be addressed.
Processes 2022, 10(6), 1169; https://doi.org/10.3390/pr10061169
Submission received: 24 May 2022 / Revised: 7 June 2022 / Accepted: 8 June 2022 / Published: 10 June 2022
(This article belongs to the Special Issue Design and Optimization Method of Pumps)

Abstract

:
Vibration signals from centrifugal pumps are nonlinear, non-smooth, and possess implied trend terms, which makes it difficult for traditional signal processing methods to accurately extract their fault characteristics and details. With a view to rectifying this, we introduced empirical mode decomposition (EMD) to extract the trend term signals. These were then refit using the least squares (LS) method. The result (EMD-LS) was then combined with multi-fractal theory to form a new signal identification method (EMD-LS-MFDFA), whose accuracy was verified with a binomial multi-fractal sequence (BMS). Then, based on the centrifugal pump test platform, the vibration signals of shell failures under different degrees of cavitation and separate states of loosened foot bolts were collected. The signals’ multi-fractal spectra parameters were analyzed using the EMD-LS-MFDFA method, from which five spectral parameters ( Δ α , Δ f , α 0 , α max , and α min ) were extracted for comparison and analysis. The results showed EMD-LS-MFDFA’s performance was closer to the BMS theoretical value than that of MFDFA, displayed high accuracy, and was fully capable of revealing the multiple fractal characteristics of the centrifugal pump fault vibration signal. Additionally, the mean values of the five types of multi-fractal spectral characteristic parameters it extracted were much greater than the normal state values. This indicates that the parameters could effectively distinguish the normal state and fault state of the centrifugal pump. Moreover, α 0 and α max had a smaller mean square than Δ α , Δ f and α min , and their stability was higher. Thus, compared to the feature parameters extracted by MFDFA, our method could better realize the separation between the normal state, cavitation (whether slight, moderate, or severe), and when the anchor bolt was loose. This can be used to characterize centrifugal pump failure, quantify and characterize a pump’s different working states, and provide a meaningful reference for the diagnosis and study of pump faults.

1. Introduction

Pumps are a form of mechanical equipment widely used in industrial and agricultural applications, and their operational safety and reliability have been the focus of many researchers. It is generally believed that a pump’s vibration signal contains a large amount of state information which can objectively reflect most of its operating conditions [1]. Therefore, studies concerning the application of signal analysis methods for pump fault diagnosis, especially those based on spectral analysis, are increasing. For example, Li Jing et al. [2] introduced wavelet packet characteristic frequency band analysis to extract energy values to characterize cavitation signals, with test results demonstrating good effects. Furthermore, Zhou et al. [3] used empirical modal decomposition combined with the Hilbert transform to obtain modal energy ratios and successfully construct the fault characteristics of centrifugal pump vibration signals. Moreover, Duan Xiangyang et al. [4] applied slice bi-spectrum analysis to extract the relevant frequencies and fully classify fault signals.
However, because the actual operation of the pump is affected by, amongst other considerations, various hydraulic, mechanical, electrical, and even control factors, its vibration signal is non-linear and non-stationary in character, and prone to changes in trends. Although spectrum analysis and other methods can extract fault characteristics to a certain extent, they nonetheless suffer from a number of inherent defects. For example, Fourier transform is not suitable for non-smooth signals due to suitable wavelet base selection difficulties, among other reasons. Therefore, the extracted results of fault characteristics are usually inaccurate. Especially, when the fault signals are mixed and overlapping, the time–frequency method does not always effectively extract results. The fractal method provides new ideas for the identification of pump vibration signals. Logan and Purkait et al. [5,6] showed the fractal nature of fault vibration signals, demonstrating that the use of fractal methods could lead to a more accurate extraction of nonlinear non-stationary signal features. For this reason, a lot of research has been conducted on fractals. Pertinent to this investigation, the multiple fractal detrended fluctuation analysis method (MFDFA), as proposed by Kantelhardt et al. [7], has been shown to describe the irregularity and self-similarity of fault signals both locally and as a whole. Furthermore, the method can quantitatively reflect the fractal characteristics of fault signals in different states, and thus carry out fault diagnosis. Building upon this, Lin et al. [8] used this technique to effectively extract gearbox fault features and achieve the separation of similar fault modes. Meanwhile, Li et al. [9] demonstrated how MFDFA could extract multiple fractal characteristics of vibration signals, and used this method to effectively distinguish fault states. However, MFDFA is disadvantaged by a local trend term which cannot be accurately removed. To solve this problem, Martínez et al. [10], Lai et al. [11] and others introduced polynomial trigonometric functions to improve the analysis of multiple fractal detrend fluctuations, and achieved good results from this approach. Therefore, with a view to obtain more accurate multi-fractal characteristics and to build on this previous work, this paper introduces the EMD trend term’s automatic determination criterion for extraction from a fault signal. This is combined with the least squares method to refit the trend term and accurately remove it, upon which the multi-fractal analysis method of EMD-LS-MFDFA is proposed and its accuracy verified using the binomial multi-fractal sequence (BMS) with theoretical values. Five characteristic parameters of the multi-fractal spectra are extracted and analyzed for centrifugal pump fault vibration signals containing normal operating conditions, slight cavitation, moderate cavitation, severe cavitation, and a loose foot bolt. The results show the multi-fractal spectra characteristic parameters extracted by this method could achieve fault state separation and provide a new method for extracting fault features relevant to centrifugal pumps.

2. A Review of the EMD-LS-MFDFA Method

2.1. EMD-LS Fitting Trend Terms

Although both EMD and LS can achieve trend term extraction [12,13], both of them have their own shortcomings. Firstly, EMD cannot completely decompose signals, which leads to problems including modal confusion and endpoint effects. Meanwhile, LS requires certain prior knowledge and is more influenced by the original signal [14]. For these reasons, this paper combines the two, using the EMD determination criterion [15] to obtain the trend term and then perform a LS fitting. This process has the potential to overcome the defects of modal aliasing and endpoint effects, as well as effectively avoid the original signal’s influence on the accuracy of the LS fitting. For the original signal x ( i ) ( i = 1 , 2 , , N ) , the fitting process of trend terms by EMD-LS can be expressed as:
x ( i ) = j = 1 n c j ( i ) + r n ( i )
In Equation (1), n is the number of intrinsic mode functions (IMFs) decomposed out of x ( i ) by EMD according to its own scale characteristics, c j ( i ) is the j th IMF component ( j = 1 , 2 , , n ) , and r n ( i ) is the residual component of the signal.
Ideally, r n ( i ) is used as the final trend term of the original signal [16]. However, in practice, it also contains some low-frequency IMF components, and if r n ( i ) is used as the final trend term in isolation, there will be a large error. Therefore, if the residual component is set as the last IMF component, given the trend term of the original signal may be the sum of the IMF components (from T th to the last), it can be expressed as follows:
M ( i ) = j = T n c j ( i )
For determining the value of T , an automatic criterion for EMD trend terms is introduced, which can be written as follows:
Z = j = T n + 1 i = 0 N c j ( i ) i = 0 N x ( i )
According to the EMD theory, all means of IMF components are zero, so the theoretical value of Z is equal to 1. Given the effect of accidental factors of actual signals, etc., a confidence interval of 95% is taken, that is, the signals are divided into the effective IMF components c j ( i )   ( j = 1 , 2 , , T 1 ) and trend term M ( i ) by Z = 0.95 . Furthermore, M ( i ) is fitted into a K -ordered polynomial using the least squares theory:
w ( i ) = k = 1 K b k a k
In Equation (4), a = i / f , b k is the trend term coefficient. To solve b k , the error function is defined as follows, according to the least squares method:
E ( h ) = i = 1 N [ x ( i ) w ( i ) ] 2 = i = 1 N [ x ( i ) k = 0 K b k a k ] 2
The minimum of E ( h ) is solved by the principle of LS and, in Equation (5), the partial derivative of b l ( l = 0 , 1 , 2 , , K ) is found and defined as 0. Then:
E b l = i = 1 N 2 [ x ( i ) k = 0 K b k a k ] [ a l ] = 0
Solving the trend term coefficient matrix listed in Equation (6) allows the determination of the value of b k , so we can obtain the fitting curve of the trend term. After that, the final trend term extracted by EMD-LS can be stated:
R ( i ) = M ( i ) w ( i )

2.2. EMD-LS-MFDFA Method

Here, EMD-LS ensures the trend terms of the vibration signal time series are accurately obtained by MFDFA at different scales, thereby extracting the multi-fractal characteristics. Assuming the vibration signal time series is x ( k ) , k = 1 , 2 , 3 , N , the cumulative deviation of vibration signal time series x ( k ) can be calculated to build a new series Y ( i ) as follows:
Y ( i ) = k = 1 i ( x ( k ) x ¯ )
where x ¯ is the mean value of the time series.
Then, Y ( i ) is divided into subintervals of equal length. Said length can be expressed as s ( k + 2 s N / 4 ) , with a total of m = N / s subintervals (where N is the data length of Y ( i ) ). To ensure m is an integer, Y ( i ) is divided again from the opposite direction, that is, to obtain 2 m subintervals.
The EMD-LS method is used to fit the data of the v th subinterval to obtain R v ( i ) , eliminate the v th subinterval’s local trend, and calculate the mean squared error of the v th subinterval data with R v ( i ) .
When v = 1 , 2 m , the mean squared error can be written as:
F 2 ( s , v ) = 1 s i = 1 s { Y [ ( v 1 ) s + i ] R v ( i ) } 2
and when v = m + 1 , m + 2 2 m , the mean squared error can be written as:
F 2 ( s , v ) = 1 s i = 1 s { Y [ ( N ( v m ) ) s + i ] R v ( i ) } 2
For 2 m intervals, find out the mean of the mean squared errors to obtain the q -order wave function, as below:
F q ( s ) = { 1 2 m v = 1 2 m [ F 2 ( s , v ) ] q / 2 } 1 / q
Equation (11) has an intuitive physical definition in which different values of q describe the effect of different degrees of volatility on the function F q ( s ) [17]. The magnitude of F q ( s ) depends primarily on the fluctuation bias F2(s, v). Therefore, F2(s, v) can eliminate the trend of each small segment by virtue of the fit of the trend term between each narrow range, which is more conducive to the identification of the singularity of local fluctuations.
If the time series had self-similar characteristics, the wave function F q ( s ) and s form the power law relationship:
F q ( s ) s h ( q )
where h ( q ) is the generalized Hurst index. The resulting slope of the least squares fit F q ( s ) to the scale s is the value of h ( q ) . When h ( q ) varies with the value of q , x ( k ) has a multi-fractal characteristic. Otherwise, it is a single fractal characteristic.
After judging that the signals have multifractal characteristics, the relationship between the generalized Hurst index h ( q ) and the quality index τ ( q ) of signals is as follows:
τ ( q ) = q h ( q ) 1
In addition, by using the Legendre transformation, the singularity index α and multifractal spectrum f ( α ) describing the fractal characteristics of signals can be derived:
α = h ( q ) + q d h ( q ) d q
f ( α ) = q [ α h ( q ) ] + 1

3. Accuracy Analysis

The classical binomial multi-fractal sequence can be used to obtain results via the theoretical analytical formula [18,19,20]. Thus, for this work, the EMD-LS-MFDFA and MFDFA methods were applied to process the sequence and a comparison of the computational results verified the accuracy of the proposed technique. The classical binomial multi-fractal sequence was generated from the following equation:
x i = ( p 1 p ) n ( i 1 ) ( 1 p ) n max
The main parameters for generating this sequence were n max and p , while n ( i ) denoted the number of 1′s in the binary representation of the i th indicator. In the next comparative analysis, the parameters selected were p = 0.3 and n max = 10 , which generated a binomial multi-fractal sequence of length 1024, while the length of the subintervals s was chosen from within the range of 4 to 256.
The quality index τ ( q ) of this sequence was related to the parameter p and order q , as follows:
τ ( q ) = ln ( p q + ( 1 p ) q ) ln 2
Among them, the generalized Hurst index h ( q ) , the singularity index α , and multi-fractal spectrum f ( α ) were calculated using Equations (13)–(15). The results of the theoretical values obtained from these calculations are shown in Figure 1, which shows the differences between the Hurst and mass indices obtained by the two different algorithms. It is clear the EMD-LS-MFDFA method results were closer to the zero point and therefore were more accurate.
The singular exponent α and multi fractal spectral function f ( α ) can be obtained from the EMD-LS-MFDFA analysis of the vibration signals. From α and f ( α ) , important parameters [21] can be derived to accurately describe the dynamic behavior of multiple fractal time series. These important parameters can be used as fault signature quantities to extract signal fault characteristics, and are described as follows:
(1)
When the singular exponent α corresponds to f max ( α ) , the extremum point α 0 can express the irregularity of the signal, and the larger α 0 is, the greater the degree of irregularity of the signal;
(2)
The larger the width of the multi-fractal spectrum Δ α = α max α min , the clearer the multi-fractal characteristics of the signal and the more substantial the signal fluctuations. Additionally, the left endpoint α min and right endpoint α max correspond to the singular indices where the fluctuation is the largest and smallest, respectively;
(3)
The multiple fractal spectral difference Δ f = f ( α max ) f ( α min ) reflects the proportion of the peak of the signal fluctuation to that of the fluctuation stationary, and the greater the proportion, the greater the signal volatility.

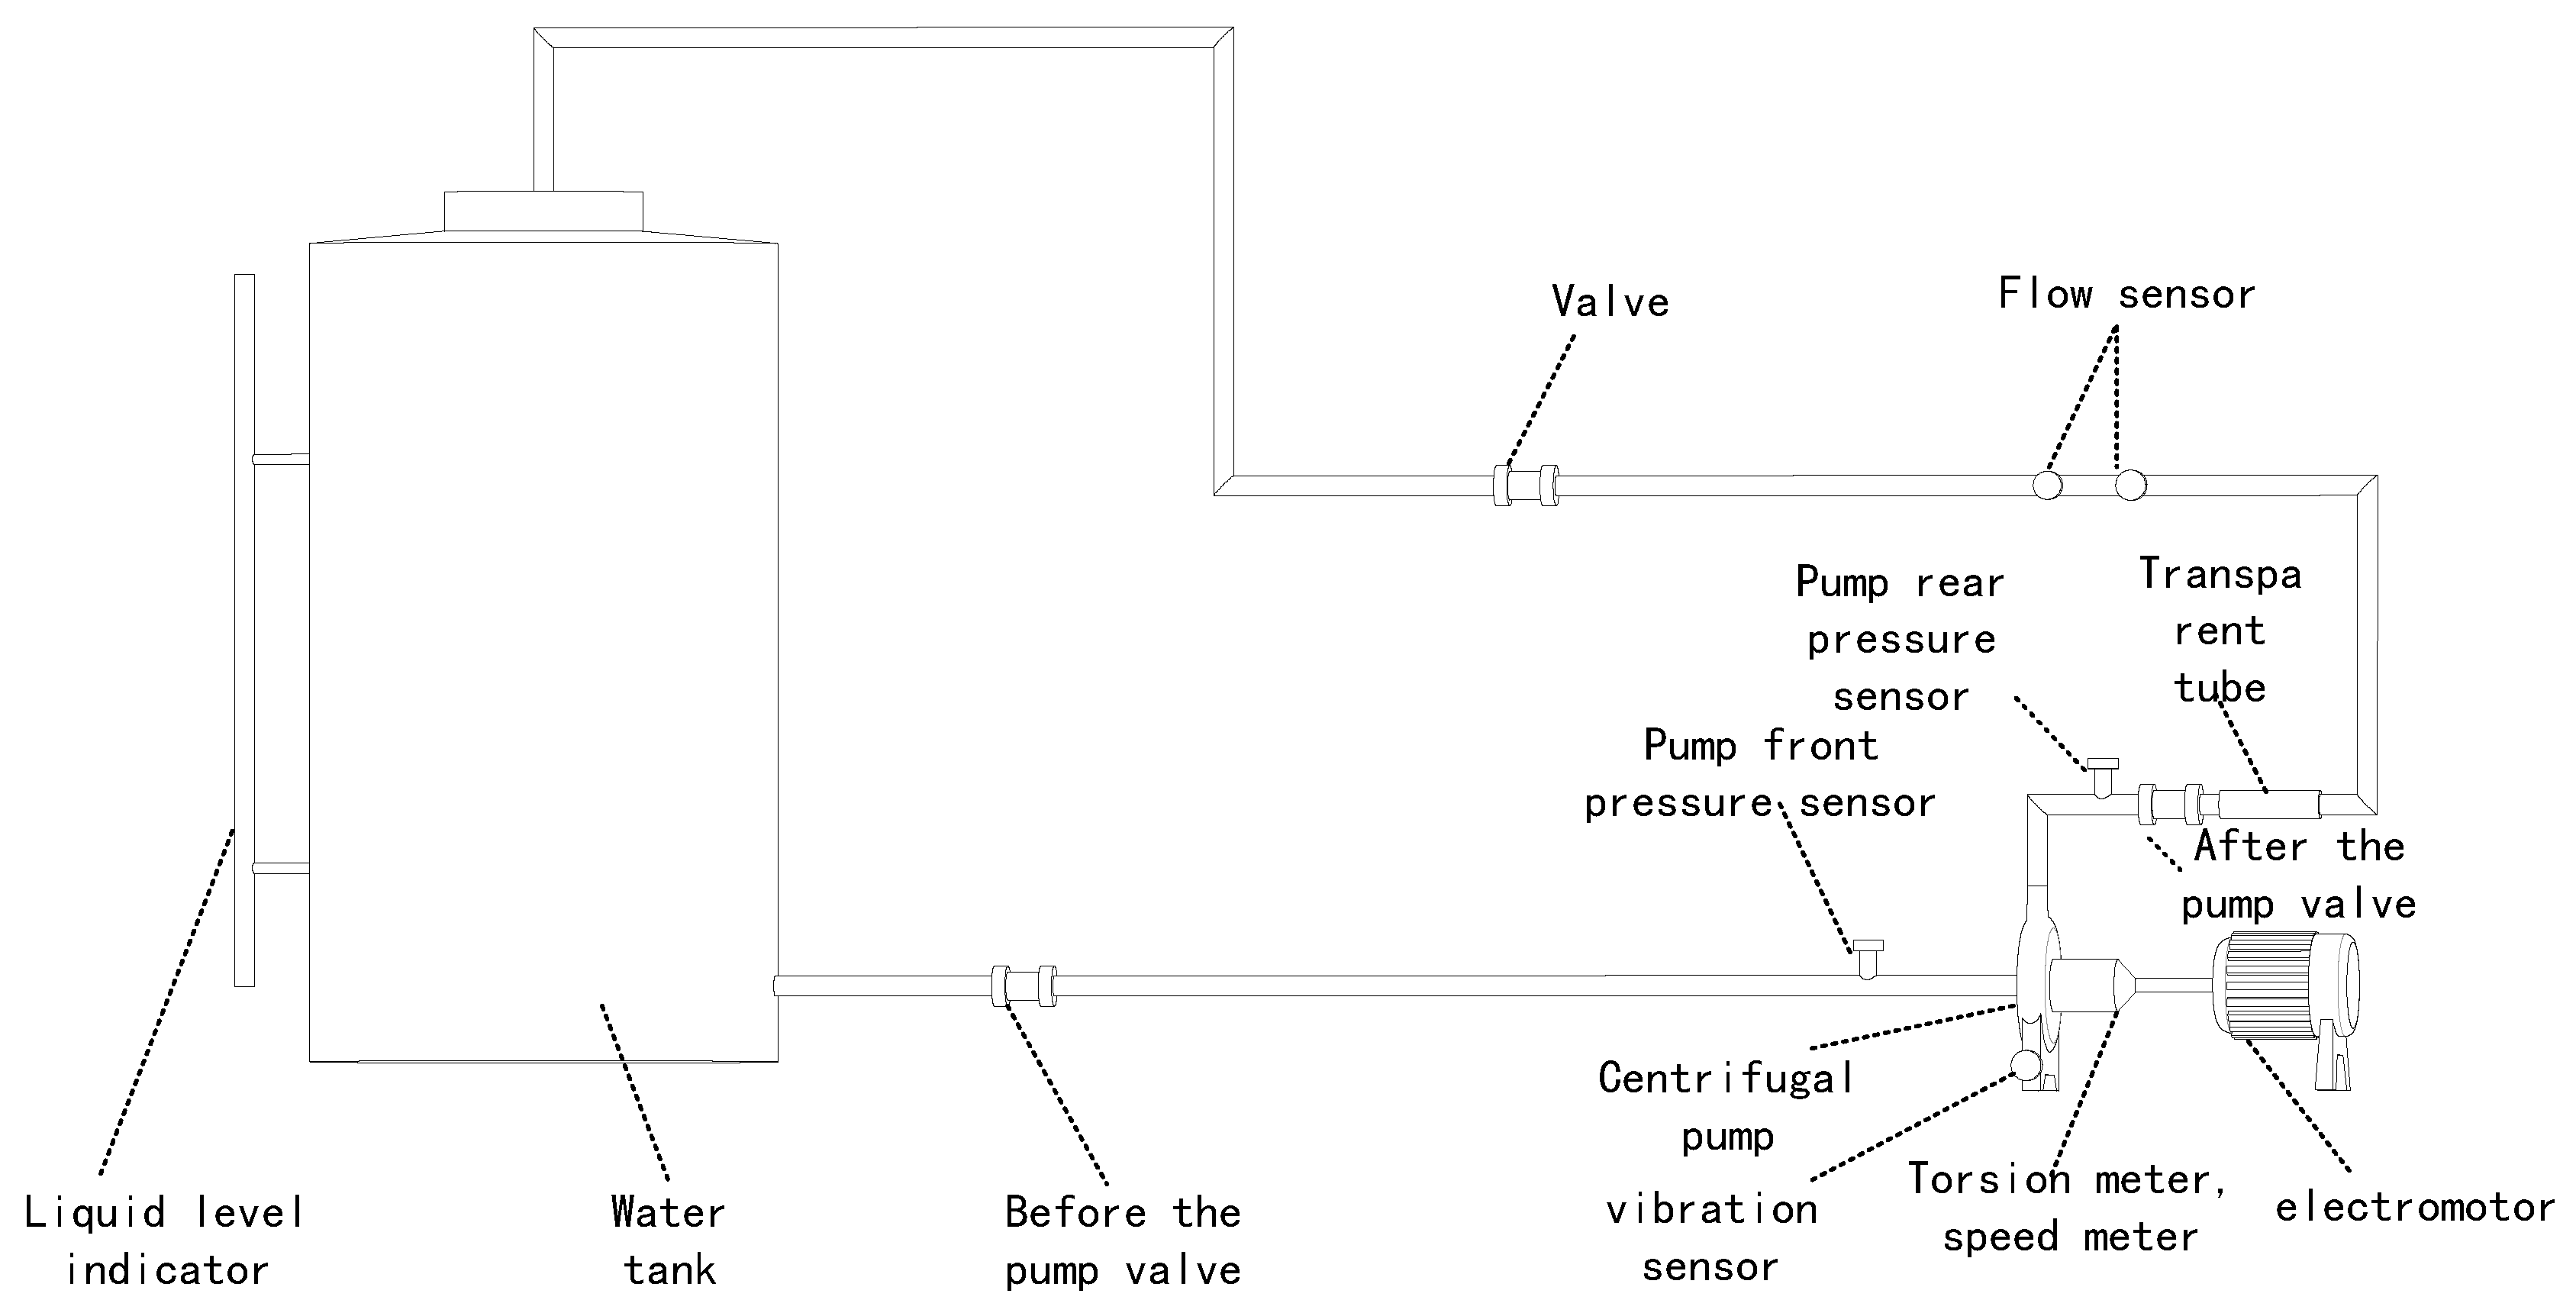
4. Experimental Setup and Fault Data
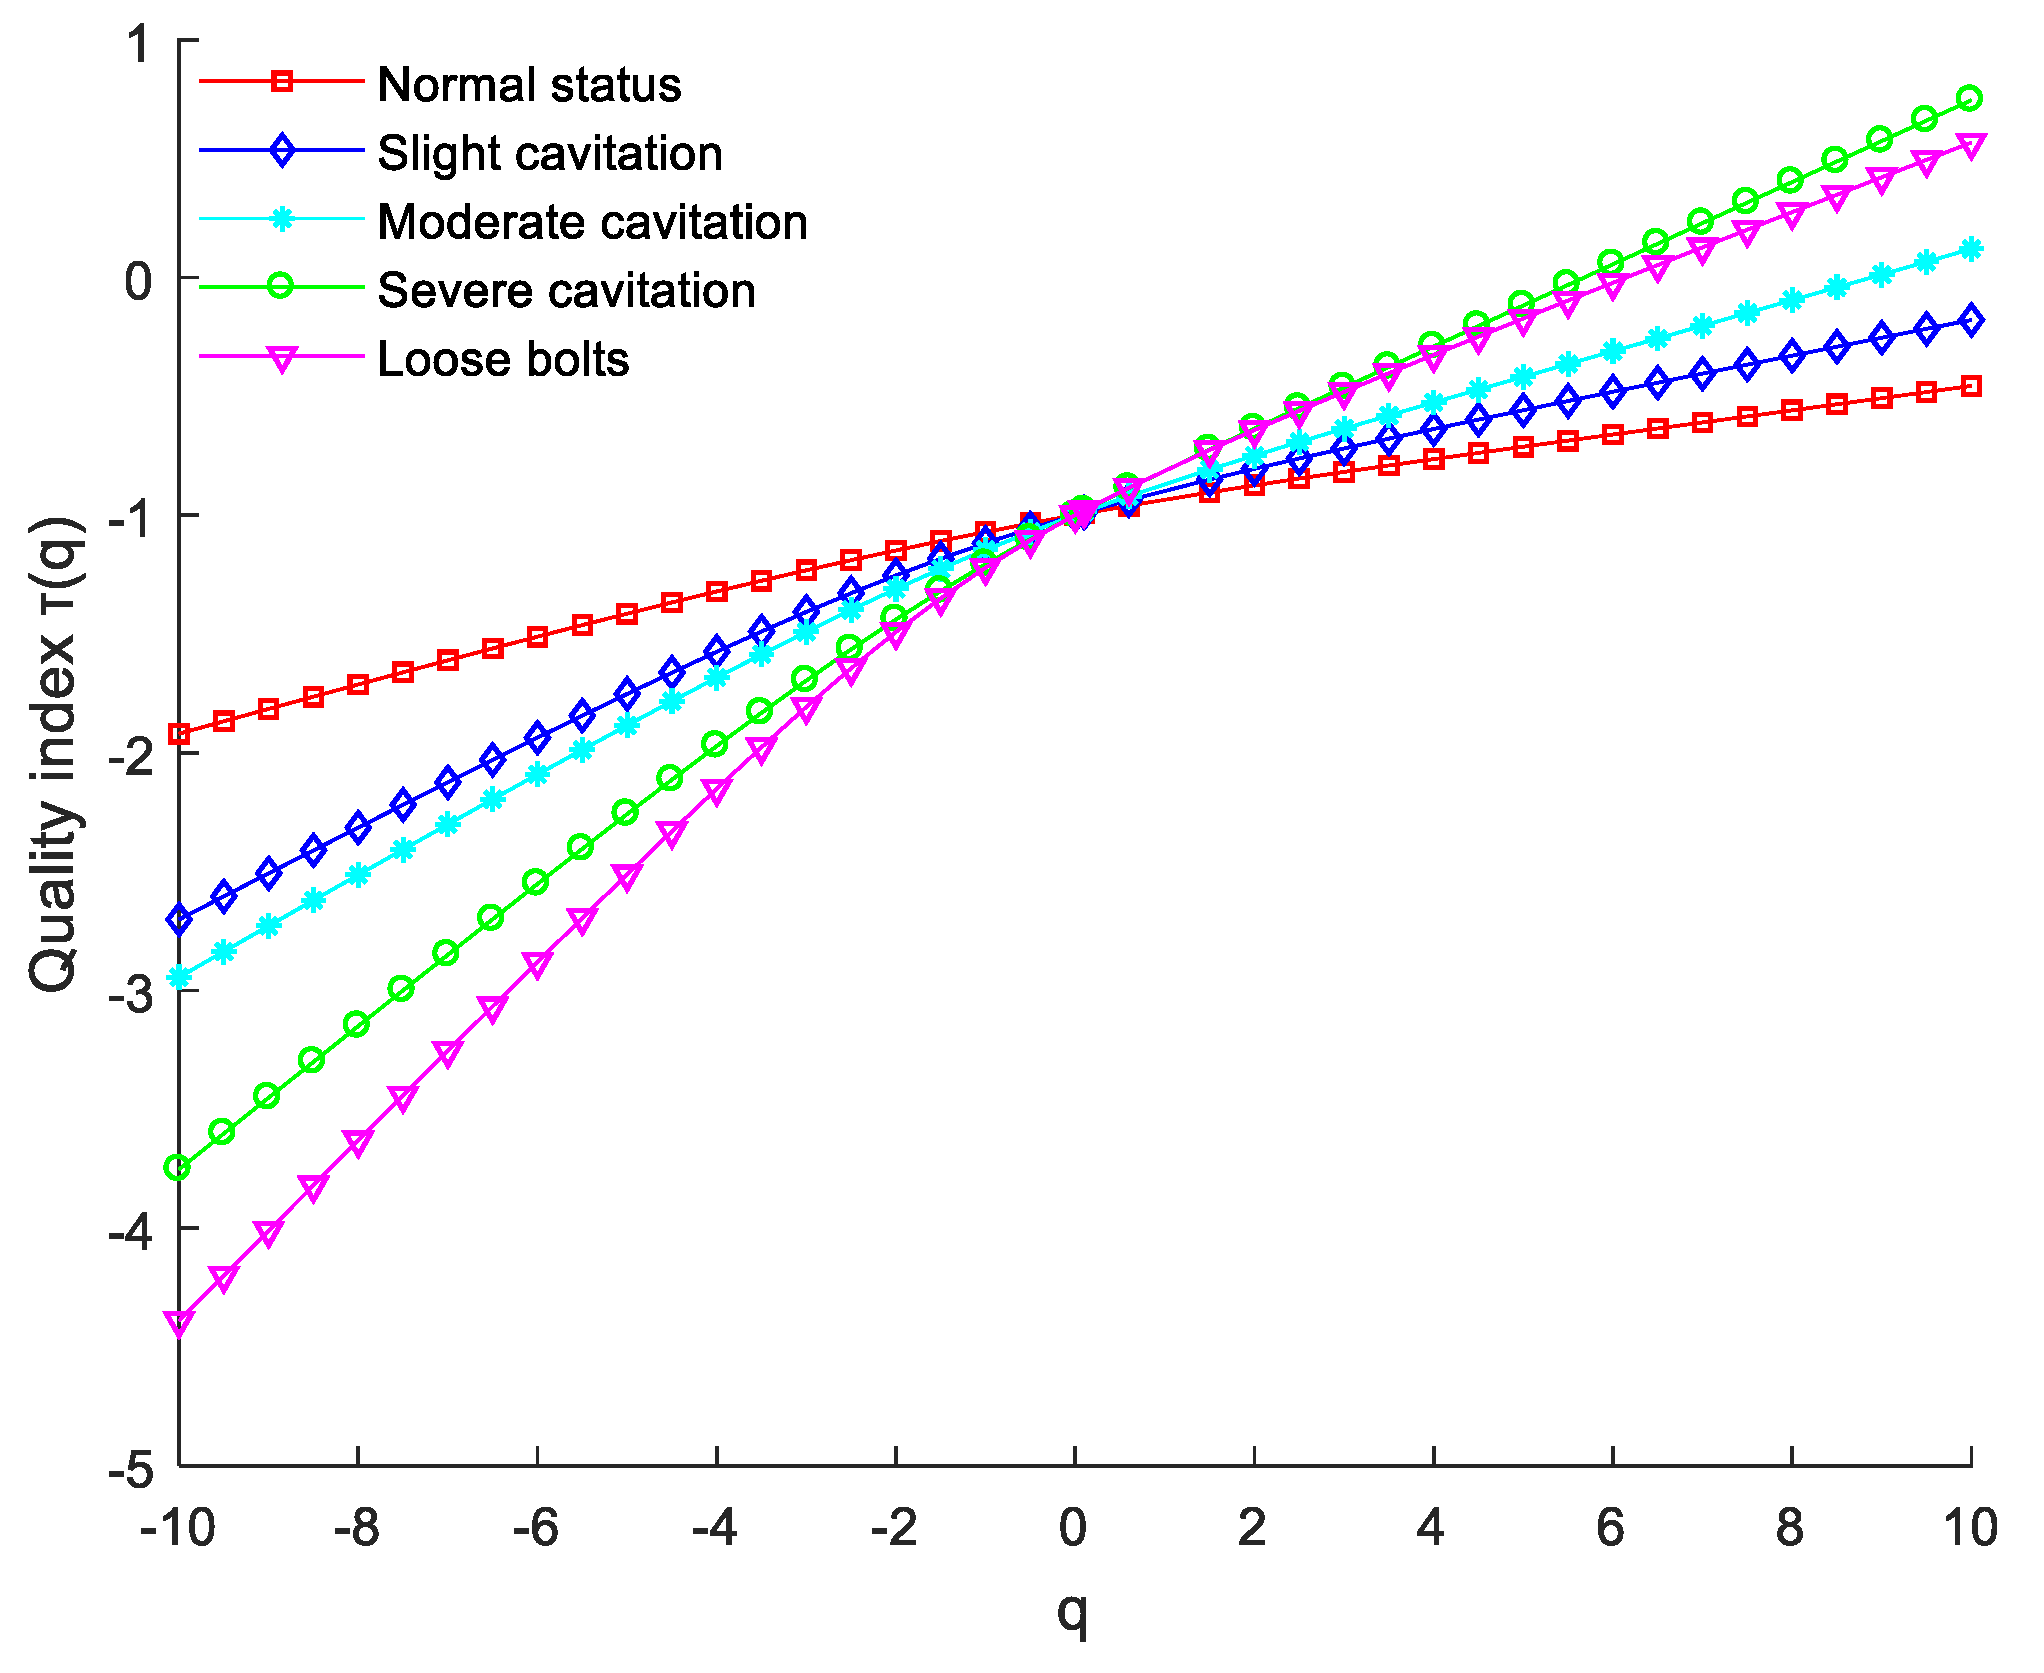
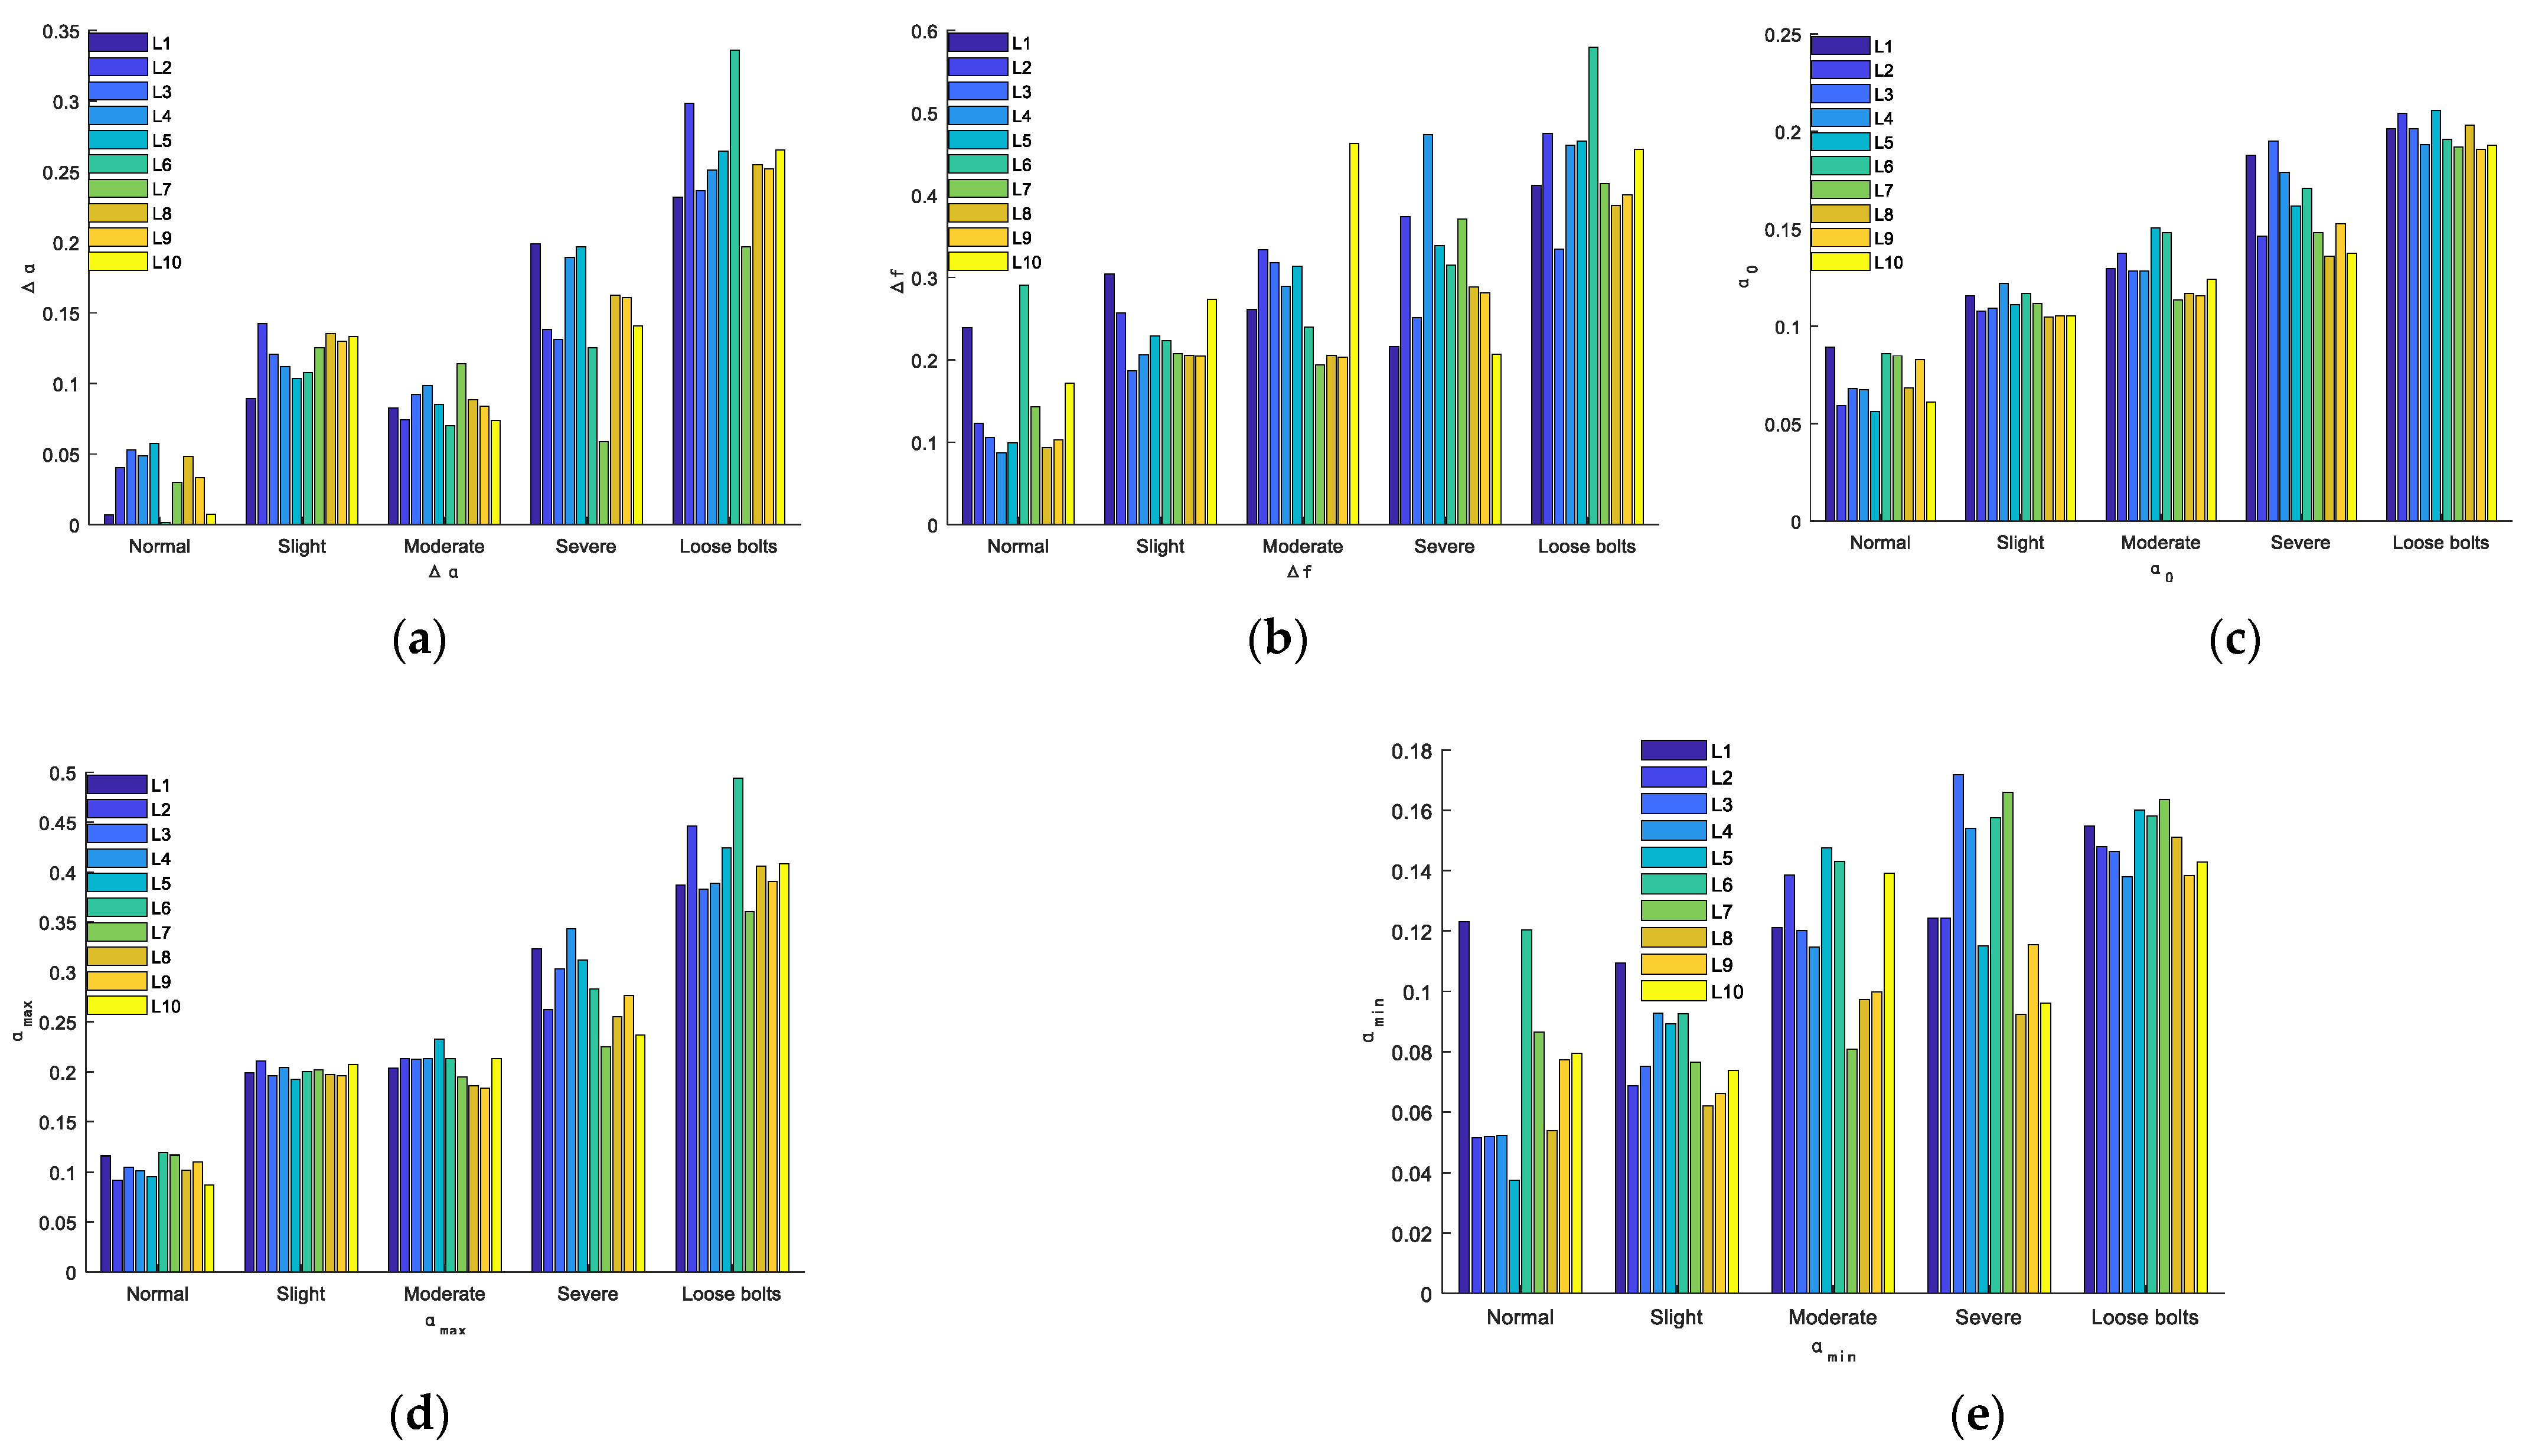
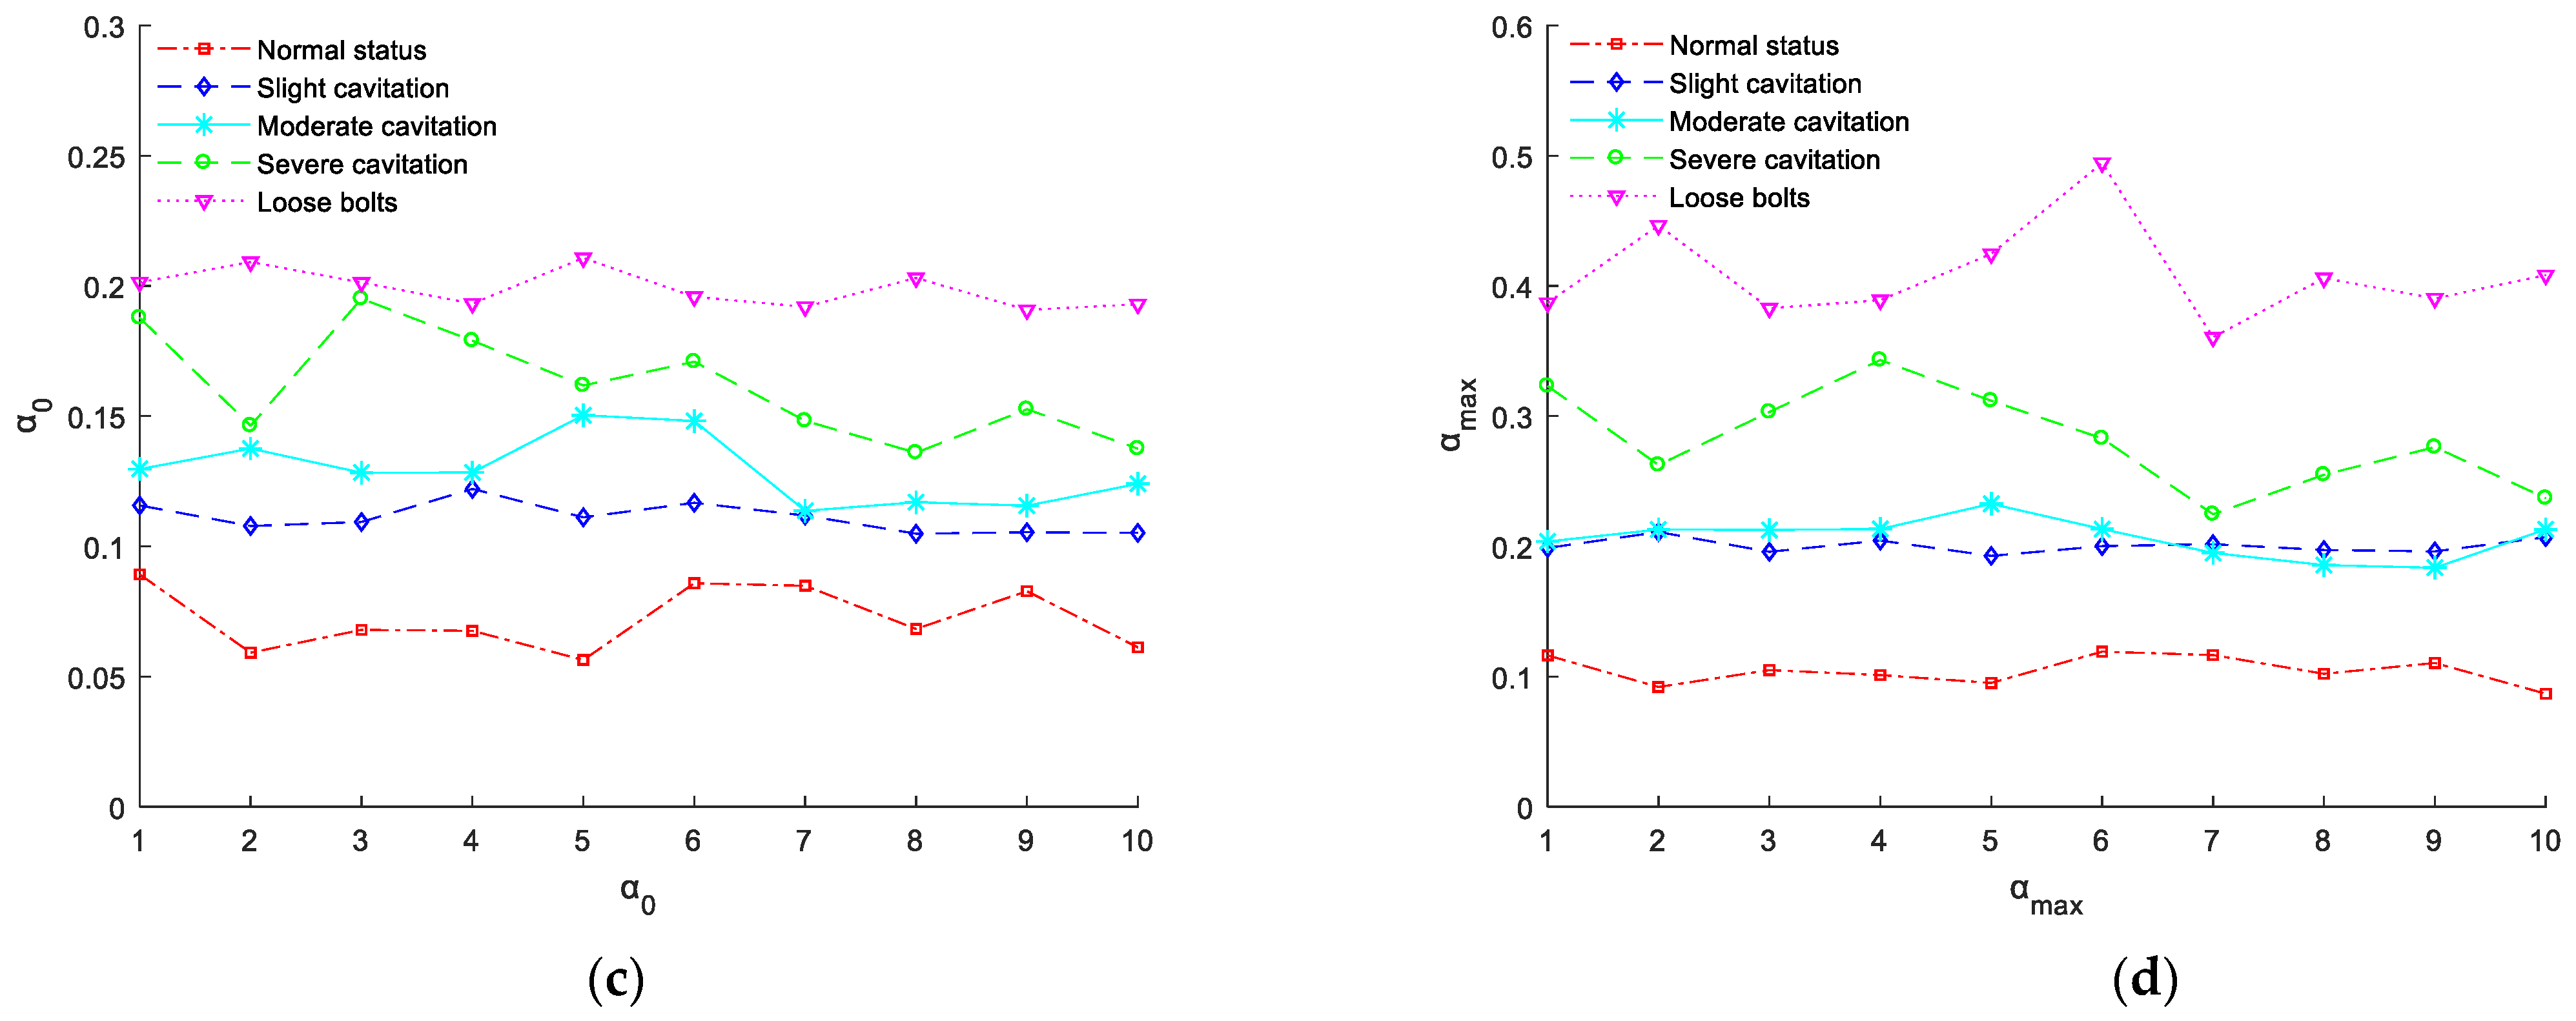
The signal data of the centrifugal pump under different working conditions were obtained by a PXI-4472B dynamic signal acquisition instrument in the testing device, as shown in Figure 2. The rated speed of the centrifugal pump was 3000   r / min , designed flow rate was 23.89   m 3 / h , with the hydraulic head at 11.2   m , and a rotational frequency of 50   Hz . A vibration sensor was arranged vertically in the pump and motor casings, a torque sensor between the pump and motor themselves, and an oscillation sensor on the pump shaft +X.
By changing the vacuum degree in the tank, the experiments simulated cavitation phenomena under different inlet pressures so as to collect fault vibration signals under different cavitation degrees. With a view to guarantee the effectiveness of the final analysis of fault signals by EMD-LS-MFDFA, the net positive suction head at the pump inlet was calculated by using the reading of a pump inlet pressure gauge [19,20]. According to the size of the net-positive suction head, the cavitation was divided into vibration signals without cavitation (normal state), slight cavitation, moderate cavitation, and severe cavitation, as shown in Table 1.

5. Case Analysis

Taking the pump casing vibration signal as an example, two sets of data (for slight cavitation and moderate cavitation) were intercepted at different times. Their spectrum analysis is shown in Figure 3. As can be seen, there was a degree of overlap between the two spectra, and indeed the distinction was extremely poor, which was not conducive to the accurate judgment of the base signal’s characteristics.
For this reason, a set of five fault vibration signals covering a range of conditions (normal state, slight cavitation, moderate cavitation, severe cavitation, and with a loosened ground bolt) were collected from a centrifugal circulation pump device. The EMD-LS-MFDFA analysis was performed for each type of fault vibration signal with a data length of 1024. To ensure the effectiveness of removing the trend term and the stability of the wave function, the value of s was taken from the range of 4 to 256 in steps of 8 and, likewise, q was selected from the range of −10 to 10 with steps of 0.5. The analyses of five kinds of vibration signals of centrifugal pumps obtained by EMD-LS-MFDFA are shown in Figure 4, Figure 5 and Figure 6.
Figure 4 shows the relationship between the mass index τ ( q ) and the order of the wave function q for the five vibration signals. As can be seen, when the centrifugal pump was in the normal state, the nonlinear relationship between the mass index τ ( q ) and q was poor. When there was a fault (whether from a state of cavitation or the foot bolt was loosened), there was an obvious turning point between the mass index τ ( q ) and q , and the nonlinear relationship became much more apparent. This highlights the multi-fractal characteristics of the centrifugal pump in varying states. It can also be seen in Figure 4 that the multi-fractal characteristics in each fault state were stronger when there was a fault than when in the normal state. The multiple fractal characteristics were stronger when the foot bolt was loose than when the pump experienced some state of cavitation and, as expected, the contrast was obvious among the varying levels of cavitation. This demonstrates the EMD-LS-MFDFA method’s ability to directly distinguish the operating condition of centrifugal pumps.
The relationship between the q -order-generalized Hurst indexes of the five vibration signals is represented in Figure 5. It can be surmised from the figure that the variation in the intrinsic dynamics of the centrifugal pump in different operating conditions led to substantial divergences in the generalized Hurst index h ( q ) among the signals. Since the generalized Hurst index h ( q ) was plotted as a curve with a value which decreased as q increased, the experimental findings further prove the five vibration signals had multi-fractal characteristics.
Figure 6 shows the vibration signals’ multi-fractal spectra for the five types of centrifugal pump. It illustrates the different shapes, positions, and value ranges which exist among the signals from the centrifugal pump in its numerous states. The singularity index α varies, lying across a wide range, and the multi-fractal spectrum f ( α ) is a single-peaked curve which fluctuates with the singularity index α . This further indicates that the vibration signal has multi-fractal characteristics, displaying the strongest fluctuation characteristics when the centrifugal pump was in the state of loose foot bolts.
Based on the analysis provided by Figure 4, Figure 5 and Figure 6, the signal characteristics which were derived can be described by the parameters of the singularity index α , the width of the multi-fractal spectrum Δ α , and the difference of the multi-fractal spectrum Δ f . As per Table 2, when the centrifugal pump was in the normal state, the values of Δ α , Δ f , α 0 , α max and α min were at their lowest. These values were significantly higher when there was a fault than in the normal state. Therefore, the five extracted characteristic parameters can be used to effectively distinguish between the normal state and the fault states of the centrifugal pump.
In order to verify the accuracy and stability of the five characteristic parameters of the fault diagnosis of centrifugal pump cavitation and foot bolt loosening, ten segments from each of the five states of centrifugal pump data were selected for further analysis. Each segment was numbered (denoted by L ), had a length of 1024, and their characteristic parameters were obtained by using EMD-LS-MFDFA. The results are shown in Figure 7, and the mean values and mean square deviations are provided in Table 3.
As can be seen from Figure 7 and Table 3, the mean values of the five multiple fractal spectra characteristic parameters of the centrifugal pump vibration signal were much higher than their normal state equivalents. Notably, the mean values of Δ α , Δ f , α 0 , α max , and α min were higher than the values of the varying cavitation states, and the signal was more irregular when the pump was in the state defined by a loose foot bolt and could be distinguished. For each fault state of the centrifugal pump, the characteristic parameters Δ α , Δ f and α min produced large oscillations and displayed poor stability, resulting in poor differentiation. For α 0 and α max , they had a smaller mean square deviation, meaning they demonstrated less volatility and possessed better stability than the other parameters.
Figure 8 illustrates the contrast between the MFDFA and EMD-LS-MFDFA methods in terms of selecting and distinguishing the five vibration signals of centrifugal pumps, focusing on the parameters α 0 and α max . As per Figure 8a,b, α 0 and α max of the MFDFA method can identify the normal and fault state vibration signals, but cannot effectively do the same for the various fault states, while from Figure 8c,d, it can be seen that for different state vibration signals, the contrast generated by α 0 using the EMD-LS-MFDFA method was the best. However, there was partial overlap between the α max values when there was slight and moderate cavitation, and the difference between α max values was only 0.0061 at its minimum, which will have had some effect on the distinction between slight and moderate cavitation. Nevertheless, the α max of the EMD-LS-MFDFA method still achieved a better level of distinction between the normal and fault states compared to the MFDFA method. In summary, the multiple fractal spectrum parameters Δ α , Δ f , α 0 , α max and α min obtained by the EMD-LS-MFDFA method have been demonstrated to be very sensitive to the changes of centrifugal pump fault states, and can effectively discern normal and fault operating states. Of these parameters, α 0 and α max performed better than the remainder in terms of separating the different fault states. Consequently, these parameters ( α 0 and α max ) can be selected to determine the fault characteristic quantities of centrifugal pumps.

6. Conclusions

As has been detailed thus far, the EMD-LS-MFDFA method was proposed in this study as an alternative for processing pump vibration signals, and the reported results led to the following conclusions:
(1)
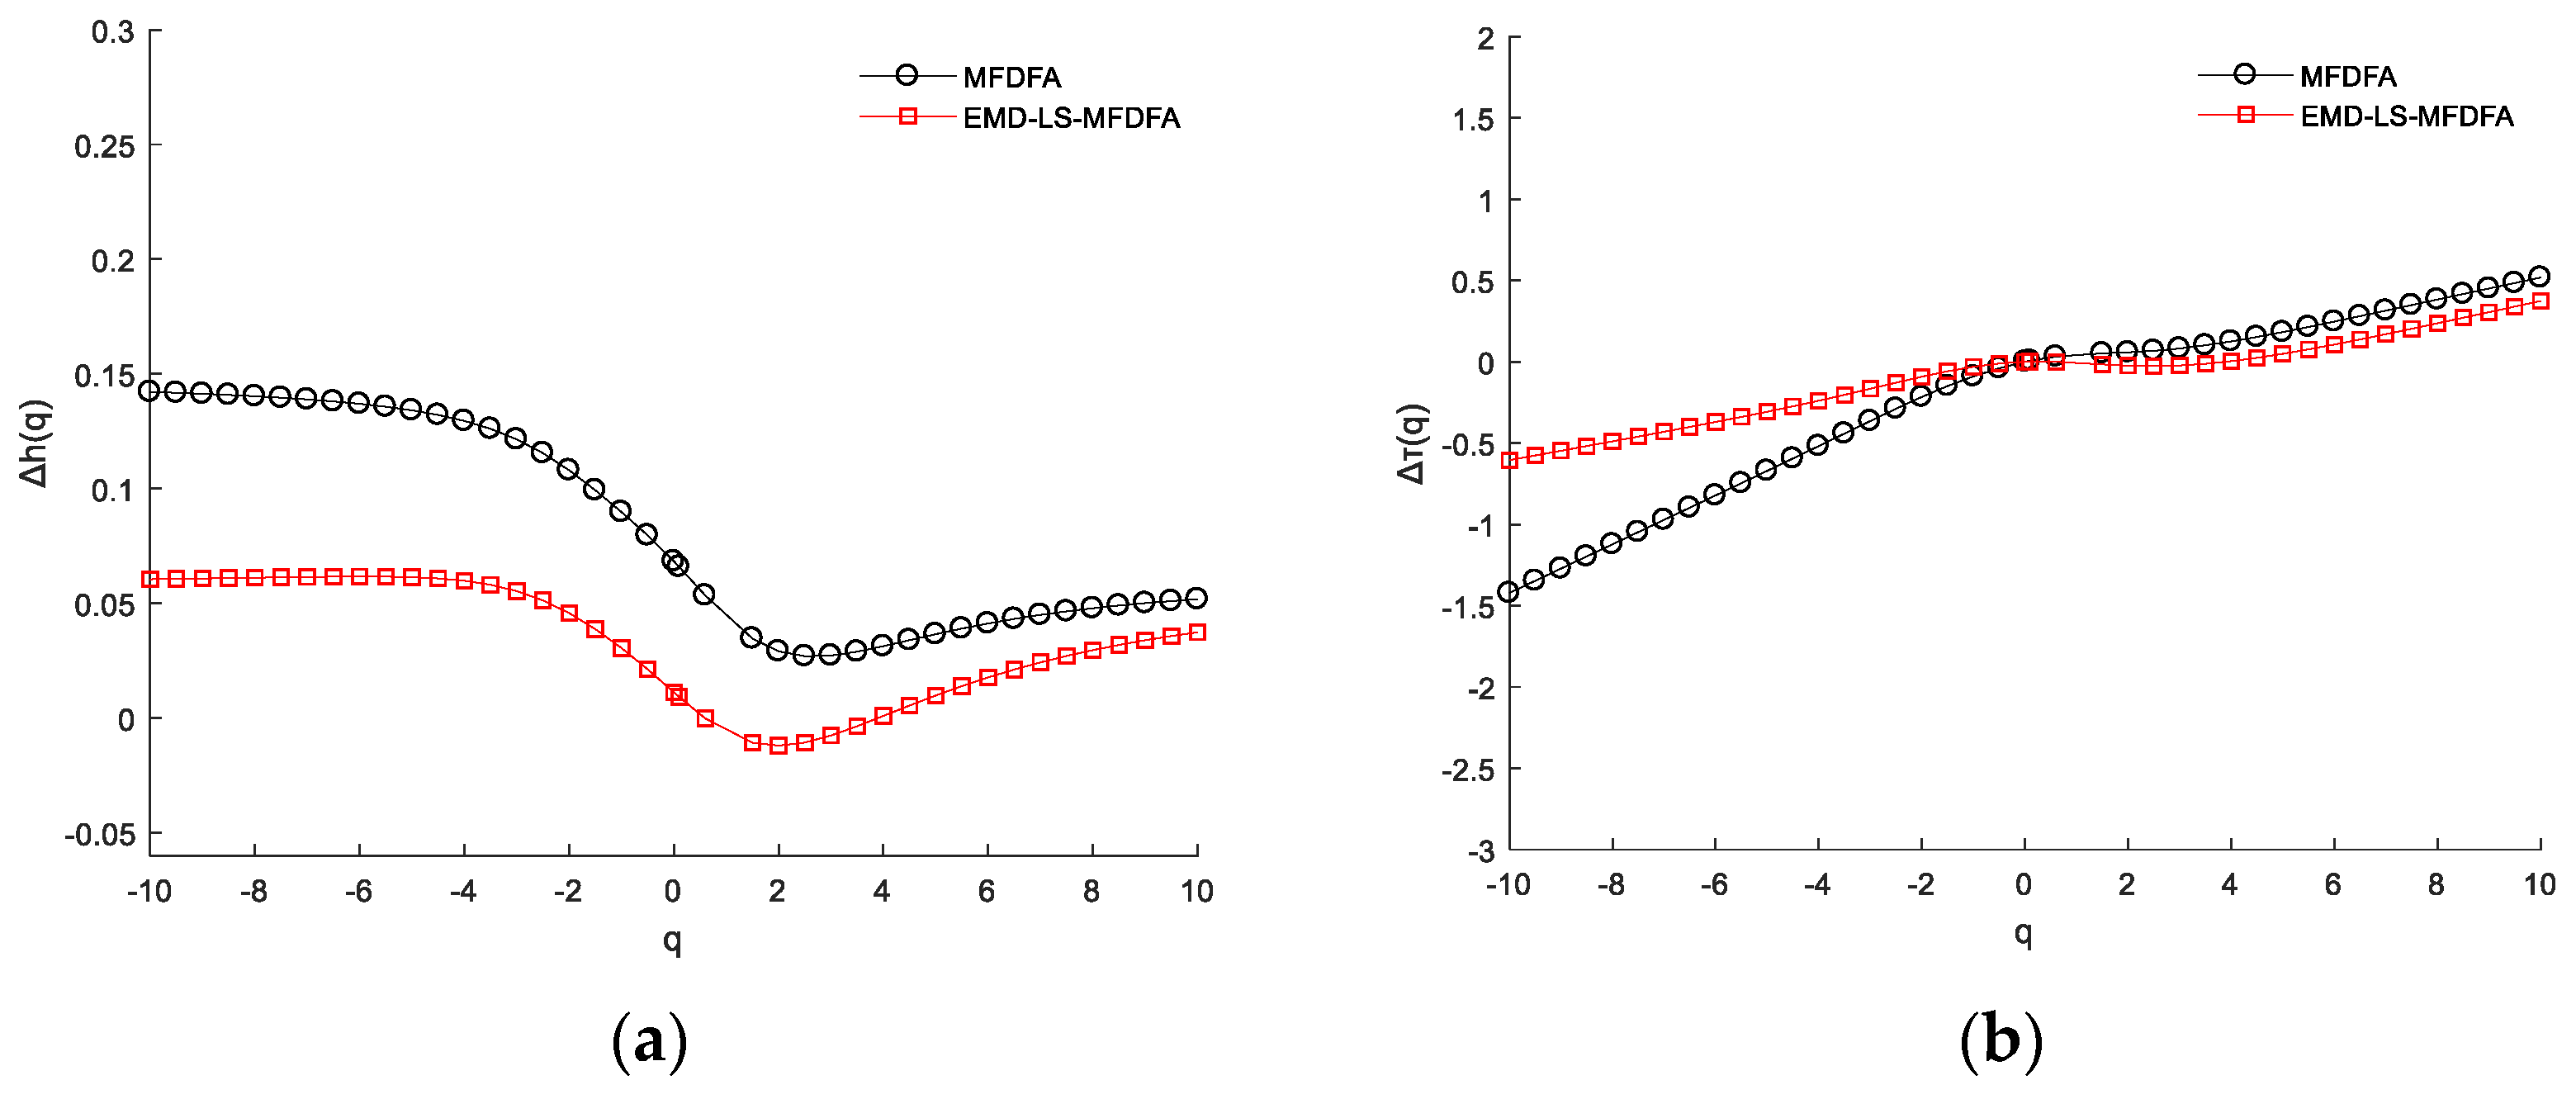
Compared to the MFDFA method, the EMD-LS-MFDFA method produced results closer to the multiple fractal characteristics of BMS theory, and had more accurate analysis capabilities;
(2)
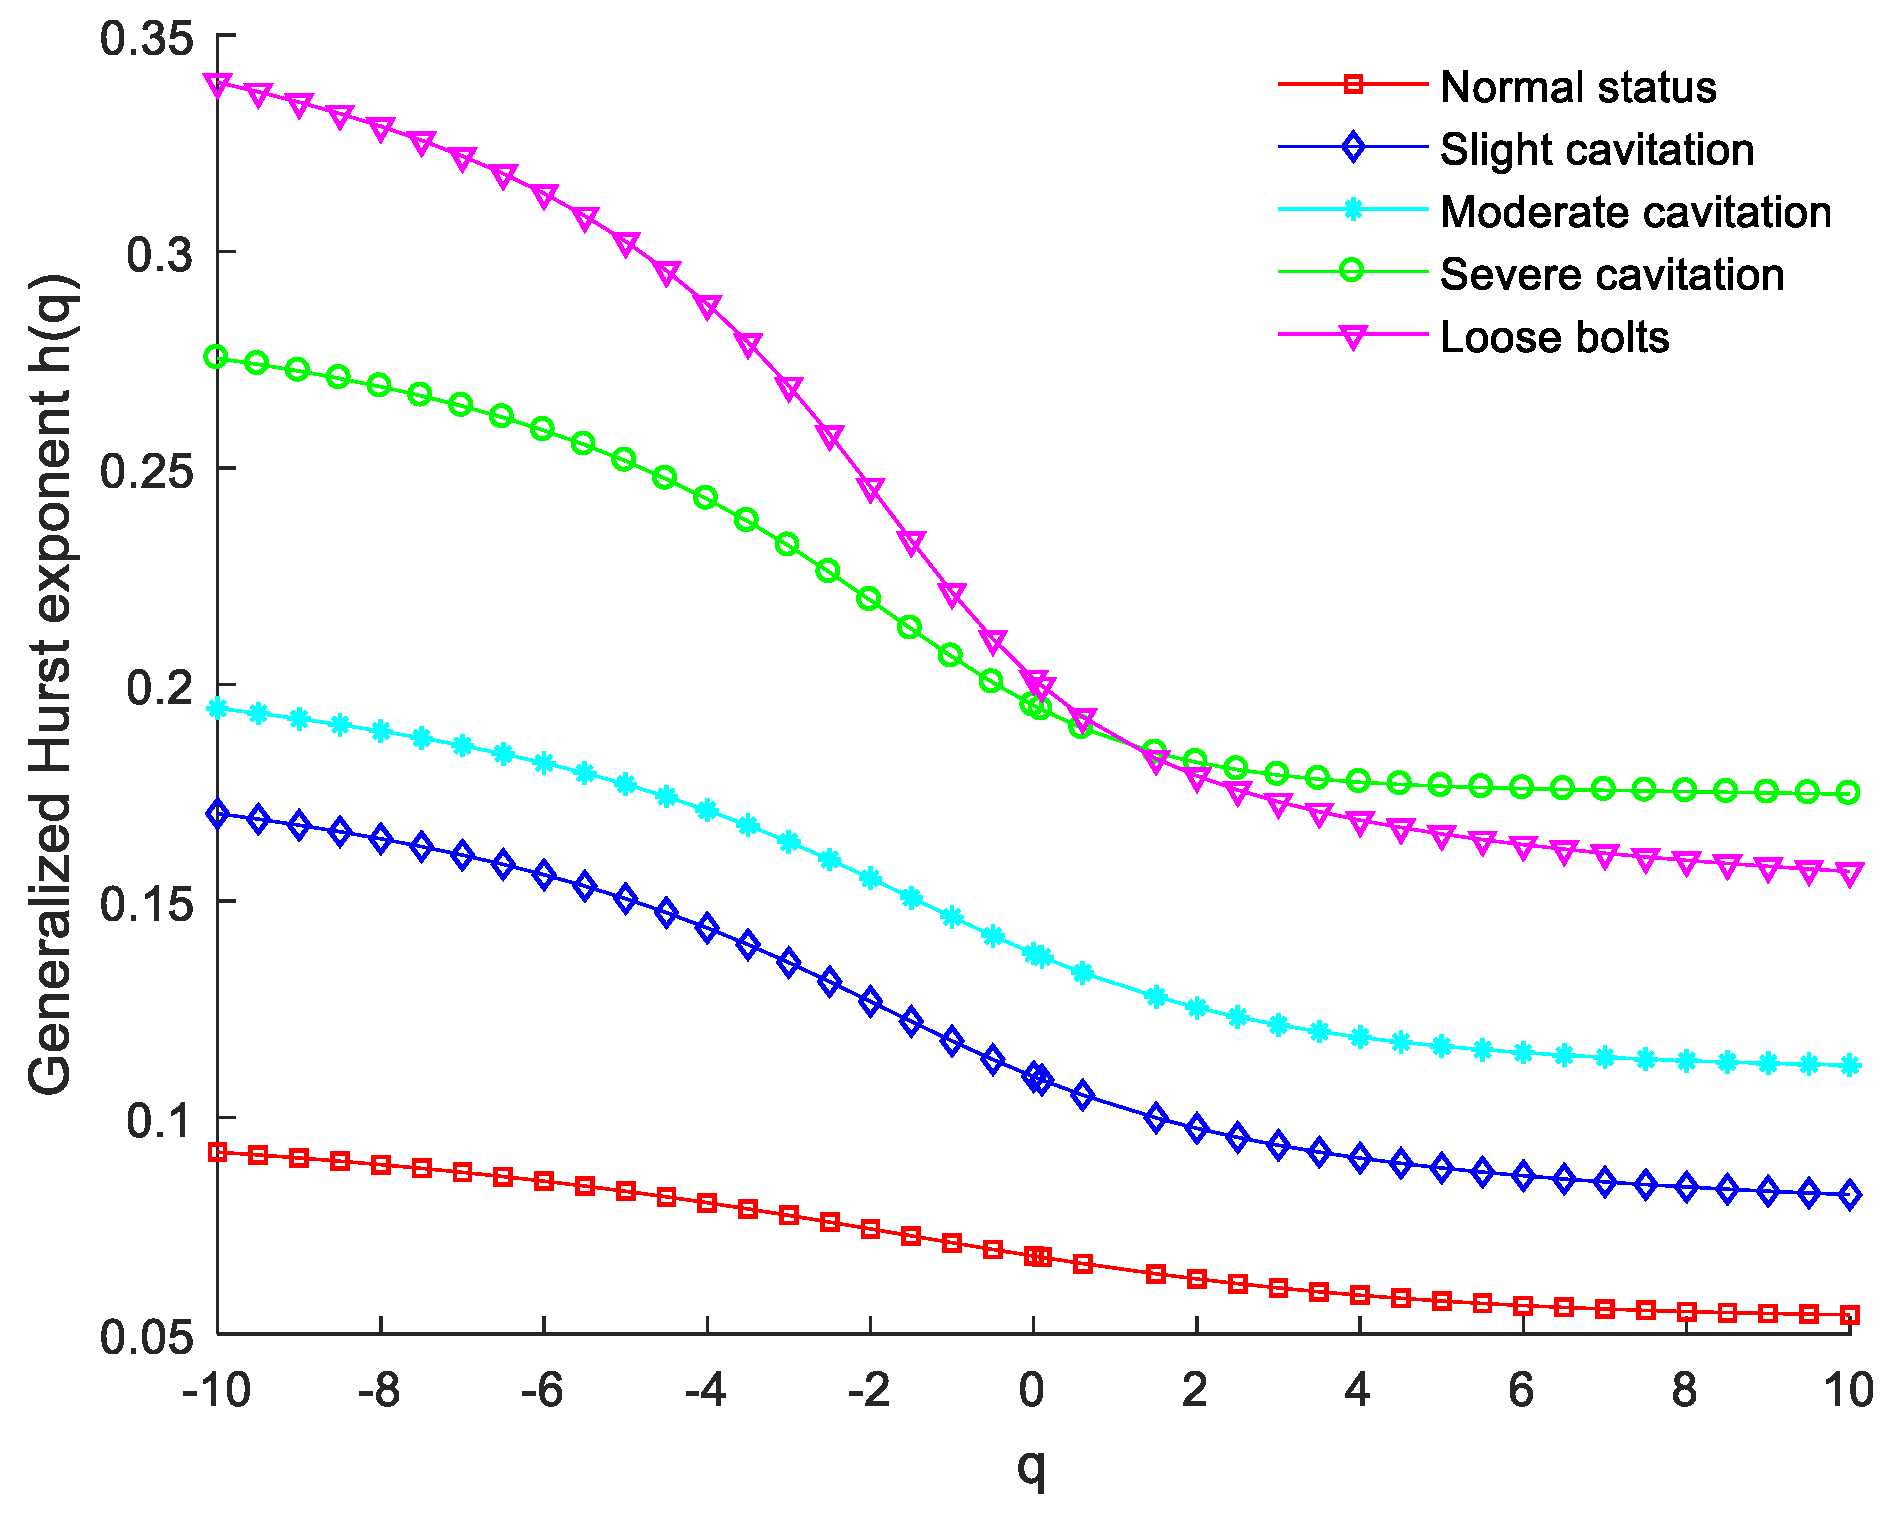
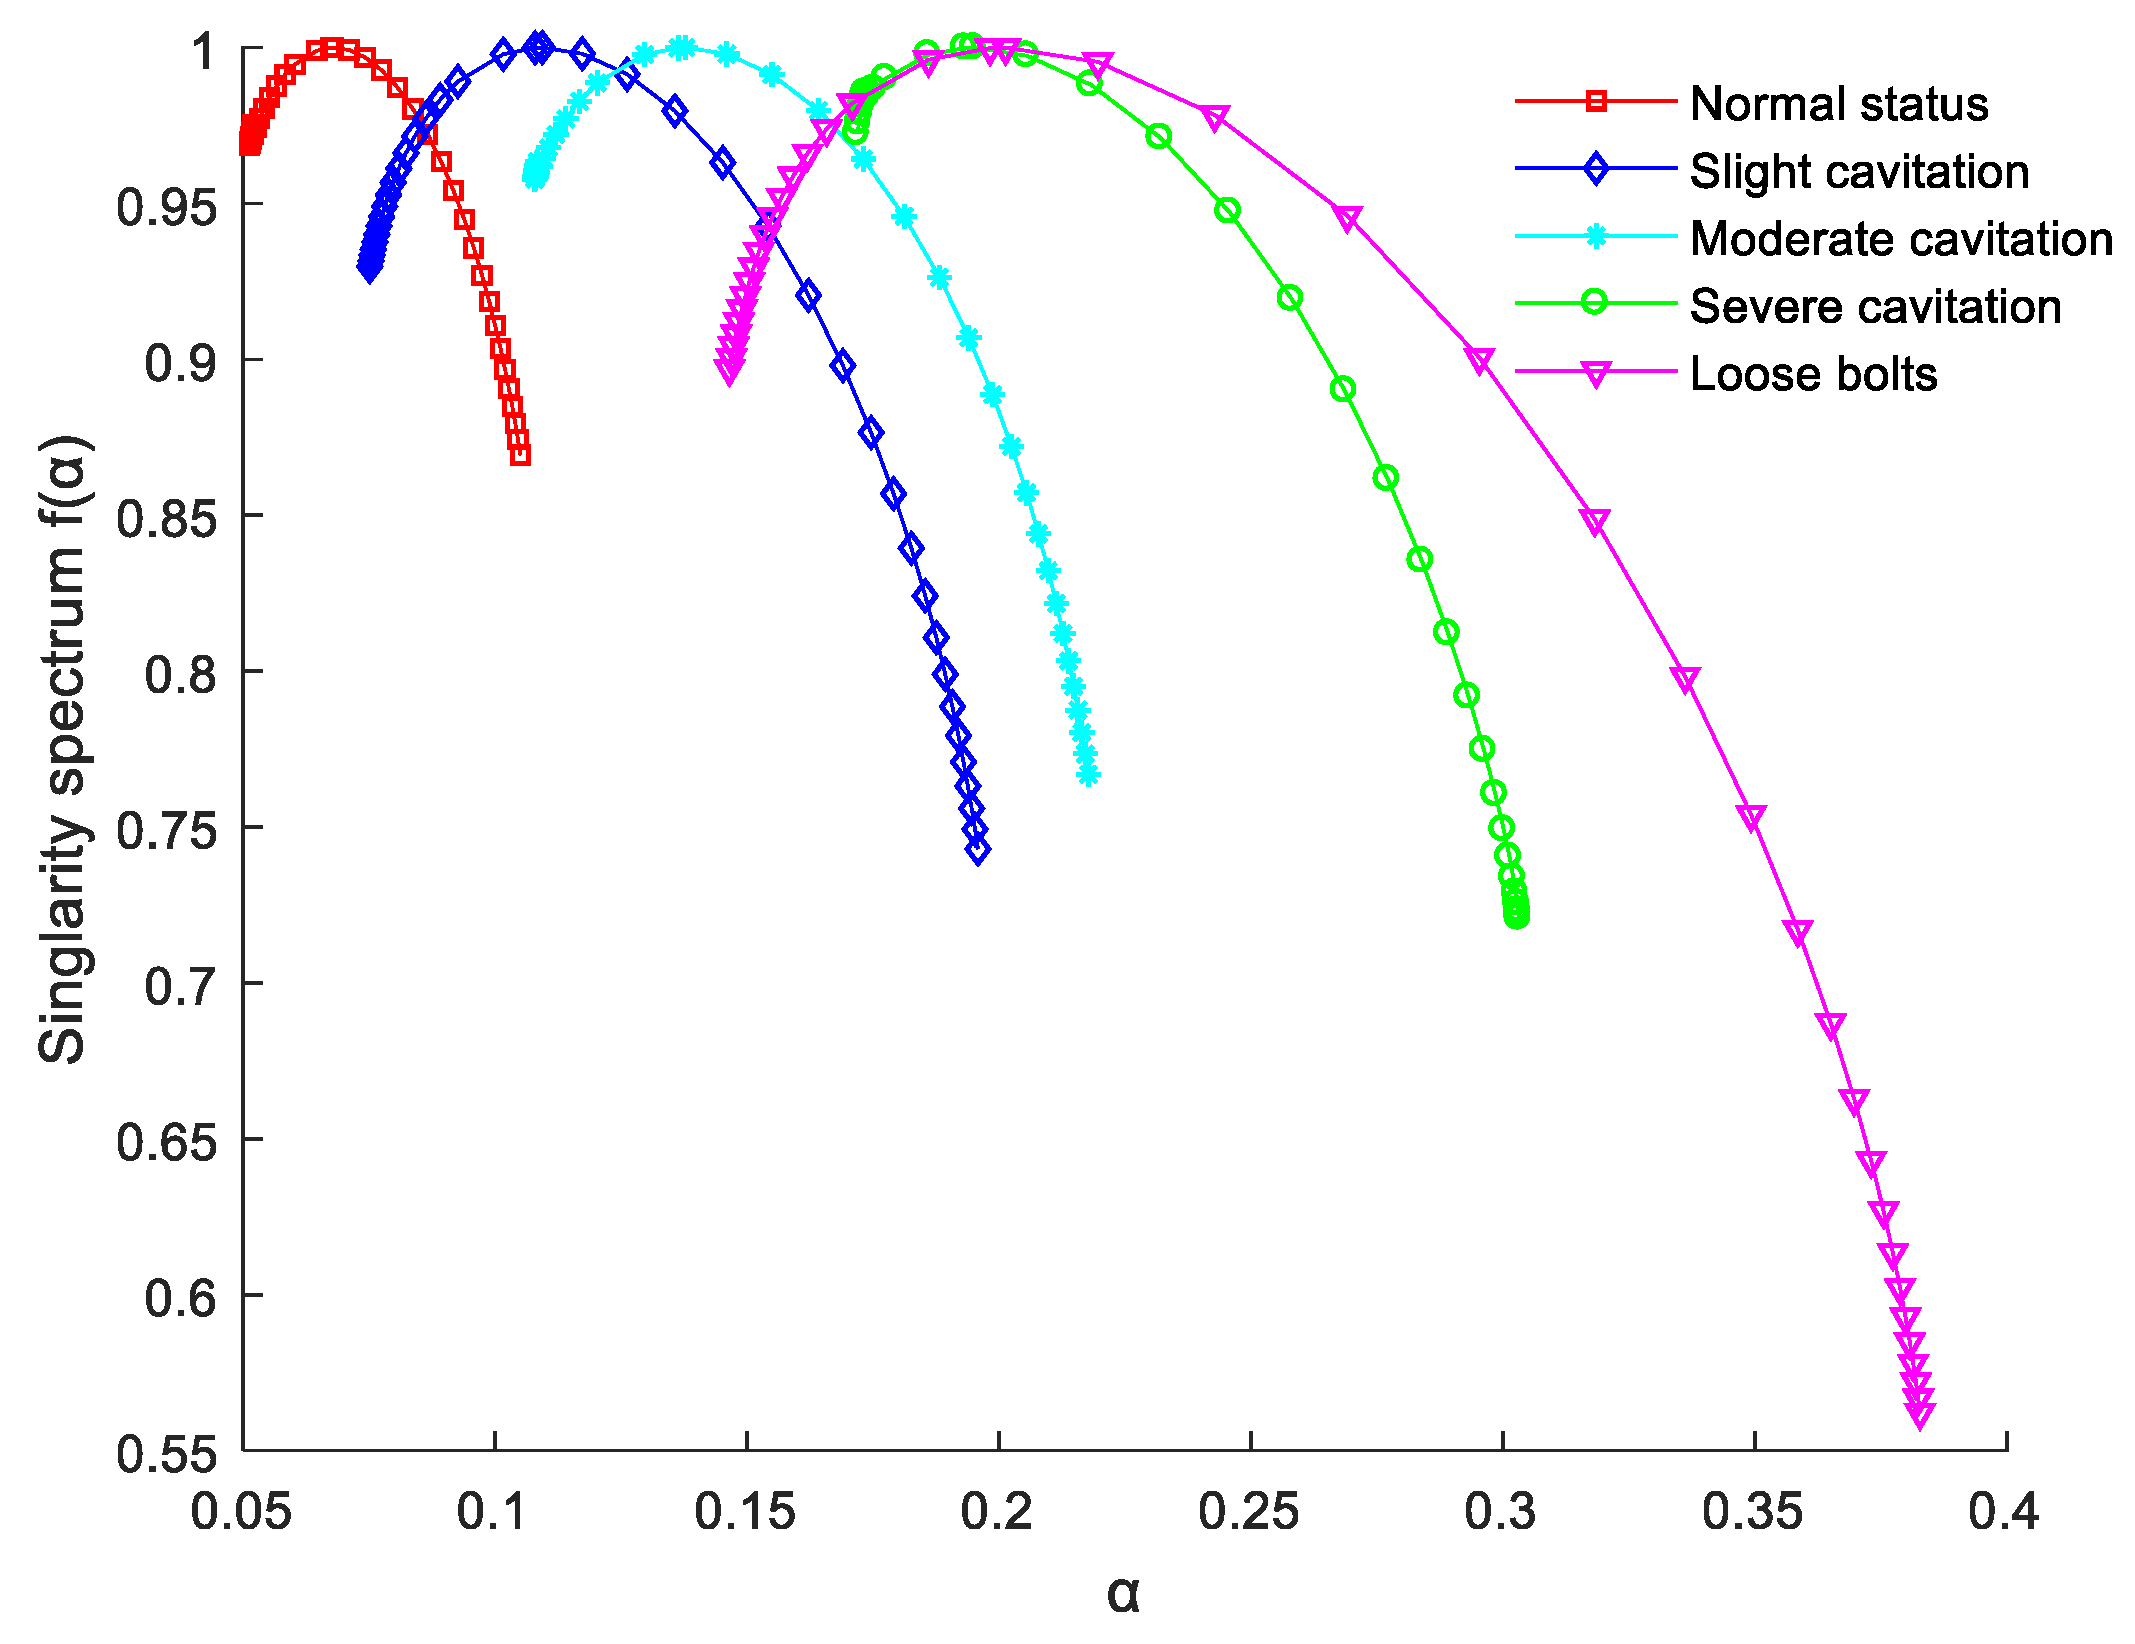
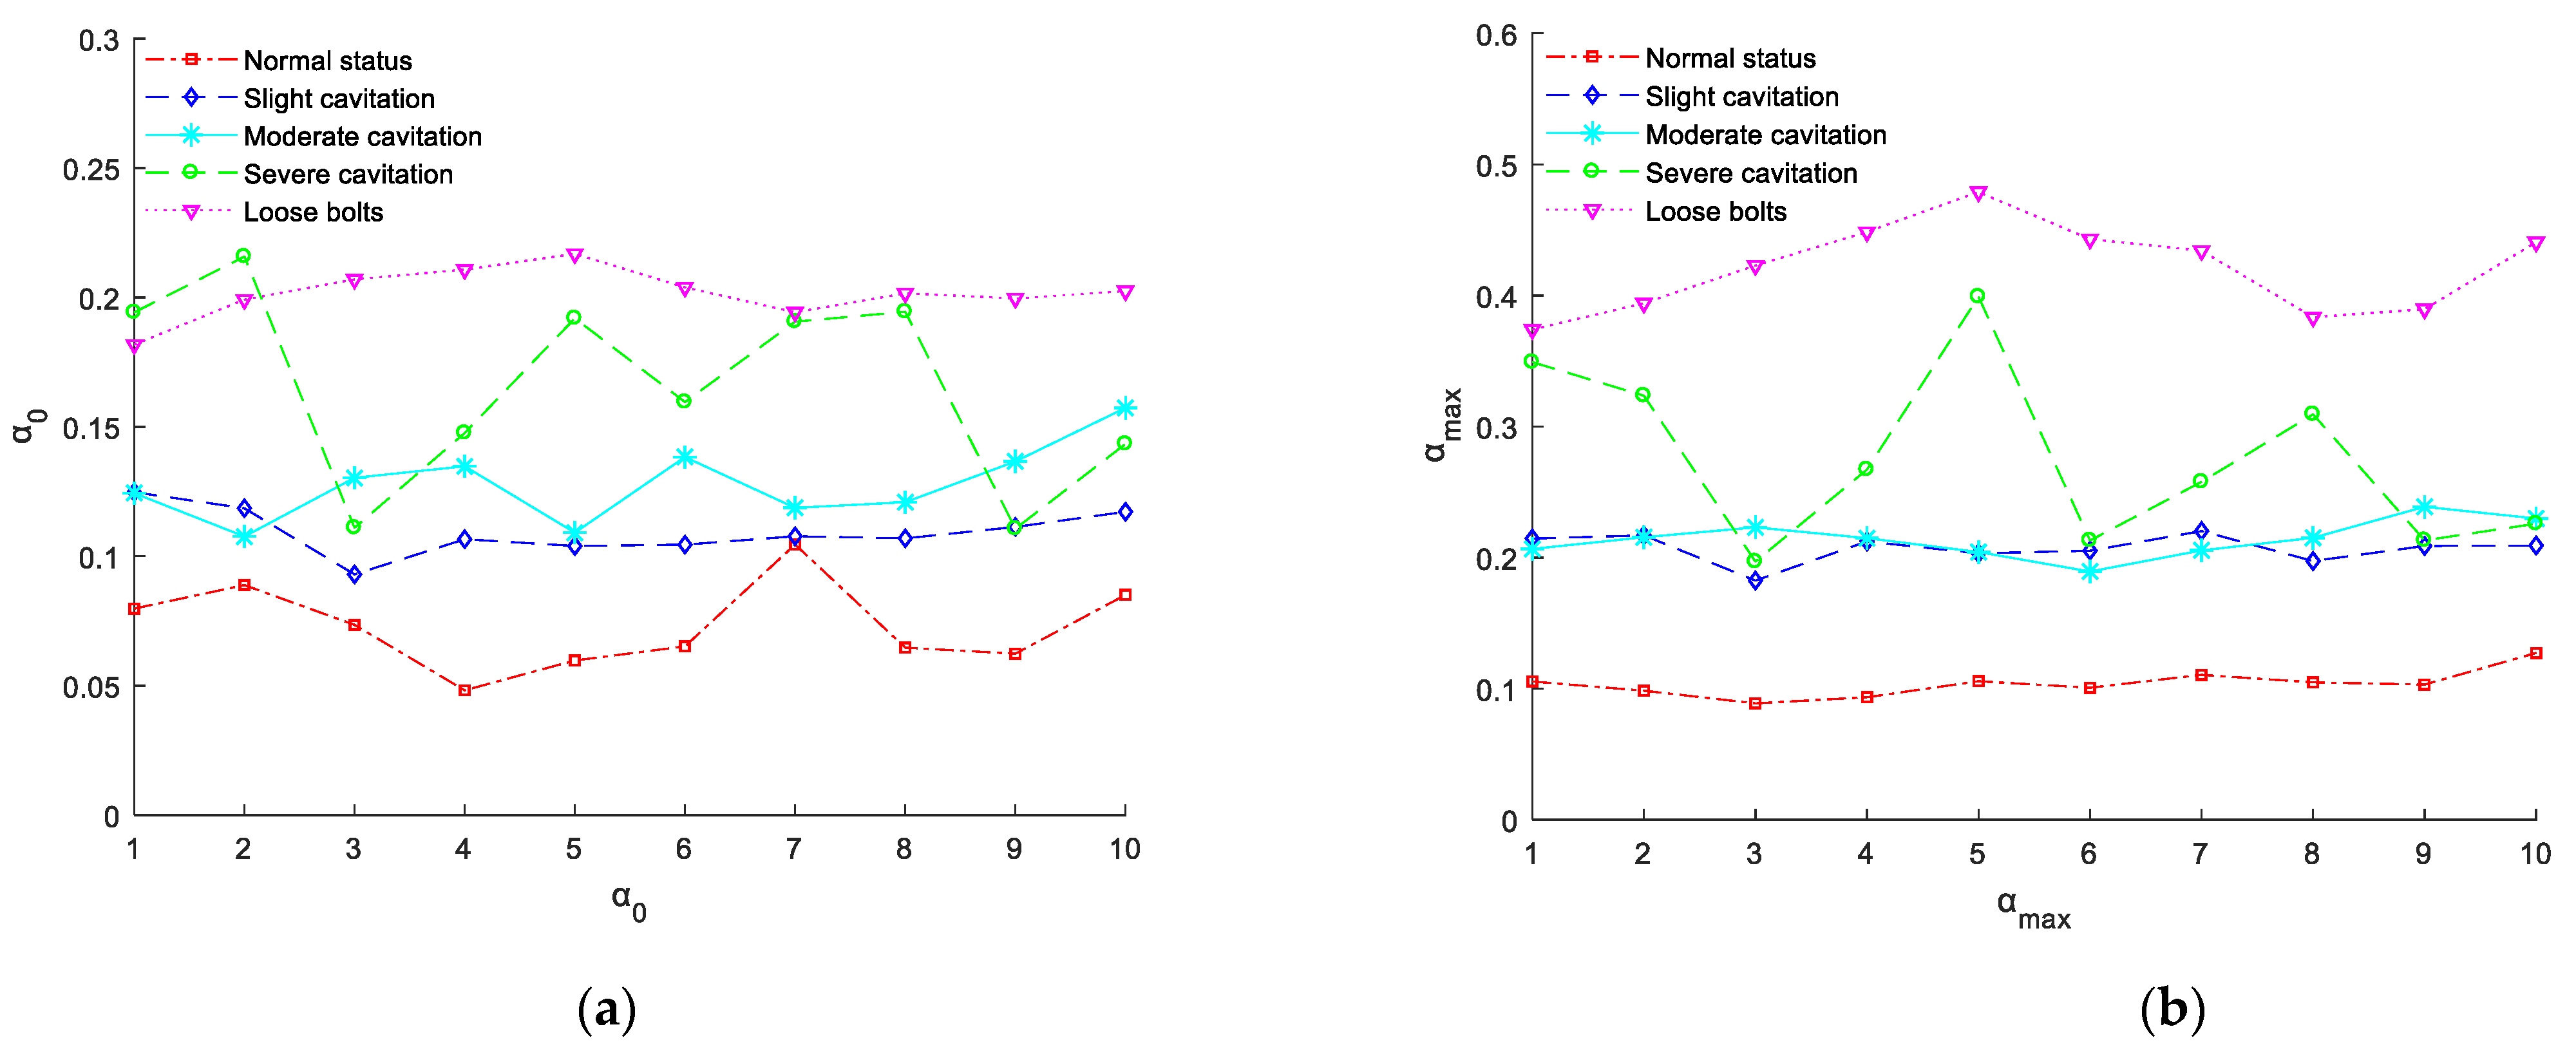
All centrifugal pump vibration signals showed multiple fractal characteristics. Normal vibration signals were relatively stable and irregularity in them was low, while signals associated with severe cavitation and anchor bolt loosening fault vibration were more intense, and irregularity was higher. Of these types, the loose foot bolt fault signal was the most irregular of all, so the multiple fractal characteristics of this fault state were notably stronger than those of the normal state, and its multiple fractal characteristics were also stronger than those of a state of cavitation, irrespective of degree.
(3)
The multiple fractal spectral characteristic parameters Δ α , Δ f , α 0 , α max , and α min effectively distinguished between the normal and fault states of a centrifugal pump. When the stability of α 0 and α max was better, compared to the α 0 and α max parameters extracted by MFDFA, they were able to separate the different fault states of centrifugal pumps more accurately, so the EMD-LS-MFDFA method can be used as a new means of extracting centrifugal pump fault features. The extracted feature parameters can be used as fault characteristics to quantify the different working states of centrifugal pumps.

Author Contributions

Conceptualization, X.L.; methodology, X.L.; software, Y.L. (Yuanxing Luo); validation, Y.L. (Yuanxing Luo), F.D. and Y.L. (Yan Li); formal analysis, Y.L. (Yuanxing Luo); investigation, Y.L. (Yan Li); resources, F.D.; data curation, Y.L. (Yuanxing Luo); writing—original draft preparation, X.L.; writing—review and editing, Y.L. (Yuanxing Luo); visualization, Y.L. (Yan Li).; supervision, F.D.; project administration, X.L.; funding acquisition, X.L. All authors have read and agreed to the published version of the manuscript.

Funding

This paper is supported by the Jiangxi Education Department Science Foundation of China (GJJ170988, GJJ211941) and the National Natural Science Foundation of China (No. 51969017).

Conflicts of Interest

The authors declare no conflict of interest.

References

  1. Li, W.; Zhu, Z.; Jiang, F.; Zhou, G.; Chen, G. Fault diagnosis of rotating machinery with a novel statistical feature extraction and evaluation method. Mech. Syst. Signal Process. 2015, 50, 414–426. [Google Scholar] [CrossRef]
  2. Li, J.; Zhou, J.; Xiao, J.; Pu, G.; Li, C.; Xiao, H. Feature extraction of turbine cavitation based on wavelet packet and fractal analysis. J. Hydro Power 2013, 39, 53–57. [Google Scholar]
  3. Zhou, Y.L.; Hong, J.; Zhao, P. The application of HHT and RBF neural networks for processing fault-vibration signals from centrifugal pumps. J. Eng. Therm. Energy Power 2007, 22, 84–87, 113. [Google Scholar]
  4. Xiangyang, D.; Yongsheng, W.; Yongsheng, S. Application of slice bispectrum analysis to fault diagnosis of centrifugal pump. J. Vib. Meas. Diagn. 2010, 30, 581–584, 600. [Google Scholar]
  5. Logan, D.B.; Mathew, J. Using the correlation dimension for vibration fault diagnosis of rolling element bearings—II. Selection of experimental parameters. Mech. Syst. Signal Process. 1996, 10, 251–264. [Google Scholar] [CrossRef]
  6. Purkait, P.; Chakravorti, S. Impulse fault classification in transformers by fractal analysis. IEEE Trans. Dielectr. Electr. Insul. 2003, 10, 109–116. [Google Scholar] [CrossRef]
  7. Kantelhardt, J.W.; Zschiegner, S.A.; Koscielny-Bunde, E.; Havlin, S.; Bunde, A.; Stanley, H.E. Multifractal detrended fluctuation analysis of nonstationary time series. Phys. A Stat. Mech. Appl. 2002, 316, 87–114. [Google Scholar] [CrossRef] [Green Version]
  8. Lin, J.S.; Chen, Q. Fault feature extraction of gearboxes based on multifractal detrended fluctuation analysis. J. Vib. Shock. 2013, 32, 97–101. [Google Scholar]
  9. Li, Z.; Chai, Y.; Li, H. Diagnosing faults in vibration signals by multifractal detrended fluctuation analysis. J. Huazhong Univ. Sci. Technol. (Nat. Sci. Ed.) 2012, 40, 5–9. [Google Scholar]
  10. Martínez, J.L.M.; Segovia-Domínguez, I.; Rodríguez, I.Q.; Horta-Rangel, F.A.; Sosa-Gómez, G. A modified Multifractal Detrended Fluctuation Analysis (MFDFA) approach for multifractal analysis of precipitation. Phys. A Stat. Mech. Appl. 2021, 565, 125611. [Google Scholar] [CrossRef]
  11. Jiajing, L. Multi-Fractal Method based on De-Sliding Mean Trend and Its Application. Dissertation Thesis, Guangzhou University, Guangzhou, China, 2017. [Google Scholar]
  12. Sun, J.; Sheng, H. A hybrid detrending method for fractional Gaussian noise. Phys. A Statal Mech. Appl. 2011, 390, 2995–3001. [Google Scholar] [CrossRef]
  13. Yuan, L.; Quan-min, X.; Ming-shou, Z.; Liang, L.U.; Xing-hua, L.I. Research on trend removing methods in preprocessing analysis of blasting vibration monitoring signals. Eng. Mech. 2012, 29, 63–68. [Google Scholar]
  14. Yan, W.; Yunchao, X.; Tiehua, M. Research on zero drift processing method using EMD and Least-Square. Trans. Beijing Inst. Technol. 2015, 35, 118–122. [Google Scholar]
  15. Zhang, J.; Pan, Z.X.; Zheng, Y.X.; Li, Y. Research on vibration signal trend extraction. Acta Electron. Sin. 2017, 45, 22–28. [Google Scholar]
  16. Dybala, J.; Zimroz, R. Rolling bearing diagnosing method based on Empirical Mode Decomposition of machine vibration signal. Appl. Acoust. 2014, 77, 195–203. [Google Scholar] [CrossRef]
  17. Xiang, H.Y.; Leng, C.J.; Zhong, Y.X. Numerical Simulation and Experimental Method for Auto-Panel Forming Defects Analysis; Materials Science Forum; Trans Tech Publications Ltd.: Bäch, Switzerland, 2008; Volume 575, pp. 169–173. [Google Scholar]
  18. Manimaran, P.; Panigrahi, P.K.; Parikh, J.C. Wavelet analysis and scaling properties of time series. Phys. Rev. E Stat. Nonlinear Soft Matter Phys. 2005, 72, 46–54. [Google Scholar] [CrossRef] [PubMed] [Green Version]
  19. Xiong, H.; Shang, P. Weighted multifractal cross-correlation analysis based on Shannon entropy. Commun. Nonlinear Sci. Numer. Simul. 2016, 30, 268–283. [Google Scholar] [CrossRef] [PubMed]
  20. Xie, W.J.; Han, R.Q.; Jiang, Z.Q.; Wei, L.; Zhou, W.X. Analytic degree distributions of horizontal visibility graphs mapped from unrelated random series and multifractal binomial measures. Europhys. Lett. 2017, 119, 48–52. [Google Scholar] [CrossRef] [Green Version]
  21. Stanley, H.E.; Meakin, P. Multifractal phenomena in physics and chemistry. Nature 1988, 335, 405–409. [Google Scholar] [CrossRef]
Figure 1. The relationship between Hurst index and quality index and theoretical value: (a) Δ h ( q ) ~ q , (b) Δ τ ( q ) ~ q .
Processes 10 01169 g001
Figure 2. Laboratory centrifugal circulating water pump device.
Processes 10 01169 g002
Figure 3. Energy spectrum of centrifugal pump vibration sensor signals.
Processes 10 01169 g003
Figure 4. Quality index of centrifugal pump vibration signals.
Processes 10 01169 g004
Figure 5. Generalized Hurst exponent of centrifugal pump vibration signals.
Processes 10 01169 g005
Figure 6. Multi-fractal spectrum of centrifugal pump vibration signals.
Processes 10 01169 g006
Figure 7. Stability of the characteristic parameters of the centrifugal pump vibration signals: (a) Δ α , (b) Δ f , (c) α 0 , (d) α max , (e) α min .
Processes 10 01169 g007
Figure 8. Classification and comparison of centrifugal pump vibration signals by α 0 and α max of different methods: (a) α 0 from MFDFA, (b) α max from MFDFA, (c) α 0 from EMD-LS-MFDFA, (d) α max from EMD-LS-MFDFA.
Processes 10 01169 g008aProcesses 10 01169 g008b
Table 1. The degree of cavitation of the pump under different valve angles.
N P S H a   ( m ) N P S H r   ( m ) Working Condition
10.809.90Normal state
10.66Loosened ground bolt
9.91Normal state
7.96Slight cavitation
4.67Moderate cavitation
1.21Severe cavitation
Table 2. Characteristic parameters of the vibration signals of the centrifugal pump.
Characteristic ParameterNormal StateSlight CavitationModerate CavitationSevere CavitationLoosened Ground Bolt
Δ α 0.05310.12070.10940.13130.2363
Δ f 0.10580.18680.19660.25160.3347
α 0 0.06800.10940.13780.19510.2013
α max 0.10500.19580.21780.30320.3828
α min 0.05190.07510.10840.17190.1465
Table 3. Statistical data of the characteristic parameters of the centrifugal pump vibration signals.
Signal TypeCharacteristic Parameter
Δ α Δ f α 0 α max α min
Normal stateMean value0.0327 0.1457 0.0723 0.1045 0.0734
Mean square error0.0198 0.0653 0.0116 0.0105 0.0282
Slight cavitationMean value0.1199 0.2298 0.1110 0.2005 0.0806
Mean square error0.0157 0.0353 0.0054 0.0054 0.0141
Moderate cavitationMean value0.0863 0.2821 0.1293 0.2066 0.1202
Mean square error0.0124 0.0772 0.0122 0.0141 0.0212
Severe cavitationMean value0.1502 0.3117 0.1615 0.2820 0.1317
Mean square error0.0399 0.0772 0.0198 0.0363 0.0272
Loosened ground boltMean value0.2588 0.4385 0.1990 0.4089 0.1502
Mean square error0.0358 0.0623 0.0068 0.0363 0.0085
Publisher’s Note: MDPI stays neutral with regard to jurisdictional claims in published maps and institutional affiliations.

