
Photocatalytic Degradation of Diazo Dye over Suspended and Immobilized TiO2 Catalyst in Swirl Flow Reactor: Kinetic Modeling


Abstract
:1. Introduction
2. Experimental Details
2.1. Materials
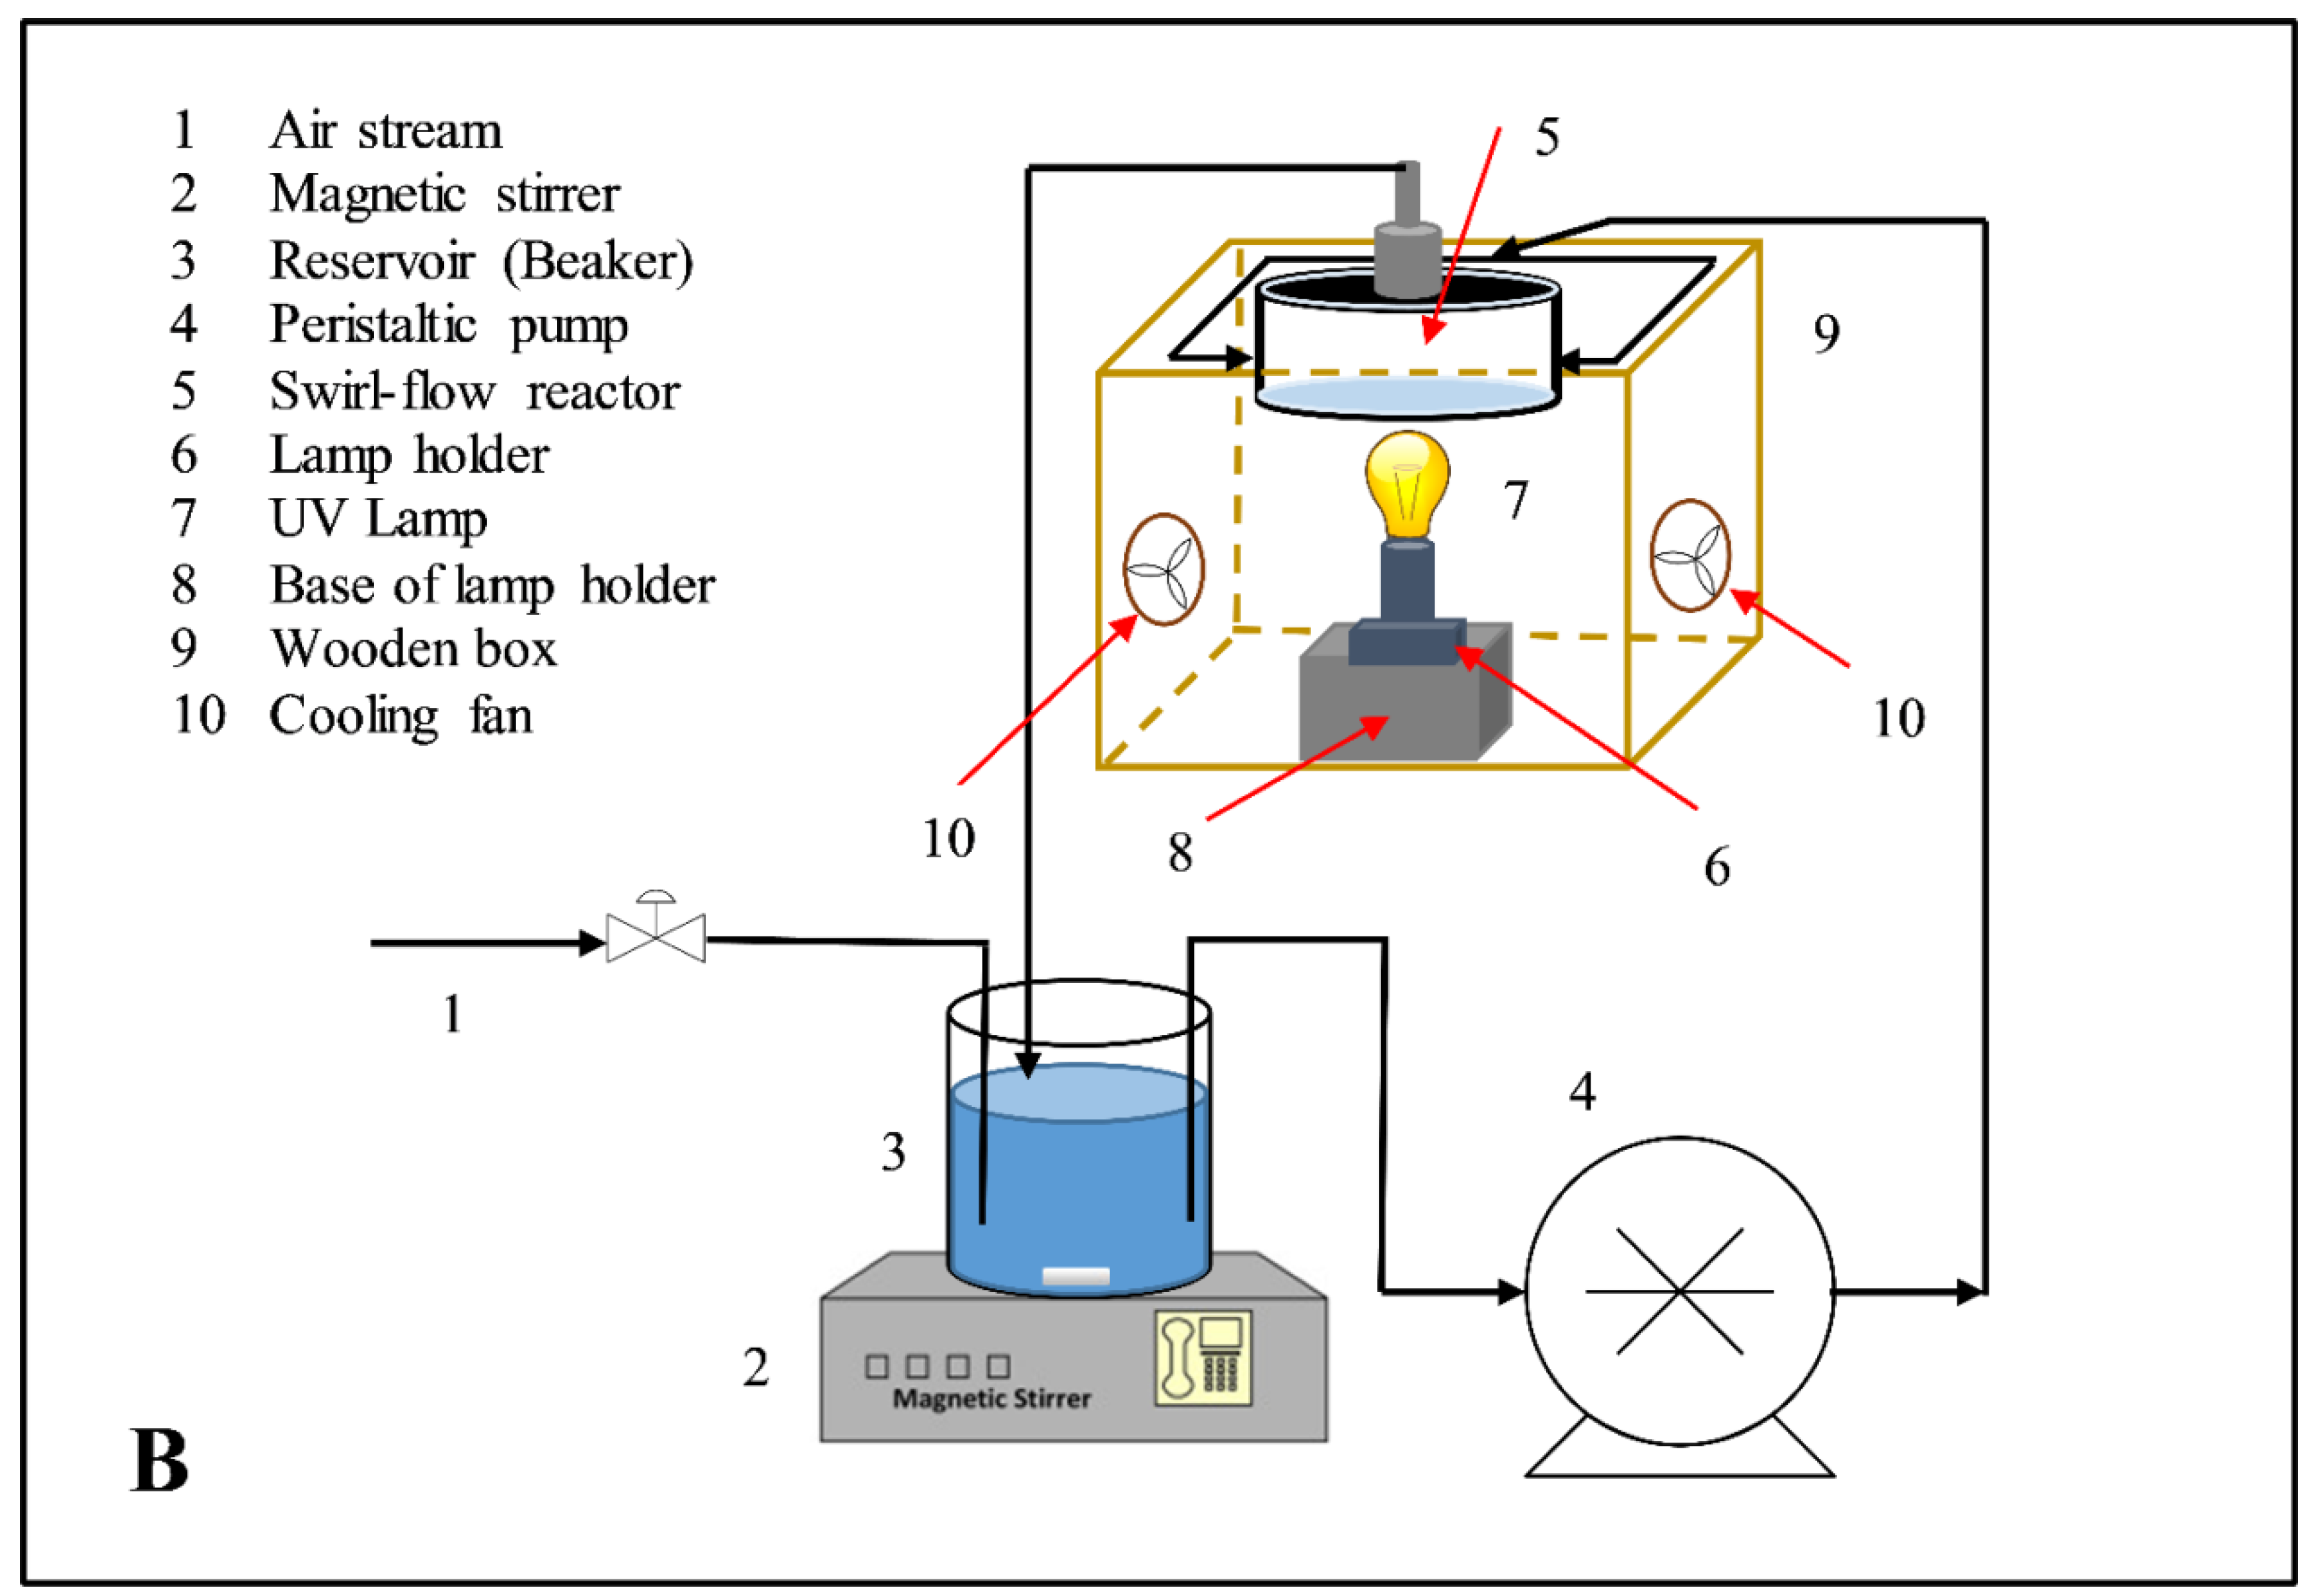
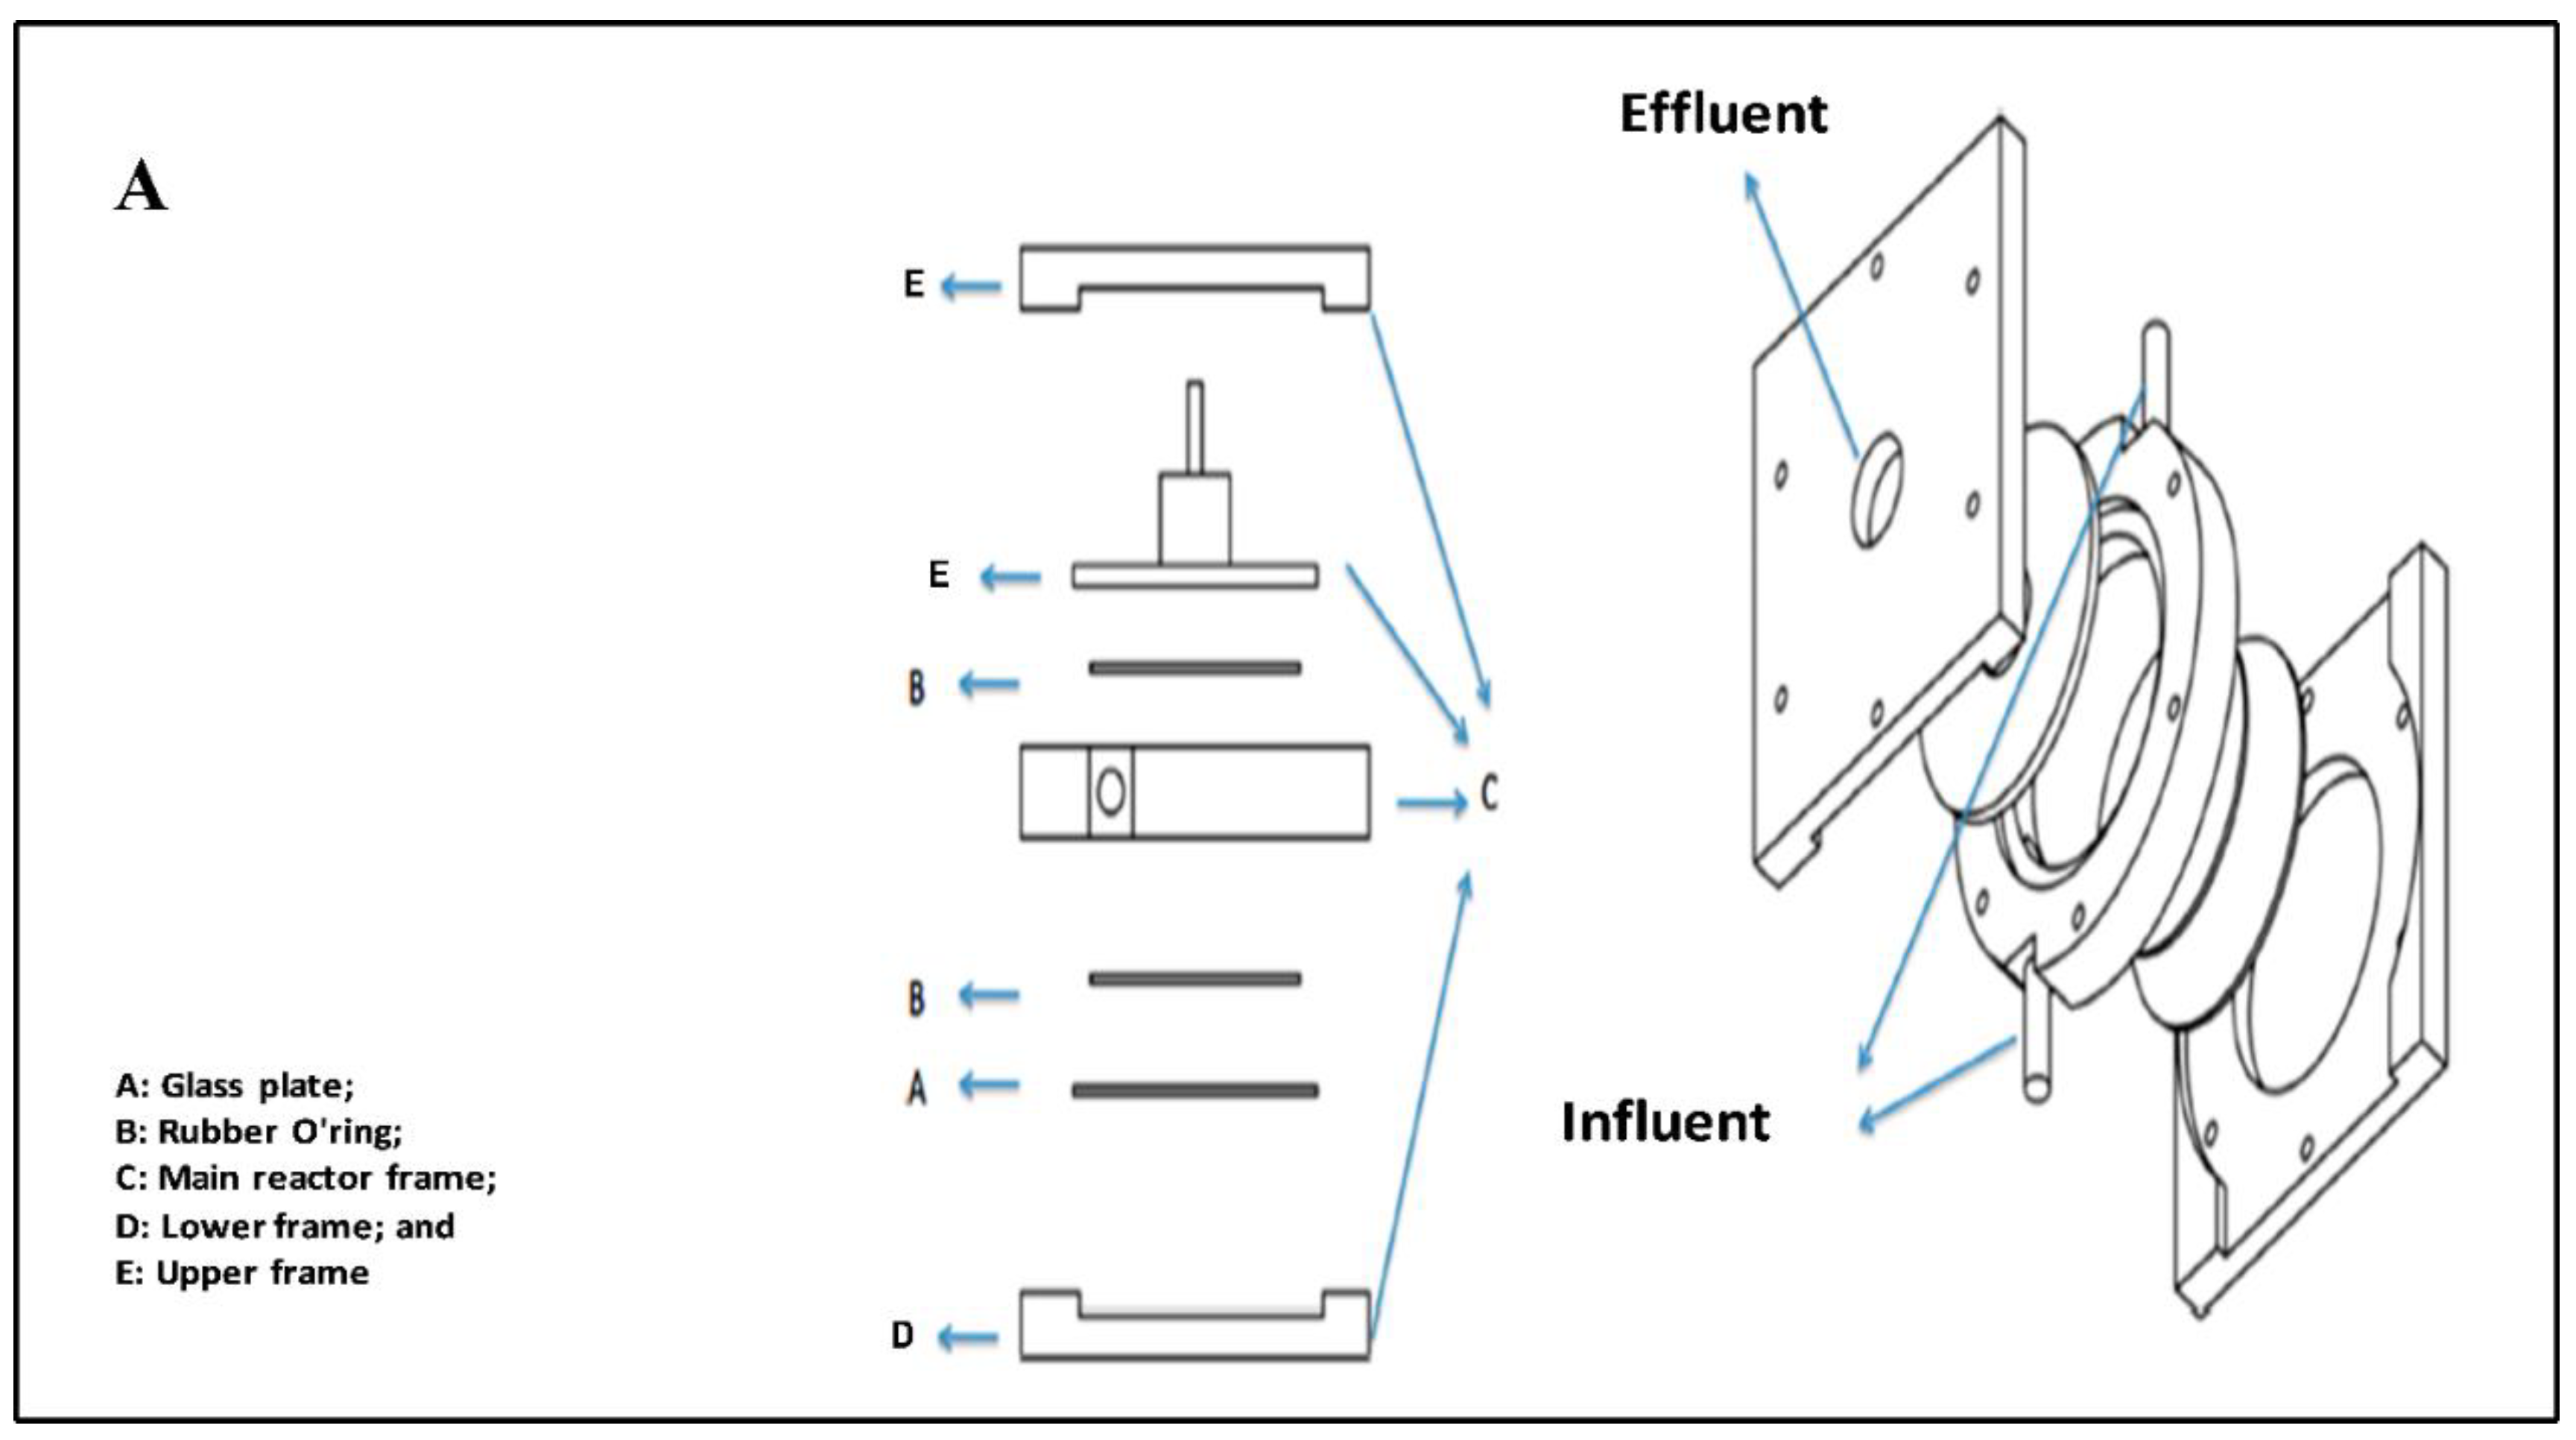
2.2. Swirl-Flow Photoreactor
2.3. Catalyst Immobilization
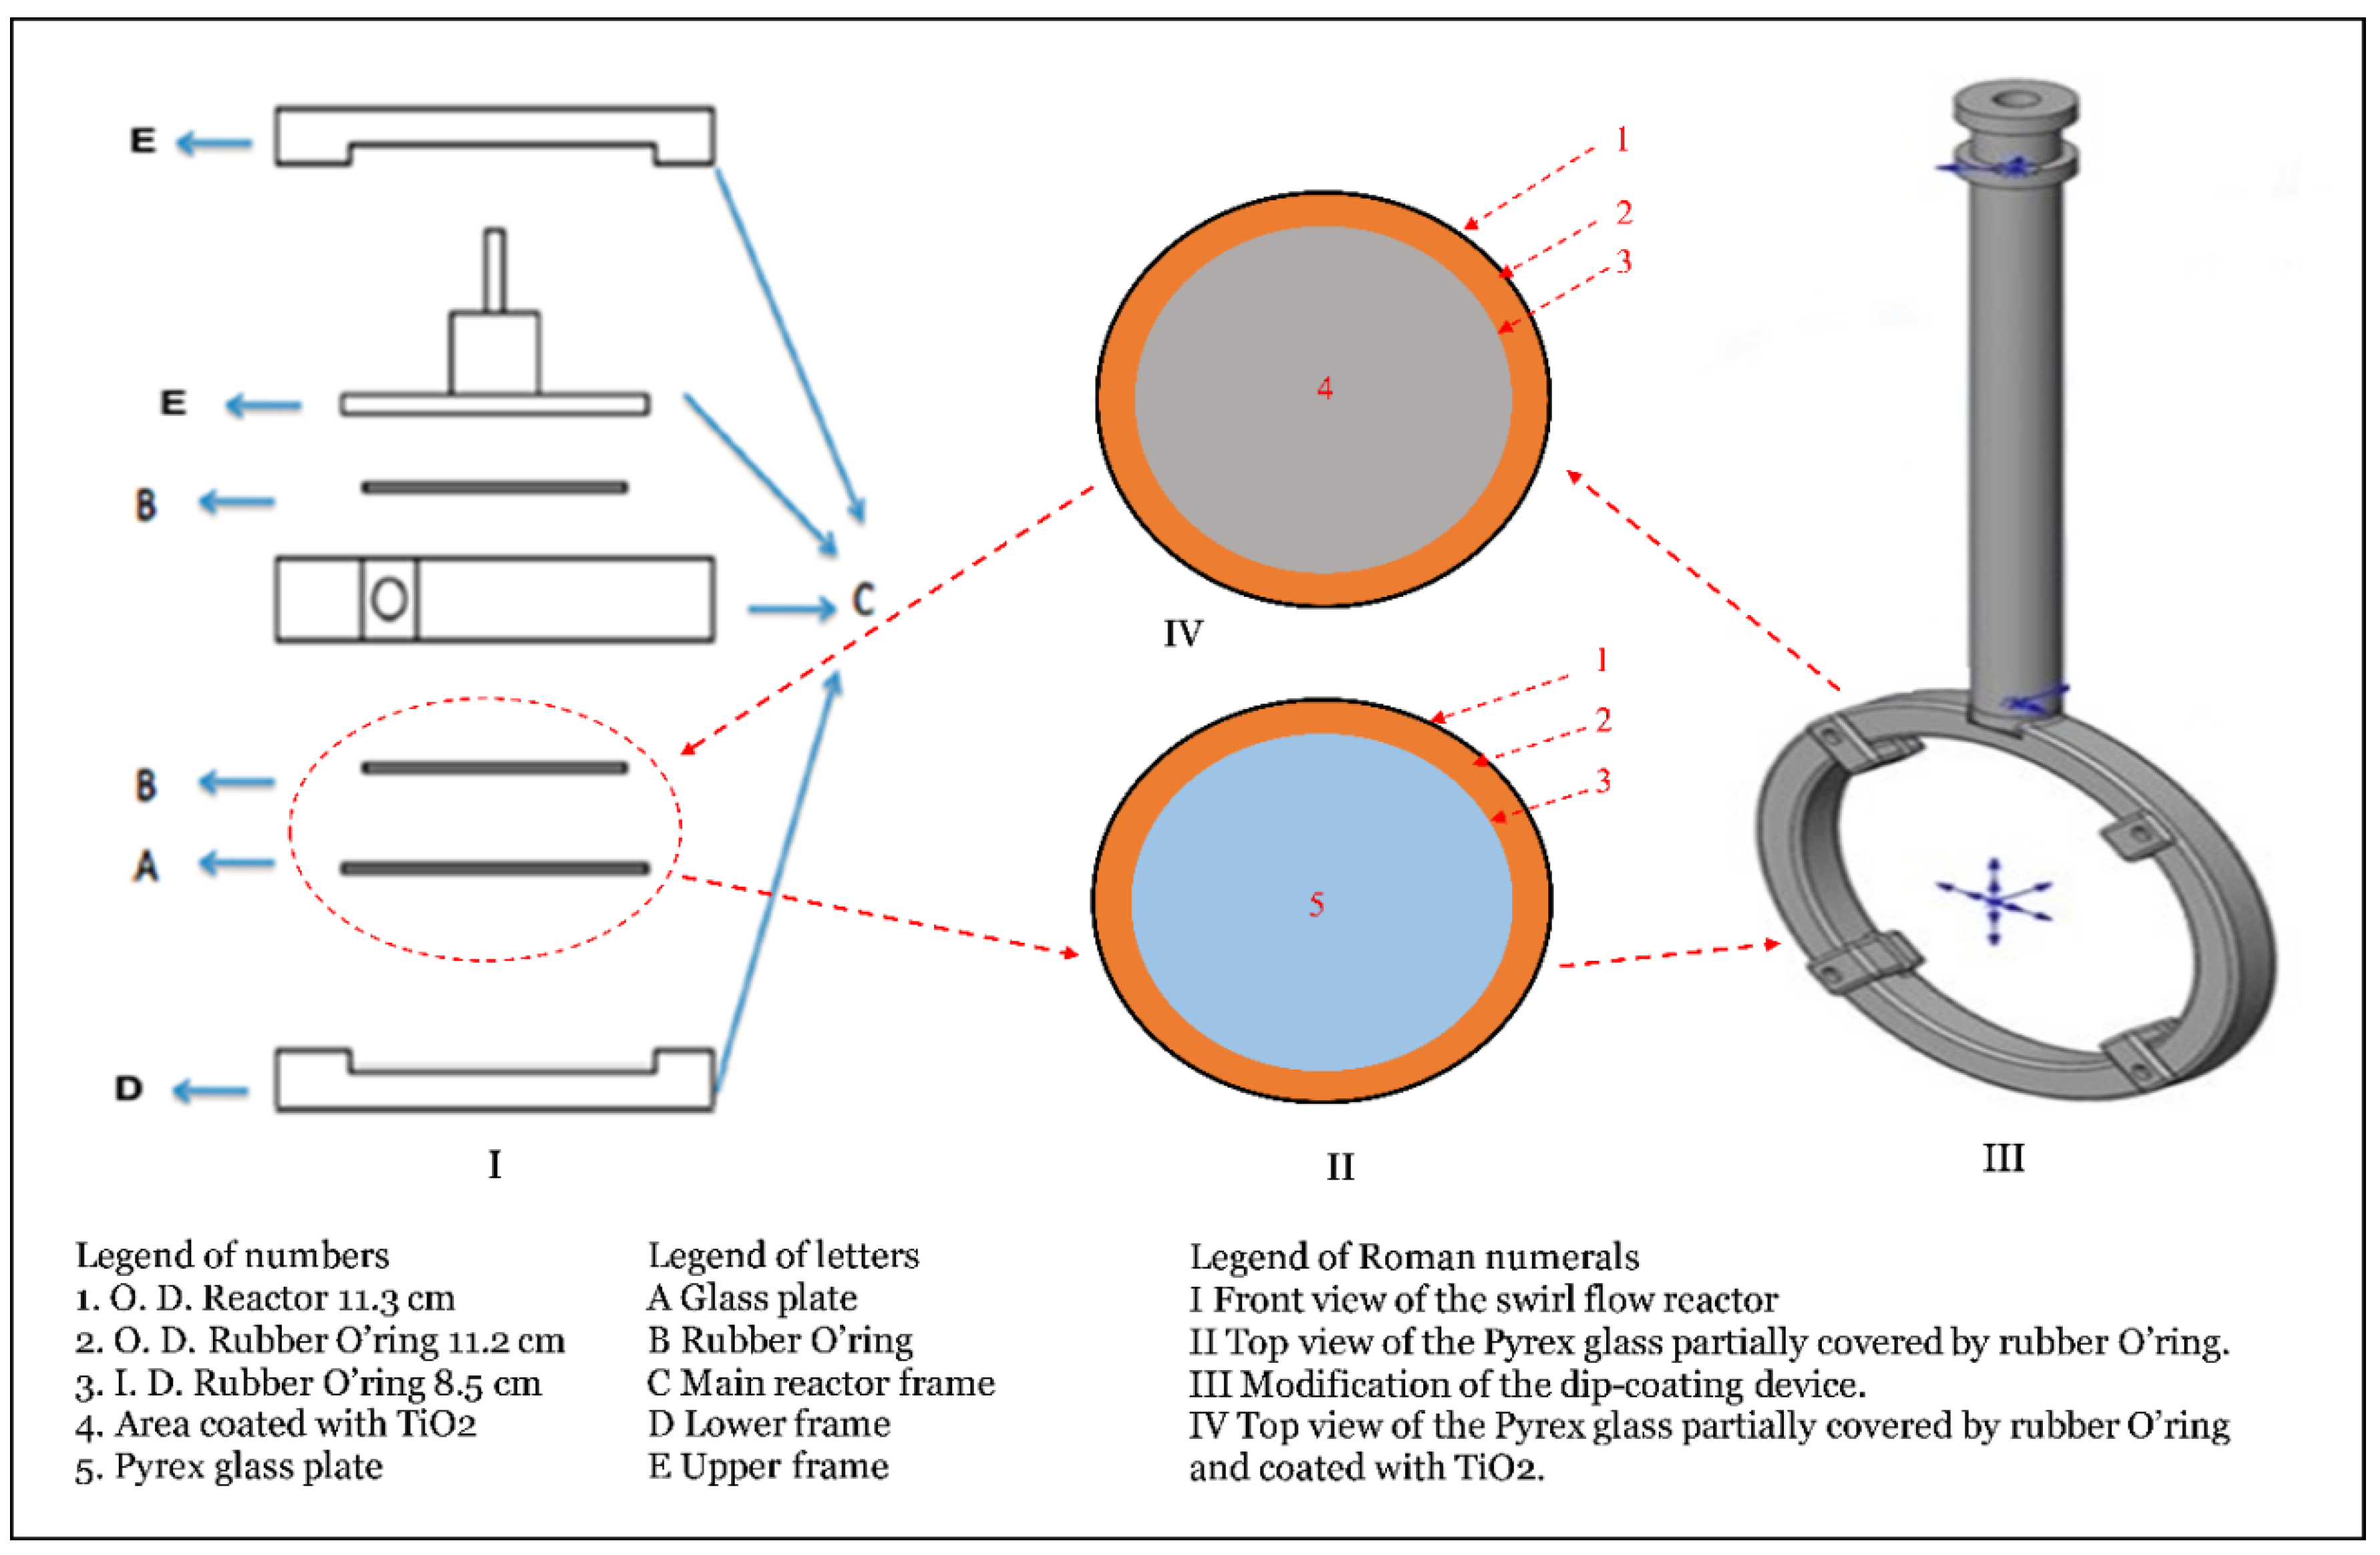
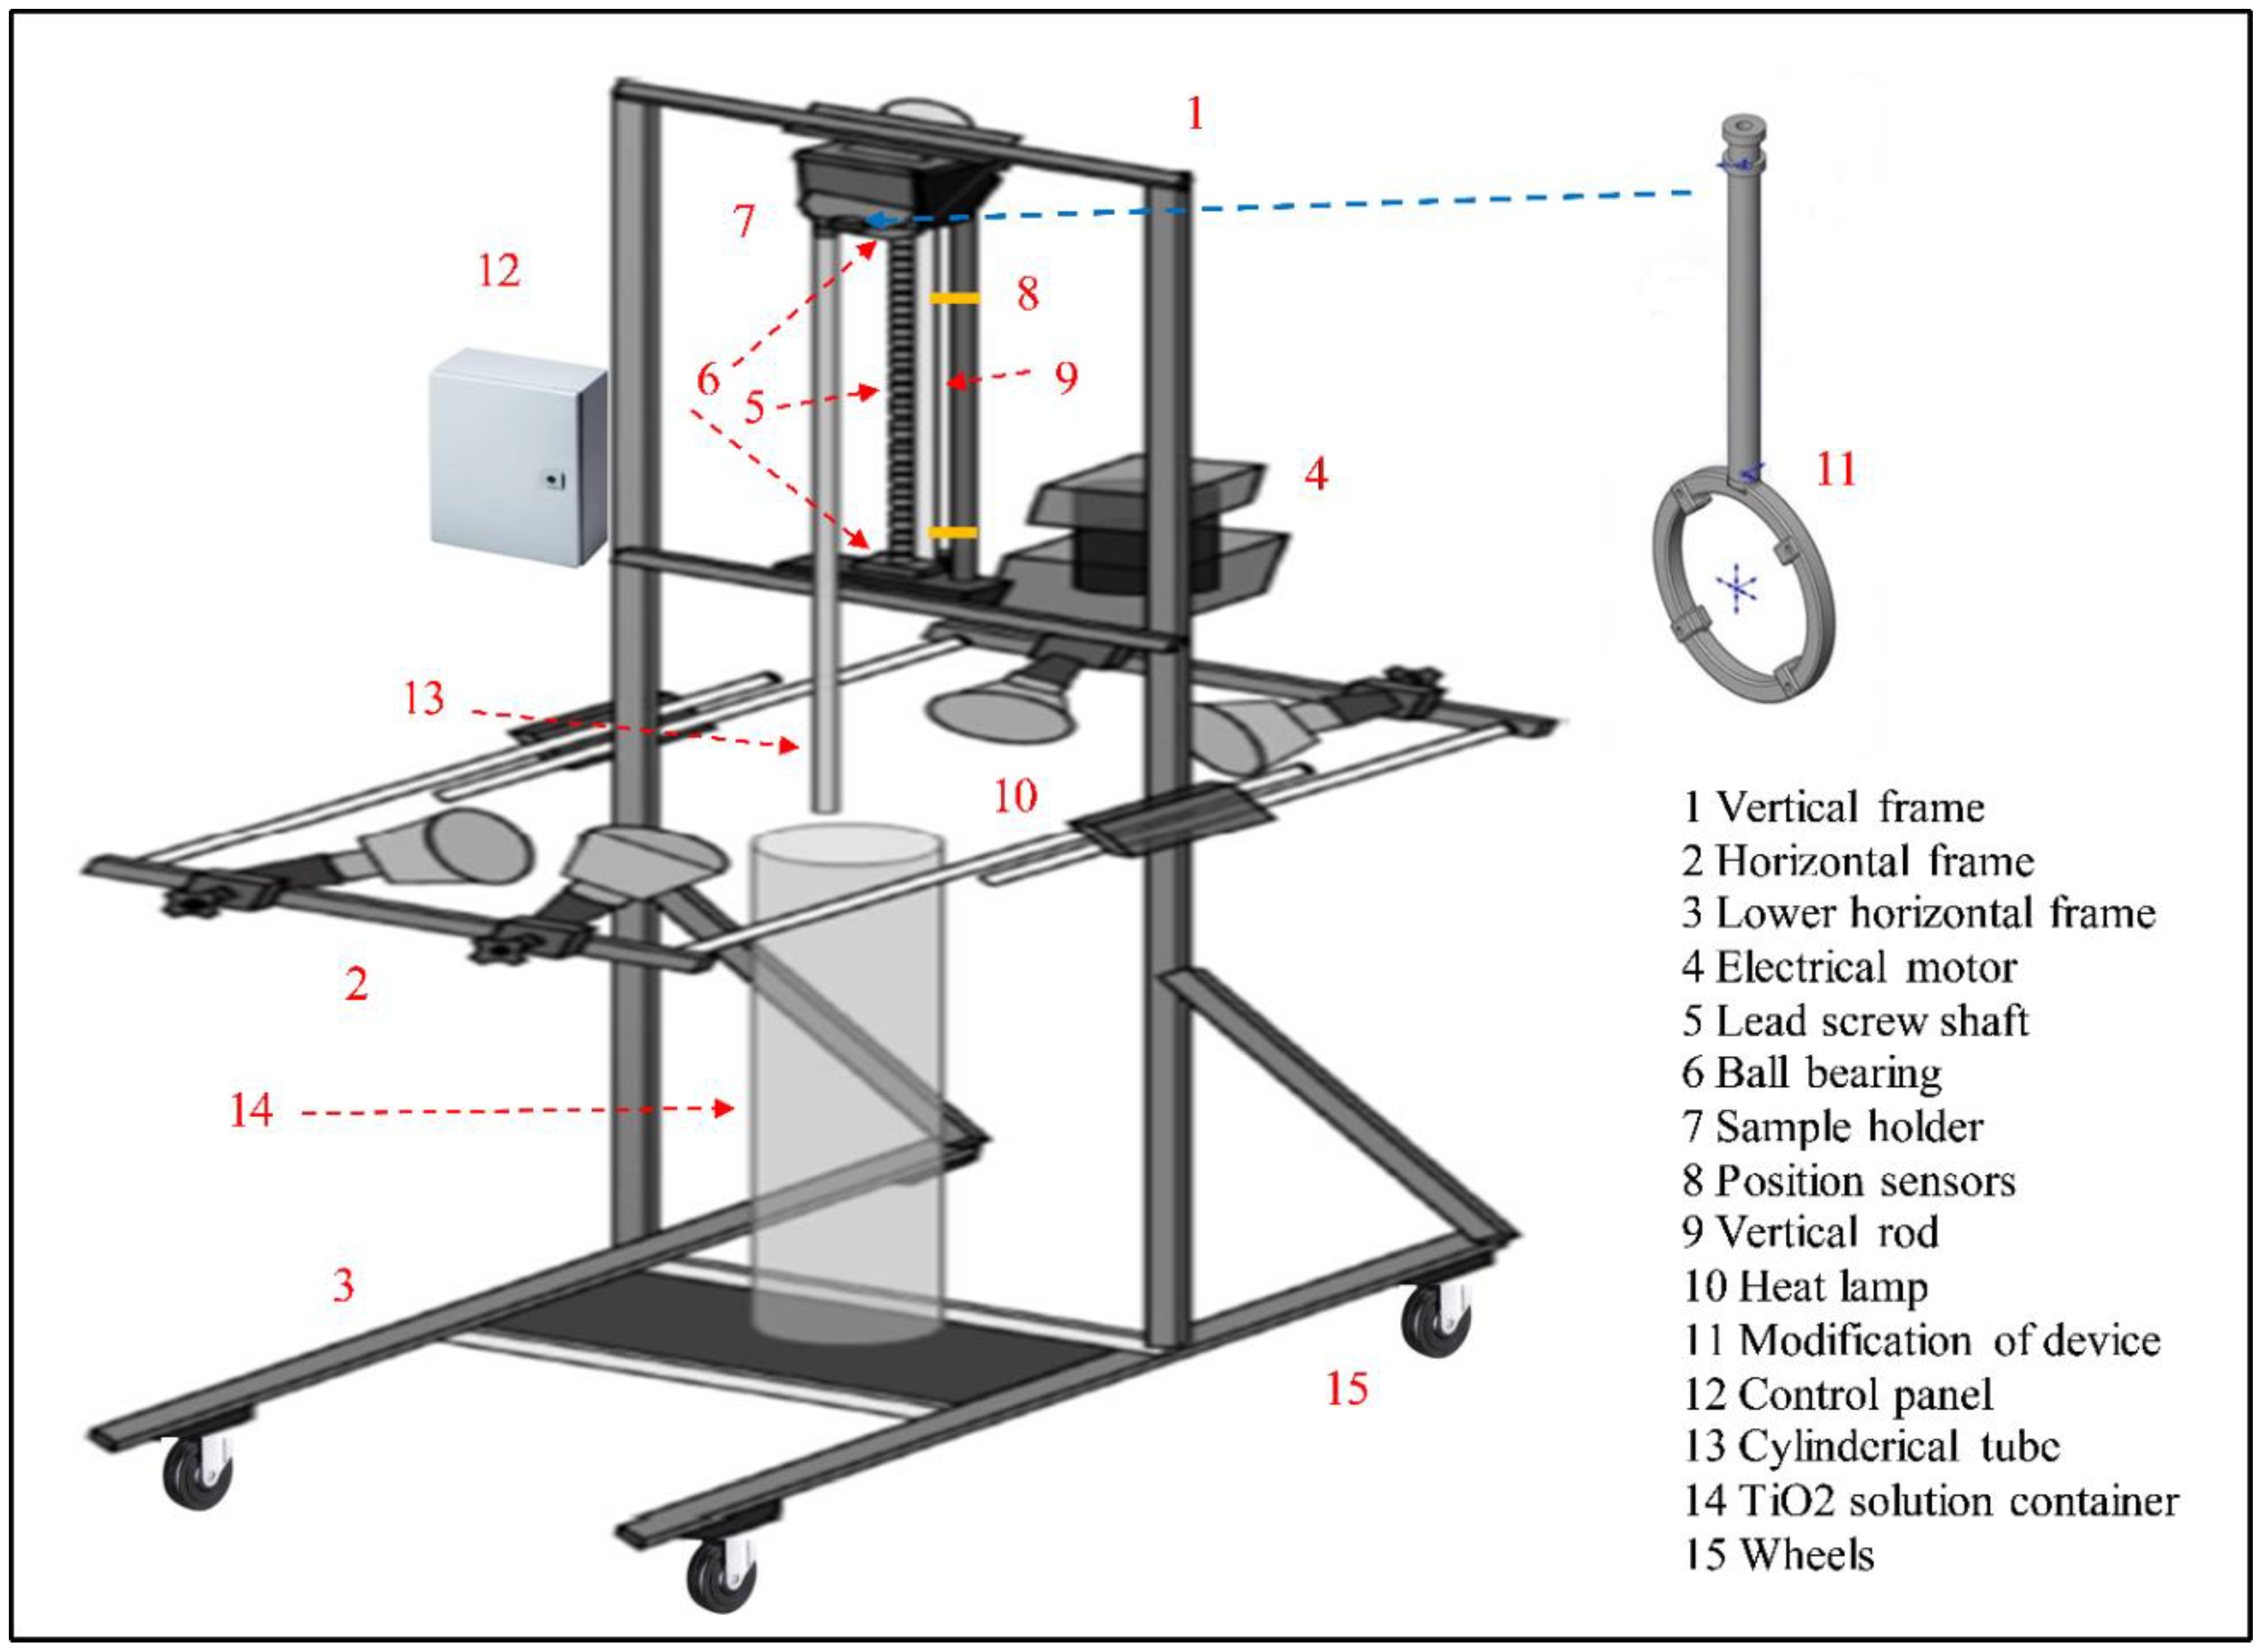
2.3.1. Dip-Coating Apparatus
2.3.2. Catalyst Immobilization Procedure
2.3.3. Surface Characterization of Thin Film
2.4. Photodegradation Experiments
2.5. Analytical Methods
3. Results and Discussion
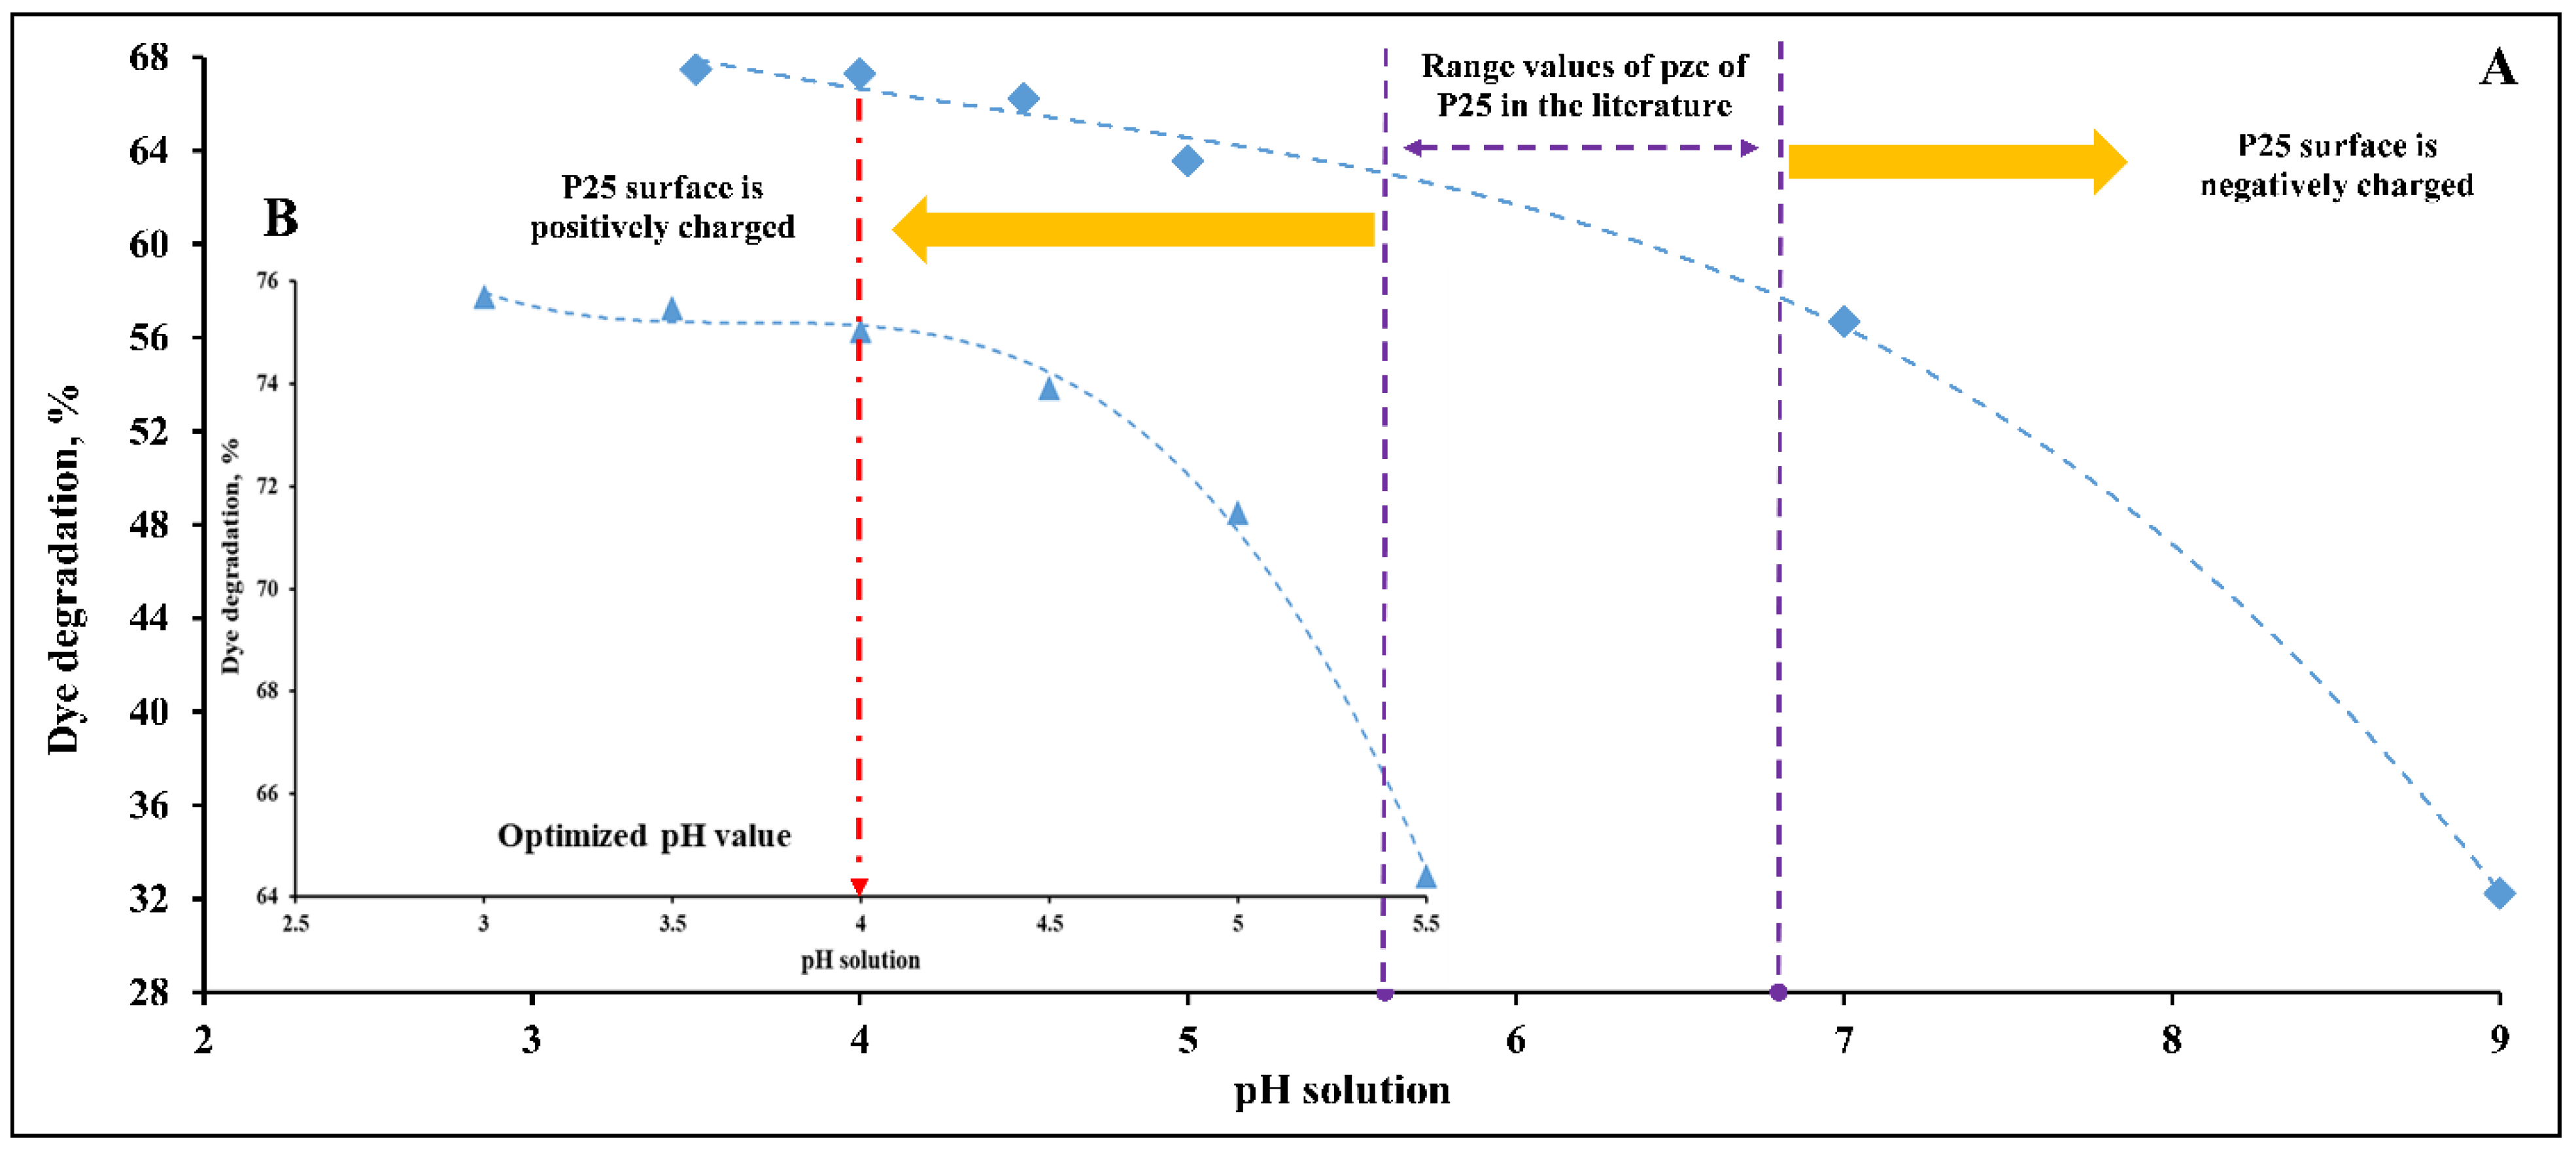
3.1. pH Optimization
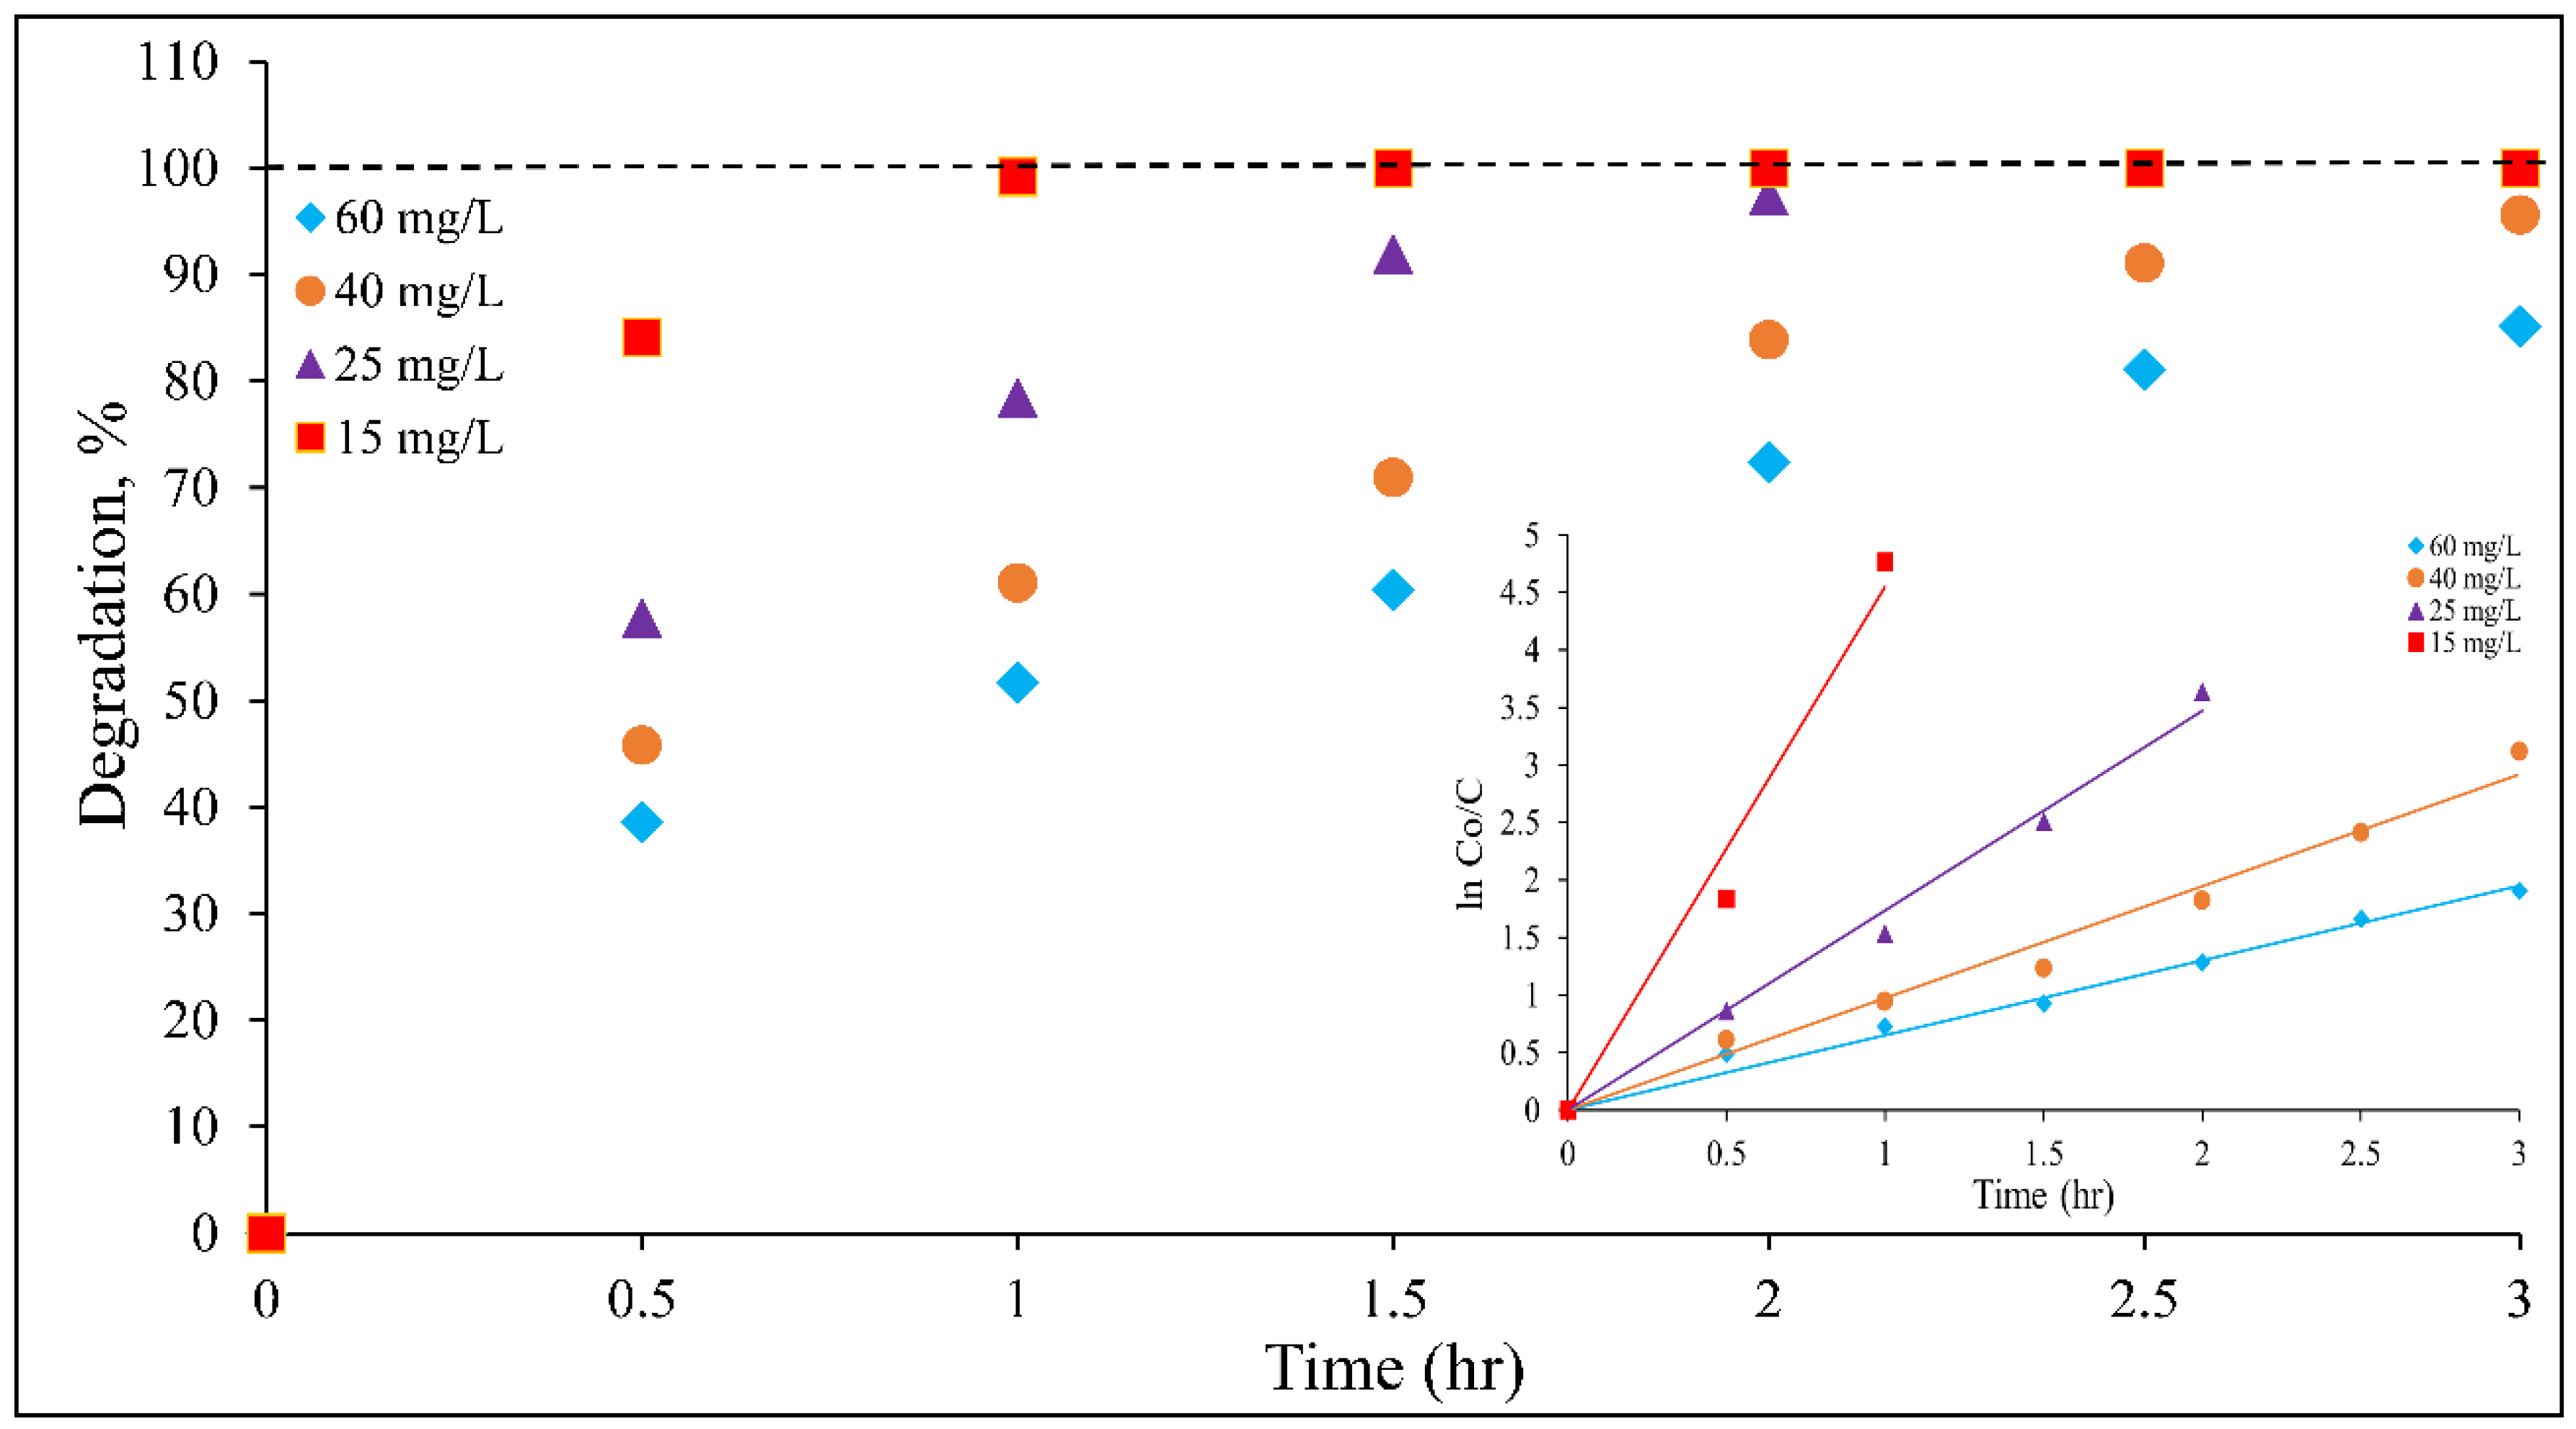
3.2. Degradation Kinetics
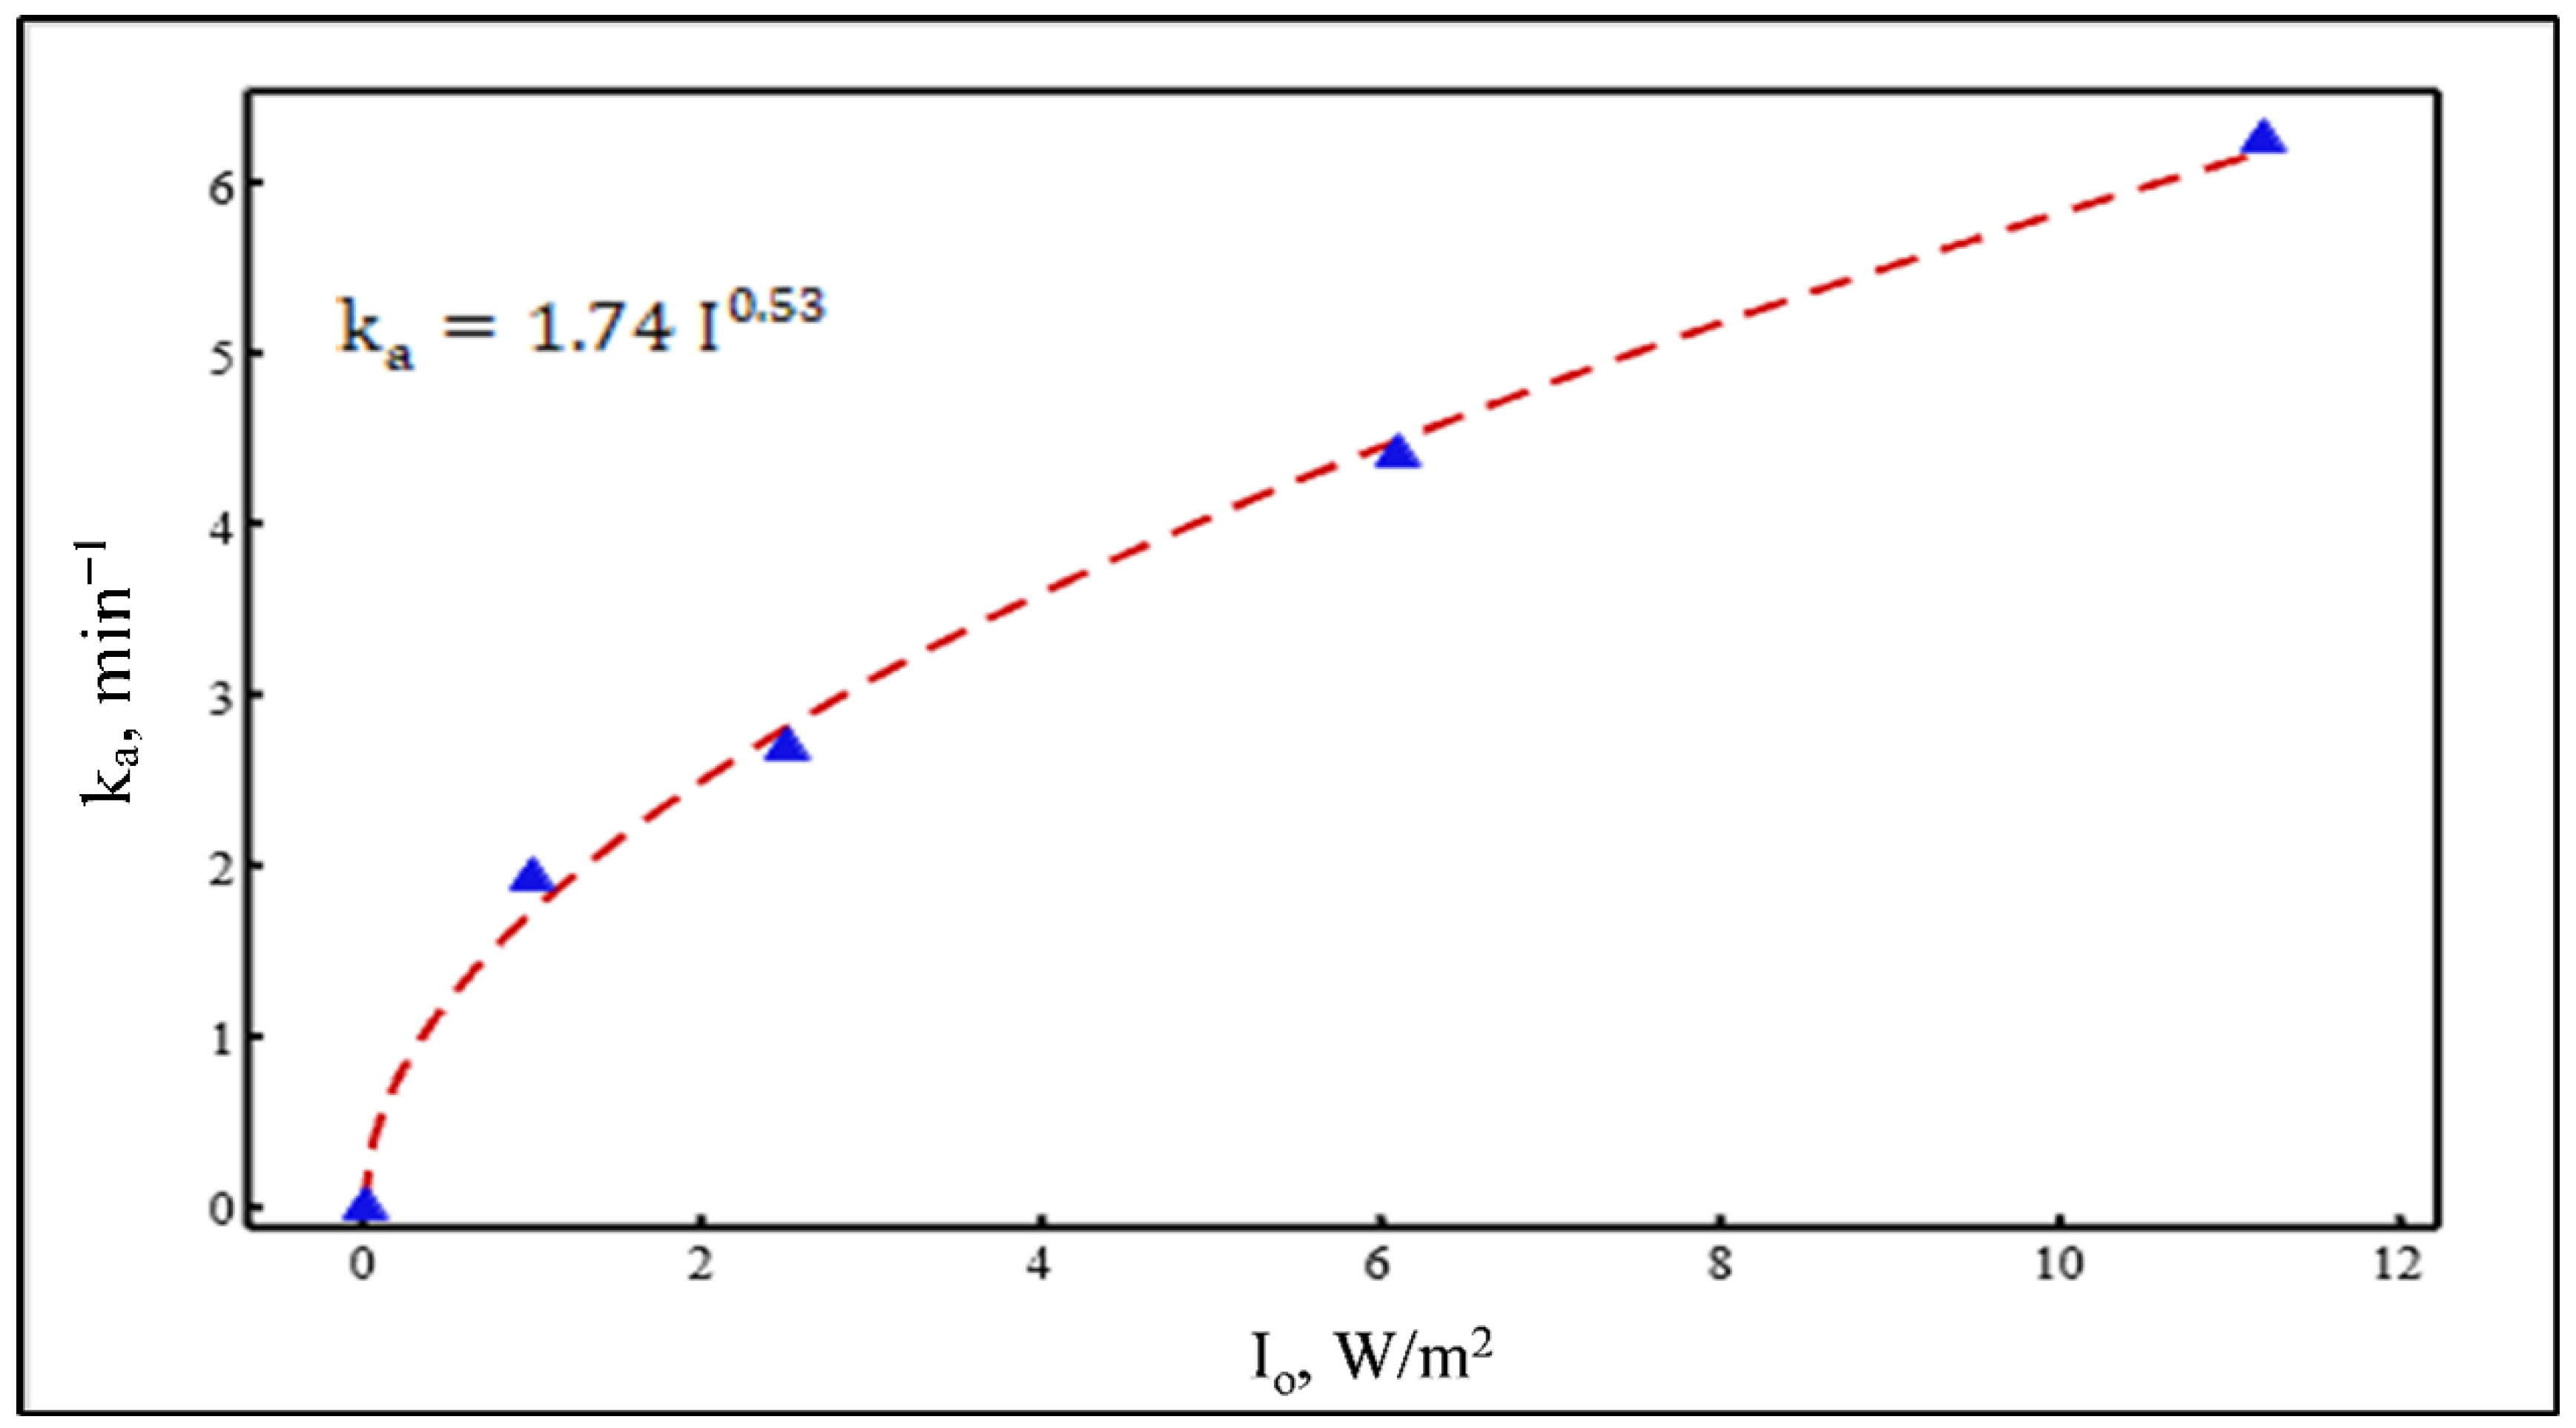
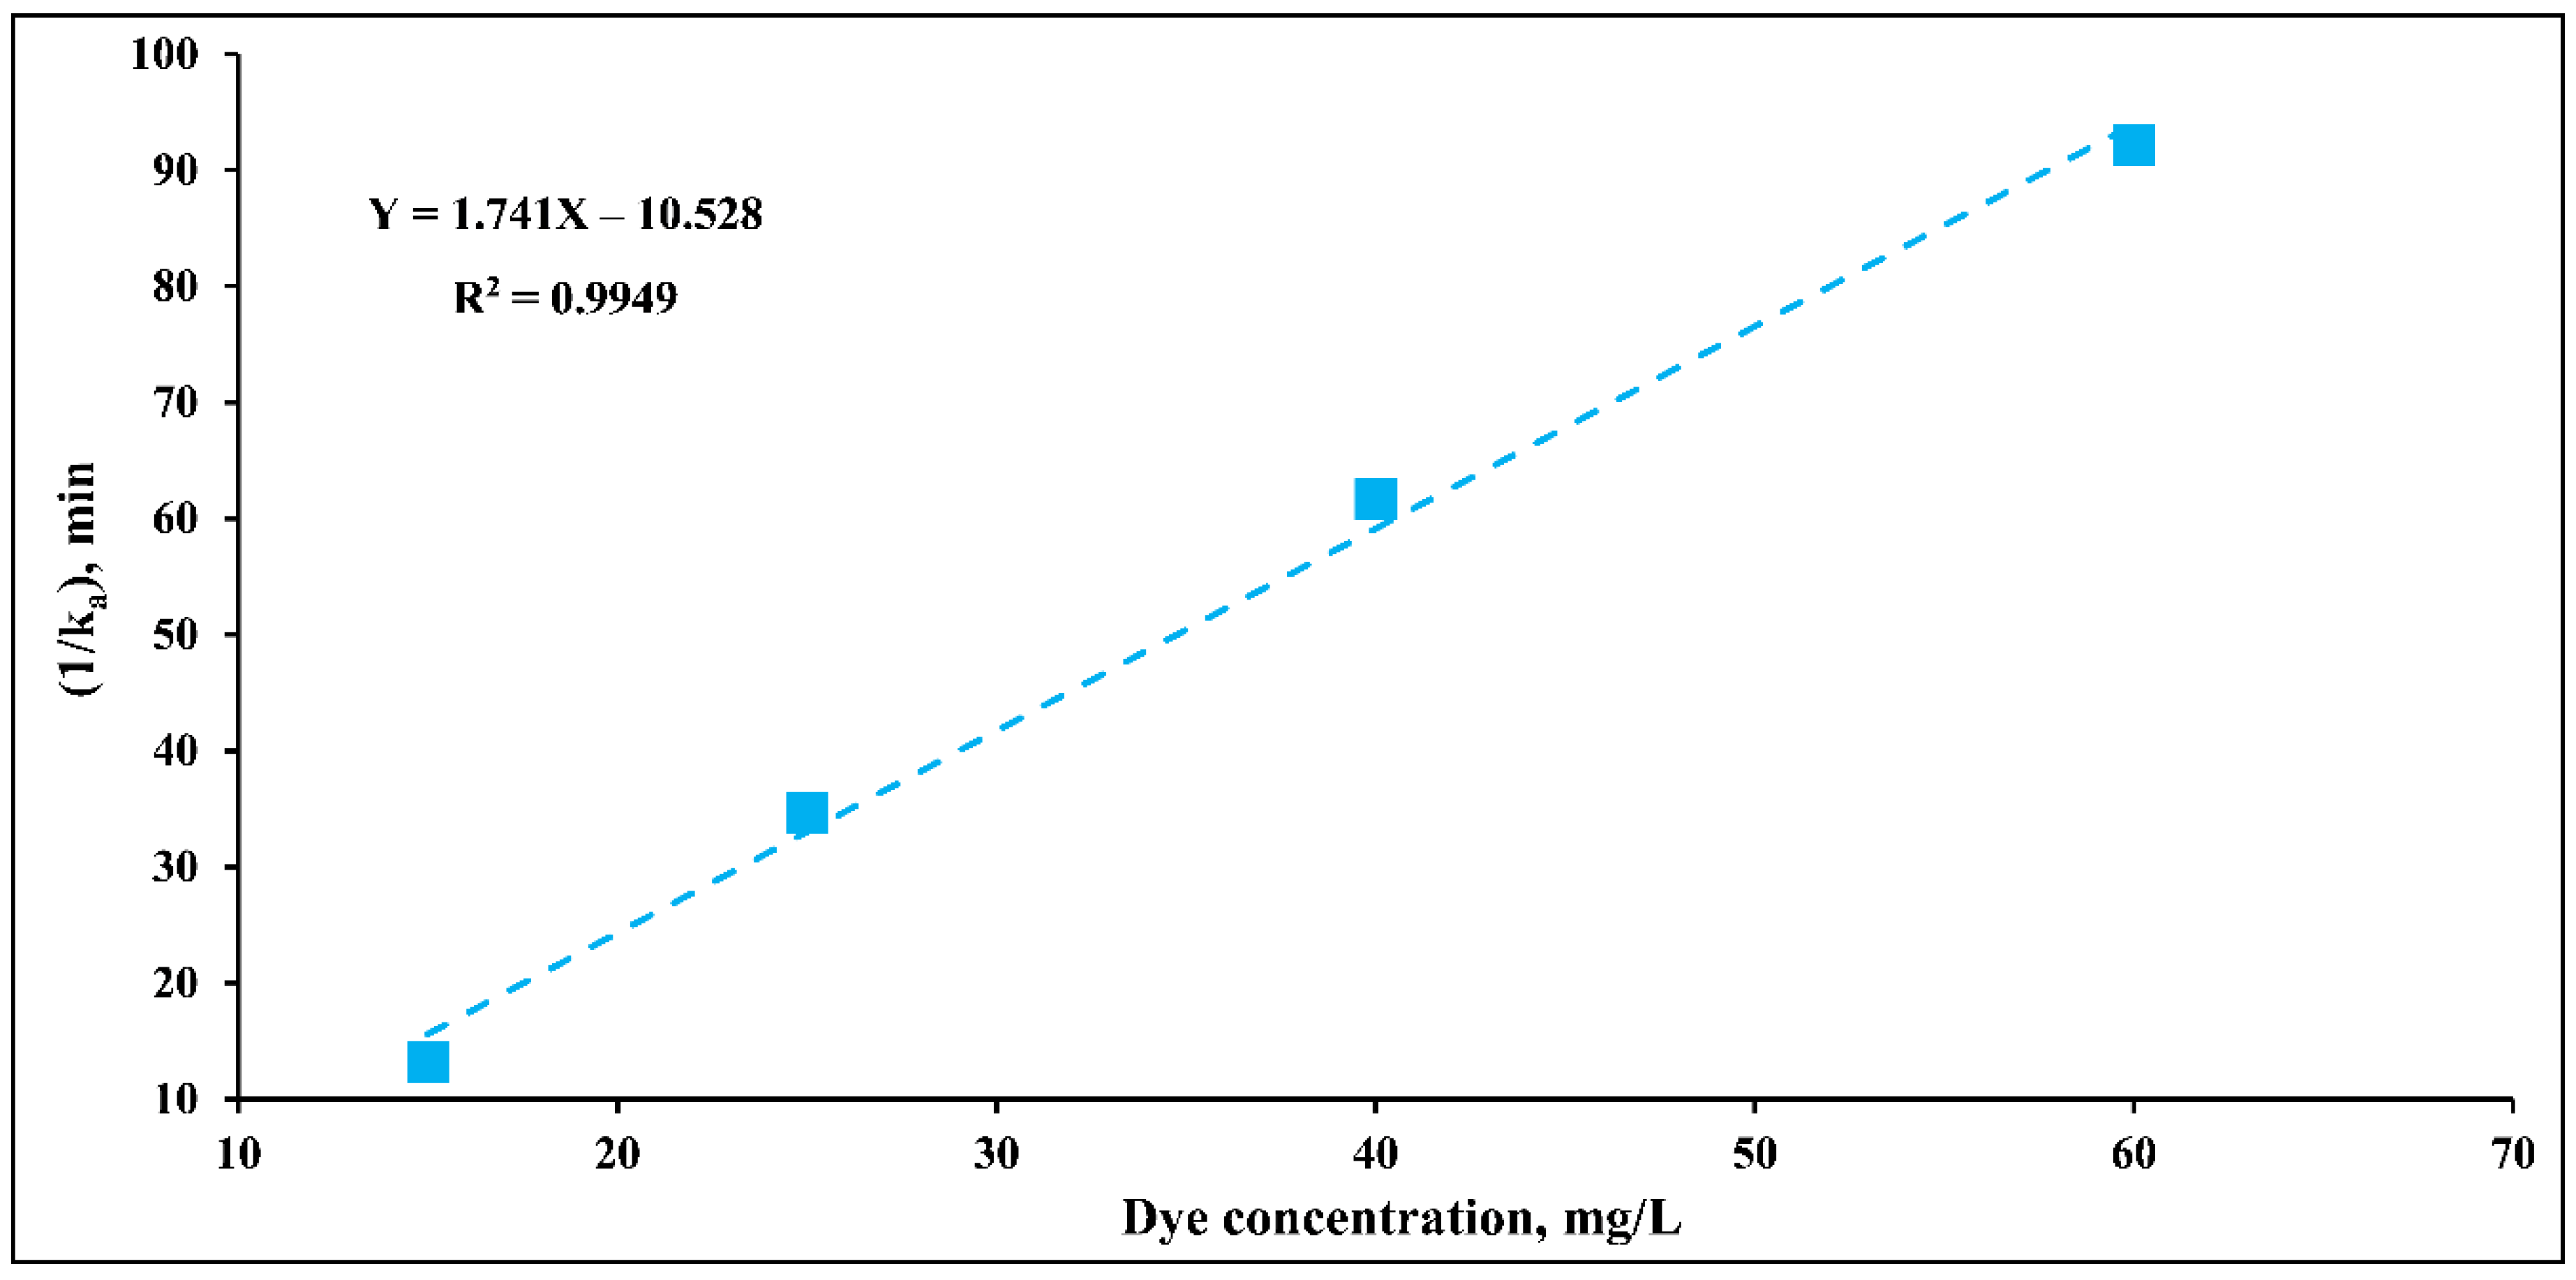
3.2.1. Approach of ka Model
3.2.2. Single Value of kr and k
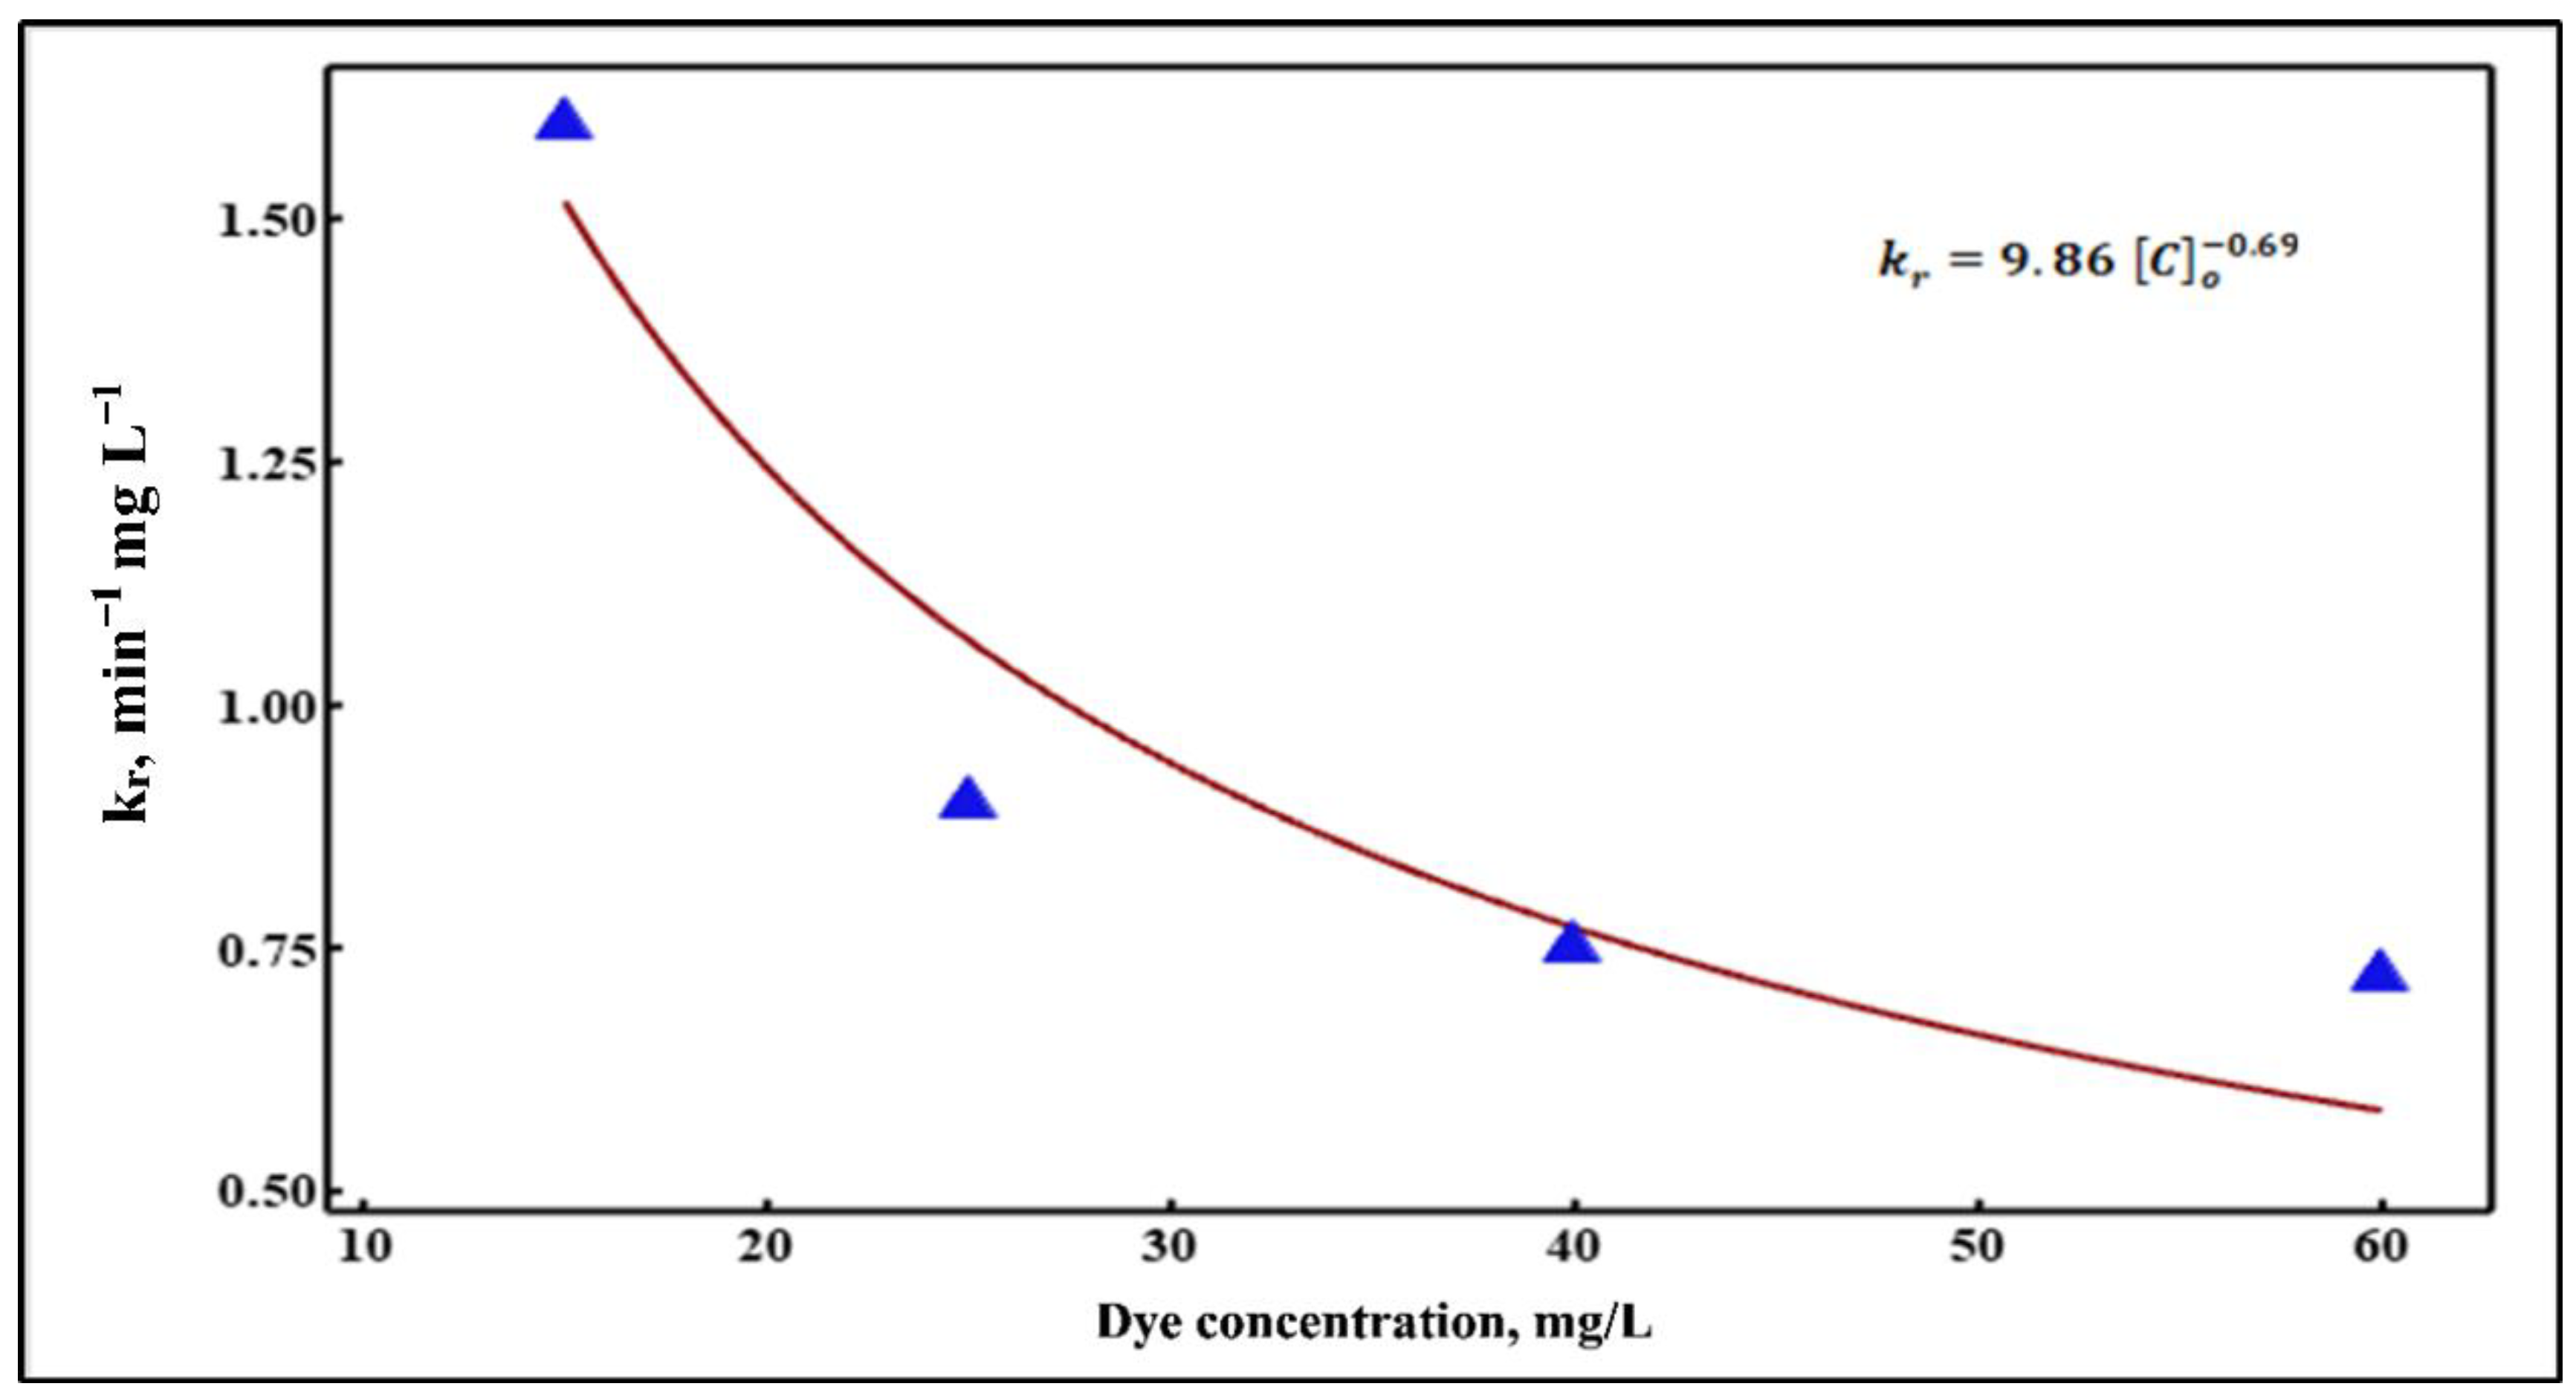
3.2.3. Approach of kr as of Variable
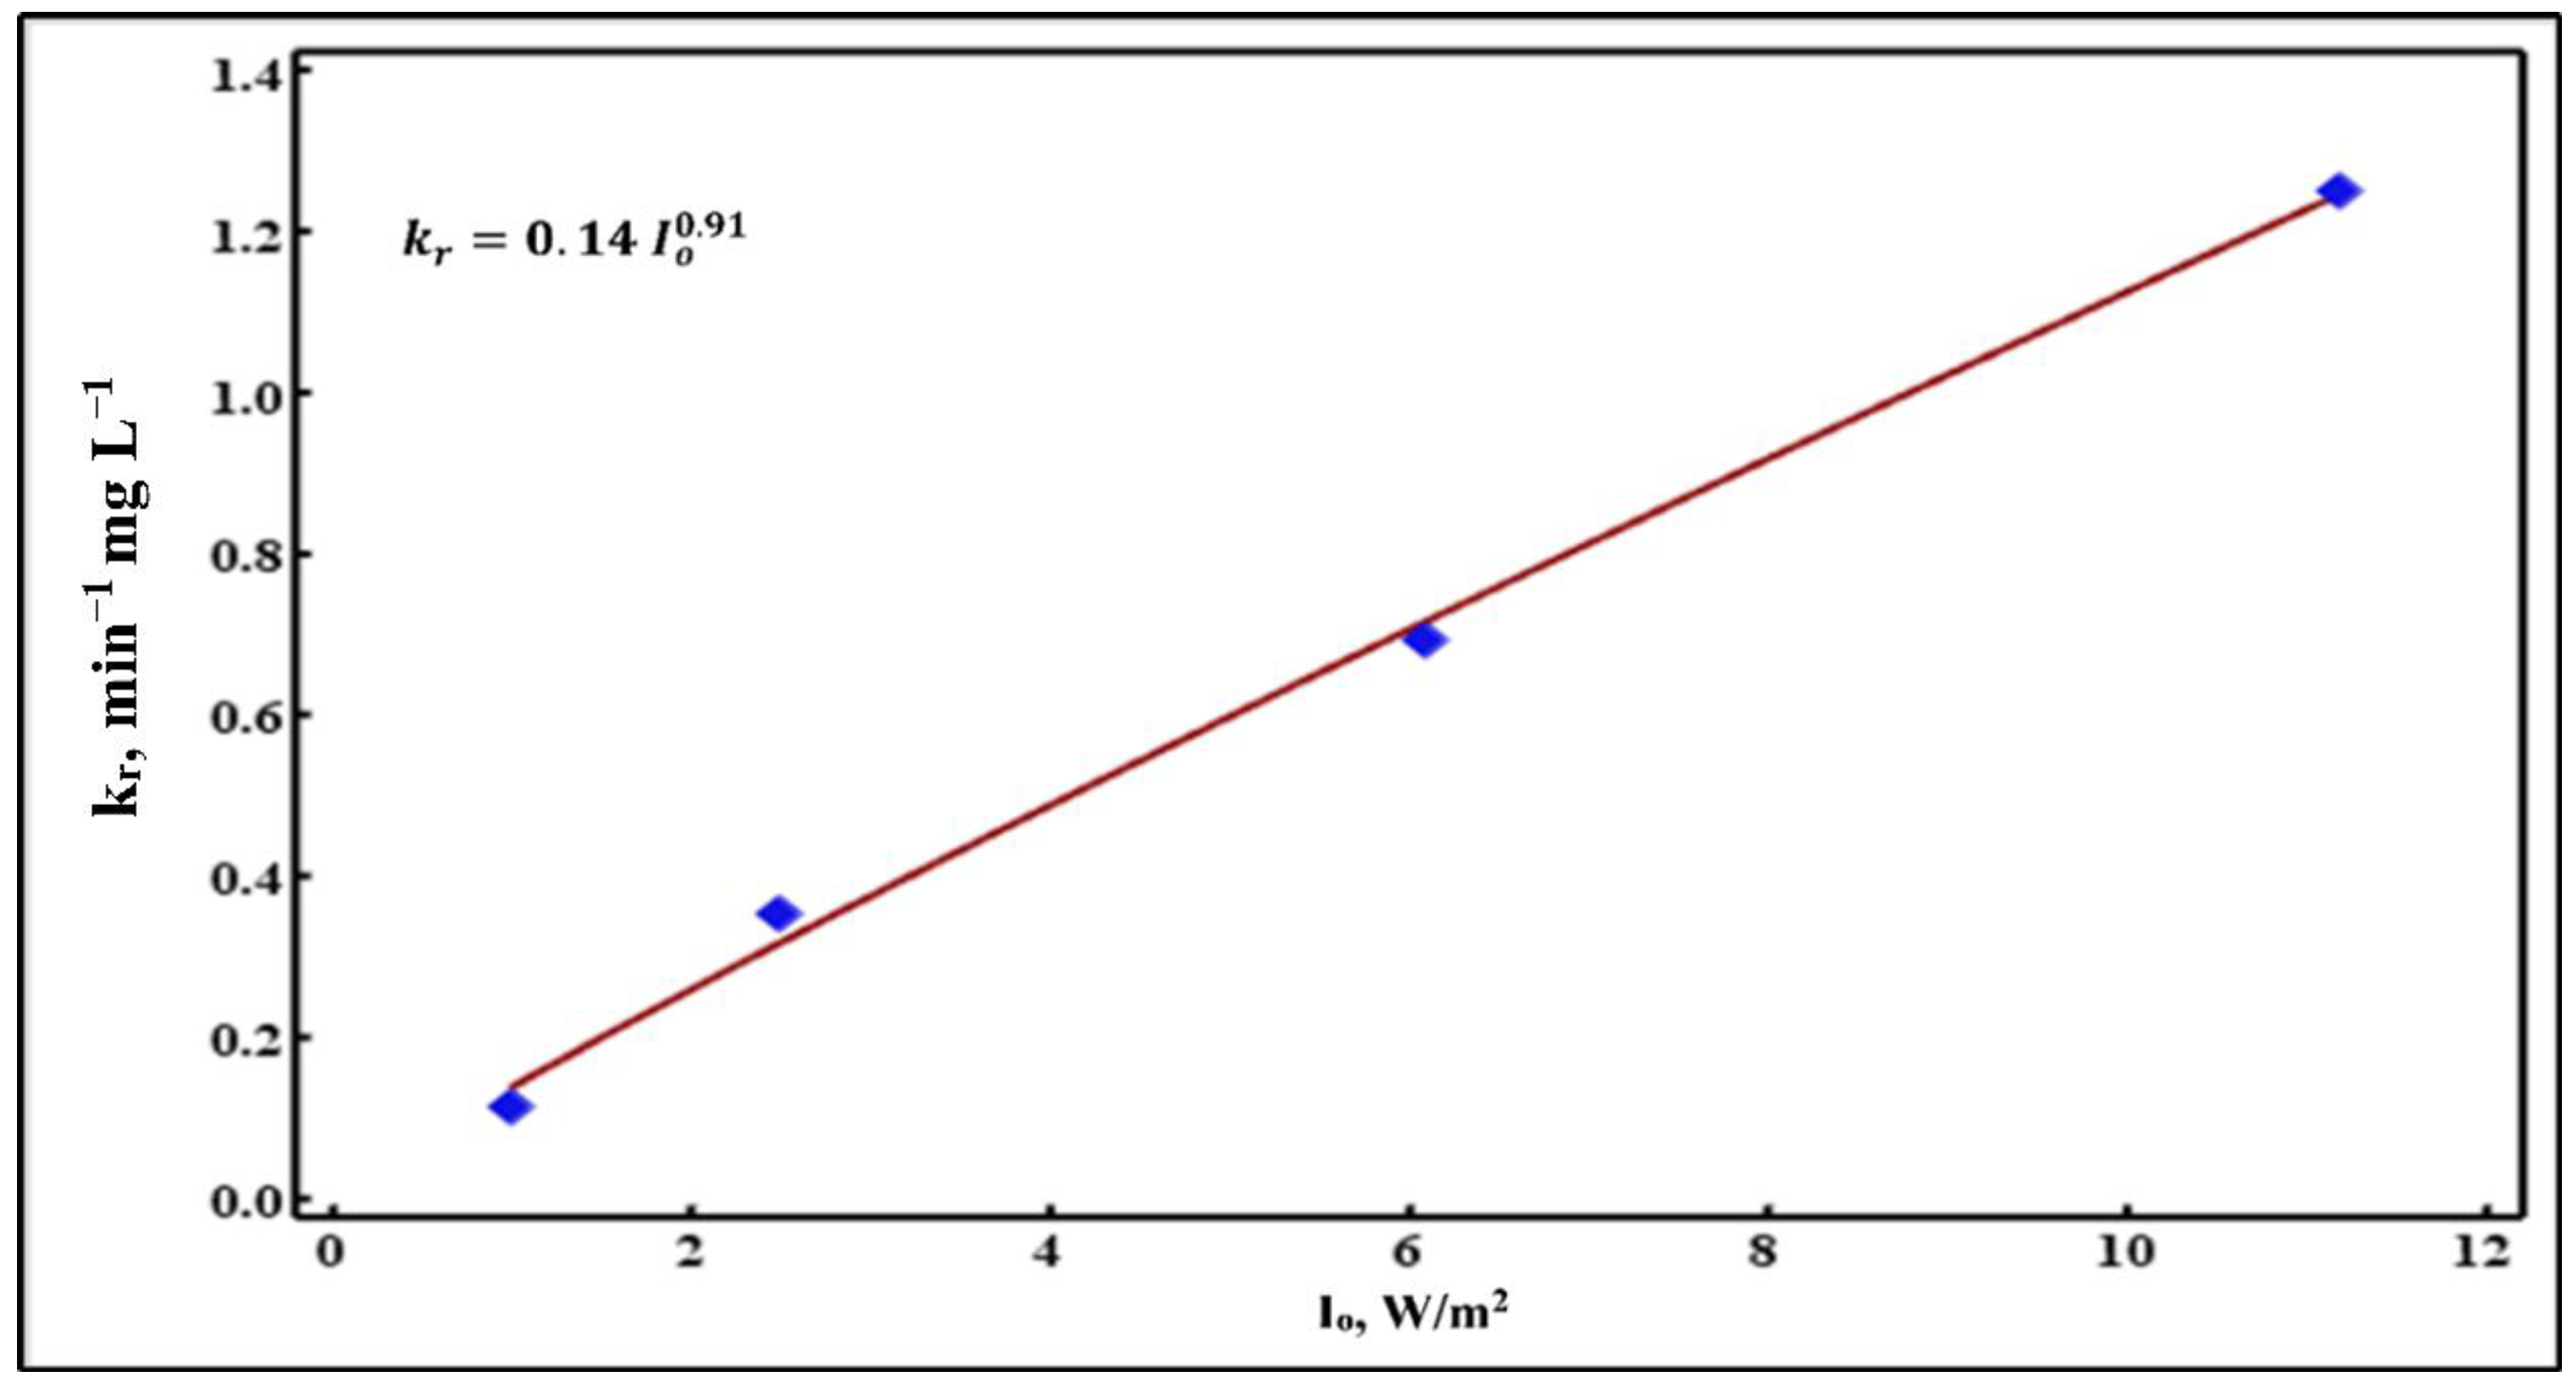
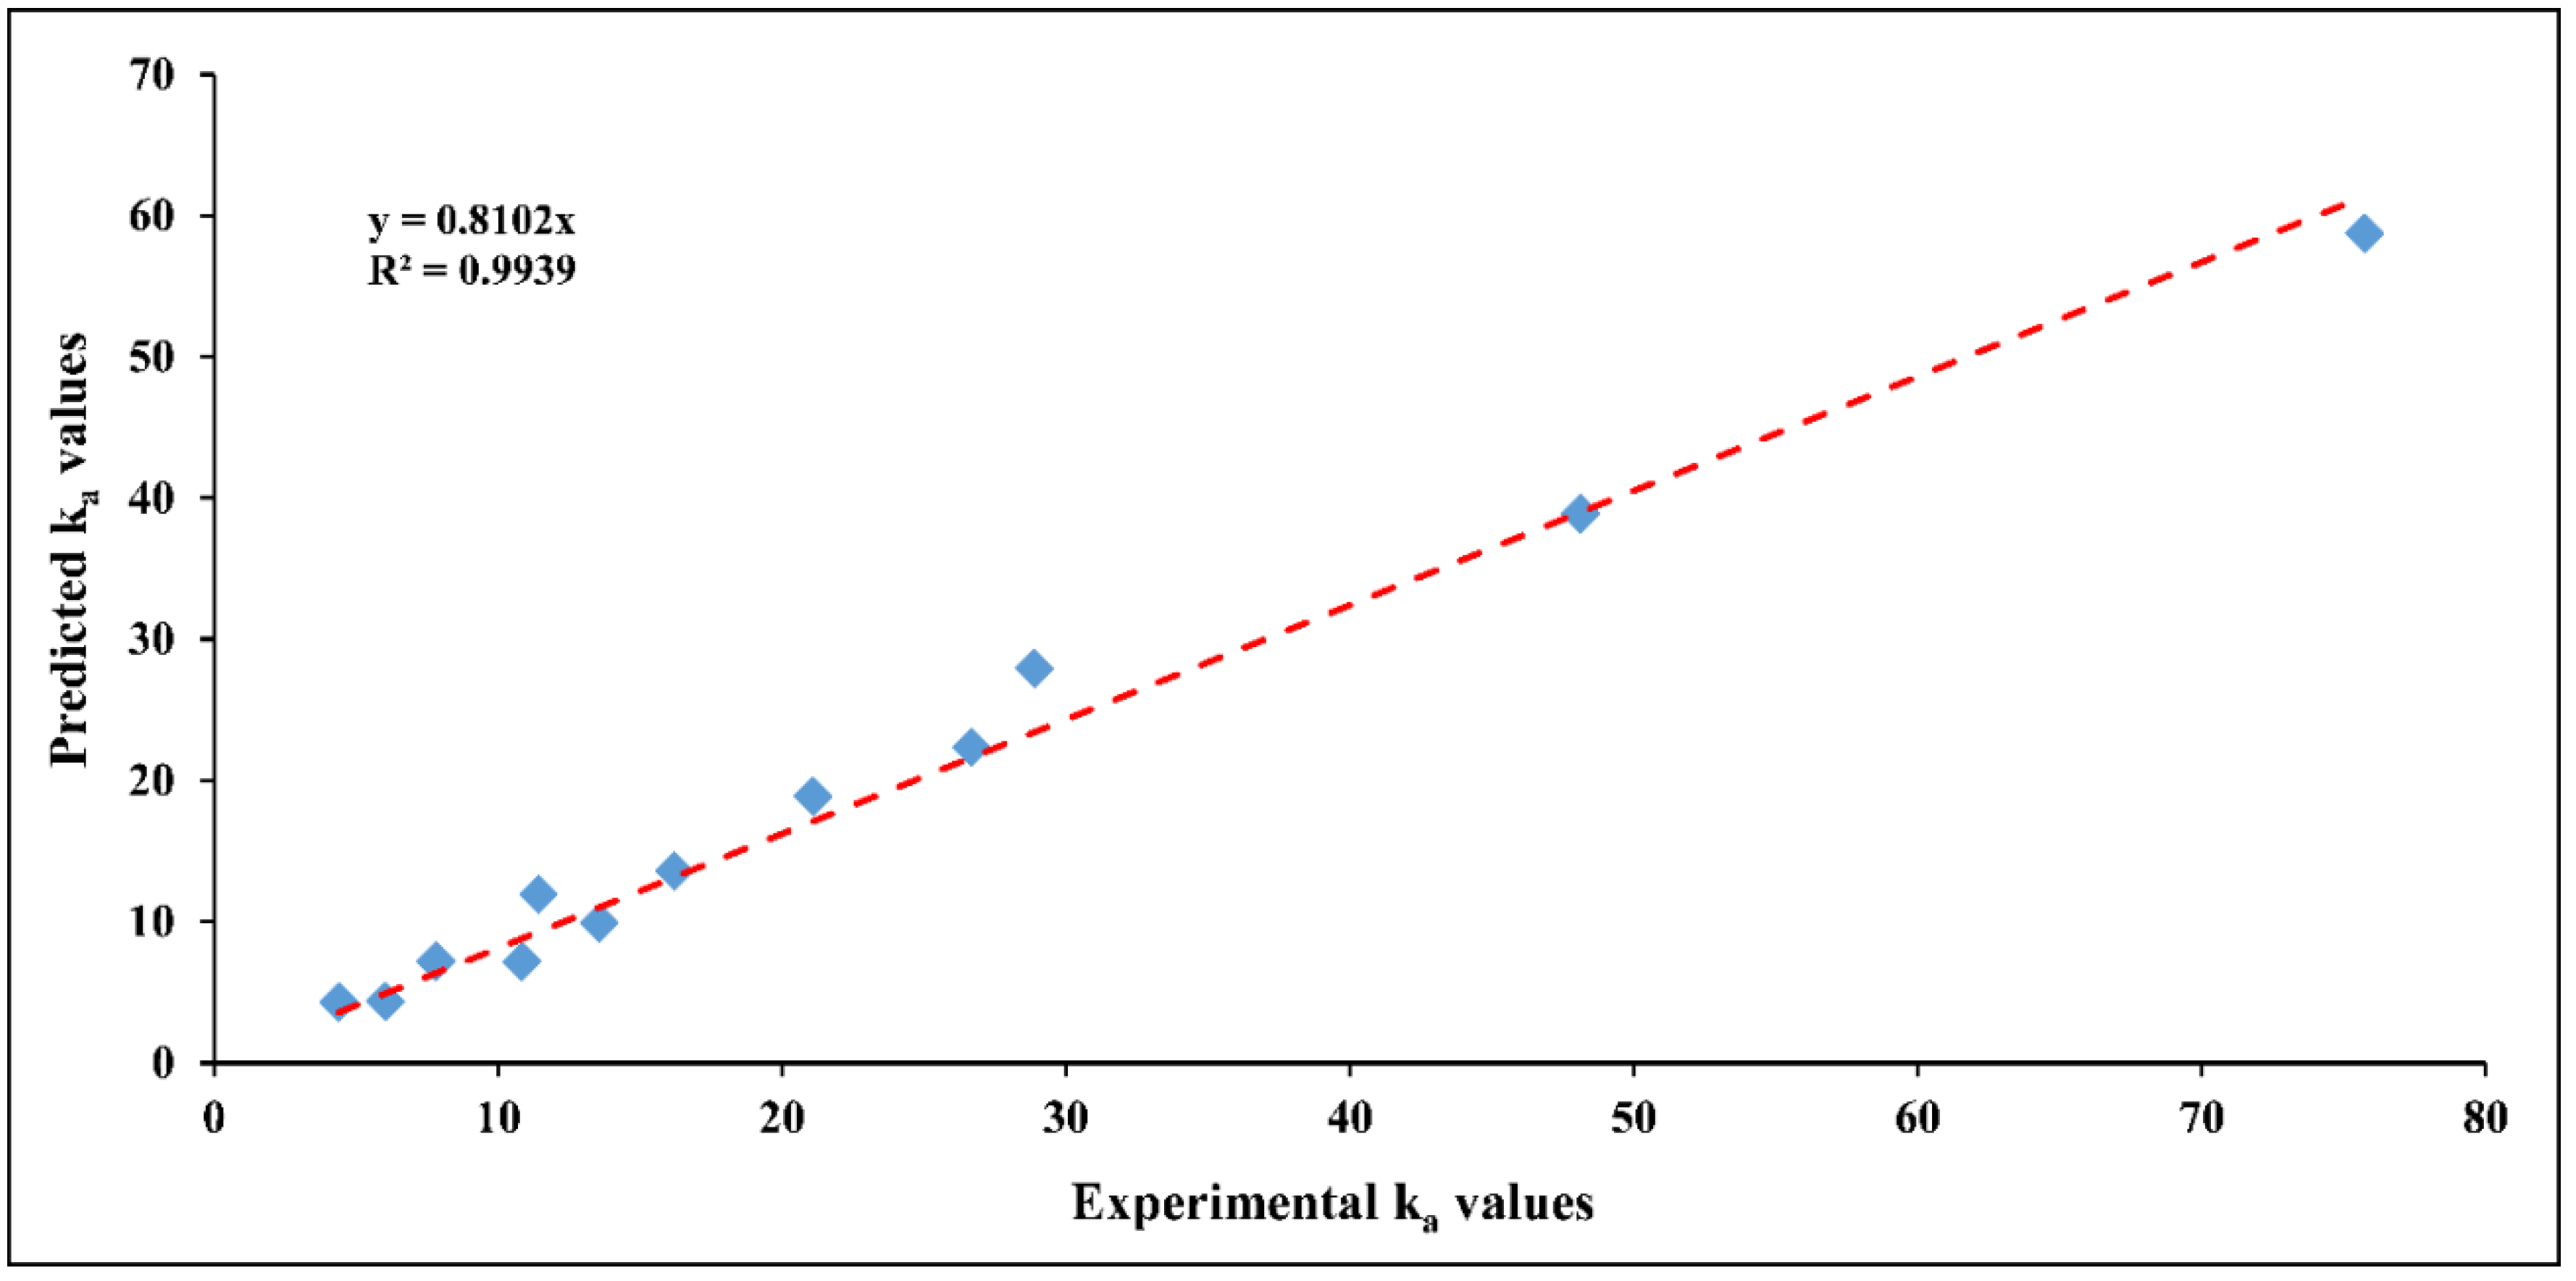
3.2.4. Empirical Model
Power-Law Kinetic Model
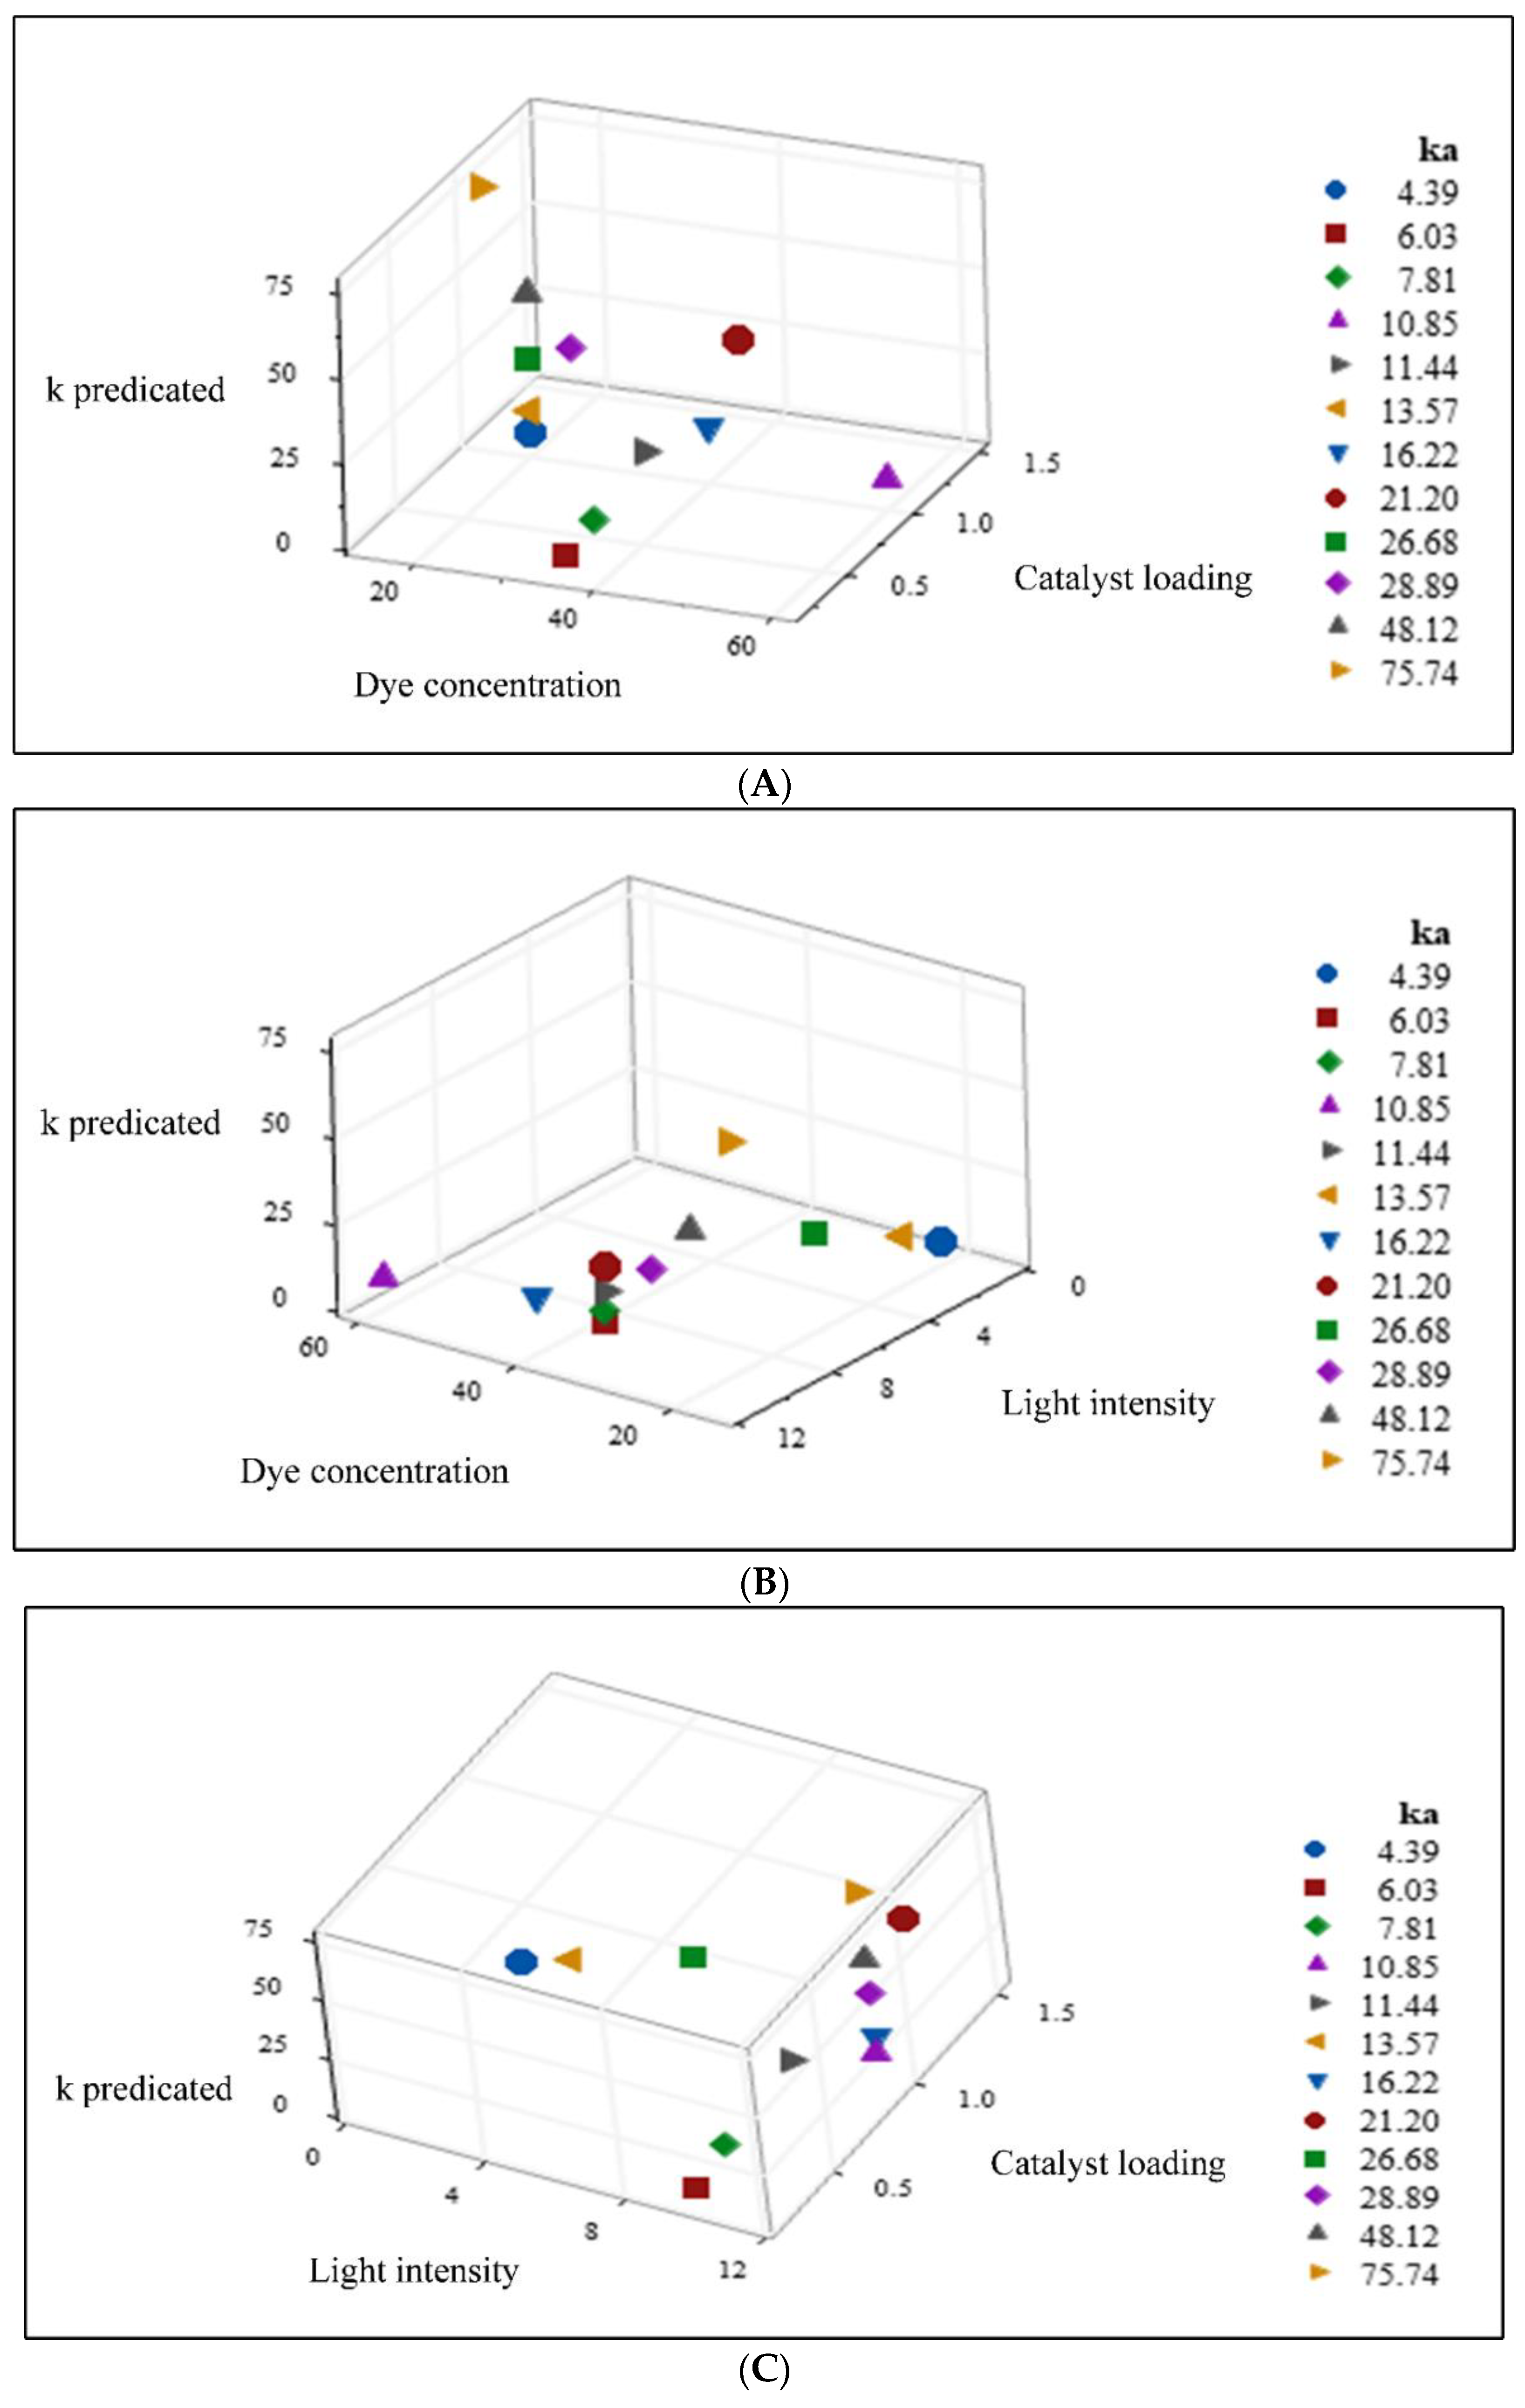
3D Scatterplots
3.3. Comparison of Kinetic Models
3.4. Immobilized Catalyst
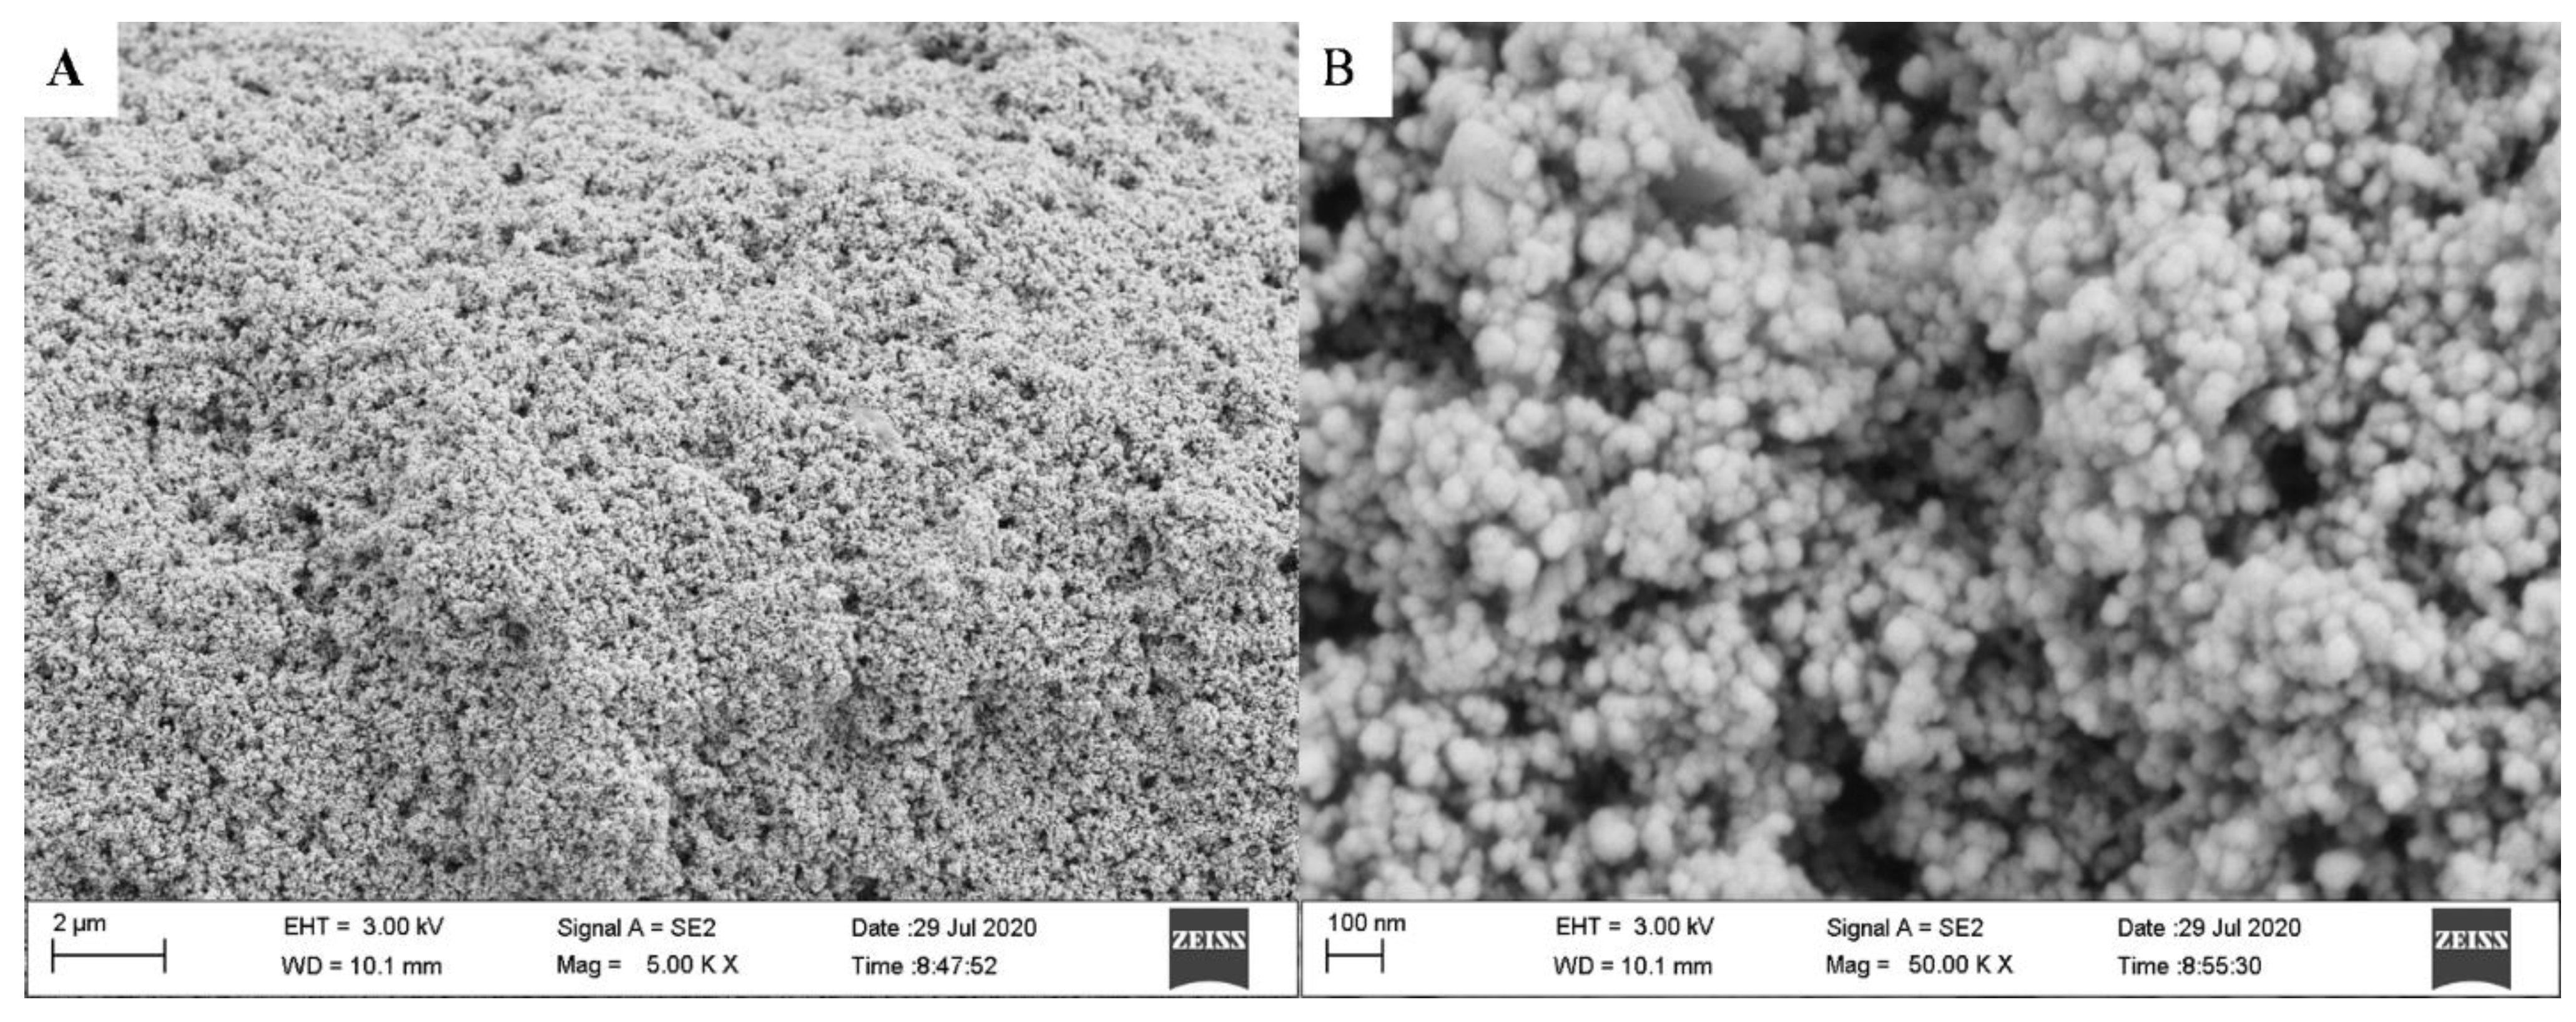
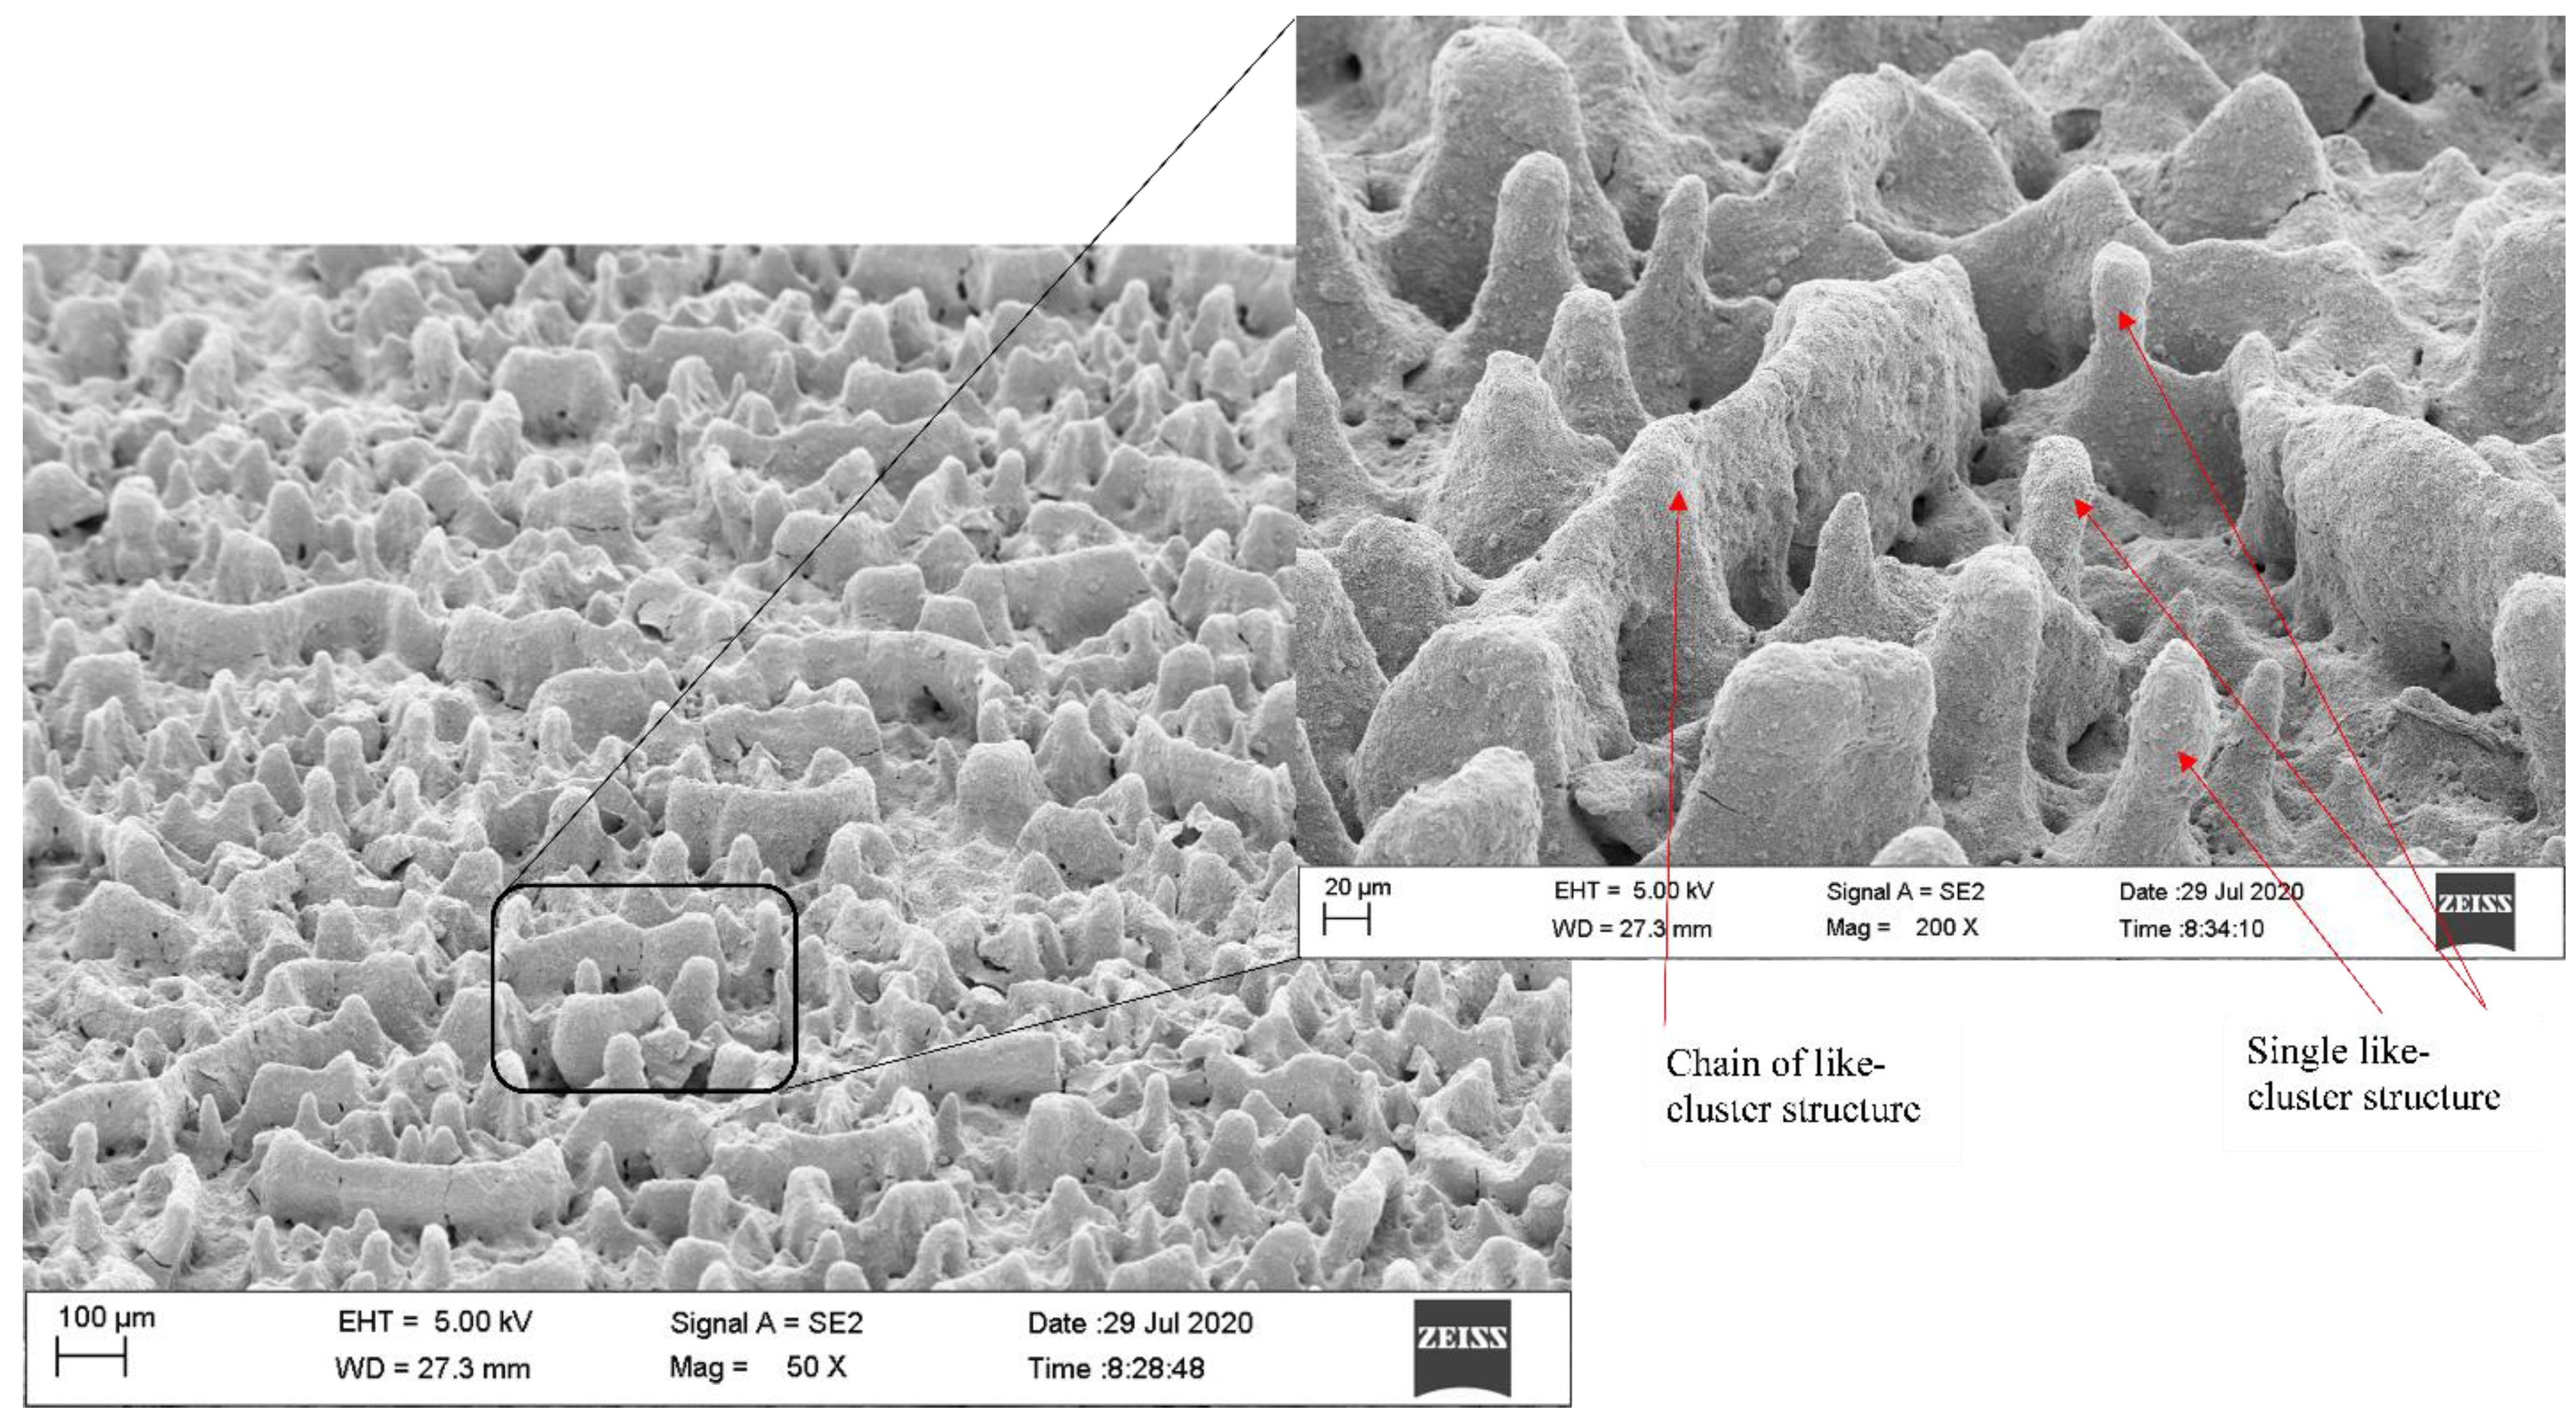
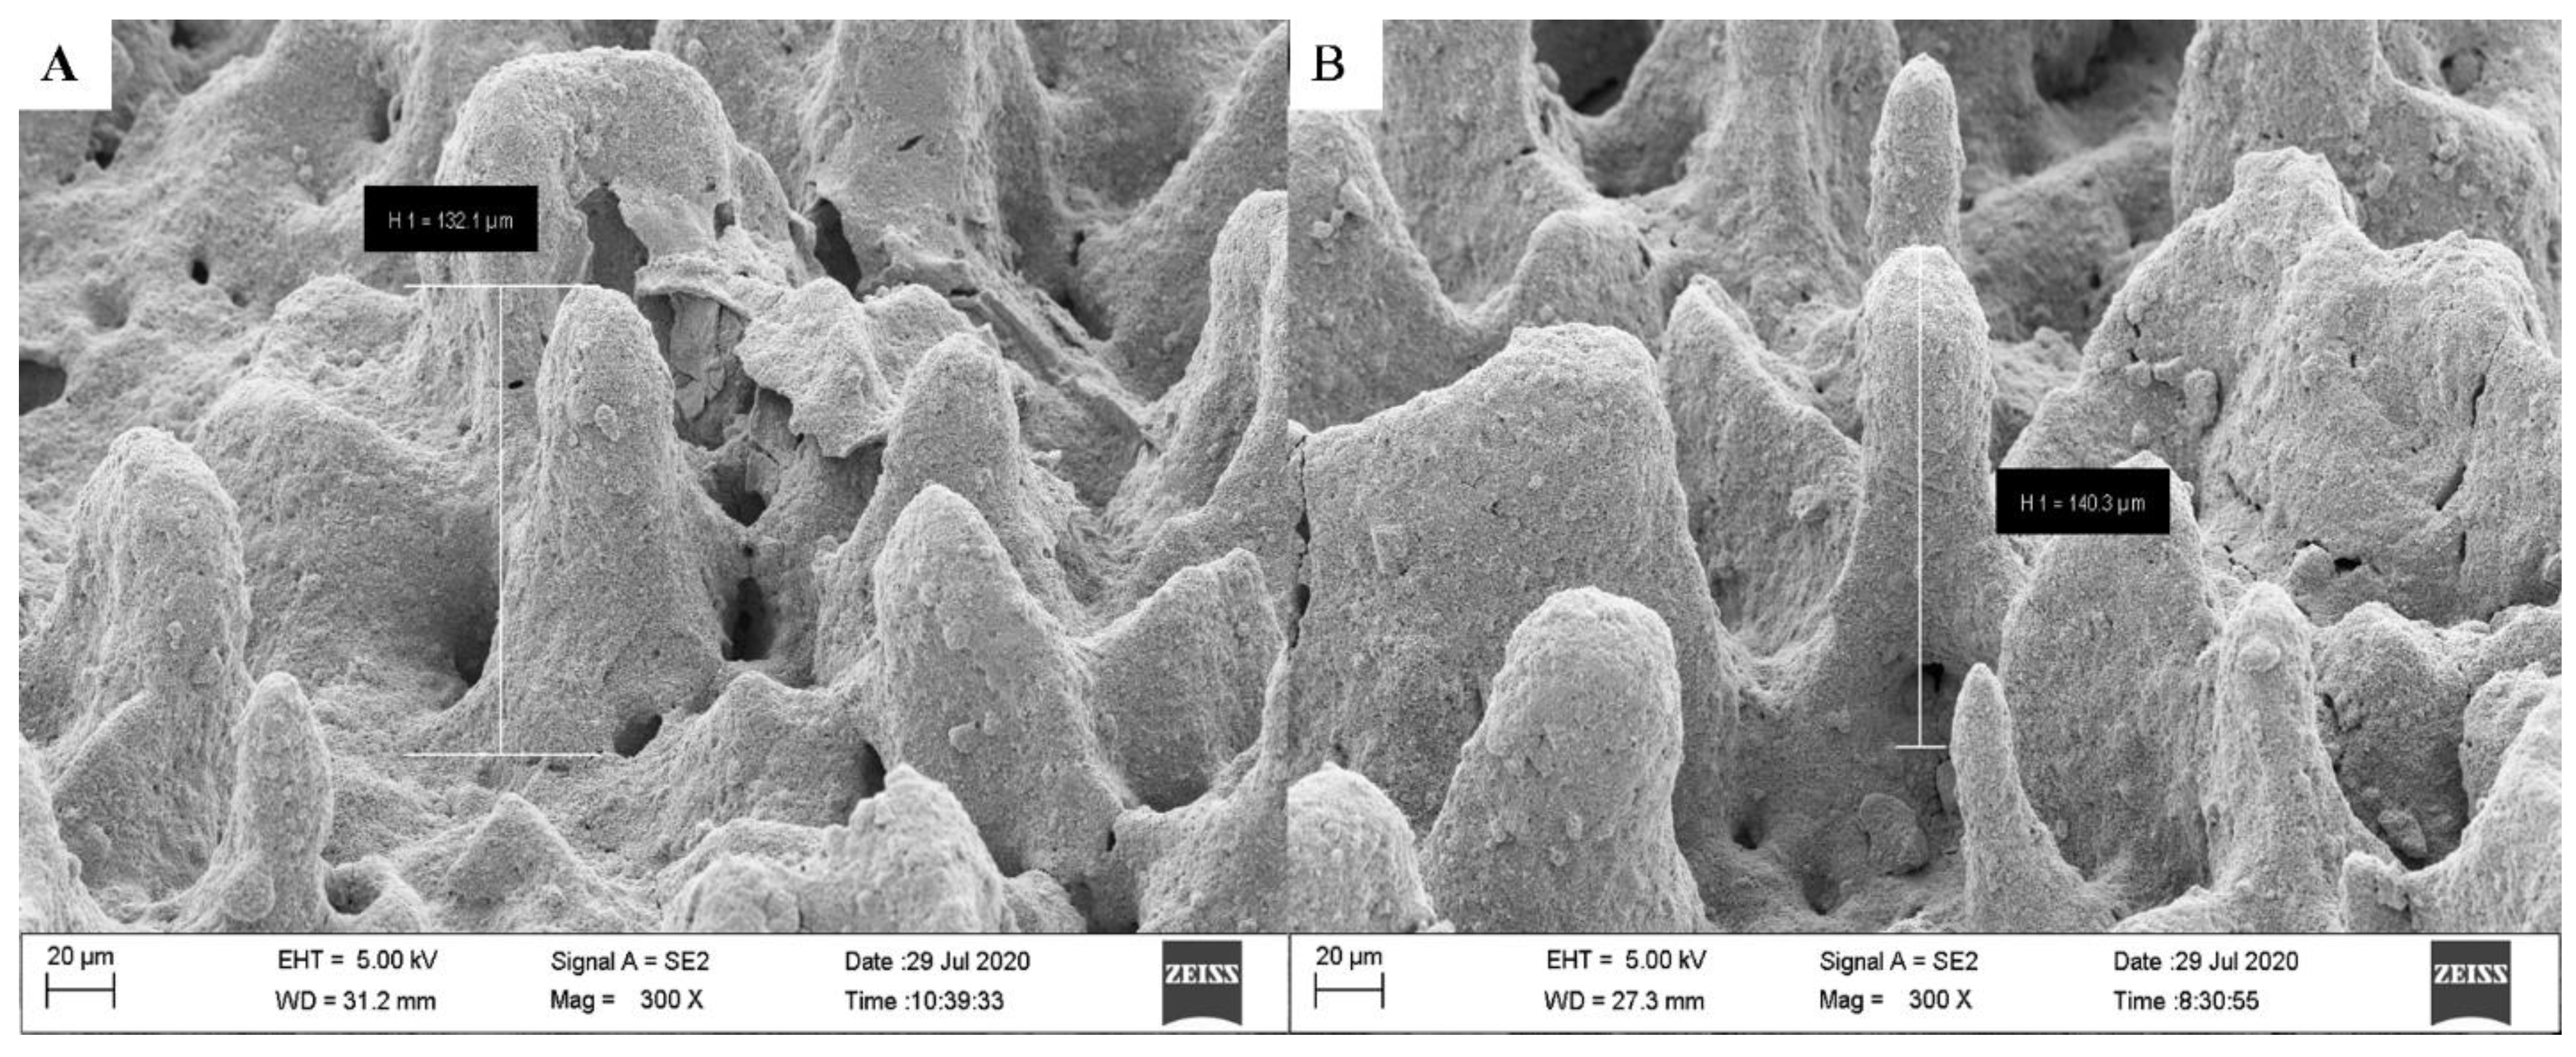
3.4.1. Surface Characterization
3.4.2. Kinetics Using a Fixed Catalyst
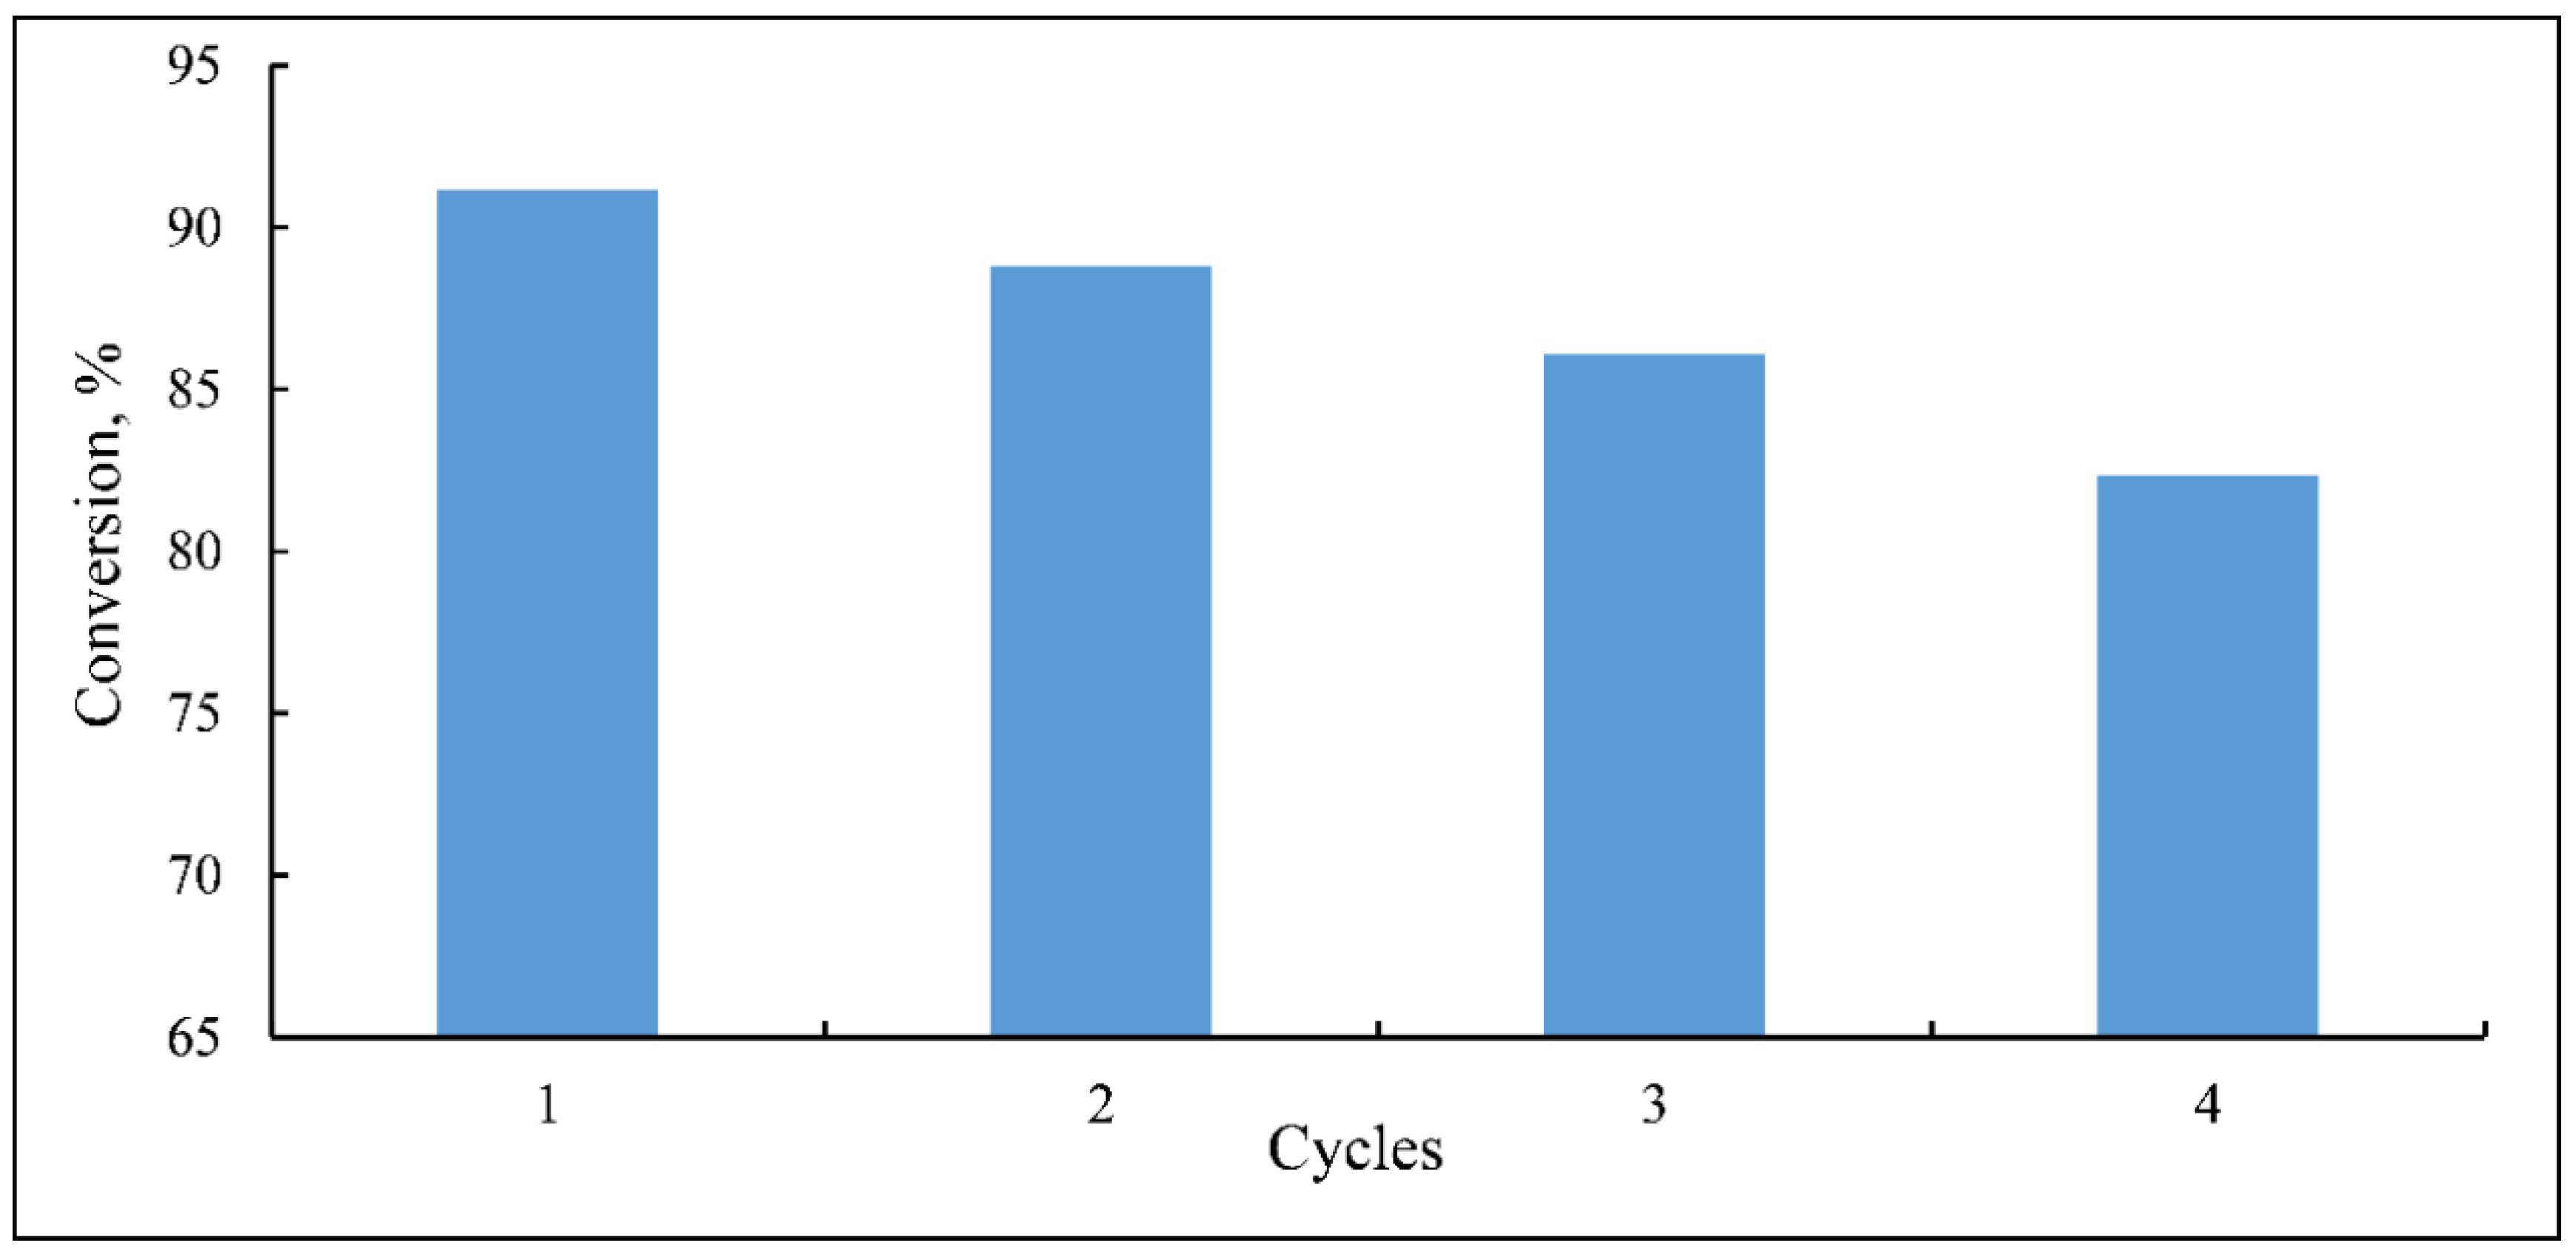
3.4.3. Catalyst Recyclability
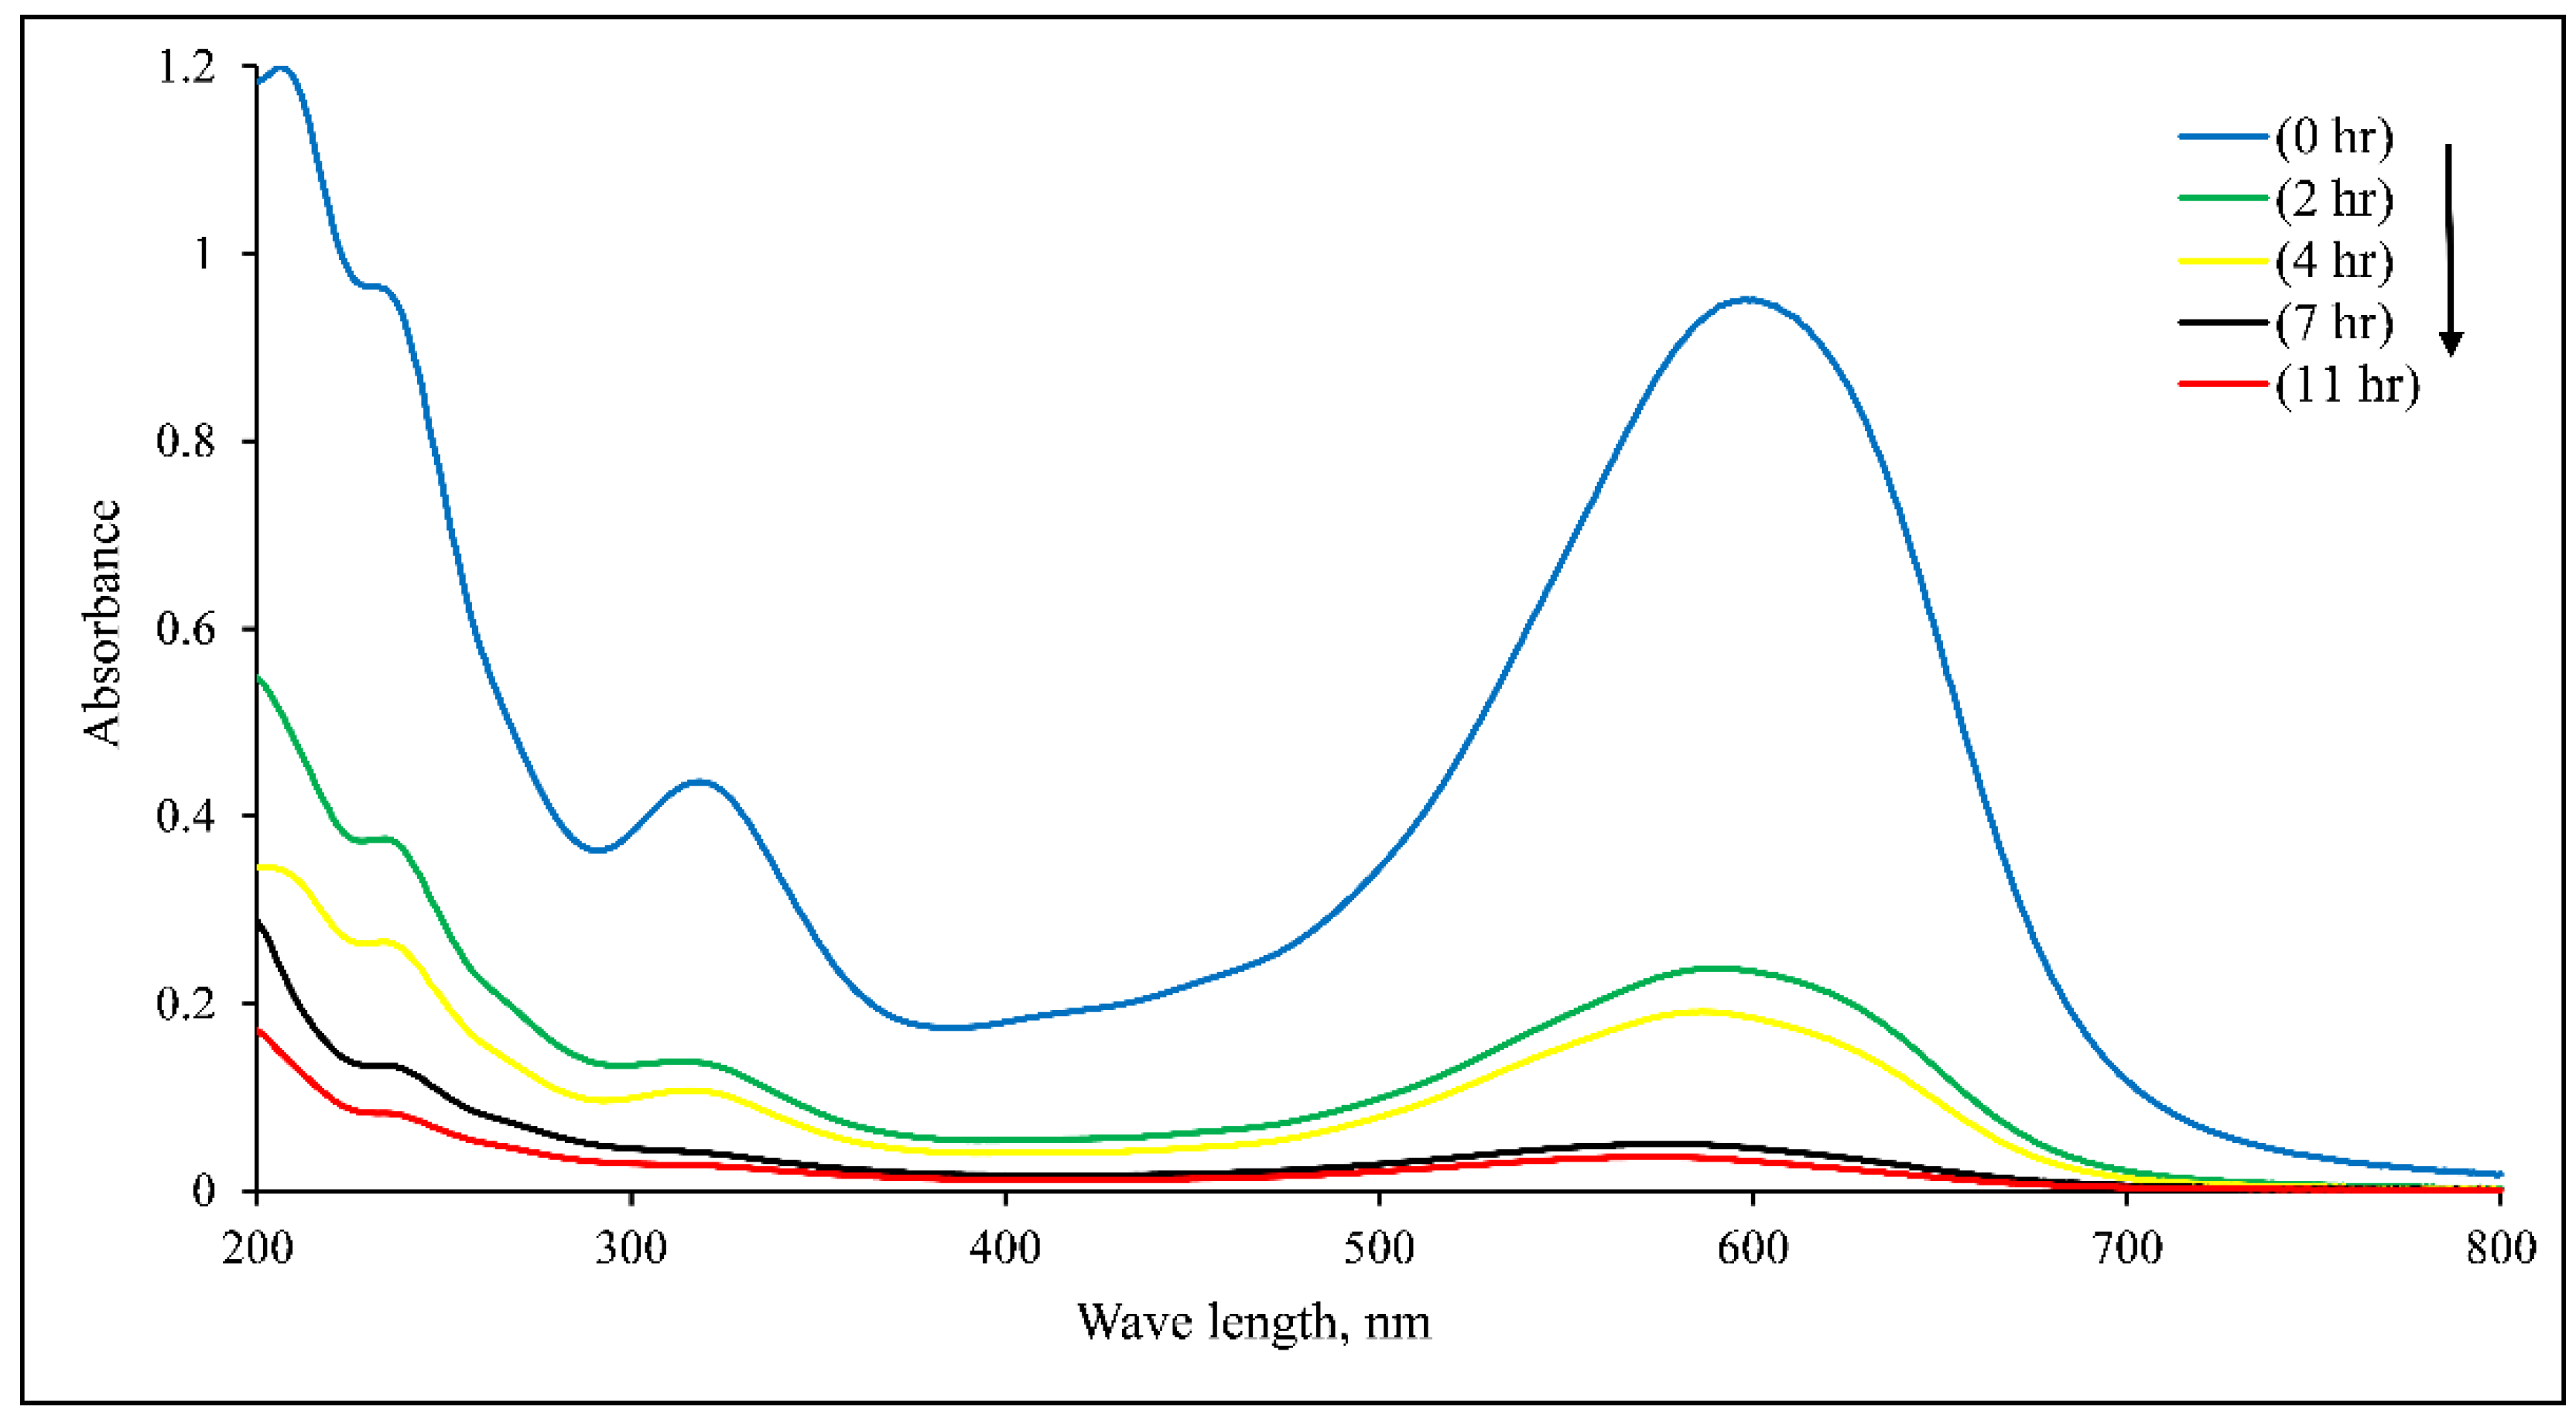
3.5. DB15 Mineralization
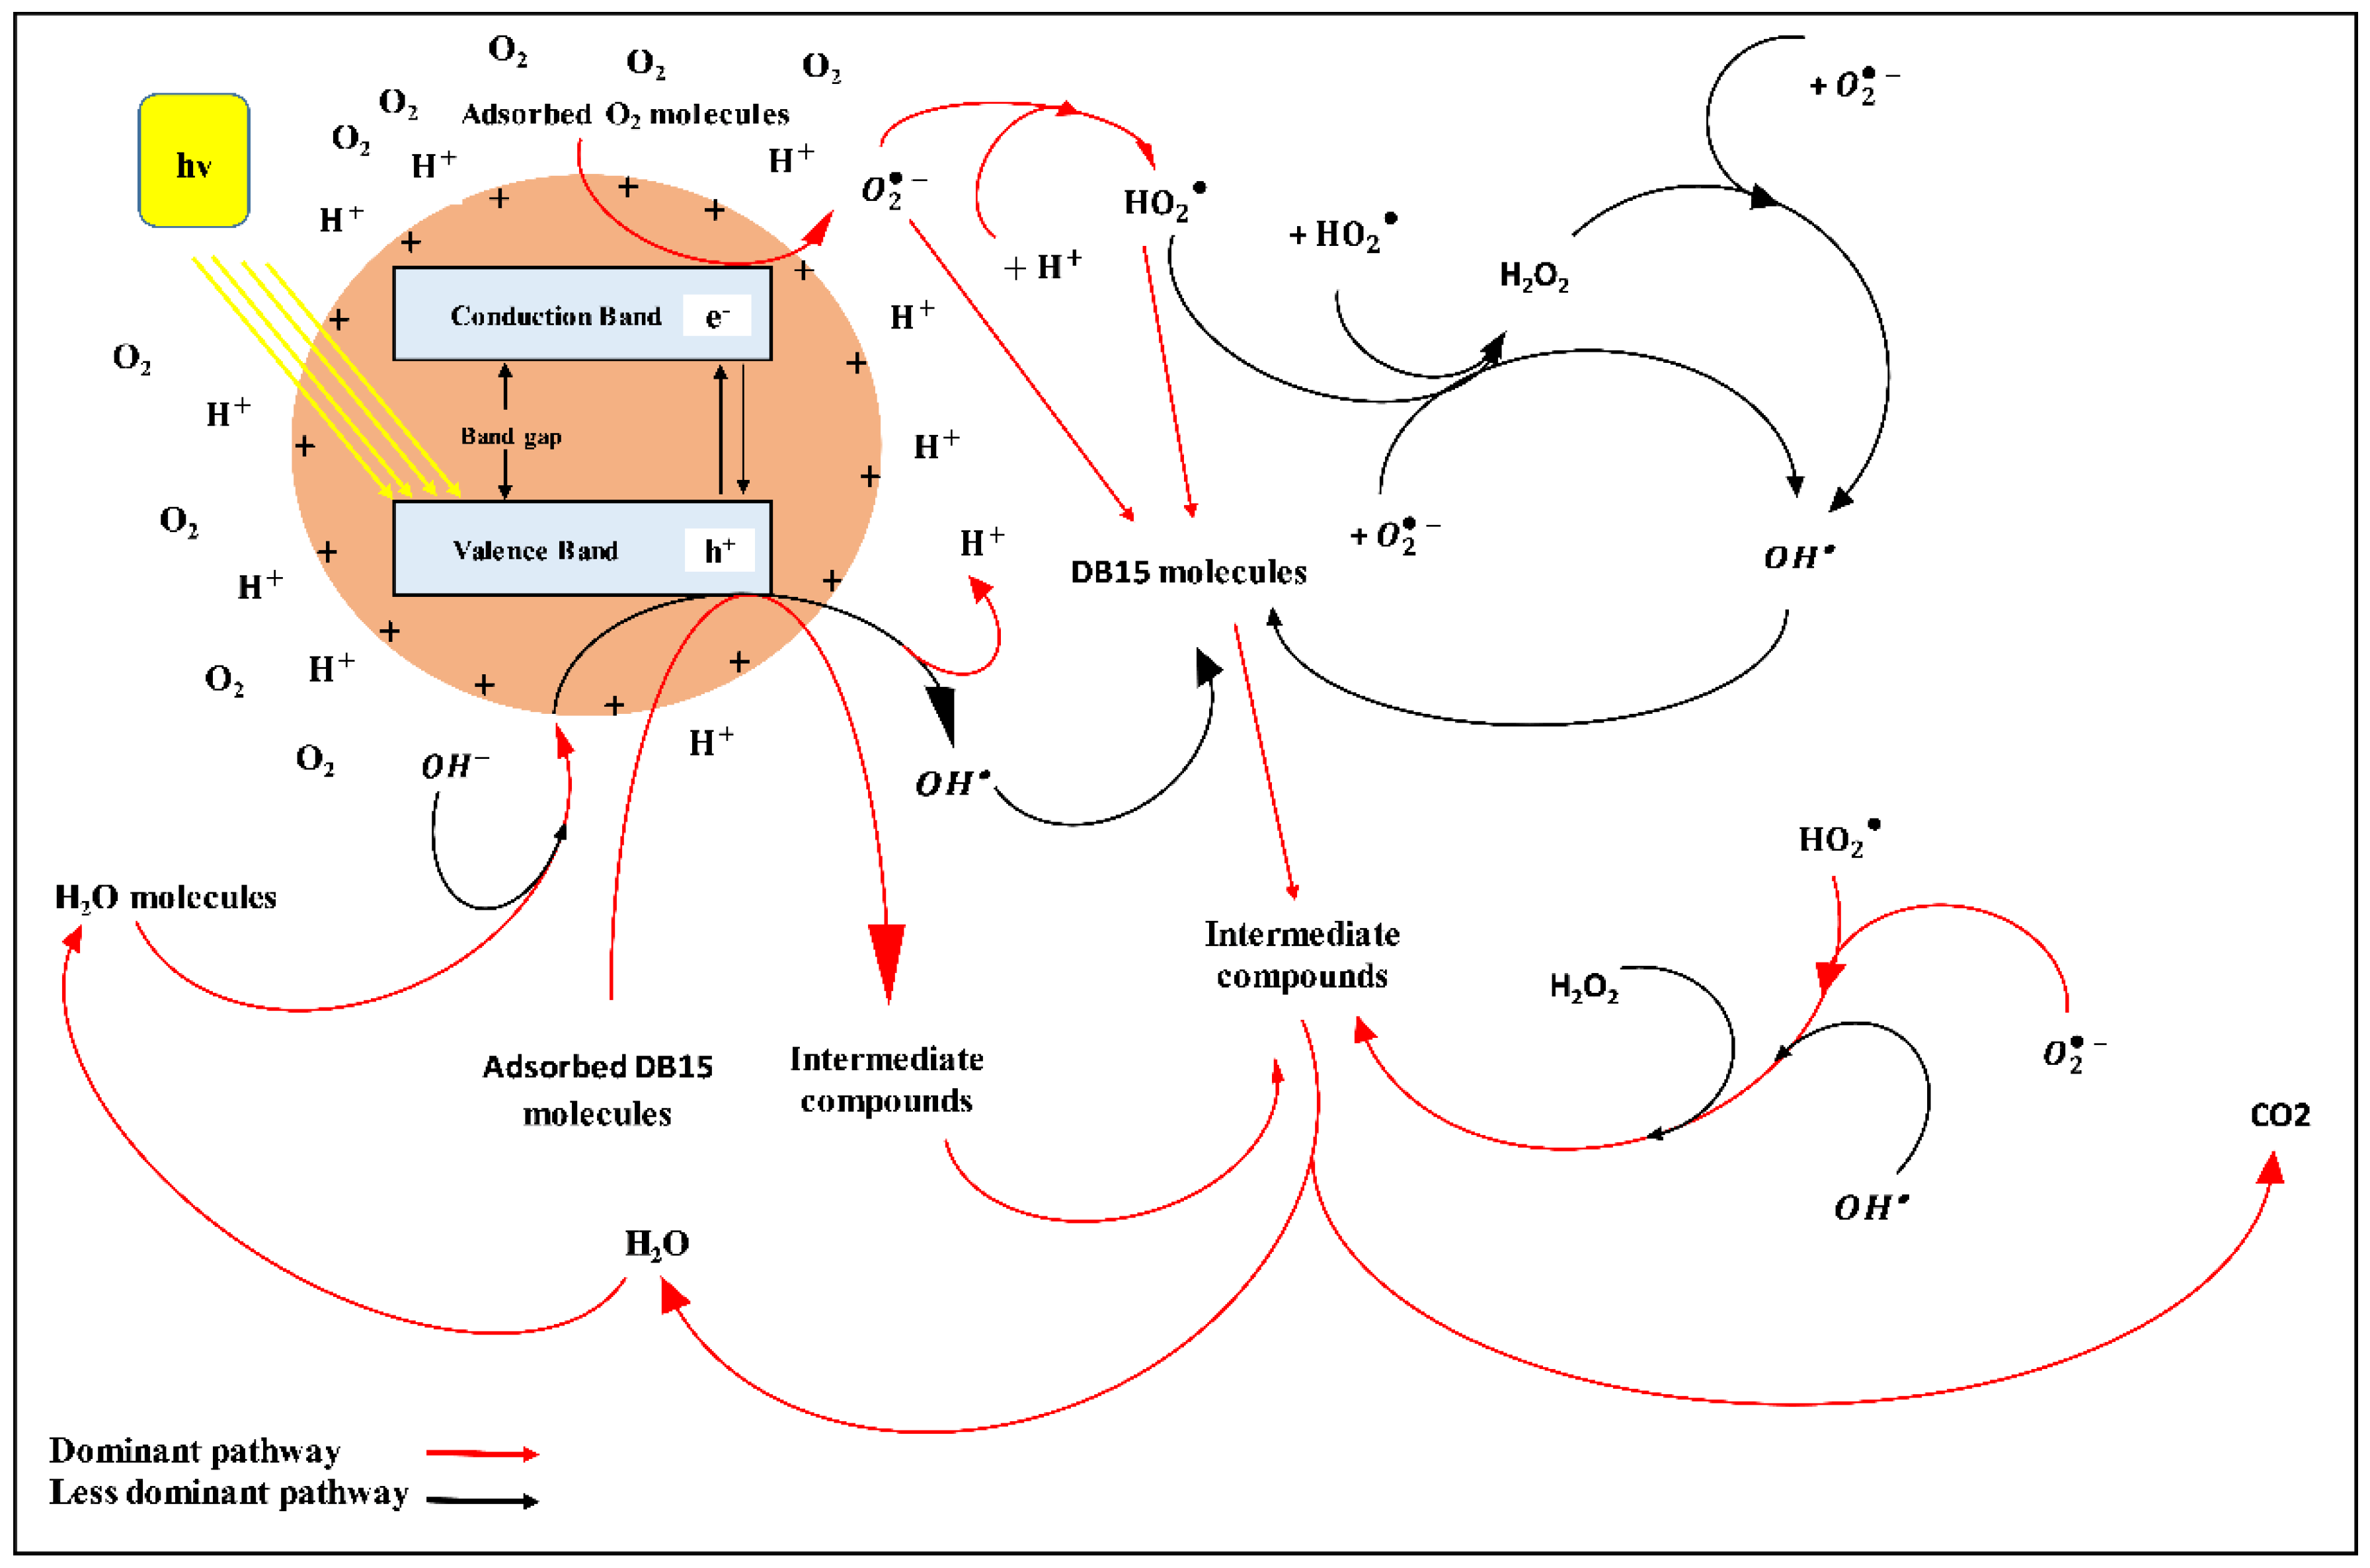
3.6. Mechanism of DB15 Degradation at Low pH
3.7. Adsorption Behaviour of DB15
4. Conclusions
Author Contributions
Funding
Institutional Review Board Statement
Informed Consent Statement
Acknowledgments
Conflicts of Interest
References
- Cardoso, J.C.; Bessegato, G.G.; Zanoni, M.V.B. Efficiency comparison of ozonation, photolysis, photocatalysis and photoelectrocatalysis methods in real textile wastewater decolorization. Water Res. 2016, 98, 39–46. [Google Scholar] [CrossRef] [PubMed] [Green Version]
- Karamat, N.; Ehsan, M.F.; Ashiq, M.N.; Ijaz, S.; Najam-ul-Haq, M.; Hamid, S.; Bahnemann, D.W. Synthesis, characterization and photocatalytic activity of LaNdZr2O7 supported SnSe nanocomposites for the degradation of Foron blue dye. Appl. Surf. Sci. 2019, 463, 1019–1027. [Google Scholar] [CrossRef]
- Gong, R.; Ding, Y.; Li, M.; Yang, C.; Liu, H.; Sun, Y. Utilization of powdered peanut hull as biosorbent for removal of anionic dyes from aqueous solution. Dye. Pigment. 2005, 64, 187–192. [Google Scholar] [CrossRef]
- Sleiman, M.; Vildozo, D.; Ferronato, C.; Chovelon, J.M. Photocatalytic degradation of azo dye Metanil Yellow: Optimization and kinetic modeling using a chemometric approach. Appl. Catal. B Environ. 2007, 77, 1–11. [Google Scholar] [CrossRef]
- Nguyen, C.H.; Fu, C.C.; Juang, R.S. Degradation of methylene blue and methyl orange by palladium-doped TiO2 photocatalysis for water reuse: Efficiency and degradation pathways. J. Clean. Prod. 2018, 202, 413–427. [Google Scholar] [CrossRef]
- Hsiao, Y.C.; Wu, T.F.; Wang, Y.S.; Hu, C.C.; Huang, C. Evaluating the sensitizing effect on the photocatalytic decoloration of dyes using anatase-TiO2. Appl. Catal. B Environ. 2014, 148, 250–257. [Google Scholar] [CrossRef]
- Bouberka, Z.; Benabbou, K.A.; Khenifi, A.; Maschke, U. Degradation by irradiation of an Acid Orange 7 on colloidal TiO2/(LDHs). J. Photochem. Photobiol. A Chem. 2014, 275, 21–29. [Google Scholar] [CrossRef]
- Rosa, J.M.; Garcia, V.S.; Boiani, N.F.; Melo, C.G.; Pereira, M.C.; Borrely, S.I. Toxicity and environmental impacts approached in the dyeing of polyamide, polyester and cotton knits. J. Environ. Chem. Eng. 2019, 7, 102973. [Google Scholar] [CrossRef]
- Ajmal, A.; Majeed, I.; Malik, R.N.; Idriss, H.; Nadeem, M.A. Principles and mechanisms of photocatalytic dye degradation on TiO2 based photocatalysts: A comparative overview. RSC Adv. 2014, 4, 37003–37026. [Google Scholar] [CrossRef]
- Wang, C.C.; Li, J.R.; Lv, X.L.; Zhang, Y.Q.; Guo, G. Photocatalytic organic pollutants degradation in metal–organic frameworks. Energy Environ. Sci. 2014, 7, 2831–2867. [Google Scholar] [CrossRef]
- Reutergådh, L.B.; Iangphasuk, M. Photocatalytic decolourization of reactive azo dye: A comparison between TiO2 and us photocatalysis. Chemosphere 1997, 35, 585–596. [Google Scholar] [CrossRef]
- Galindo, C.; Jacques, P.; Kalt, A. Photodegradation of the aminoazobenzene acid orange 52 by three advanced oxidation processes: UV/H2O2, UV/TiO2 and VIS/TiO2: Comparative mechanistic and kinetic investigations. J. Photochem. Photobiol. A Chem. 2000, 130, 35–47. [Google Scholar] [CrossRef]
- Houas, A.; Lachheb, H.; Ksibi, M.; Elaloui, E.; Guillard, C.; Herrmann, J.M. Photocatalytic degradation pathway of methylene blue in water. Appl. Catal. B Environ. 2001, 31, 145–157. [Google Scholar] [CrossRef]
- Xu, Y.; Langford, C.H. UV-or visible-light-induced degradation of X3B on TiO2 nanoparticles: The influence of adsorption. Langmuir 2001, 17, 897–902. [Google Scholar] [CrossRef]
- Konstantinou, I.K.; Albanis, T.A. TiO2-assisted photocatalytic degradation of azo dyes in aqueous solution: Kinetic and mechanistic investigations: A review. Appl. Catal. B Environ. 2004, 49, 1–14. [Google Scholar] [CrossRef]
- Sauer, T.; Neto, G.C.; Jose, H.J.; Moreira, R.F.P.M. Kinetics of photocatalytic degradation of reactive dyes in a TiO2 slurry reactor. J. Photochem. Photobiol. A Chem. 2002, 149, 147–154. [Google Scholar] [CrossRef]
- Baran, W.; Adamek, E.; Makowski, A. The influence of selected parameters on the photocatalytic degradation of azo-dyes in the presence of TiO2 aqueous suspension. Chem. Eng. J. 2008, 145, 242–248. [Google Scholar] [CrossRef]
- Meng, Y.; Huang, X.; Wu, Y.; Wang, X.; Qian, Y. Kinetic study and modeling on photocatalytic degradation of para-chlorobenzoate at different light intensities. Environ. Pollut. 2002, 117, 307–313. [Google Scholar] [CrossRef]
- Xu, Y.; Langford, C.H. Variation of Langmuir adsorption constant determined for TiO2-photocatalyzed degradation of acetophenone under different light intensity. J. Photochem. Photobiol. A Chem. 2000, 133, 67–71. [Google Scholar] [CrossRef]
- Konstantinou, I.K.; Albanis, T.A. Photocatalytic transformation of pesticides in aqueous titanium dioxide suspensions using artificial and solar light: Intermediates and degradation pathways. Appl. Catal. B Environ. 2003, 42, 319–335. [Google Scholar] [CrossRef]
- Herrmann, J.M. Heterogeneous photocatalysis: Fundamentals and applications to the removal of various types of aqueous pollutants. Catal. Today 1999, 53, 115–129. [Google Scholar] [CrossRef]
- Son, H.S.; Lee, S.J.; Cho, I.H.; Zoh, K.D. Kinetics and mechanism of TNT degradation in TiO2 photocatalysis. Chemosphere 2004, 57, 309–317. [Google Scholar] [CrossRef] [PubMed]
- Al-Ekabi, H.; Serpone, N. Photocatalytic degradation of chlorinated phenols in aerated aqueous solutions over TiO2 supported on a glass matrix. J. Phys. Chem. 1988, 92, 5726–5731. [Google Scholar] [CrossRef]
- Habibi, M.H.; Hassanzadeh, A.; Mahdavi, S. The effect of operational parameters on the photocatalytic degradation of three textile azo dyes in aqueous TiO2 suspensions. J. Photochem. Photobiol. A Chem. 2005, 172, 89–96. [Google Scholar] [CrossRef]
- Turchi, C.S.; Ollis, D.F. Photocatalytic degradation of organic water contaminants: Mechanisms involving hydroxyl radical attack. J. Catal. 1990, 122, 178–192. [Google Scholar] [CrossRef]
- Zhou, S.; Ray, A.K. Kinetic studies for photocatalytic degradation of Eosin B on a thin film of titanium dioxide. Ind. Eng. Chem. Res. 2003, 42, 6020–6033. [Google Scholar] [CrossRef]
- Behnajady, M.A.; Modirshahla, N.; Hamzavi, R. Kinetic study on photocatalytic degradation of CI Acid Yellow 23 by ZnO photocatalyst. J. Hazard. Mater. 2006, 133, 226–232. [Google Scholar] [CrossRef]
- Hashim, N.; Natarajan, P.; Ray, A.K. Intrinsic kinetic study for photocatalytic degradation of diclofenac under UV and visible light. Ind. Eng. Chem. Res. 2014, 53, 18637–18646. [Google Scholar] [CrossRef]
- Yatmaz, H.C.; Akyol, A.; Bayramoglu, M. Kinetics of the photocatalytic decolorization of an azo reactive dye in aqueous ZnO suspensions. Ind. Eng. Chem. Res. 2004, 43, 6035–6039. [Google Scholar] [CrossRef]
- Behnajady, M.A.; Modirshahla, N. Nonlinear regression analysis of kinetics of the photocatalytic decolorization of an azo dye in aqueous TiO2 slurry. Photochem. Photobiol. Sci. 2006, 5, 1078–1081. [Google Scholar] [CrossRef]
- Ray, A.K.; Beenackers, A.A. Novel swirl-flow reactor for kinetic studies of semiconductor photocatalysis. AIChE J. 1997, 43, 2571–2578. [Google Scholar] [CrossRef]
- Chen, D.; Li, F.; Ray, A.K. External and internal mass transfer effect on photocatalytic degradation. Catal. Today 2001, 66, 475–485. [Google Scholar] [CrossRef]
- Zangeneh, H.; Zinatizadeh, A.A.L.; Feyzi, M. Degradation of linear alkyl benzene using an immobilized nano TiO2 photocatalytic reactor: Process analysis and modeling. CLEAN–Soil Air Water 2016, 44, 78–88. [Google Scholar] [CrossRef]
- Arabatzis, I.M.; Antonaraki, S.; Stergiopoulos, T.; Hiskia, A.; Papaconstantinou, E.; Bernard, M.C.; Falaras, P. Preparation, characterization and photocatalytic activity of nanocrystalline thin film TiO2 catalysts towards 3, 5-dichlorophenol degradation. J. Photochem. Photobiol. A Chem. 2002, 149, 237–245. [Google Scholar] [CrossRef]
- Javidi Soufiani, M. Investigation and Modeling of Dip-Coating Process for Dispersions. Ph.D. Thesis, The University of Western Ontario, London, ON, Canada, 2016; p. 75. Available online: https://ir.lib.uwo.ca/etd/3641 (accessed on 13 September 2021).
- Deng, Z.; Zhang, X.H.; Chan, K.C.; Liu, L.; Li, T. Fe-based metallic glass catalyst with nanoporous surface for azo dye degradation. Chemosphere 2017, 174, 76–81. [Google Scholar] [CrossRef]
- Jadaa, W.; Prakash, A.; Ray, A.K. Modeling of degradation of Diazo dye in swirl-flow photocatalytic reactor: Response surface approach. Catalysts 2020, 10, 1418. [Google Scholar] [CrossRef]
- Matthews, R.W. Kinetics of photocatalytic oxidation of organic solutes over titanium dioxide. J. Catal. 1988, 111, 264–272. [Google Scholar] [CrossRef]
- Mills, A.; Morris, S. Photomineralization of 4-chlorophenol sensitized by titanium dioxide: A study of the initial kinetics of carbon dioxide photogeneration. J. Photochem. Photobiol. A Chem. 1993, 71, 75–83. [Google Scholar] [CrossRef]
- Hamad, H.A.; Sadik, W.A.; El-Latif, M.A.; Kashyout, A.B.; Feteha, M.Y. Photocatalytic parameters and kinetic study for degradation of dichlorophenol-indophenol (DCPIP) dye using highly active mesoporous TiO2 nanoparticles. J. Environ. Sci. 2016, 43, 26–39. [Google Scholar] [CrossRef]
- Boumaza, S.; Kaouah, F.; Hamane, D.; Trari, M.; Omeiri, S.; Bendjama, Z. Visible light assisted decolorization of azo dyes: Direct Red 16 and Direct Blue 71 in aqueous solution on the p-CuFeO2/n-ZnO system. J. Mol. Catal. A Chem. 2014, 393, 156–165. [Google Scholar] [CrossRef]
- Chan, Y.C.; Chen, J.N.; Lu, M.C. Intermediate inhibition in the heterogeneous UV-catalysis using a TiO2 suspension system. Chemosphere 2001, 45, 29–35. [Google Scholar] [CrossRef]
- Sadik, W.A. Decolourization of an azo dye by heterogeneous photocatalysis. Process Saf. Environ. Prot. 2007, 85, 515–520. [Google Scholar] [CrossRef]
- Augugliaro, V.; Palmisano, L.; Schiavello, M.; Sclafani, A.; Marchese, L.; Martra, G.; Miano, F. Photocatalytic degradation of nitrophenols in aqueous titanium dioxide dispersion. Appl. Catal. 1991, 69, 323–340. [Google Scholar] [CrossRef]
- Chen, D.; Ray, A.K. Photodegradation kinetics of 4-nitrophenol in TiO2 suspension. Water Res. 1998, 32, 3223–3234. [Google Scholar] [CrossRef]
- Sheidaei, B.; Behnajady, M.A. Mathematical kinetic modelling and representing design equation for a packed photoreactor with immobilised TiO2-P25 nanoparticles on glass beads in the removal of CI Acid Orange 7. Chem. Process Eng. 2015, 36, 125–133. [Google Scholar] [CrossRef] [Green Version]
- Teixeira, S.; Martins, P.M.; Lanceros-Méndez, S.; Kühn, K.; Cuniberti, G. Reusability of photocatalytic TiO2 and ZnO nanoparticles immobilized in poly (vinylidene difluoride)-co-trifluoroethylene. Appl. Surf. Sci. 2016, 384, 497–504. [Google Scholar] [CrossRef]
- Daneshvar, N.; Salari, D.; Khataee, A.R. Photocatalytic degradation of azo dye acid red 14 in water: Investigation of the effect of operational parameters. J. Photochem. Photobiol. A Chem. 2003, 157, 111–116. [Google Scholar] [CrossRef]
- Ahmed, S.; Rasul, M.G.; Brown, R.; Hashib, M.A. Influence of parameters on the heterogeneous photocatalytic degradation of pesticides and phenolic contaminants in wastewater: A short review. J. Environ. Manag. 2011, 92, 311–330. [Google Scholar] [CrossRef] [PubMed] [Green Version]
- Teh, C.M.; Mohamed, A.R. Roles of titanium dioxide and ion-doped titanium dioxide on photocatalytic degradation of organic pollutants (phenolic compounds and dyes) in aqueous solutions: A review. J. Alloys Compd. 2011, 509, 1648–1660. [Google Scholar] [CrossRef]
- Daneshvar, N.; Salari, D.; Niaei, A.; Rasoulifard, M.H.; Khataee, A.R. Immobilization of TiO2 nanopowder on glass beads for the photocatalytic decolorization of an azo dye CI Direct Red 23. J. Environ. Sci. Health Part A 2005, 40, 1605–1617. [Google Scholar] [CrossRef]
- Carp, O.; Huisman, C.L.; Reller, A. Photoinduced reactivity of titanium dioxide. Prog. Solid State Chem. 2004, 32, 33–177. [Google Scholar] [CrossRef]
- Akpan, U.G.; Hameed, B.H. Parameters affecting the photocatalytic degradation of dyes using TiO2-based photocatalysts: A review. J. Hazard. Mater. 2009, 170, 520–529. [Google Scholar] [CrossRef]
- Khataee, A.R.; Kasiri, M.B. Photocatalytic degradation of organic dyes in the presence of nanostructured titanium dioxide: Influence of the chemical structure of dyes. J. Mol. Catal. A Chem. 2010, 328, 8–26. [Google Scholar] [CrossRef]
- Umar, M.; Aziz, H.A. Photocatalytic degradation of organic pollutants in water. In Organic Pollutants-Monitoring, Risk and Treatment; InTech: Rijeka, Croatia, 2013. [Google Scholar]
- Zhang, T.; Wang, X.; Zhang, X. Recent progress in TiO2-mediated solar photocatalysis for industrial wastewater treatment. Int. J. Photoenergy 2014, 2014, 607954. [Google Scholar] [CrossRef] [Green Version]
- Zangeneh, H.; Zinatizadeh, A.A.L.; Habibi, M.; Akia, M.; Isa, M.H. Photocatalytic oxidation of organic dyes and pollutants in wastewater using different modified titanium dioxides: A comparative review. J. Ind. Eng. Chem. 2015, 26, 1–36. [Google Scholar] [CrossRef]
- Khaki, M.R.D.; Shafeeyan, M.S.; Raman, A.A.A.; Daud, W.M.A.W. Application of doped photocatalysts for organic pollutant degradation—A review. J. Environ. Manag. 2017, 198, 78–94. [Google Scholar] [CrossRef]
- Bandara, J.; Mielczarski, J.A.; Kiwi, J. 2. Photosensitized degradation of azo dyes on Fe, Ti, and Al oxides. Mechanism of charge transfer during the degradation. Langmuir 1999, 15, 7680–7687. [Google Scholar] [CrossRef]
- Sakthivel, S.; Neppolian, B.; Shankar, M.V.; Arabindoo, B.; Palanichamy, M.; Murugesan, V. Solar photocatalytic degradation of azo dye: Comparison of photocatalytic efficiency of ZnO and TiO2. Sol. Energy Mater. Sol. Cells 2003, 77, 65–82. [Google Scholar] [CrossRef]
- Poulios, I.; Tsachpinis, I. Photodegradation of the textile dye Reactive Black 5 in the presence of semiconducting oxides. J. Chem. Technol. Biotechnol. Int. Res. Process Environ. Clean Technol. 1999, 74, 349–357. [Google Scholar] [CrossRef]


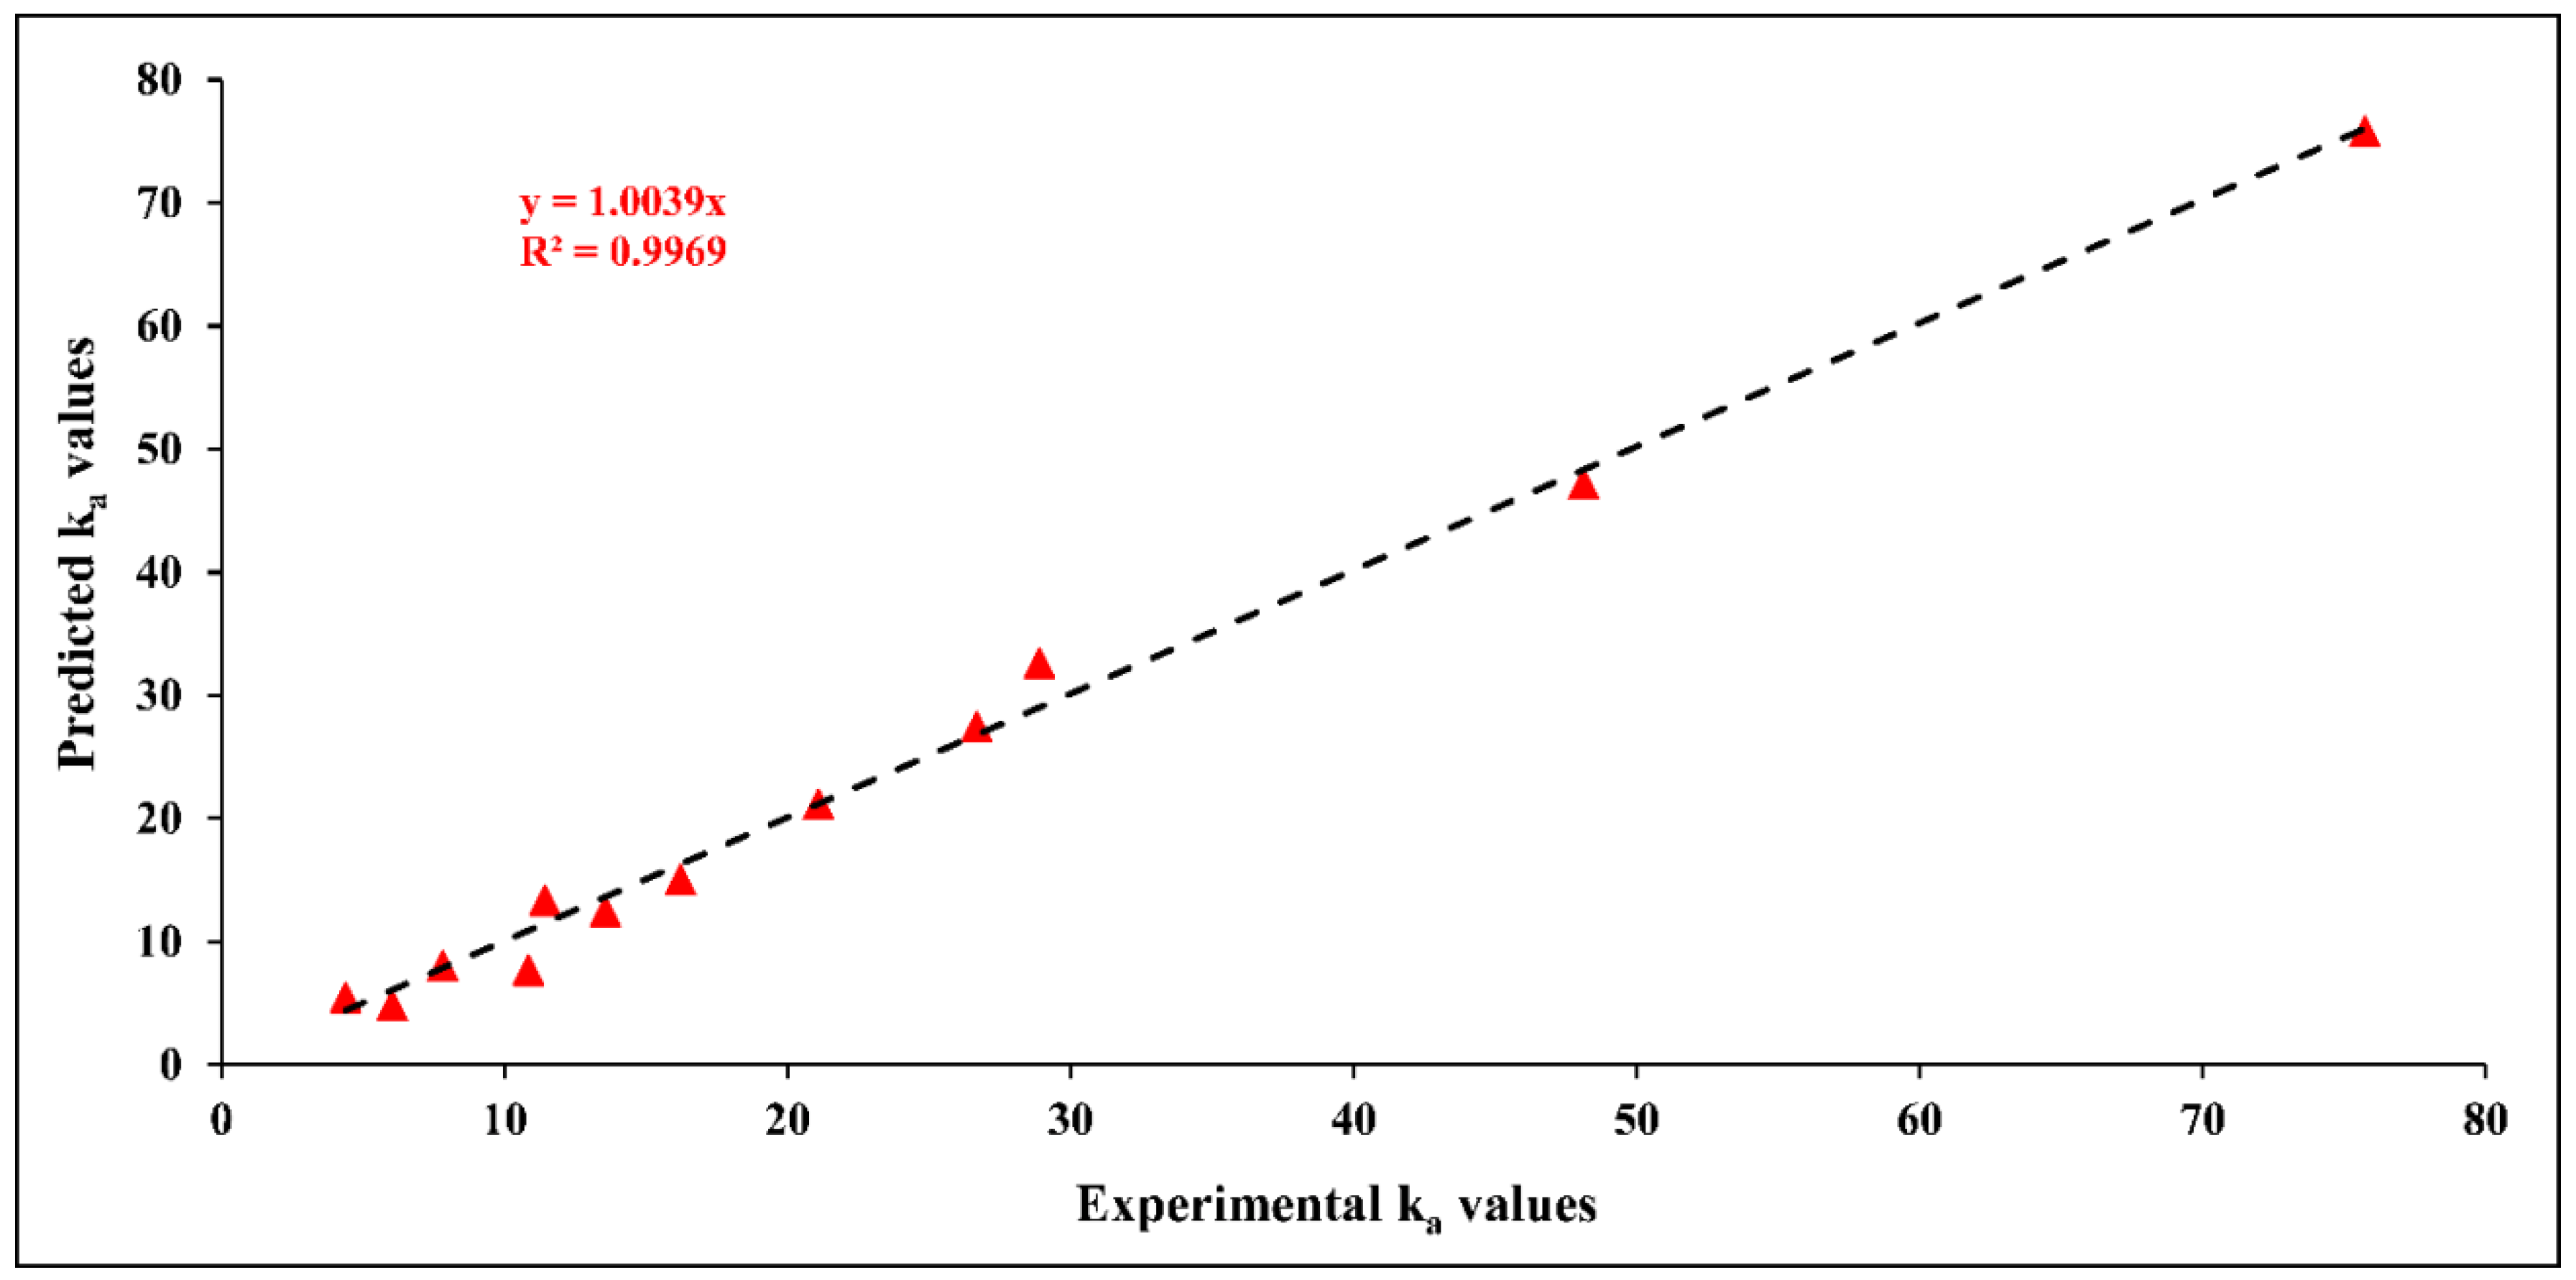
| N | Dye Concentration (mg/L) | Catalyst Loading (g/L) | Light Intensity (W/m2) | ka × 103 (min−1) | R2 |
|---|---|---|---|---|---|
| 1 | 60 | 1 | 11.2 | 10.85 | 0.9857 |
| 2 | 40 | 1 | 11.2 | 16.22 | 0.9823 |
| 3 | 25 | 1 | 11.2 | 28.89 | 0.9905 |
| 4 | 15 | 1 | 11.2 | 75.74 | 0.9796 |
| 5 | 36 | 0.2 | 9.7 | 6.03 | 0.9912 |
| 6 | 36 | 0.4 | 9.7 | 7.81 | 0.9846 |
| 7 | 36 | 0.8 | 9.7 | 11.44 | 0.9946 |
| 8 | 36 | 1.5 | 9.7 | 21.2 | 0.9789 |
| 9 | 20 | 1 | 1 | 4.39 | 0.9802 |
| 10 | 20 | 1 | 2.5 | 13.57 | 0.9965 |
| 11 | 20 | 1 | 6.1 | 26.68 | 0.995 |
| 12 | 20 | 1 | 11.2 | 48.12 | 0.9886 |
| Co mg/L |
ka × 103 min−1 | Estimated min | Observed min |
|---|---|---|---|
| 60 | 10.85 | 59.58 | 63.87 |
| 40 | 16.22 | 42.16 | 42.73 |
| 25 | 28.89 | 29.09 | 23.99 |
| 15 | 75.74 | 20.38 | 9.15 |
| Concentration mg/L | Rate Constant kr, mg L−1 min−1 |
|---|---|
| 60 | 0.716 |
| 40 | 0.747 |
| 25 | 0.897 |
| 15 | 1.595 |
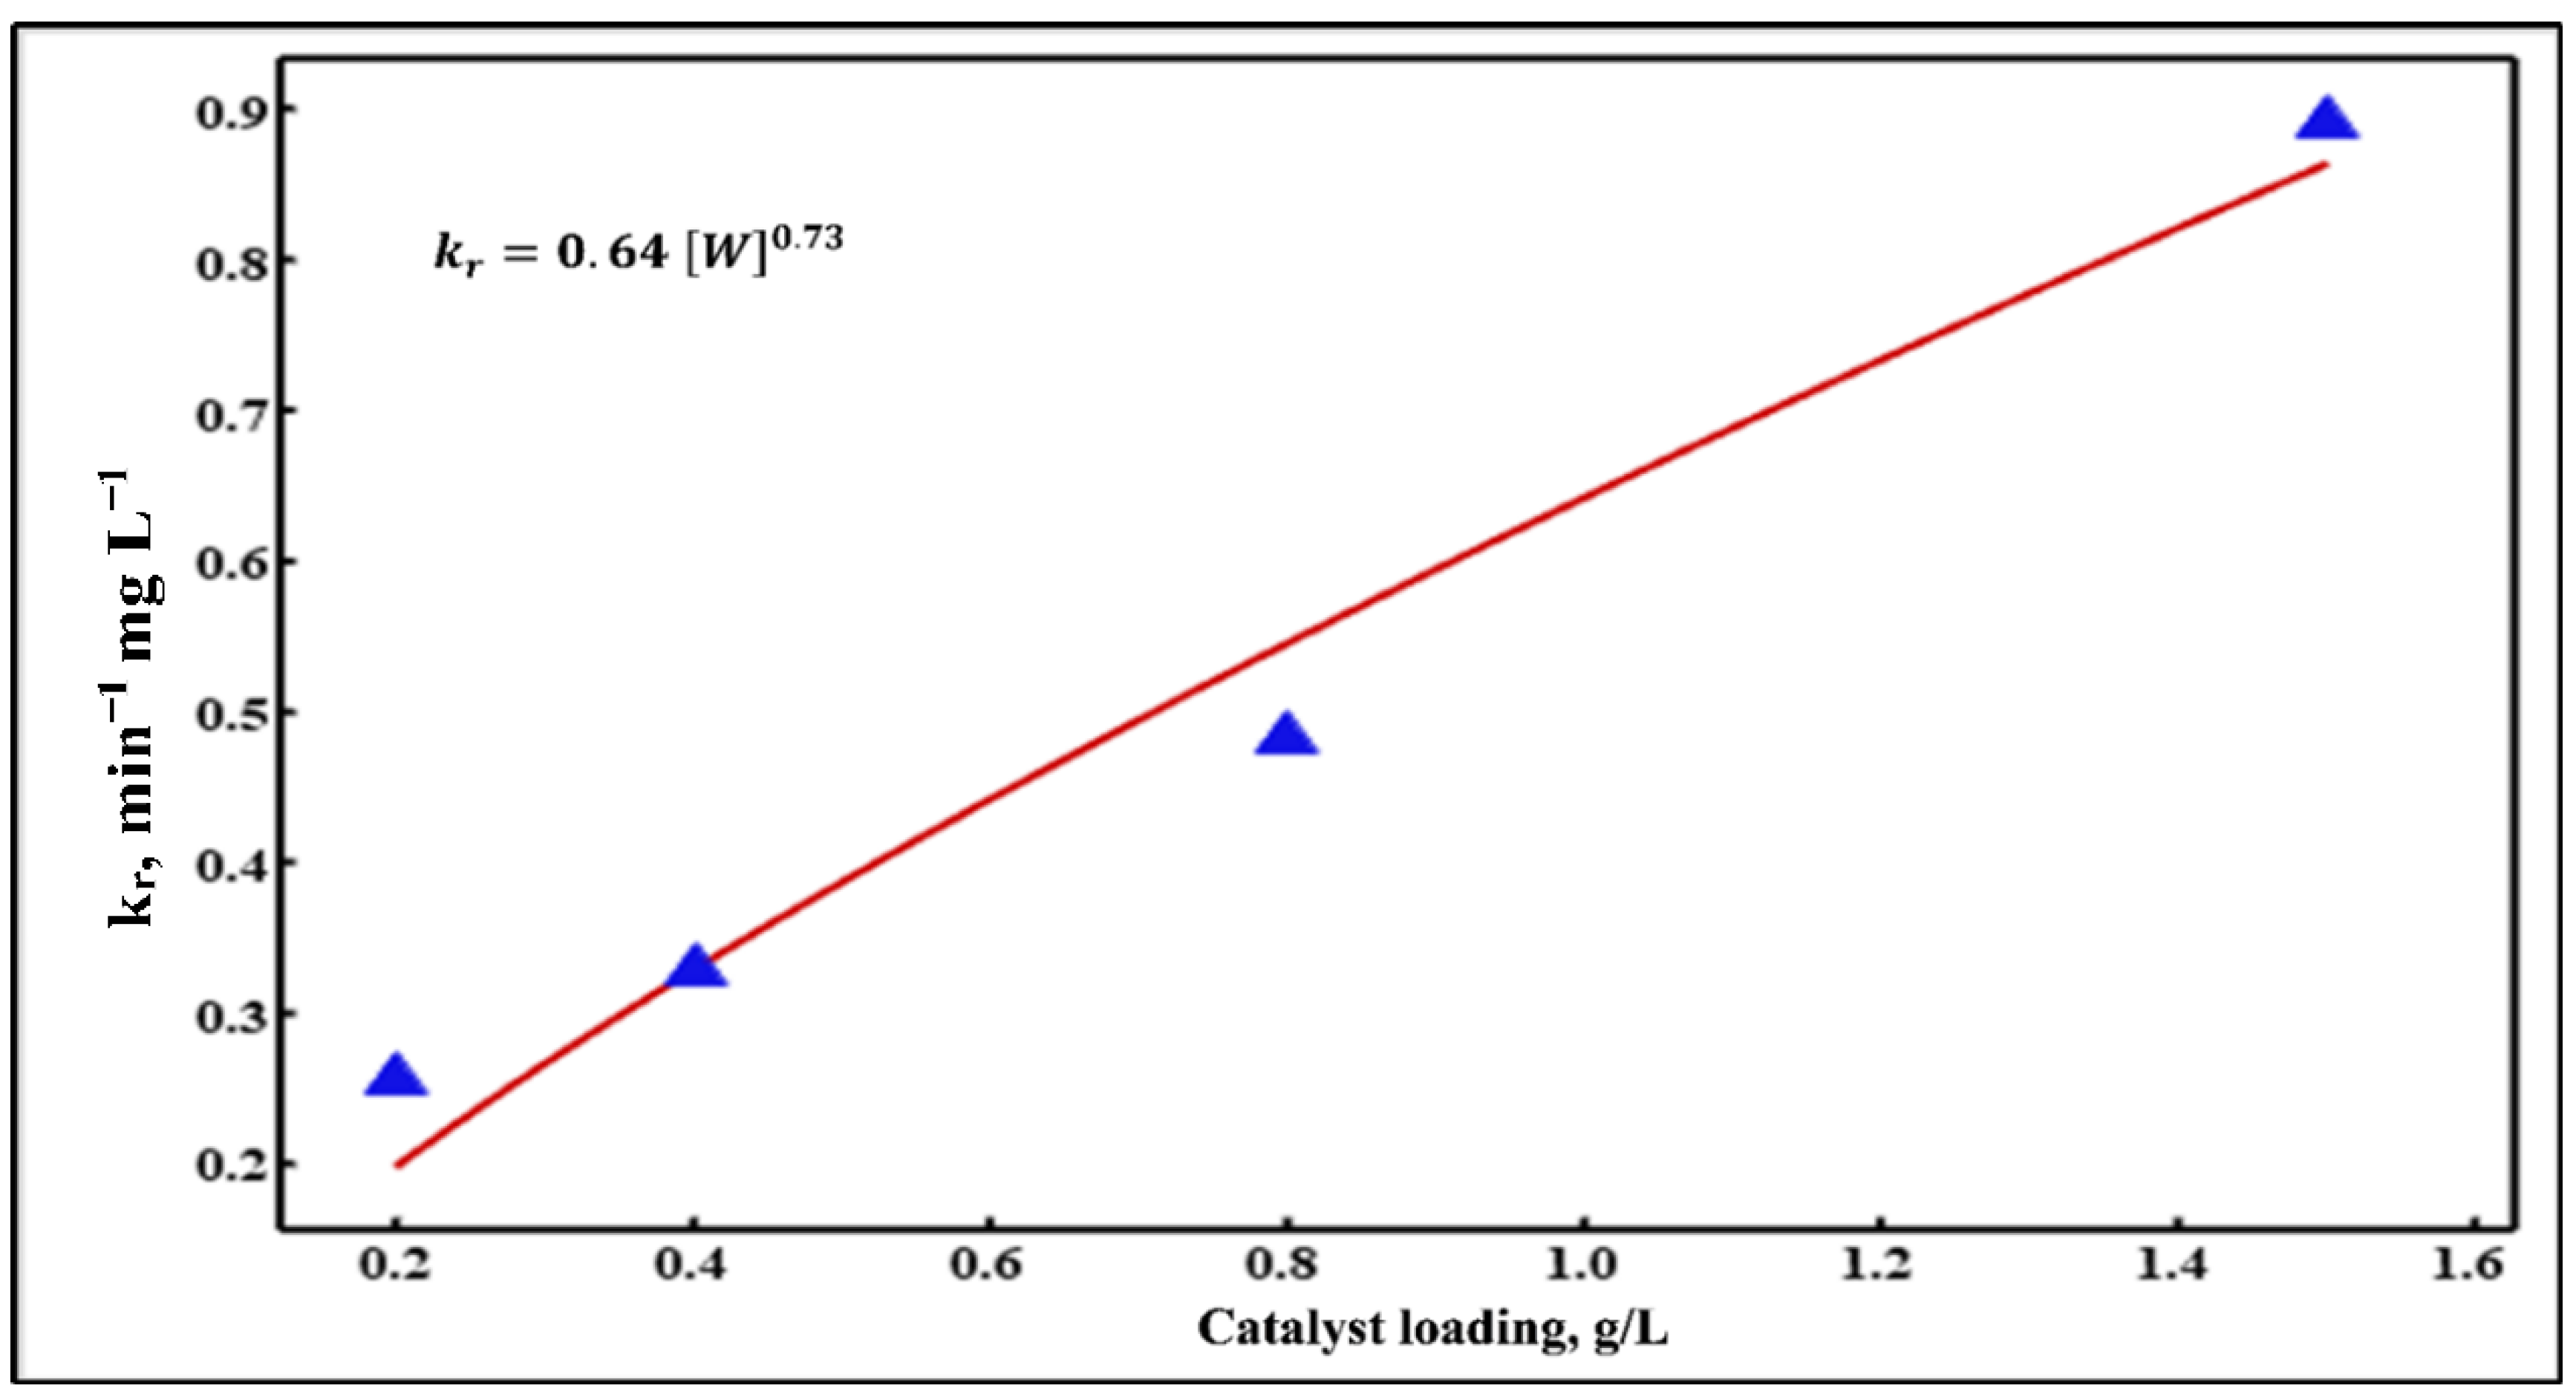
| Catalyst Loading g/L | Rate Constant kr, mg L−1 min−1 |
|---|---|
| 0.2 | 0.254 |
| 0.4 | 0.328 |
| 0.8 | 0.481 |
| 1.5 | 0.892 |
| Light Intensity W/m2 | Rate Constant kr, mg L−1 min−1 |
|---|---|
| 1 | 0.114 |
| 2.5 | 0.354 |
| 6.1 | 0.695 |
| 11.2 | 1.254 |
| Coefficient | Type | Value |
|---|---|---|
| a | Constant term | 0.28 |
| b | Power law term | −1.65 |
| c | 0.73 | |
| d | 0.89 |
| N | K | kr | ka | Model Compound | Catalyst | Author | Year | Remarks |
|---|---|---|---|---|---|---|---|---|
| 1 | Values ranged 3.46 to 12.6 × 10⁴ dm3 mol−1 | Values ranged 2.11 to 4.46 × 10⁻⁶ mol dm−3 min−1 | - | Acetophenone | Slurry P25 TiO2 | Xu & Langford [19] | 2000 | and obtained at different . |
| 2 | - | Para-chlorobenzoate | Slurry P25 TiO2 | Meng et al. [18] | 2002 | and obtained at different . The correlation equation between their values and obtained. | ||
| 3 | - | - | Eosin B | Immobilized P25 TiO2 | Zhou & Ray [26] | 2003 | obtained as a function of and W. | |
| 4 | - | - | | Remazol Red | Slurry ZnO | Yatmaz et al. [29] | 2004 | Separately, correlated to different parameters: [W], [C]o and Io. |
| 5 | Acid Yellow 23 | Slurry ZnO | Behnajady et al. [27] | 2006 | and obtained as a function of Io. Then, the experimental values compared with the calculated values. | |||
| 6 | - | - | Acid Red 27 | Slurry P25 TiO2 | Behnajady & Modirshahla [30] | 2006 | Separately, correlated to different parameters. Then, correlated to the combined parameters. | |
| 7 | - | - | Diclofenac | Immobilized catalysts: P25 and modified TiO2 | Hashim et al. [28] | 2014 | correlated to different Io. | |
| 8 | 0.081 | 0.74 | Aid Orange 7 | Immobilized P25 TiO2 | Sheidaei & Behnajady [46] | 2015 | and values obtained by fitting values to initial dye concentrations. | |
| 9 | 0.165 | | Direct Blue 15 | Slurry P25 TiO2 | This work | - | At optimized pH, has a constant value. obtained as a function of [C]o, [W], and Io. The experimental values compared with the calculated values. | |
| 10 | - | - | Direct Blue 15 | Slurry P25 TiO2 | This work | - | Power law empirical model |
| N | Dye Concentration mg/L | Catalyst Density Kg/m2 × 104 | Light Intensity (W/m2) | pH | ka × 103 (min−1) |
|---|---|---|---|---|---|
| 1 | 25 | 8.72 | 11.2 | Natural pH | 5.65 |
| 2 | 20 | 8.72 | 11.2 | 7.89 | |
| 3 | 16 | 8.72 | 11.2 | 11.33 | |
| 4 | 12 | 8.72 | 11.2 | 19.2 | |
| 5 | 9 | 8.72 | 11.2 | 35.11 | |
| 6 | 10 | 1.46 | 1 | 1.92 | |
| 7 | 10 | 1.46 | 2.5 | 2.68 | |
| 8 | 10 | 1.46 | 6.1 | 4.41 | |
| 9 | 10 | 1.46 | 11.2 | 6.25 |
| N | Amount of Original Carbon, mg/L | Amount of Remaining Carbon, mg/L | Carbon Removal, % | Reaction Time, h |
|---|---|---|---|---|
| 1 | 16.44 | 4.020 | 75.55 | 14 |
| 2 | 16.44 | 2.690 | 83.64 | 16 |
| 3 | 16.44 | 2.677 | 83.72 | 16 |
Publisher’s Note: MDPI stays neutral with regard to jurisdictional claims in published maps and institutional affiliations. |
© 2021 by the authors. Licensee MDPI, Basel, Switzerland. This article is an open access article distributed under the terms and conditions of the Creative Commons Attribution (CC BY) license (https://creativecommons.org/licenses/by/4.0/).
Share and Cite
Jadaa, W.; Prakash, A.; Ray, A.K. Photocatalytic Degradation of Diazo Dye over Suspended and Immobilized TiO2 Catalyst in Swirl Flow Reactor: Kinetic Modeling. Processes 2021, 9, 1741. https://doi.org/10.3390/pr9101741
Jadaa W, Prakash A, Ray AK. Photocatalytic Degradation of Diazo Dye over Suspended and Immobilized TiO2 Catalyst in Swirl Flow Reactor: Kinetic Modeling. Processes. 2021; 9(10):1741. https://doi.org/10.3390/pr9101741
Chicago/Turabian StyleJadaa, Waleed, Anand Prakash, and Ajay K. Ray. 2021. "Photocatalytic Degradation of Diazo Dye over Suspended and Immobilized TiO2 Catalyst in Swirl Flow Reactor: Kinetic Modeling" Processes 9, no. 10: 1741. https://doi.org/10.3390/pr9101741
APA StyleJadaa, W., Prakash, A., & Ray, A. K. (2021). Photocatalytic Degradation of Diazo Dye over Suspended and Immobilized TiO2 Catalyst in Swirl Flow Reactor: Kinetic Modeling. Processes, 9(10), 1741. https://doi.org/10.3390/pr9101741