Article

Grid-Based Employee Safety Behavior Risk Assessment of the Train Operation Department

1
School of Safety Engineering, Beijing Institute of Petrochemical Technology, Beijing 102617, China
2
Beijing Academy of Safety Engineering and Technology, Beijing 102617, China
*
Author to whom correspondence should be addressed.
Processes 2022, 10(5), 913; https://doi.org/10.3390/pr10050913
Submission received: 28 March 2022 / Revised: 26 April 2022 / Accepted: 28 April 2022 / Published: 5 May 2022

Abstract

:
In the train operation department, the most important and dynamic factor is that the department employees are involved in all areas. Realizing the dynamic control of “key person, key event, and key period” to fundamentally curb employee inertia violation is a significant issue that needs to be solved on the railway site. The traditional “probability–severity” two-dimensional risk assessment model is carried out from the perspective of the system, ignoring the spatiotemporal risk characteristics of the individual, and a large amount of hazard factor data generated in the operation process is not applied in the risk assessment process. As a result, safety behavior risk practice lacks pertinence, accuracy, and individuation. This study proposes a safety behavior risk assessment model based on the grid management and hazard factor assignment function to improve the traditional two-dimensional risk matrix. By introducing spatial location variables, the method accurately locates and classifies the site staff and organizes the disorder and lack of associated risk data with regard to time and space. With a focus on the hazard factor, the induced intensity is proposed for the first time and considered as the input of probability calculation to innovate the traditional “probability–severity” risk matrix. Finally, the methodology is applied to the risk event assessment of “the assistant watchman doesn’t appear as required” scenario in the Huangyangcheng station of Shenshuo Railway, and the evaluation results realize the personalized evaluation of the risk event in different cell grids.

1. Introduction

As the main artery of the national economy, the railway sector has the advantages of being green, low-carbon, energy-saving, offering environmental protection value, and all-weather operations in the modern comprehensive transportation system. Railway transportation, as a major engine, links the production, joint operation, and networking of equipment. Several risk factors affect transportation safety, which can lead to railway traffic accidents. Considered as the organizer and commander of railway transportation activities, the train operation department is a real-time monitoring system as well as an open and dynamic operating system with traffic officers being the core, management being the center of operations, transportation facilities and equipment being the foundation, and environment being the condition. Under the influence of internal and external environment, the safety behavior risks of employees in different time periods and working areas exhibit significant differences, which include heterogeneity, uncertainty, and coupling. Traditional risk assessment methods consider these characteristics, but the scope is limited, as it is too general. As a result, safety behavior risk practice lacks pertinence, accuracy, and individuation.
Existing safety behavior risk assessment activities ignore the spatiotemporal risk characteristics of the individual research object. The traditional safety behavior risk assessment is modeled and analyzed based on the system safety [1,2,3], which ignores differences in variation rules of individual safety behavior risk in different time periods and working areas, and as a result, the risk assessment may not accurately reflect the individual safety behavior risk status under specific space–time conditions. On the other hand, there has not been much focus on the importance of hazard factors in the risk assessment process, e.g., the lack of analysis of risk coupling characteristics of hazard factors and personalized modeling assignment. In the practice of safety risk management, some scholars ignore the coupling relationship between hazard factors in the process of solving risk magnitude based on historical accident statistics [4,5,6,7]. Owing to the inadequacy, incompleteness, or inaccuracy of field data collection, as well as the lack of timely analysis of a large amount of data, it is difficult for risk assessment results to fully reflect the current risk status of the system. The main reason is that existing risk assessment technologies could not obtain the real-time information of these heterogeneous factors, and quantifying the data is a big issue with regard to risk assessment progress.
To systematically solve the aforementioned problem, this study innovatively proposes a grid management method including grids, grid elements, and grid events to assess the safety behavior risk of train operation department employees. Using spatial location variables, the method accurately locates and classifies onsite workers and organizes disordered and uncorrelated risk data to make them more effective. Regarding the hazard factor as the core element, the ANP method is used to calculate the weight of hazard factors, and based on the personalized hazard factor assignment function, the hazard factor assignment is solved and considered as the input of probability calculation, which enhances the traditional “probability–severity” two-dimensional risk assessment matrix model. This study solves the problem of inaccuracy of risk magnitude analysis with regard to the process of risk assessment and realizes the personalized and dynamic assessment of risk events of train operation department employees.
This study is organized as follows: Section 2 presents a literature review about safety behavior risk assessment technologies from the perspective of the system as a whole and historical data utilization. Section 3 introduces the grid management method, including the safety behavior risk characteristics of the train operation department, definition and coding of the grid, the grid elements, and a grid event. Section 4 introduces the risk assessment model of safety behavior in a single grid, which includes risk identification, risk analysis, and risk evaluation. Section 5 describes the practicability of this method by considering the “the assistant watchman did not appear as required” scenario in Huangyangcheng station of Shenshuo Railway as an example. Section 6 discusses the results of model validation. Section 7 summarizes the innovation of this study and provides directions on future research.

2. Literature Review

Recently, many experts and scholars at home and abroad have done a lot of research on risk assessment in various fields. In terms of the safety behavior risk of employees, they mainly evaluate the safety behavior risk by analyzing hidden dangers and accidents. For instance, Zhan et al. [4] evaluated defects of the organizational safety management based on the accident and hidden danger data of Chinese railways over the past 4 years. Baysari et al. [5] systematically analyzed human factors in 40 railway safety accident investigation reports in Australia based on the framework of the human factors analysis and classification system (HFACS) and concluded the importance of strengthening resource management and improving safety atmosphere and organizational process with regard to the management of railway accidents and hidden dangers in Australia. Ugurlu et al. [6] investigated 70 passenger ship collisions and contact accidents during 1991–2015 and proposed an innovative human factor analysis and classification system for passenger vessel accidents (HFACS-PV) approach to analyze human factors in passenger ship accidents in detail. Xing et al. [7] analyzed 950 cases of escalator injury in the Guangzhou subway to determine characteristics and risk factors of escalator injury in China. Liu et al. [8] used the human factor analysis and classification system for coal mines (HAFCS-CM) to identify the influencing factors of coal mine workers’ unsafe behaviors from 24 indicators, including external environment and organizational influence, and designed a questionnaire to analyze the collected survey data and evaluate its credibility and validity. Tan and Moinuddin [9] studied the possible impact of errors caused by human and organizational factors on risk assessment in fire safety modeling of high-rise buildings by means of a systematic review. Al-Sakkaf et al. [10] constructed a risk assessment model for heritage buildings, and 38 Yemeni experts in the field of heritage building management were surveyed to examine the identified risks in three case study heritage sites in Yemen. The evaluation results revealed that armed conflicts, climate change, and flooding were three of the most critical risk factors in Yemeni heritage buildings. Huang et al. [11] believed that the coupling and interaction between human errors, mechanical failures, adverse environment, and organizational factors may lead to the change of system state, resulting in the variability of system operation, so that they used the N-K model to calculate the coupling risk intensity, which provides a quantitative method to evaluate the variability of the functional module. Huang et al. [12] used the N-K model to analyze the formation mechanism of the coupling risk of China’s railway dangerous goods transport system from five aspects: human, machine, material, environment, and management. Kyriakidis et al. [13] present a novel approach to assess human performance accounting for the dependencies among the relevant performance shaping factors, referred to as the uman Performance Railway Operational Index.
In view of the deficiency of system management, grid management has been effectively applied to urban management, railway infrastructure construction, and project management [14,15,16,17,18]. The core function of grid management is to control the managed objects from a geographical perspective rather than the traditional professional perspective. The grid management method comprises staff participation, logical virtual grid, and three-dimensional space attributes of time, space, and event. Using grids, components, events, and corresponding coding rules, it accurately locates and categorizes on-site workers based on time and space and sorts the disordered and uncorrelated risk data to improve data quality. The method provides modeling support for personalized risk assessment and accurate risk response and helps realize the efficient management of safety behavior risk events of workers in the transportation system.
In order to improve the accuracy of safety behavior risk assessment, some experts and scholars have improved the respective methods based on different angles. For instance, Ghofrani et al. [19] applied big data analysis (BDA) to the field of railway transportation operation, maintenance, and safety; however, owing to the heterogeneity, inconsistency, and incompleteness of data collection, a large amount of data could not be collected and effectively processed, and it was difficult to explore the data in detail. Liu et al. [20] established a fault tree logic diagram based on high-speed railway accidents and presented a method that included in-depth fault tree and quantitative analyses to comprehensively investigate high-speed railway accidents. In the quantitative analysis, owing to the incompleteness of prior information and the complexity of the decision-making environment, every basic event in the fault tree was uncertain. Huang et al. [21] proposed a method that included fault tree and fuzzy D-S evidential reasoning to analyze accidents in the railway transport system of dangerous goods, so as to solve problems of uncertainty modeling and information fusion with regard to the analysis of accidents caused by transporting hazardous goods. Huang et al. [22] proposed a simple, dynamic, systematic, and quantitative extended safety failure event network (SFEN) method to analyze the reliability and safety with regard to accidents caused by the typical railway dangerous goods transport system in the past. The extended SFEN method was dedicated to transform the traditional accident occurrence process into a visual accident analysis network platform. Cirovic and Pamucar [23] proposed a priority decision support model for railway level crossing safety improvement based on the modeling method of the adaptive neuro fuzzy inference system (ANFIS). The ANFIS model was a training data set based on fuzzy multicriteria decision-making and fuzzy clustering. Klockner and Toft [24] proposed a complex social technology network-security and failure event network. This method provided a basis to effectively analyze the complexity of the relationship between system factors with regard to railway accidents in Australia. Zhu et al. [25] used the structural equation model to analyze coal mine accidents and unsafe behaviors of employees. Based on the literature review, they selected four elements related to coal mine safety, safety management, environmental safety, and organizational politics to build a structural equation model and formulated a questionnaire. Likert scale and the principal component analysis were used to evaluate the attitude of respondents and analyze the causal relationship between the safety behavior and attitude of coal mine workers. Hsieh et al. [26] studied human error factors in adverse medical events in emergency departments in Taiwan based on the literature review and conducted a fuzzy evaluation of the importance of each factor. Qiao et al. [27] used the data of 35,424 cases of unsafe behavior extracted from Yima Coal Industry in Henan Province, China, during 2013–2015. With the help of data mining technology, ten hazard factors, e.g., age, experience, education level, unqualified training quantity, abnormal attendance, unsafe behavior quantity, dangerous place, time, workplace, month, and unsafe behavior risk level, were determined. Chai and Zhou [28] developed an integrated risk assessment method for the train control system by combining a fishbone diagram and a fuzzy analytic hierarchy process (FAHP) with a cloud model. In this model, a revised risk matrix based on FAHP was introduced to calculate the consequence and likelihood weights for each risk factor, and then the risk index was obtained by making a product of consequence and likelihood weights, which reflected relative influence degree on operational risk. Fejdys et al. [29] dealt with the development of a calculation algorithm to assess the risk of actions taken on the site of a traffic incident, which was implemented into the training version of a virtual reality simulation. It included a number of factors and elements that formed a scenario of simulations that affected the degree of its difficulty and the assessment of the performance of each exercise.

3. Grid Management Method

3.1. Safety Behavior Risk Characteristics of the Train Operation Department

3.1.1. Heterogeneity

The safety behavior risk of the train operation department has heterogeneity, which is manifested in the variation of the safety behavior risk of employees of the same position at different time periods and spatial positions. It is the comprehensive influence of multiple hazard factors, which are different in different operation periods and different operation locations. The hazard factor is a function of space and time, and its relationship is shown in Formula (1), where x i represents the i th ( i = 1 , 2 , , n ) hazard factor, and g i represents the functional relationship between x i and time and space.
x i = g i ( t i m e , l o c a t i o n )
Considering the heterogeneity of the safety behavior risks of the train operation department, grid management can subdivide employees of various positions with different operating scope and business boundaries according to the area units of polygon regions with different sizes and discrete distribution, and understand, grasp, and control employees of various positions from the perspective of spatial location, so that the railway managers can in a shorter time and a smaller space garner a more comprehensive grasp of the staff at what time, where, and what kind of risk events may occur.

3.1.2. Uncertainty

‘Uncertainty’ means the absence or partial absence of relevant information, knowledge, or awareness of an event and its consequences or likelihood of occurring [30]. The uncertainty of the safety behavior risk of the train operation system reflected in whether a safety behavior risk event occurs in a specific spatial location is difficult to accurately evaluate. This is because the safety behavior risk of employees is affected by multiple hazard factors which are changing from time to time, resulting in the risk always being in the process of dynamic change.

3.1.3. Coupling

‘Coupling’ originates from physics and refers to the phenomenon of joint interaction between two or more systems or forms of motion that affect each other through various interactions [31,32]. In the field of risk management, ‘risk coupling’ refers to the degree to which the occurrence and influence of an individual or a type of risk in a system depends on other risks and the degree to which the occurrence and influence of other risks are affected [33,34,35,36,37]. Considering the coupling of the safety behavior risks of the train operation system, grid management will accurately analyze the internal mechanism of different hazard factors in the same spatial location by introducing spatial location variables, quantitatively study the coupling mechanism of hazard factors, and more truly reflect the inherent attributes of risks.
According to the aforementioned risk characteristics, the proposed grid management of the train operation department is a logical virtual grid with personnel participation; it has three dimensional attributes: time, space, and event. Events of employees in any unit grid at any time can be accurately displayed in the “grid–element–time” three-dimensional coordinate system, and it can organize the disordered and uncorrelated risk data so that railway managers can have a more comprehensive perception and grasp of when, where, and what risk may occur to employees in a short time and in a small space, providing modeling support for personalized risk assessment. Figure 1 shows the three-dimensional spatial relationship among grid, element, and event. The work activities of employees can be reflected in the coordinate system of three-dimensional space, and the factor A i j is the j th element in grid G i , corresponding to events that occur at different moments: T i j k , T i j k + 1 , and T i j k + 2 .

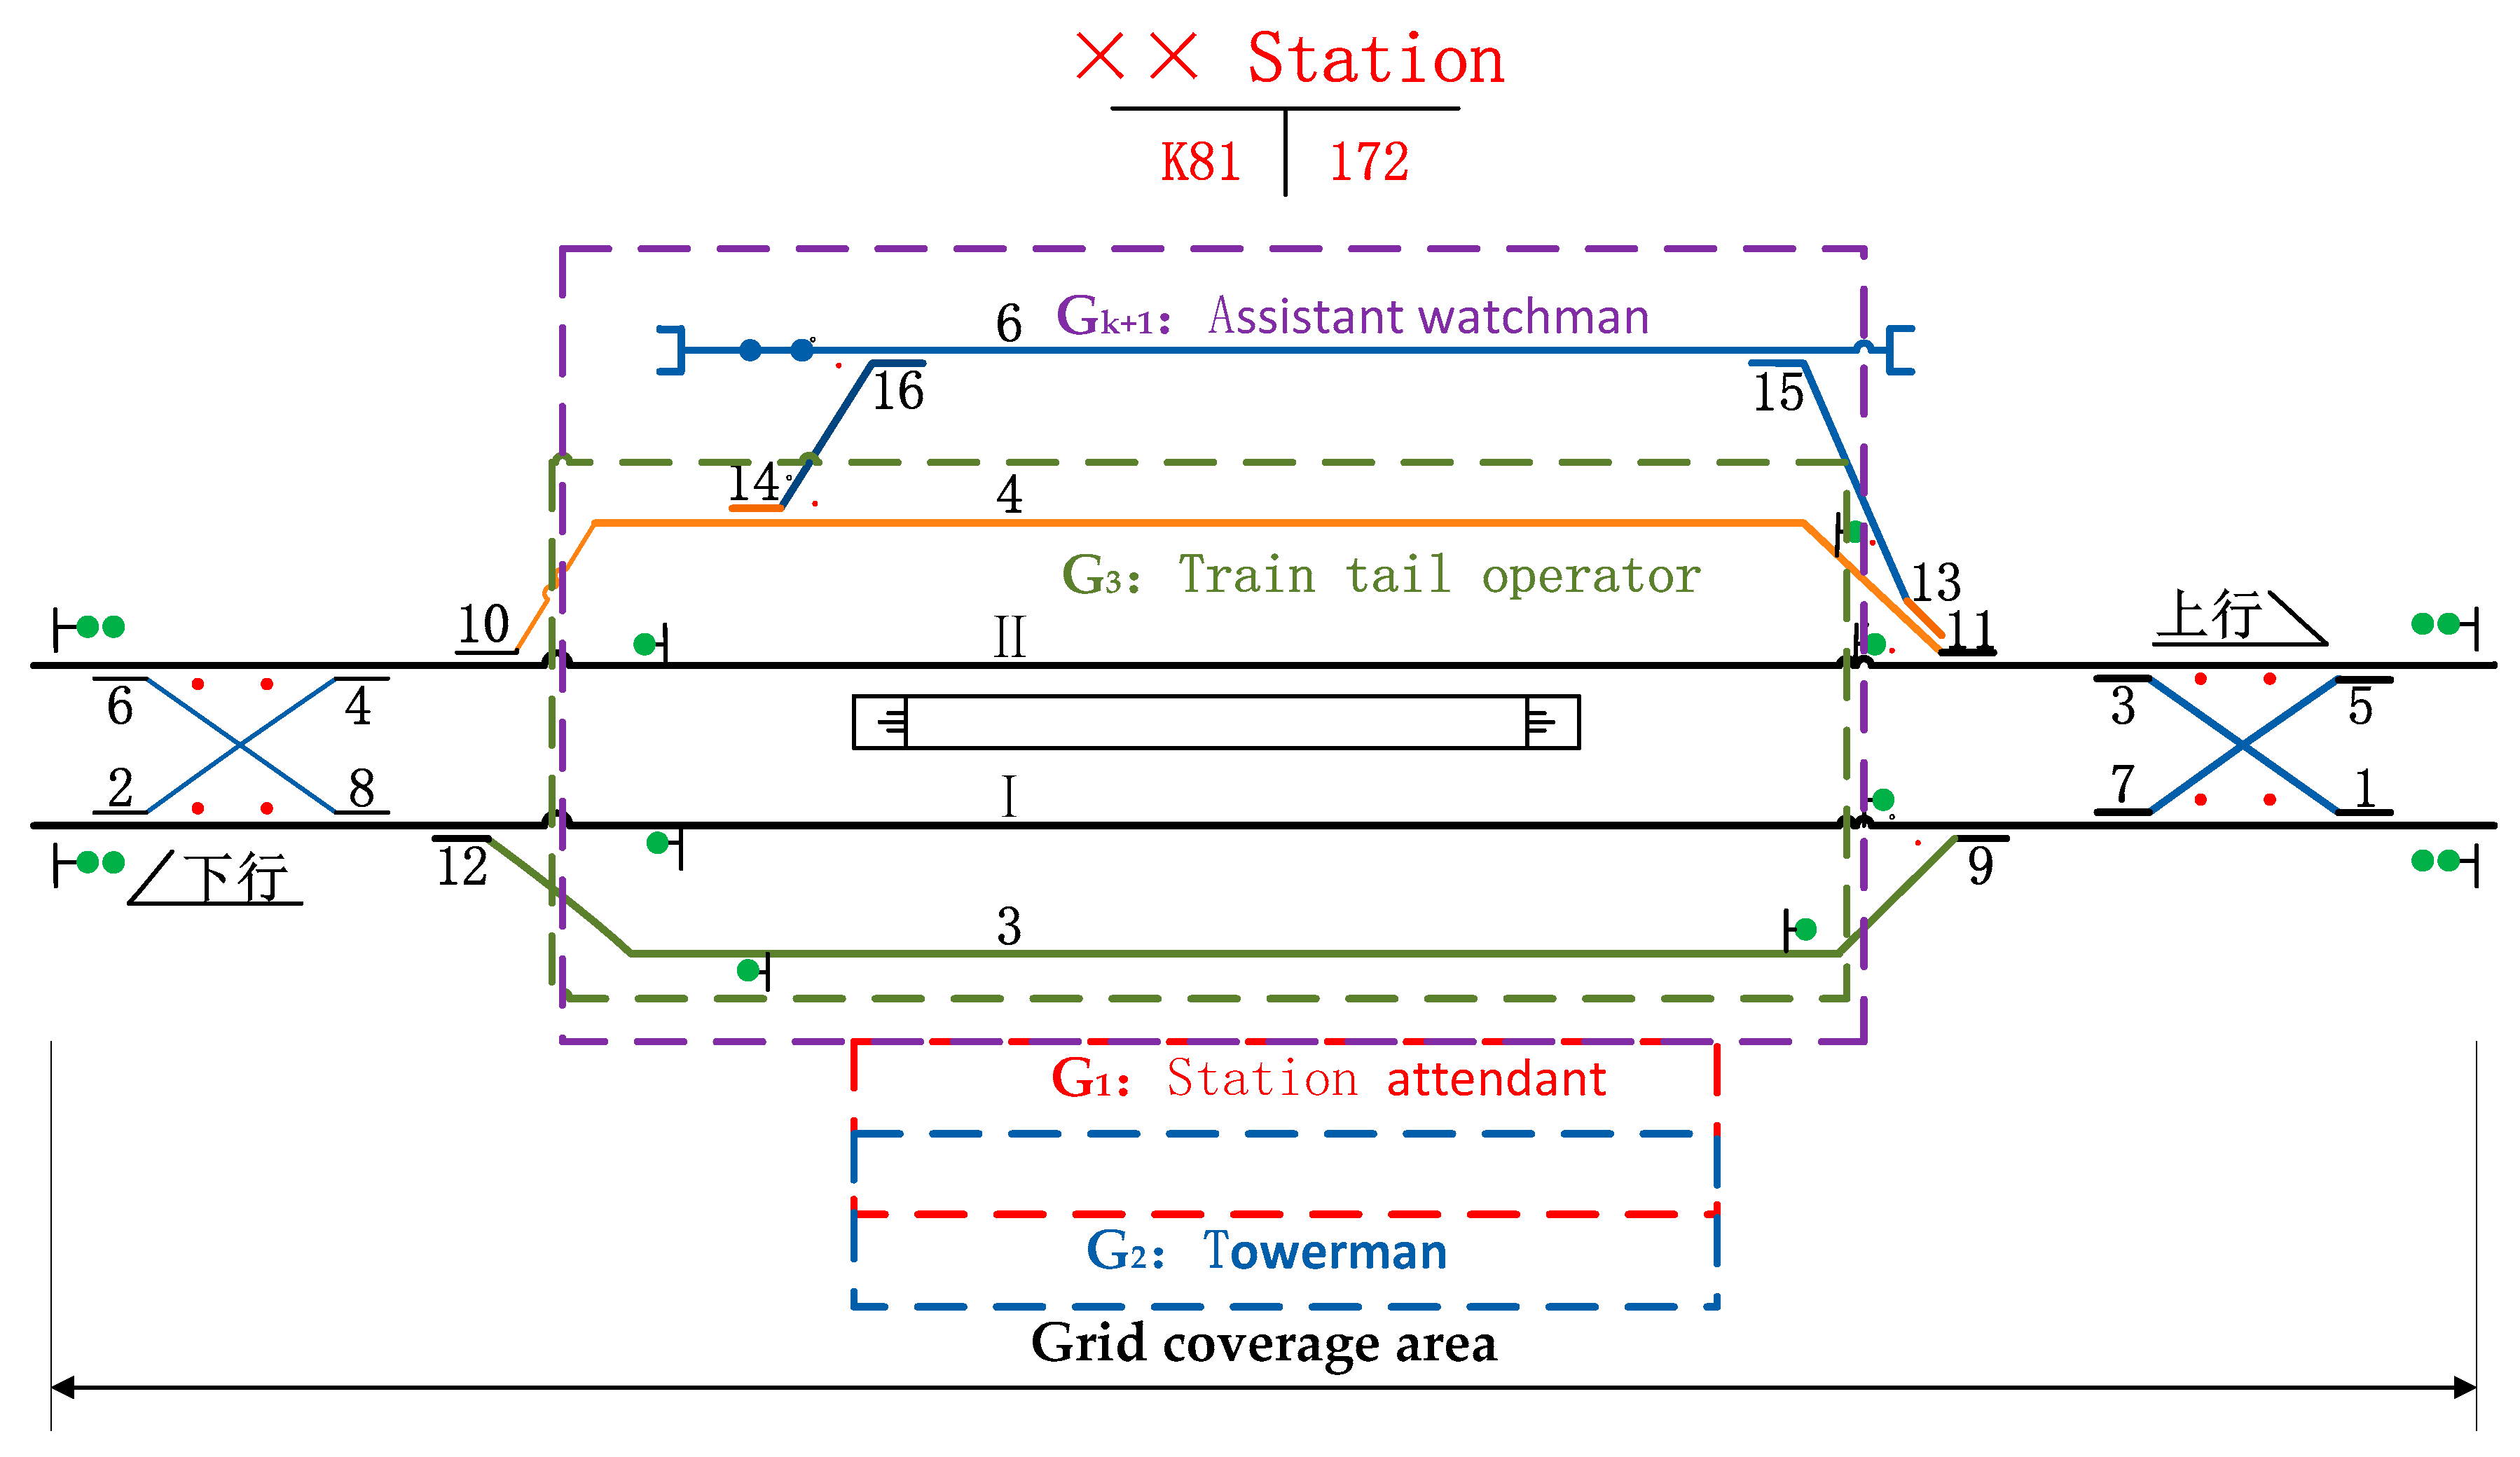
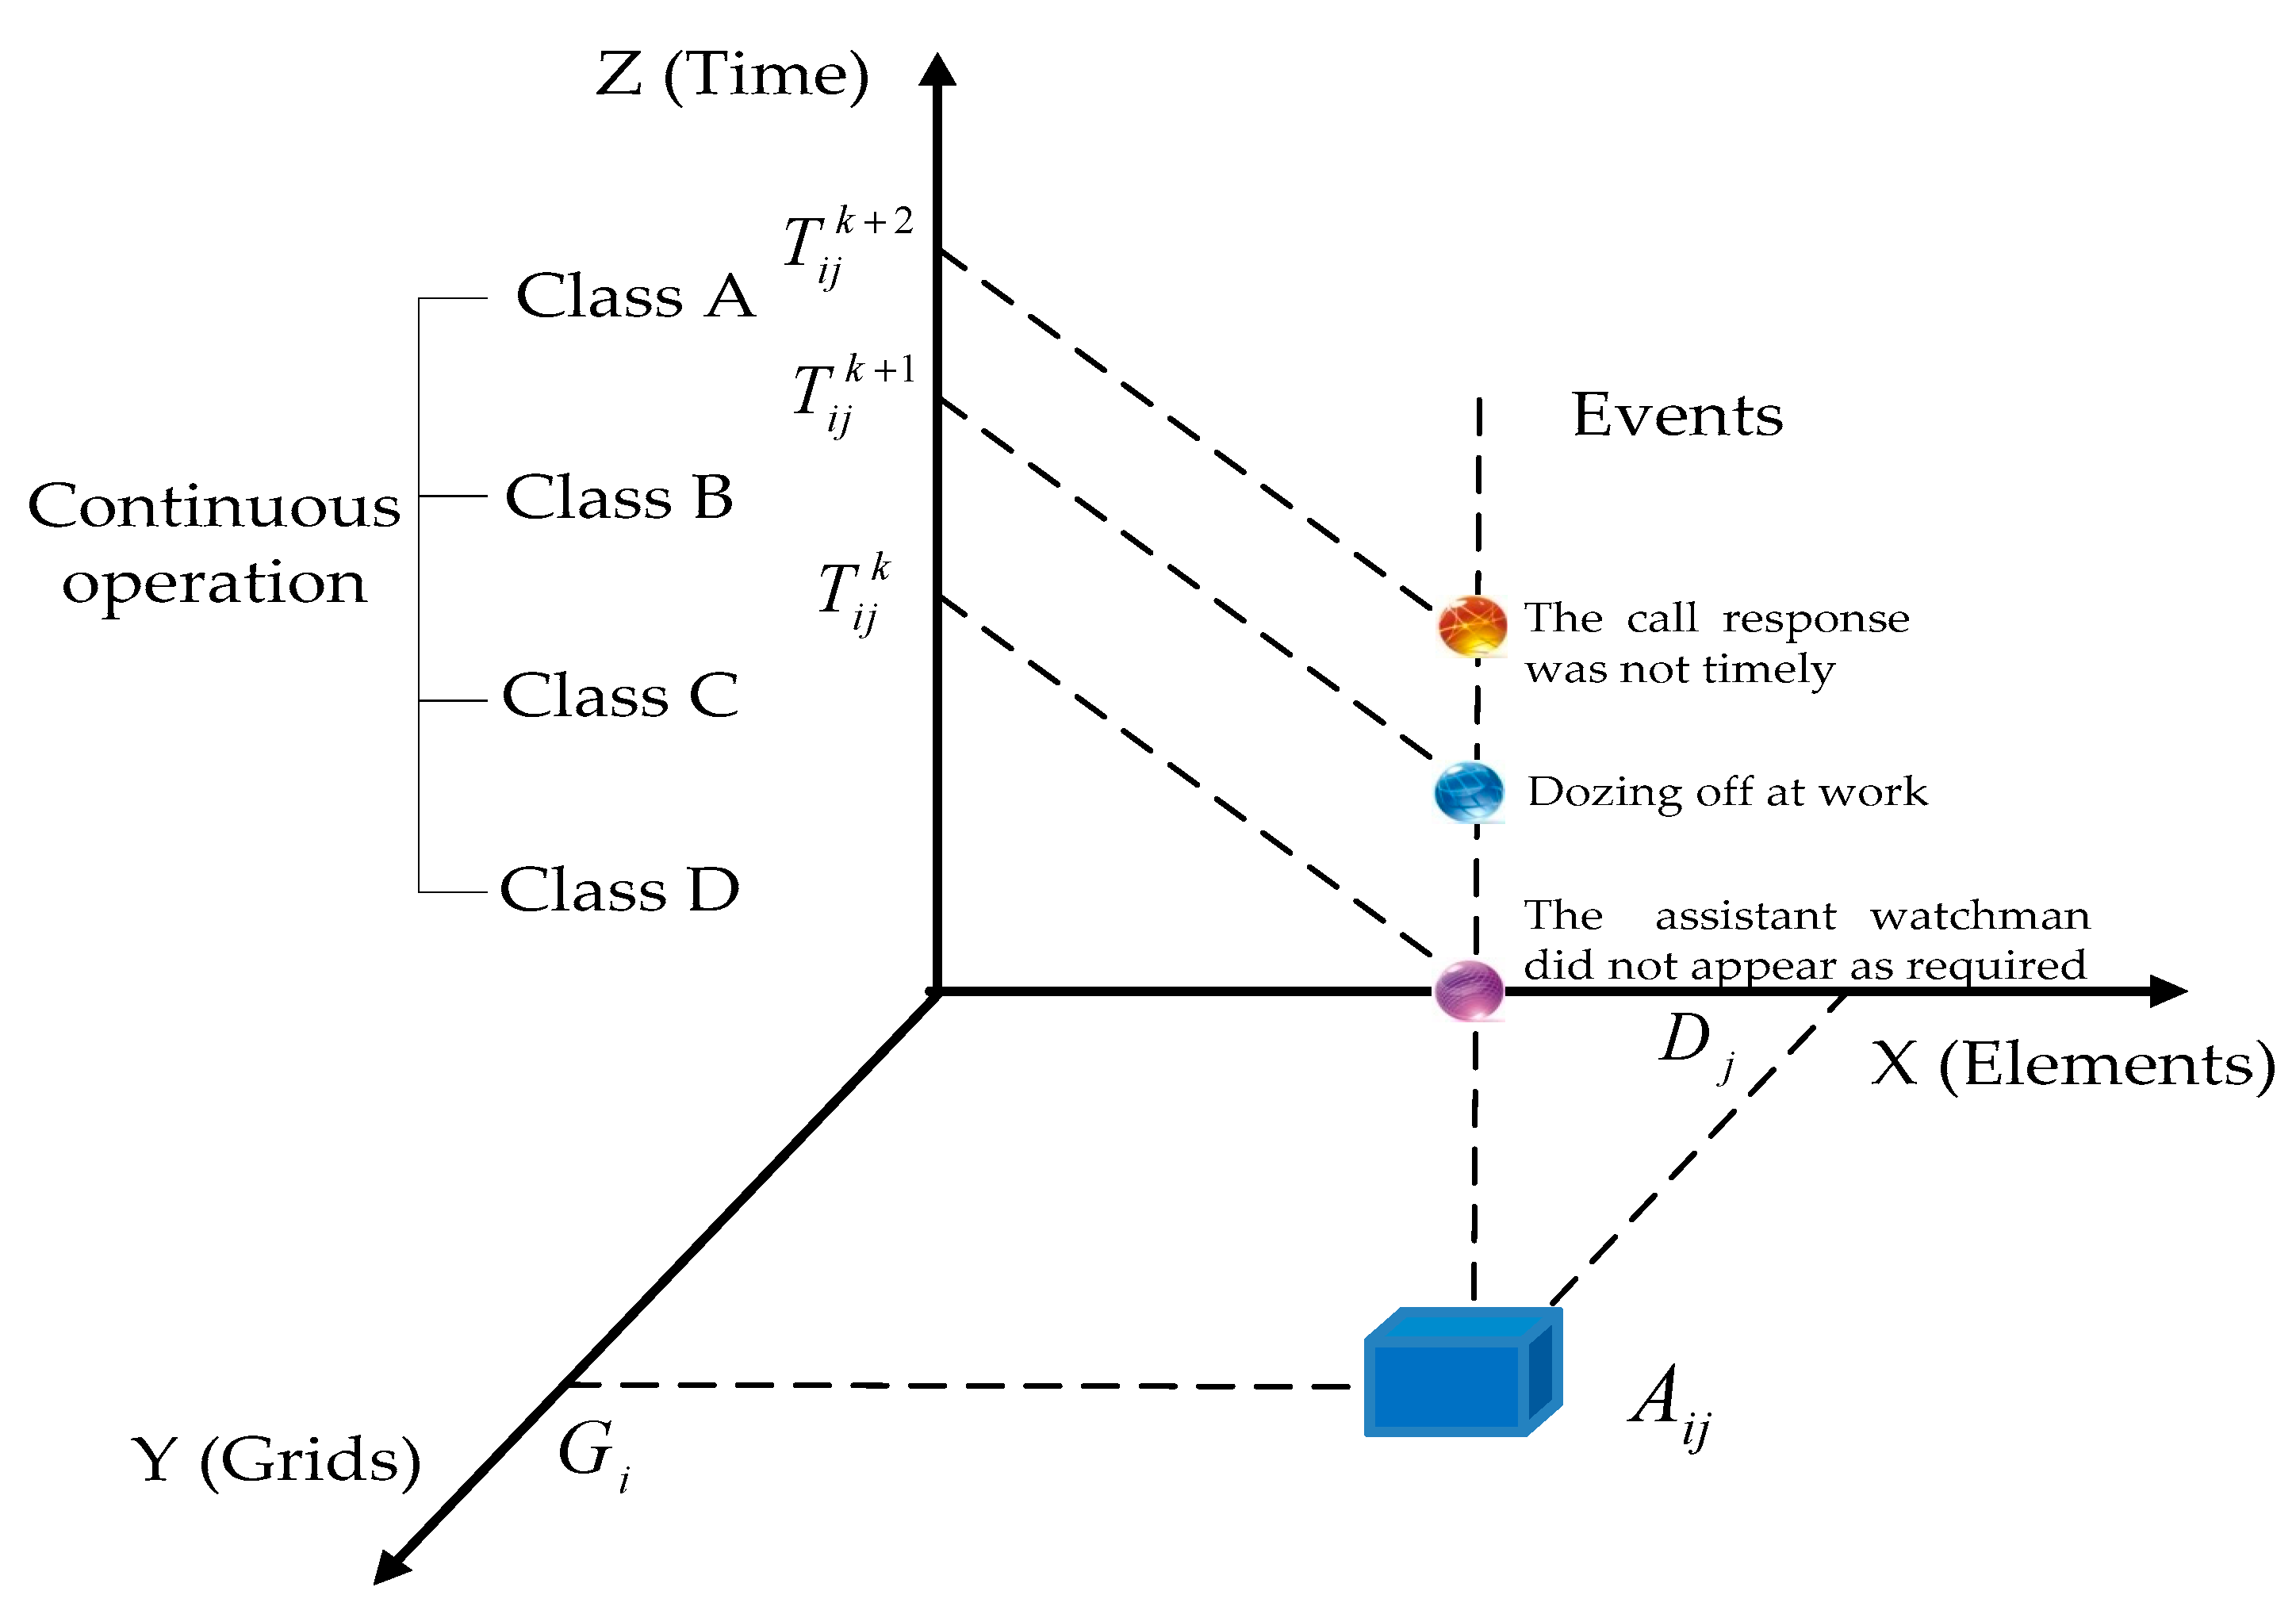
3.2. Grid Definition and Coding of the Train Operation Department

3.2.1. Grid Definition and Division Method

The railway traffic work is organized and implemented in the station, and the working scope of the staff is centered on the mileage coordinates of the station center and bounded by the mileage coordinates of the signal machines in and out of the station. Therefore, the grid of the train operation department refers to the discretization of the plane space of various types of work areas covered by the mileage range of station access signal, i.e., it is divided into a number of discrete and unequal “small areas” according to certain rules. The “small areas” can be regarded as a collection of working activities of several employees of a certain post; each “small area” is denoted as a grid cell G k , k = 1 , 2 , , K , where K is the total number of train operation department grid units.
Based on the angle of business scope and spatial position, the grid division of the train operation department should represent the operation scope of all kinds of employees based on the area of two-dimensional space, so as to realize the correlation between job operation and spatial position. Figure 2 shows the grid division diagram of ×× station in Shenshuo Railway, and Table 1 lists the corresponding attribute data; the station attendant and towerman work in the operation room, but they still belong to two different grids owing to different business boundaries.

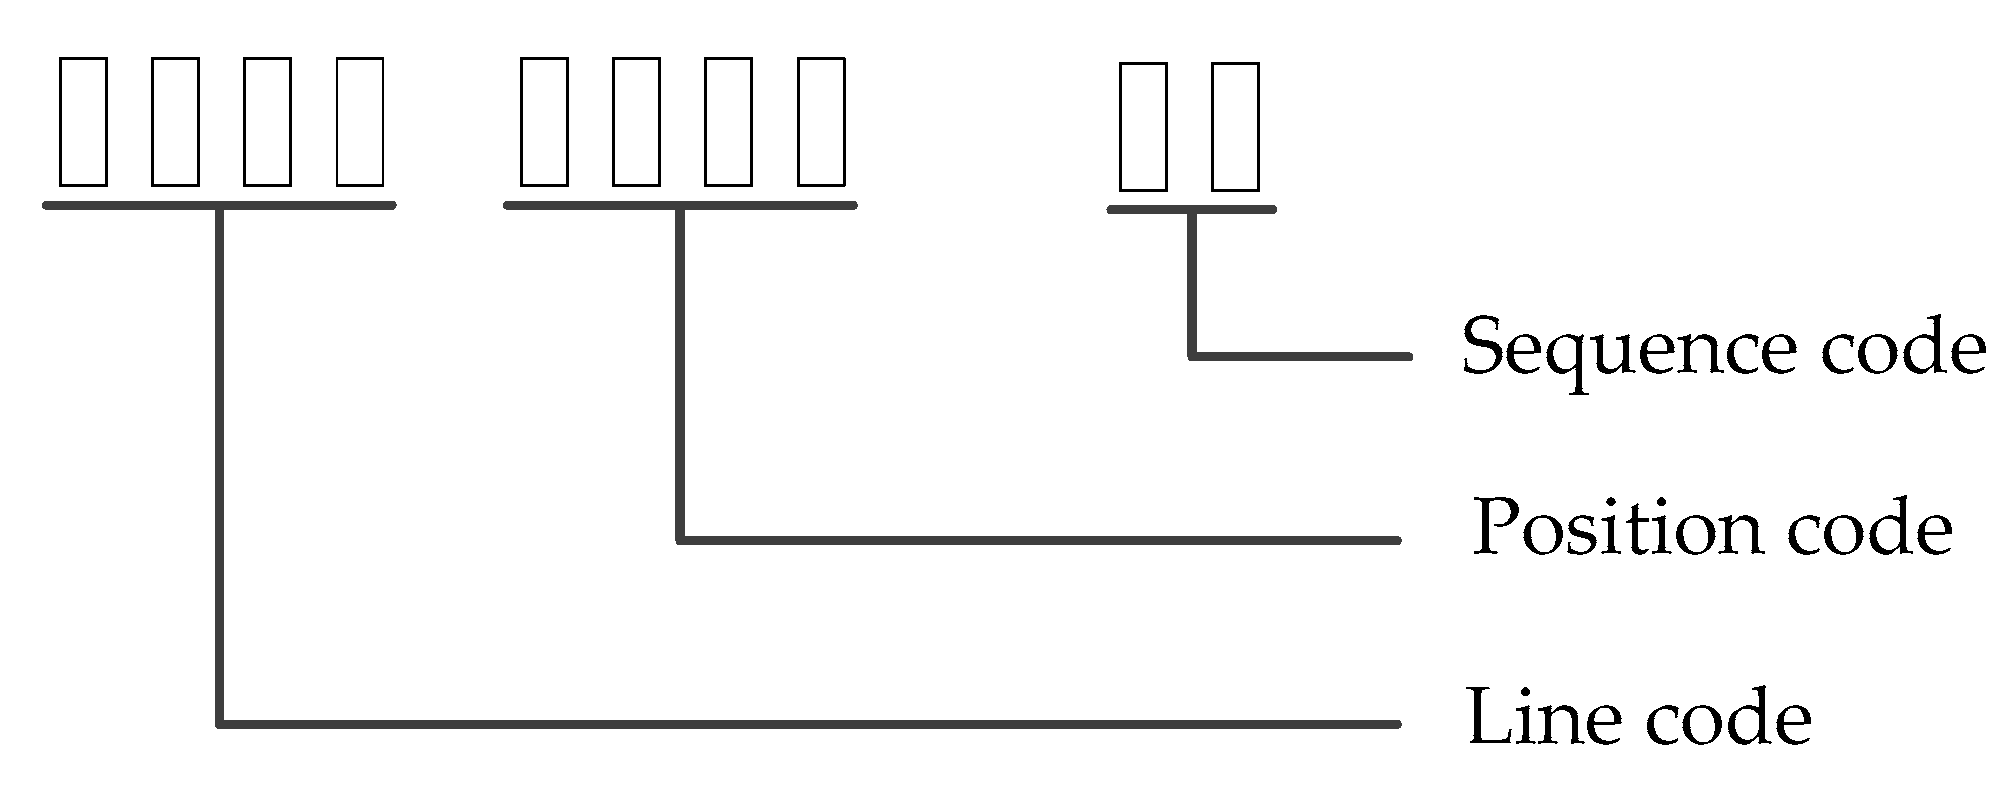
3.2.2. Grid Coding Rule

Grid coding is related to geospatial dimension information, and grid data should include spatial and attribute data. Each cell grid should have a unique identifier. The transportation system grid coding should include “line code + position code + sequence code”, where the line code is 4 bits, and the location code is expressed as the mileage of the station center in kilometers and is set to 4 digits according to the length of the line. The sequence code represents the sequence number of a grid in the station, which can be set as 2 digits. The sequence number starts from the direction of small mileage to the direction of large mileage in the station; thus, the grid code is set to 10 digits (Figure 3).

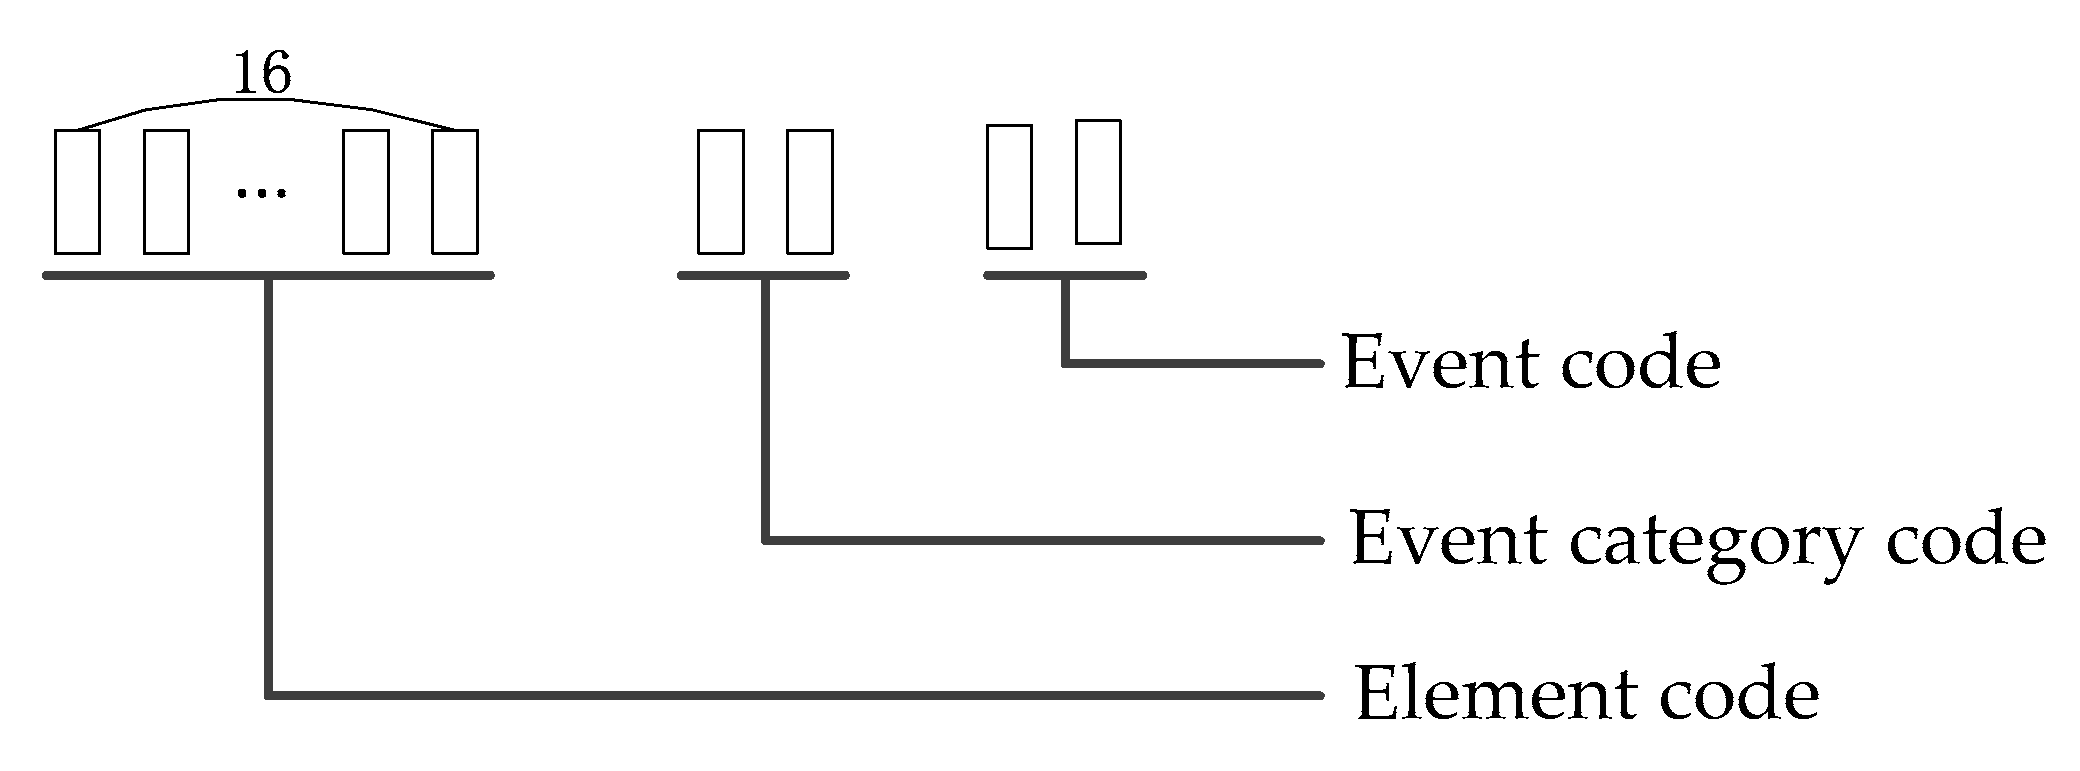
3.3. Definition and Coding of Grid Elements

Individual employee and equipment of the train operation department grid are collectively referred to as grid elements. This study focuses on “individual employee” as a special element, which is a special “equipment” attached to the grid to carry out various production activities; thus, we establish the correlation between the grid and its elements. In this study, the grid elements of the train operation department are divided into 13 categories (Table 2). Element encoding includes employee dimension information and geographic spatial dimension information. The employee dimension coding information is used to determine the type of work of the employee, and the geographic spatial dimension coding information is used to determine the location of the employee, which can be expressed by the corresponding grid coding. The combination of these elements can help achieve the unique identification of the employee; therefore, the code is designed as “grid code + employee type code + sequence code”. The job type code of an employee is set to 4 bits, and the sequence code represents the serial number of an employee in a certain grid, which is 2 bits; therefore, the overall code of grid elements is 16 bits (Figure 4).

3.4. Definition and Encoding of Grid Events

The safety behavior information generated by elements in a cell grid at a certain moment is called the event of grid elements. Events of grid elements comprise events with positive or negative impact, and events with negative impacts are known as risk events (this study focuses on risk events). The coded event should comprise two parts: event dimension information and element dimension information. The event dimension information can determine the category of the event, and the element dimension information should adopt the coding of the corresponding element of the event. Combined with the coding principle, the coding design is “element code + event category code + event code”. The event category code can be set as 2 bits, the event code can be set as 2 bits, and the event code is 20 bits in total, as shown in Figure 5.
In this study, risk events of the train operation department cell grid are divided into 12 typical categories; each category includes several sub-risk events (Table 3), and the standardization of hazard factors of the train operation department is the identification of hazard sources of these risk events.

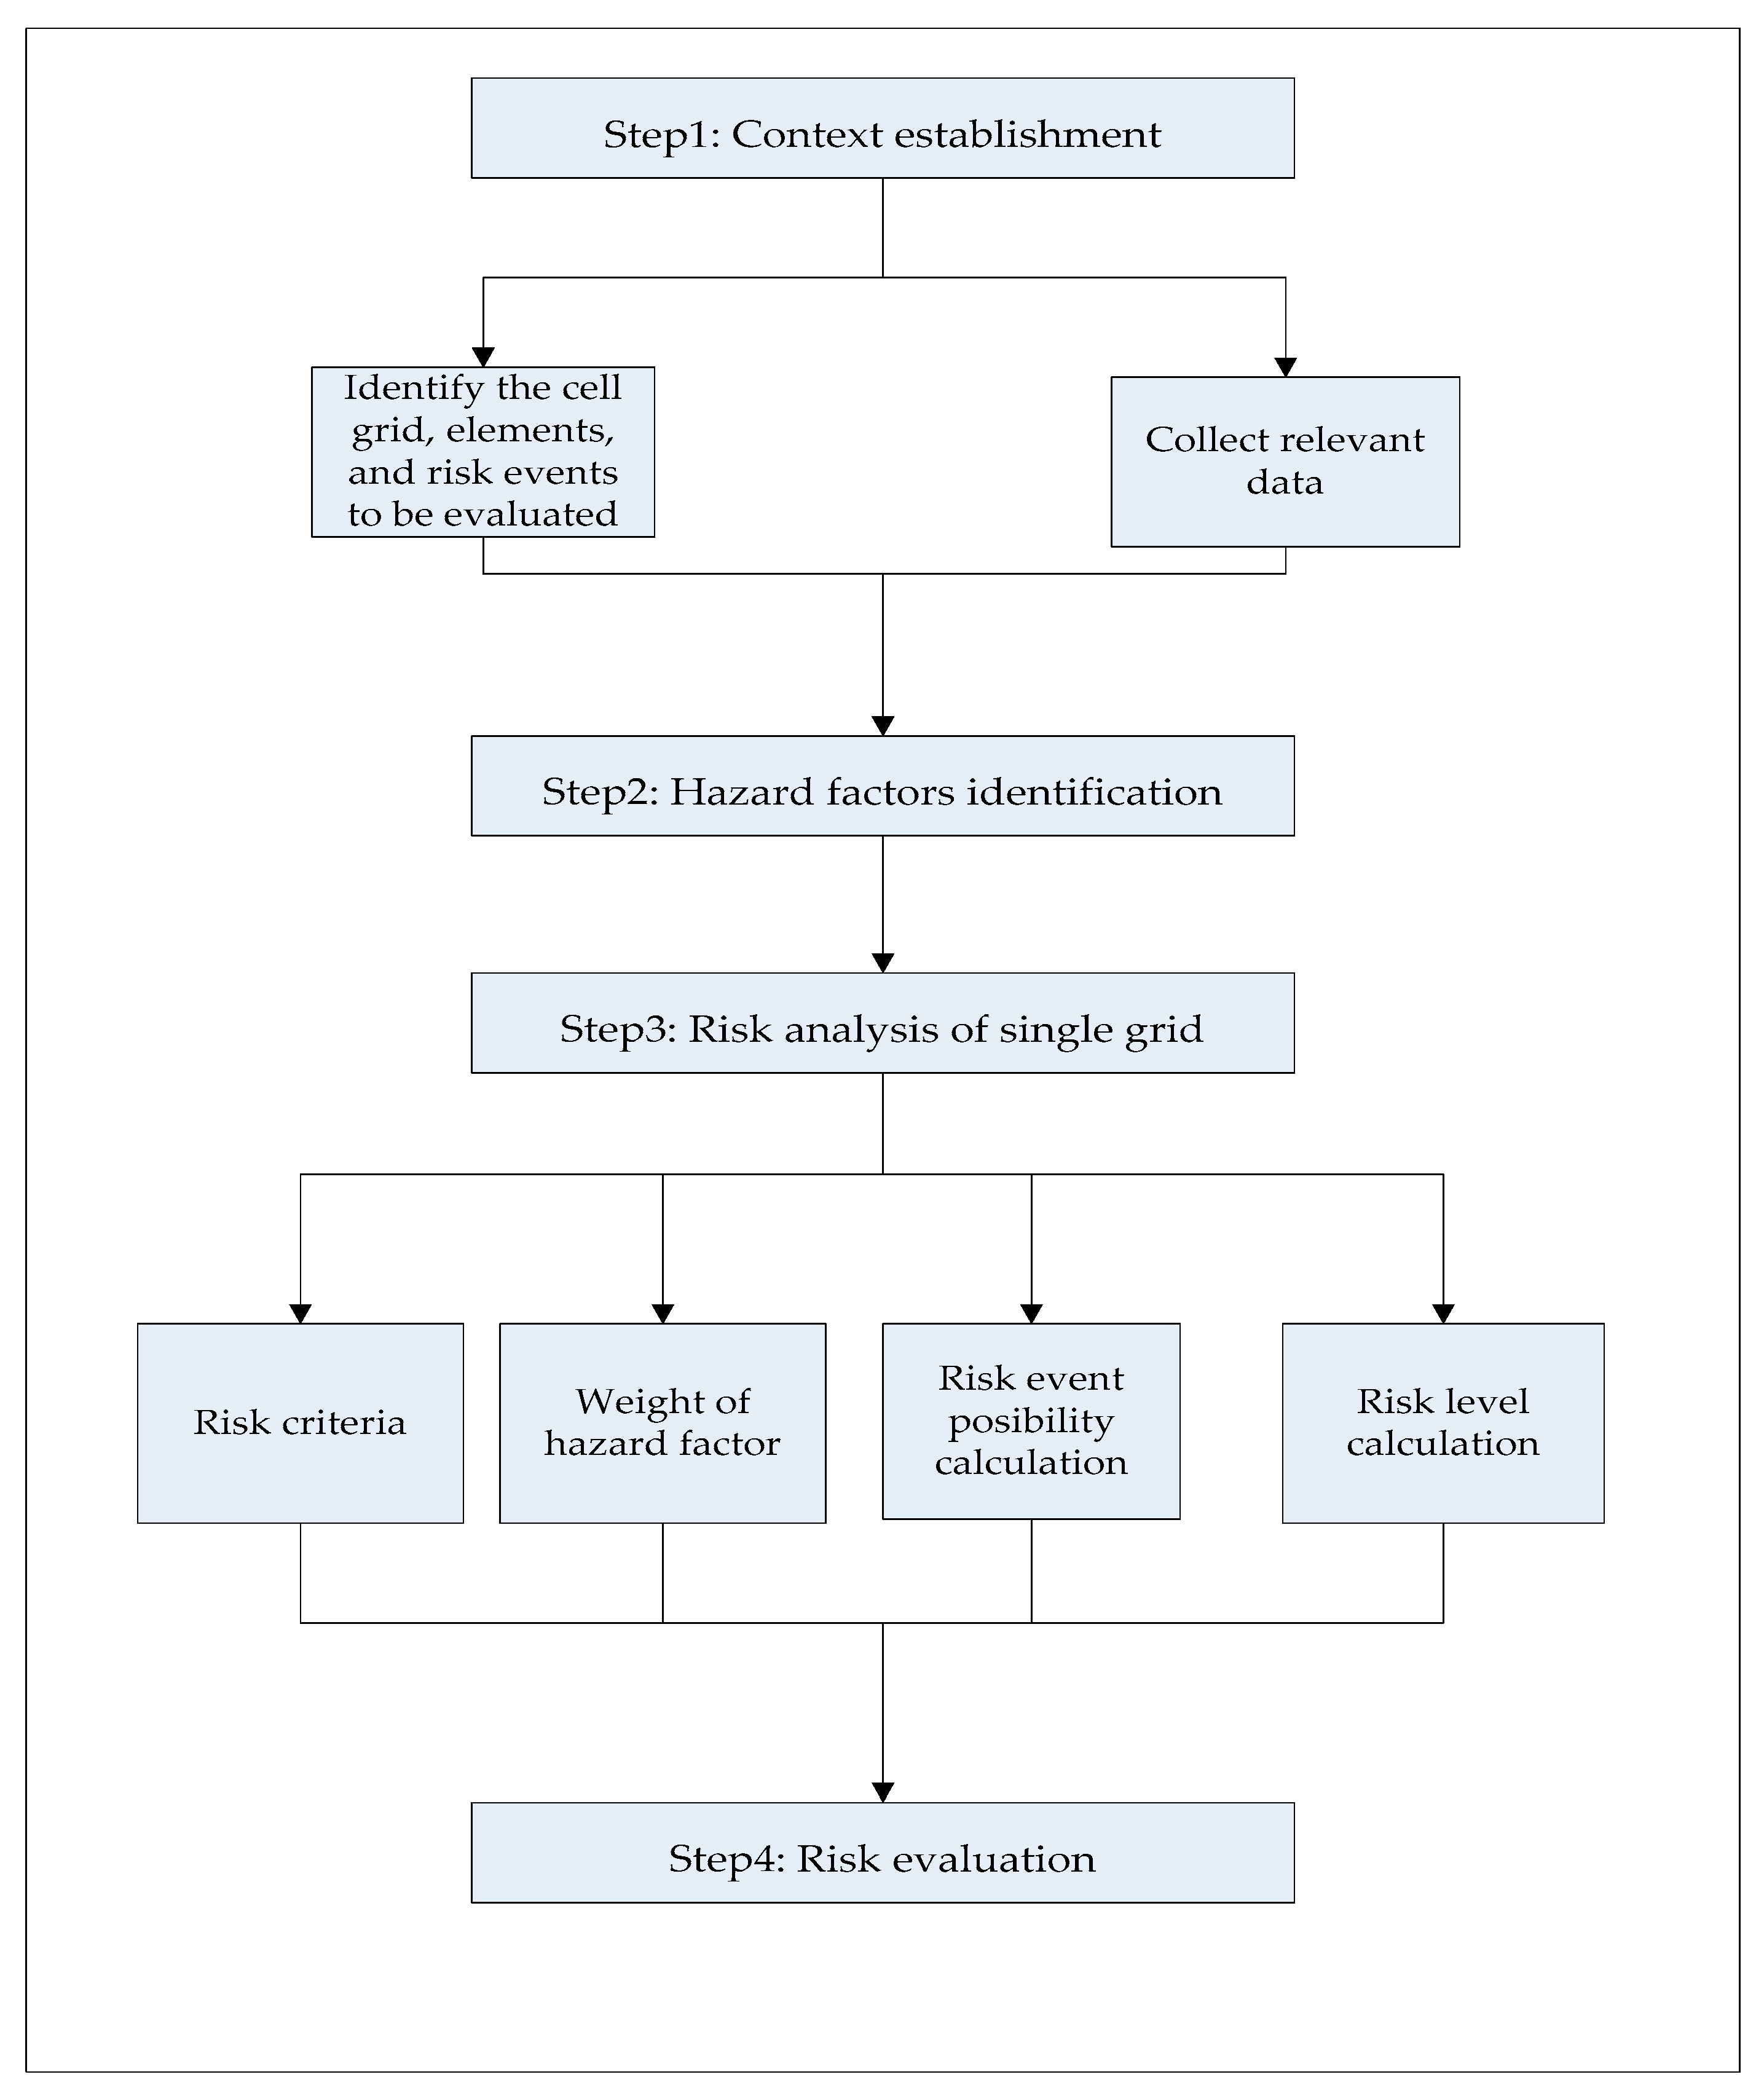
4. Risk Assessment Model

4.1. Model Architecture

Risk assessment includes three sub-processes: risk identification, risk analysis, and risk assessment [38]. Combined with the grid management, this study establishes the safety behavior risk assessment model of the train operation department, and the corresponding model architecture is shown in Figure 6.
Step 1: Establishment of the environment. The evaluated cell grid, elements, and possible risk events are determined, and relevant data are collected to lay a foundation to assess risk events of the elements in the grid.
Step 2: Risk event hazard factors classification and standardized assignment. Hazard factors of risk events in the evaluated cell grid are classified, and standardized identification is carried out for specific risk events. The risk event hazard factors in each grid are individually assigned using the assignment function to obtain the induced intensity value of the hazard factors.
Step 3: “Probability–severity” two-dimensional risk analysis. Under the condition of the known spatial and temporal distributions of each hazard factor in the cell grid, the induced intensity of the hazard factors of the risk event of an element in the cell grid is considered as the input variable, and the occurrence probability of the risk event is solved by combining the ANP method; the risk magnitude is calculated using the two-dimensional risk matrix.
Step 4: Risk assessment. The risk event magnitude of the grid element is compared with the established risk criteria to determine whether the risk magnitude is acceptable or tolerable.

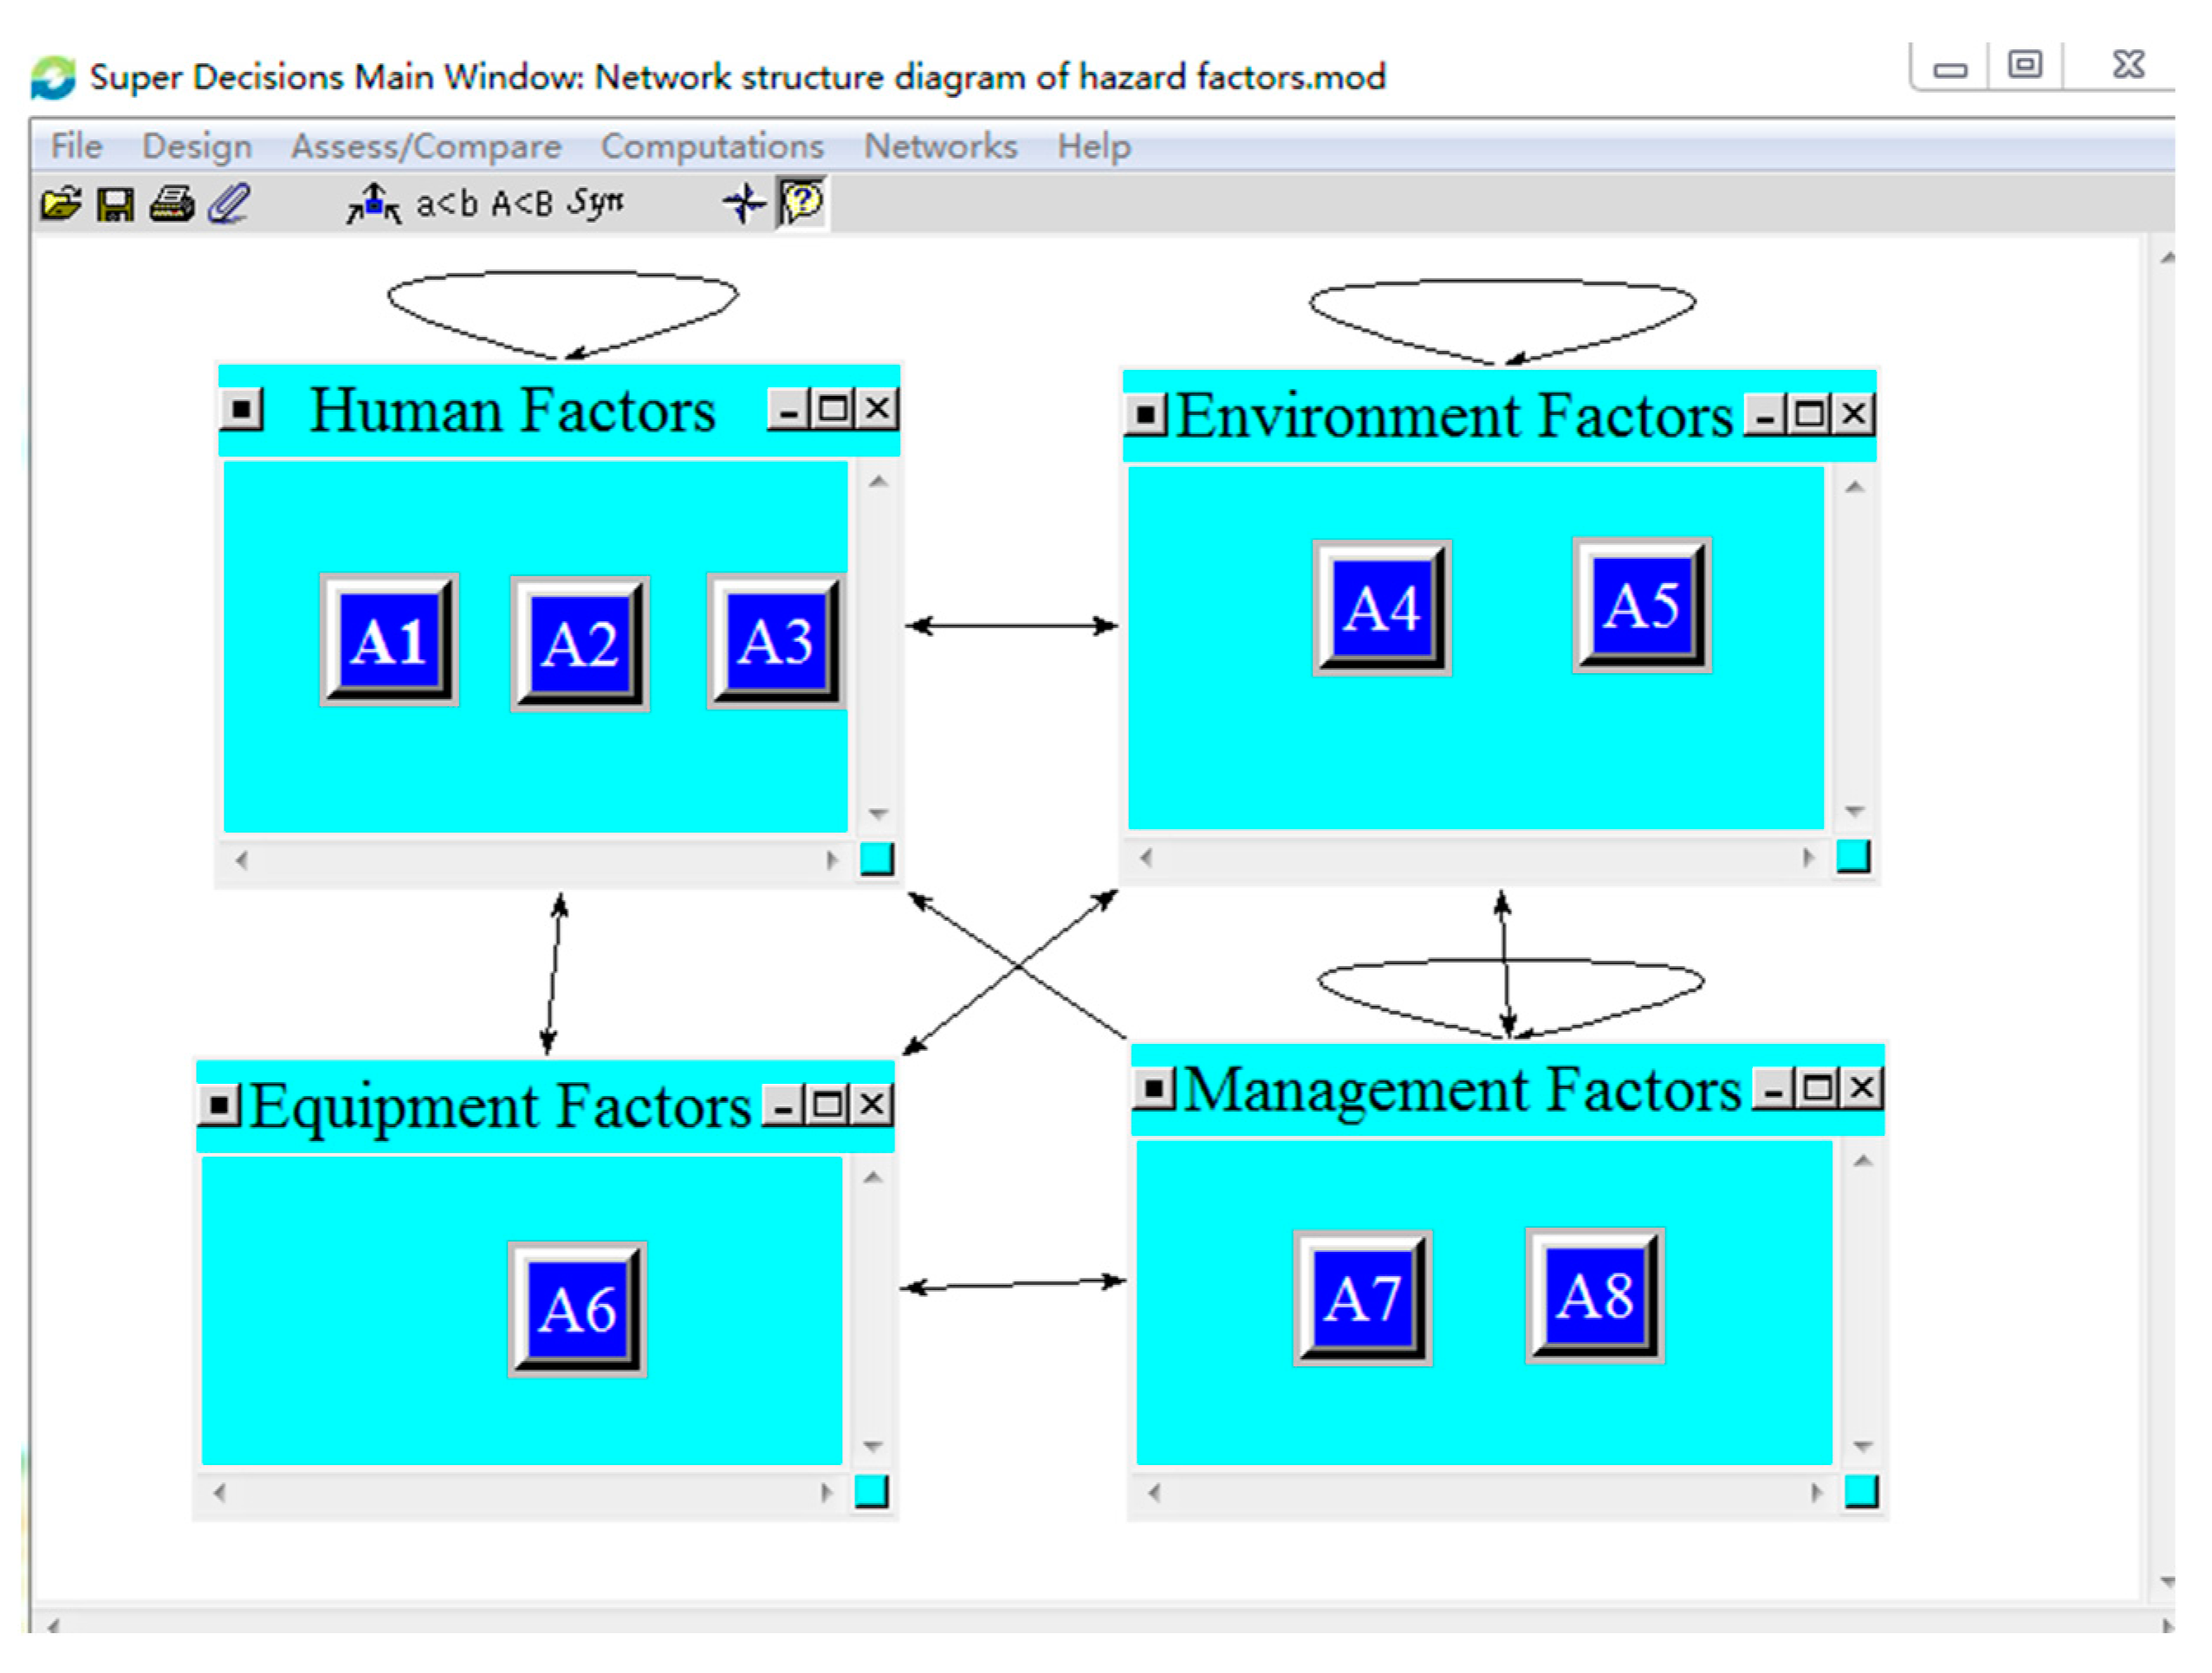
4.2. Identification of Hazard Factors

Train operation department is an open dynamic system that is widely distributed based on time and space. Some scholars have studied the hazard factor classification from the perspective of system [5,13,39,40]. Combined with the research of hazard factors in related fields and the “Classification and Code of Hazardous and Harmful Factors in Production Process” (GB/T 13861-2009), this study divides the hazard factors of grid elements’ risk event into four aspects: human, environment, equipment, and management. The identification of hazard factors for the safety behavior risk event of employees in the train operation department contains two points: The first point is to identify corresponding risk events. All risks are related to events, and events are carriers of risks. Therefore, in this study, the identification of hazard factors should be performed for the aforementioned 12 types of risk events. The other point is to analyze the specific space–time state. Risk possesses dynamic characteristics, and under the influence of internal and external environments, hazard factors in different time periods and different operation locations exhibit variations. The identification of hazard factors should be targeted at a specific space–time state.
According to the aforementioned principles, this study considers the sub-risk event “construction organization work was not in place” in the Huangyangcheng station of Shenshuo Railway as an example; the identification of hazard factors is listed in Table 4.

4.3. Risk Analysis of Single Grid

‘Risk matrix’ is defined by the International Organization for Standardization as a tool to display and sort risks by defining the range of consequences and possibilities, in which the parameter “possibilities” refers to the chance of something happening (the common frequency is used as its measurement) and the parameter “consequences” refers to the result of an event that affects the target [30]. Although the “probability–severity” two-dimensional risk matrix has been widely used in the railway field owing to its simple and practical advantages, it does not consider other attributes of risk, and the oversimplification of the matrix has been criticized by several experts [41,42]. On the one hand, the model will improve the existing probability assignment method of risk event. By applying a personalized assignment function to the induced intensity of hazard factors and combining with the ANP method to solve the weight of hazard factors, the probability calculation function of safety behavior risk events of grid elements can be established to accurately reflect the probability of risk events. On the other hand, the model will improve the severity assignment method of risk events. The occurrence of risk events may cause various consequences, e.g., casualties, property losses, and equipment damage, but this study only considers casualties. In the traditional two-dimensional risk matrix, from the perspective of the system, the severity of different risk events can be divided into multiple levels, but when a single determined risk event occurs, the severity of its consequence is unique. Therefore, in the process of risk analysis, this study considers a unique assignment to the consequence of a single risk event. Based on the analysis of model construction ideas, the model is expressed in Formula (2):
{ R T G = f ( P , S ) P = f ( Y 1 , Y 2 , , Y m , , Y M ) , j = 1 , 2 , , M S = constant ,
where R T G is the risk magnitude of an element’s risk event in grid G within time interval T ; P is the probability of the occurrence of a risk event; S is the severity of consequence of a risk event; Y m denotes state indicators related to the intensity of hazard factors induced by safety behavior risk event of the train operation department, and m indicates the number of status indicator.

4.3.1. Risk Assessment Criteria

(1) Probability rating criteria. According to the European standards, BS EN50126-1:1999 and BS EN50126-2:2007, the risk probability rating standard details are categorized and listed in Table 5.
(2) Severity of consequence rating criteria. According to the European Standard BS EN50126-2:2007, the classification of risk consequence classification standard is shown in Table 6, and the “casualty estimate” indicates the number of possible casualties.
(3) Risk acceptance criteria. The safety behavior risk acceptance criteria of the train operation department are formulated by referring to the “as low as reasonably practicable” (ALARP) criteria [43] (Table 7). This study adopts the “multiplication” relation to represent the “combination” relation between probability and severity; the minimum value is 1 and the maximum value is 25, and the product is divided into four grades according to experts’ advice.

4.3.2. Weight of the Hazard Factor

ANP, an extension of AHP, is aimed at the situation with dependence and feedback on the structure of decision-making problems. It obtains combination weight by establishing a super matrix so as to deal with the interdependence between elements, including the mutual influence between elements at the same level and whether there is dominance between elements at the lower and upper levels [44,45,46,47,48]. In the train operation department, as several hazard factors of risk events belong to different grids, interaction and feedback take place among these hazard factors, and they exhibit strong internal and external dependence. In this study, ANP is used to solve the relative weight of the hazard factors and is considered as the input of the probability of safety behavior risk events. The specific steps are as follows:
Step 1: Constructing ANP hierarchy. The network structure of ANP consists of two parts, the control layer and the network layer, as shown in Figure 7. In the control layer, there are control criteria, B 1 , B 2 , …, B n , which are the criteria of relative objectives, such as risk, benefit, opportunity, and cost. These criteria are independent of each other and are only governed by the target element. The network layer is composed of a hazard subset C that is controlled by the control layer, and its internal structure is the network structure which influences each other. This study considers the single safety behavior risk of the transportation system, and this criterion is the target of risk analysis. Therefore, the ANP hierarchy includes the network layer which comprises hazard factors governed by a single risk criterion and can be divided into multiple categories whose internal structure is the network structure which affects each other.
Step 2: Calculating the unweighted hypermatrix. Assume that the network layer of ANP includes a hazard subset C 1 , C 2 , …, C n , among which there are hazard factors e i 1 , e i 2 , …, e i n , and i = 1 , 2 , 3 , , N . Under the single risk criterion, considering the hazard factor e j l   ( l = 1 , 2 , 3 , , n j ) in C j as the secondary criterion, the elements in hazard factor subset C i are compared according to their influence on e j l ; i.e., a judgment matrix is constructed under the single risk criterion, and matrix W i j is obtained as expressed in Formula (3).
W i j = [ w i 1 j 1 , w i 1 j 2 , , w i 1 j n j w i 2 j 1 , w i 2 j 2 , , w i 2 j n j w i n i j 1 , w i n i j 2 , , w i n i j n j ]
If the elements in C j are unaffected by the elements in C i , then W i j = 0 . Repeat the above steps for i = 1 , 2 , 3 , , N ; j = 1 , 2 , 3 , , N to obtain the super matrix under a single risk criterion, as expressed in Formula (4):
W = ( W i j ) .
Step 3: Establishing the weighted super matrix W ¯ . W i j considers the ordering of hazard factors within the hazard factor subset to this criterion and does not consider the influence of other hazard subsets. Therefore, each column of the super matrix is not normalized. To accurately reflect the order, the effect of hazard subsets must be considered. Considering the whole hazard subset as an element, the relative importance of a certain hazard subset is compared under a single risk criterion, and the normalized weight vector ( a 1 j , a 2 j , , a N j ) T of the hazard subset under the sub-criterion is obtained, where a i j represents the influence weight of the i th hazard subset on the j th hazard subset, “0” implies no influence, and i = 1 N a i j = 1 ; the weighted super matrix is expressed in Formula (5).
W ¯ = ( W i j ¯ ) = a i j W i j .
Step 4: Calculating the limit hypermatrix W . The limit relative ordering vector W = lim k ( 1 / N ) k = 1 N W ¯ k for each hypermatrix is calculated. If the limit converges and is unique, the value of the corresponding row of the original matrix is the weight of each index. The weight value w i of each index can be obtained by this formula.

4.3.3. Probability of Risk Event

This study proposes the concept of risk-induced intensity for the first time and applied it to risk probability calculation. The induced intensity refers to the intensity of hazard factors that induce grid risk events in a specific spatiotemporal state. The function is expressed in Formula (6):
Y T G = y j ( a 1 , a 2 , , a m , , a M )
where Y T G implies that in time interval T , the induced intensity of hazard factor j of a certain risk event in the cell grid G is assigned. y j implies mapping between variables a m and Y T G . The construction of y j should conform to the actual situation of the transportation system, objectively reflect the intensity of the hazard factor j , and be easy to calculate without manual intervention. a m implies that within time interval T , a certain state index is related to the hazard factors of the grid element, e.g., professional level, educational level, and temperature. m represents the number of status indicators.
Based on the personalized assignment of the induced intensity of the hazard factor, combined with the weight of the hazard factor obtained using the ANP method, this study proposes an innovative assignment function of the probability of safety behavior risk events. The function is expressed in Equation (7),
P = i = 1 n Y T G i w i , i = 1 , 2 , , n ,
where w i is the weight coefficient, which satisfies Equation (8):
0 w i 1 , i = 1 n w i = 1 .

4.3.4. Risk Level Calculation

Based on the classification of risk probability and severity based on the semi-quantitative analysis method, this study adopts the “multiplication” relation to represent the “combination” relation between probability and severity (Equation (9)):
R T G = F C
where R T G denotes the risk event magnitude in cell grid G within time interval T, F denotes the probability magnitude of risk events, and C denotes the severity of consequence magnitude of risk events.

4.4. Risk Evaluation of Single Grid

Risk evaluation is the third subprocess of risk assessment, which compares the result of risk analysis with preset risk criteria to determine whether risk is acceptable or tolerable [30]. This stage determines whether a certain risk needs to be dealt with, the priority of dealing with the risk, and which approach to take. The risk-coping methods include risk avoidance, risk retention, risk mitigation, and risk sharing.

5. Case Study

The Huangyangcheng station is located in Shenmu City, Shaanxi Province (Figure 8). It is a second-class freight station of Shenshuo Railway. There are ten tracks in the station that handle the arrival, departure, and passage of trains and the decomposition of freight trains. The assistant watchman implements the working system of five shifts and four operations (the working cycle is 20 days, 12 days on duty and 8 days off duty), and each group of shifts has one assistant on duty at the north and south ends of the station; the assistant watchman is responsible for operations with regard to receipt and dispatch of trains, loading and removing iron shoes, and other jobs. The operation area of the station assistant watchman spans the whole station, which has a wider operation scope than other positions and is affected by various hazard factors. If the assistant attendant does not follow the standard operation, the train operation status cannot be monitored, which may lead to derailment and personal injury. In this study, the risk event of “the assistant watchman did not appear as required” that might happen in operation team A during the night inspection of the station master from 4:00 to 6:00 on 29 December 2018, was considered as an example. The grid code of this risk event was “00010044010003010201” (hereinafter referred to as “grid G H ”).

5.1. Data Preparation

5.1.1. Data Source

This study collected the safety production data of the Huangyangcheng station of Shenshuo Railway from January 2016 to December 2019, including safety management related data, such as three violations, education and training, equipment inspection and maintenance data, weather forecast information, etc. Due to space limitations, some data of hazard factors are listed in Table 8.

5.1.2. Experts Selection

Owing to the uncertainty of the safety behavior risk of the train operation department, it was difficult to collect the data of a few hazard factors; therefore, it was necessary to combine the experience of field experts to assign values. This study selected five experts of Shenshuo Railway to support the experts’ assignment involved in the calculation process. The basic details about the experts are listed in Table 9.

5.2. Hazard Factor Identification of “the Assistant Watchman Did Not Appear as Required” Scenario

The personalized identification of hazard factors in grid G H were categorized (Table 10).

5.3. Risk Analysis of “the Assistant Watchman Did Not Appear as Required” Scenario

5.3.1. Probability Calculation

(1) Induced intensity calculation. Hazard factor data were collected through the field survey, and relevant hazard factor data were included in grid G H . The uncollected data was obtained through expert advice, and the hazard factor assignment function was used to solve the induced intensity of the hazard factor (Table 11).
(2) Weight calculation. Super decisions was used to develop the ANP hierarchy (Figure 9), and the value of the limit matrix, namely, the weight value of the hazard factor, was obtained using the method described in Section 4.3.2; the weight value (limiting) was listed in Table 12.
(3) Probability calculation. According to Formula (7), the probability of “the assistant watchman did not appear as required” scenario was 0.0066. According to the probability rating standard, the probability grade was 3, and the language description was “Infrequent”.

5.3.2. Severity Calculation

According to the safety behavior risk event consequence grade evaluation standard of the train operation department, experts on the spot thought the risk event of “the assistant watchman did not appear as required” scenario in grid G H rarely could cause casualties. Therefore, the severity level of “the assistant watchman did not appear as required” scenario in grid G H was determined as “Marginal”, and the semantic scale was assigned with the value of 2.

5.3.3. Risk Magnitude Calculation

According to Equation (9), “the assistant watchman did not appear as required” event risk size was 6, and the risk level was “Negligible”. At the same time, the magnitude of the risk event of other grid elements involved in the posting of assistant duty attendant of the Huangyangcheng station in the latest operation cycle (five shifts and four operations; working cycle is 20 days, 12 days on duty and 8 days off duty) was solved; the results are listed in Table 13. In this study, a total of ten assistant attendants are involved in the risk event of “the assistant watchman did not appear as required”. The risk magnitude is determined by the probability and severity of consequences, among which, the magnitude of consequences is determined. According to the probability calculation formula, the weight of the hazard factor has been solved. Therefore, the magnitude of the risk event of the other nine assistants on duty can be calculated only by obtaining the induced intensity value. Due to the different safety conditions of each assistant watchman, the assignment of induced intensity is different. Due to space limitation, this study does not provide specific assignment process of other nine grid elements, please refer to the assignment process in Table 11.
In the same operation cycle, there were obvious individual differences in the risk magnitude of different elements of the same cell grid for the risk event of “the assistant watchman did not appear as required” scenario, which reflected the advantages of the personalized risk assessment in cell grid.

6. Discussion

6.1. Traditional Two-Dimensional Risk Assessment Results

The traditional “probability–severity” two-dimensional risk matrix is usually used to solve the magnitude of risk events on the whole by using the statistical data of the hidden dangers of unsafe behaviors of all employees. The combination of probability and severity adopts the multiplication algorithm. During 2016–2018, 14 risk incidents of “the assistant watchman did not appear as required” occurred in Huangyangcheng station (Table 14). Combined with the suggestions of field experts, the traditional “probability–severity” two-dimensional risk matrix was used to assign the probability magnitude as “Regular”, corresponding to the semantic scale of 5, and the severity magnitude as “Marginal”, corresponding to the semantic scale of 2. The principle of multiplication was adopted, and the risk magnitude of “the assistant watchman did not appear as required” scenario was 10, which belonged to “Tolerable”. Managers need to take reasonable control measures to ensure that risks are under control.
We could find that the traditional risk matrix had some shortcomings: first, it was easily affected by the quality, quantity, and integrity of information used to directly solve the risk parameters using historical accident statistics, which makes it difficult to obtain accurate evaluation effect by quantitative analysis technology. Second, the systematic risk analysis result could not truly reflect the safety behavior risk level of each employee in this type of work owing to individual differences and the influence of temporal and spatial characteristics. In addition, while considering countermeasures, the station was required to take unified rectification measures for the ten assistant duty attendants until the risk level could not be reduced, which increased the cost of risk response and caused a waste of resources to some extent.
To address the above deficiencies, the grid method was used to classify and locate the “key person, key event, and key period” of the train transportation site, and the modeling analysis was conducted for the individual employees. At the same time, a large amount of hazard factor data that directly induced risk events was integrated into the risk assessment process, which overcame the impact on the accuracy of the risk assessment caused by the traditional accident and hidden trouble data missing or less data collection.

6.2. Improved Two-Dimensional Risk Matrix Assessment Results Analysis

Different from the traditional two-dimensional risk matrix, the improved two-dimensional risk assessment based on the grid was more personalized and accurate and could accurately reflect the risk magnitude of different grid elements (Table 13); e.g., according to the short board theory of modern management, only key control measures were required for grids 00010044010003030201, 00010044010003060201, and 00010044010003080201, while the traditional “probability–severity” two-dimensional matrix carried out risk assessment for ten elements of grid G H . Owing to the limitation of historical data, the assessment results lack accuracy and personalization, and the assessment results were one level higher than the risk level of the two-dimensional risk assessment model, resulting in a substantial increase in the cost of risk response. The two-dimensional risk assessment model based on the grid exhibits more advantages.

7. Conclusions

Considering the deficiency of traditional two-dimensional risk matrix, which takes the system as a whole and uses accident potential data to calculate the risk magnitude, this study proposes a safety behavior risk assessment model based on the grid management and hazard factor assignment function to improve the traditional two-dimensional risk matrix. First, the grid management method is introduced, introducing the definition and coding of the grid, grid elements and grid events. Second, the traditional two-dimensional risk matrix is improved by innovating the risk parameter assignment method and solving the hazard factor weight by ANP. Finally, the methodology is applied to the risk event assessment of “the assistant watchman did not appear as required” scenario in the Huangyangcheng station of Shenshuo Railway. The evaluation results show that the risk magnitude of different grid elements has a personalized difference, and only key control measures were required for grids 00010044010003030201, 00010044010003060201, and 00010044010003080201, while the traditional “probability–severity” two-dimensional matrix carried out risk assessment for ten elements of grid G H .
The following conclusions were made in this study. The single-grid safety behavior risk assessment model can consider the dynamic coupling change characteristics of the risk event hazard factors of single elements in each grid under different spatiotemporal frames. By introducing spatial location variables, the grid management method accurately locates and classifies the site staff and organizes the disorder and lack of associated risk data with regard to time and space. With a focus on the hazard factor, the induced intensity is proposed for the first time and considered as the input of probability calculation to innovate the traditional “probability–severity” risk matrix.
Although this study improves the traditional two-dimensional risk matrix of employee safety behavior, the following studies should be paid more attention in future: First, based on the key role of hazard factors in the risk assessment process, a hazard factor data platform will be developed to realize the automatic collection, analysis, and processing of hazard factors, so as to provide powerful data to support the risk assessment of train operation department safety behavior. Second, the characteristics of heterogeneity, uncertainty, and coupling indicate that hazard factors exhibit dynamic changes with time and space. It is necessary to further strengthen the in-depth study on the coupling feedback relationship of hazard factors so as to enhance the staff safety behavior risk dissemination law control.

Author Contributions

Methodology, H.Z.; software, H.Z.; writing—original draft preparation, H.Z.; writing—review and editing, C.Q.; calculation, M.M. All authors have read and agreed to the published version of the manuscript.

Funding

This research received no external funding.

Data Availability Statement

Not applicable.

Acknowledgments

The authors are greatly thankful to the reviewers and editor for their precious advice to improve the quality of the thesis.

Conflicts of Interest

The authors declare no conflict of interest.

References

  1. Zhou, J.; Lei, Y. Paths between latent and active errors: Analysis of 407 railway accidents/incidents’ causes in China. Saf. Sci. 2018, 110, 47–58. [Google Scholar] [CrossRef]
  2. Kyriakidis, M.; Majumdar, A.; Ochieng, W.Y. Data based framework to identify the most significant performance shaping factors in railway operations. Saf. Sci. 2015, 78, 60–76. [Google Scholar] [CrossRef]
  3. Yin, W.; Fu, G.; Yang, C.; Jiang, Z.; Zhu, K.; Gao, Y. Fatal gas explosion accidents on Chinese coal mines and the characteristics of unsafe behaviors: 2000–2014. Saf. Sci. 2017, 92, 173–179. [Google Scholar] [CrossRef]
  4. Zhan, Q.; Zheng, W.; Zhao, B. A hybrid human and organizational analysis method for railway accidents based on HFACS-Railway Accidents (HFACS-RAs). Saf. Sci. 2017, 91, 232–250. [Google Scholar] [CrossRef]
  5. Baysari, M.T.; McIntosh, A.S.; Wilson, J.R. Understanding the human factors contribution to railway accidents and incidents in Australia. Accid. Anal. Prev. 2008, 40, 1750–1757. [Google Scholar] [CrossRef] [PubMed]
  6. Uğurlu, Ö.; Yıldız, S.; Loughney, S.; Wang, J. Modified human factor analysis and classification system for passenger vessel accidents (HFACS-PV). Ocean Eng. 2018, 161, 47–61. [Google Scholar] [CrossRef] [Green Version]
  7. Xing, Y.; Dissanayake, S.; Lu, J.; Long, S.; Lou, Y. An analysis of escalator-related injuries in metro stations in China, 2013–2015. Accid. Anal. Prev. 2017, 122, 332–341. [Google Scholar] [CrossRef]
  8. Liu, R.; Cheng, W.; Yu, Y.; Xu, Q.; Jiang, A.; Lv, T. An impacting factors analysis of miners’ unsafe acts based on HFACS-CM and SEM. Process Saf. Environ. Prot. 2019, 122, 221–231. [Google Scholar] [CrossRef]
  9. Tan, S.; Moinuddin, K. Systematic review of human and organizational risks for probabilistic risk analysis in high-rise buildings. Reliab. Eng. Syst. Saf. 2019, 188, 233–250. [Google Scholar] [CrossRef]
  10. Al-Sakkaf, A.; Ahmed, R.; Afifi, M. Risk Assessment Model for Heritage Buildings: Case Study of Yemen. J. Archit. Eng. 2020, 27, 04021009. [Google Scholar] [CrossRef]
  11. Huang, W.; Yin, D.; Xu, Y.; Zhang, R.; Xu, M. Using N-K Model to quantitatively calculate the variability in Functional Resonance Analysis Method. Reliab. Eng. Syst. Saf. 2022, 217, 108058. [Google Scholar] [CrossRef]
  12. Huang, W.; Shuai, B.; Sun, Y. Study on Coupling Risk Formation Mechanism of Railway Dangerous Goods Transportation System Based on N-K Model. Tiedao Xuebao J. China Railw. Soc. 2019, 41, 1–9. [Google Scholar]
  13. Kyriakidis, M.; Majumdar, A.; Ochieng, W.Y. The human performance railway operational index—A novel approach to assess human performance for railway operations. Reliab. Eng. Syst. Saf. 2018, 170, 226–243. [Google Scholar] [CrossRef]
  14. Lei, B.; Sun, Q.; Liu, R.; Wang, F.; Wang, F. A Segment-Based Model for Estimating the Service Life of Railway Rails. In Proceedings of the Cota International Conference of Transportation Professionals, Beijing, China, 25–27 July 2015. [Google Scholar]
  15. Liu, R.; Lei, B.; Wang, F.; Sun, Q.; Wang, F. Grid: A New Theory for High-Speed Railway Infrastructure Management. In Proceedings of the Transportation Research Board 94th Annual Meeting, Washington, DC, USA, 11–15 January 2015. [Google Scholar]
  16. Lei, B.; Zhang, Q.; Liu, R.; Wang, F.; Song, X. Grid-Based Framework for Railway Track Health Evaluation. In Proceedings of the International Conference on Green Intelligent Transportation System and Safety, Guilin, China, 1–3 July 2018. [Google Scholar]
  17. Lei, B.; Rengkui, L.; Feng, W.; Sun, Q. Estimating railway rail service life: A rail-grid-based approach. Transp. Res. Part A Policy Pract. 2017, 105, 54–65. [Google Scholar]
  18. Fan, X. Research and Thinking on Grid Service and Management of Community in City S. Procedia Eng. 2017, 174, 1177–1181. [Google Scholar] [CrossRef]
  19. Ghofrani, F.; He, Q.; Goverde, R.; Liu, X. Recent applications of big data analytics in railway transportation systems: A survey. Transp. Res. Part C Emerg. Technol. 2018, 90, 226–246. [Google Scholar] [CrossRef]
  20. Liu, P.; Yang, L.; Gao, Z.; Li, S.; Gao, Y. Fault tree analysis combined with quantitative analysis for high-speed railway accidents. Saf. Sci. 2015, 79, 344–357. [Google Scholar] [CrossRef]
  21. Huang, W.; Liu, Y.; Zhang, Y.; Xu, M.; Dieu, G.J.; Antwi, E. Fault Tree and Fuzzy D-S Evidential Reasoning combined approach: An application in railway dangerous goods transportation system accident analysis. Inf. Sci. 2020, 520, 117–129. [Google Scholar] [CrossRef]
  22. Huang, W.; Zhang, Y.; Zuo, B.; Yu, Y.; Dieu, G.J.; Xu, Y. Using an expanded Safety Failure Event Network to analyze railway dangerous goods transportation system risk-accident. J. Loss Prev. Process Ind. 2020, 65, 104122. [Google Scholar] [CrossRef]
  23. Ćirović, G.; Pamučar, D. Decision support model for prioritizing railway level crossings for safety improvements: Application of the adaptive neuro-fuzzy system. Expert. Syst. Appl. 2013, 40, 2208–2223. [Google Scholar] [CrossRef]
  24. Klockner, K.; Toft, Y. Railway accidents and incidents: Complex socio-technical system accident modelling comes of age. Saf. Sci. 2018, 110, 59–66. [Google Scholar] [CrossRef]
  25. Zhu, Y.; He, G.; Zhu, X.; Qiao, G.; Zhang, G.; Heng, L. Research on Factors Affecting Employees Security Behavior Based on Structural Equation Model. Int. J. Secur. Appl. 2015, 9, 375–384. [Google Scholar] [CrossRef]
  26. Hsieh, M.; Wang, E.M.; Lee, W.; Li, L.; Hsieh, C.; Tsai, W.; Wang, C.; Huang, J.; Liu, T. Application of HFACS, fuzzy TOPSIS, and AHP for identifying important human error factors in emergency departments in Taiwan. Int. J. Ind. Ergon. 2018, 67, 171–179. [Google Scholar] [CrossRef]
  27. Qiao, W.; Liu, Q.; Li, X.; Luo, X.; Wan, Y. Using data mining techniques to analyze the influencing factor of unsafe behaviors in Chinese underground coal mines. Resour. Policy 2018, 59, 210–216. [Google Scholar] [CrossRef]
  28. Chai, N.; Zhou, W. Evaluating operational risk for train control system using A Revised Risk Matrix and FD-FAHP-Cloud model: A case in China. Eng. Fail. Anal. 2022, 137, 106268. [Google Scholar] [CrossRef]
  29. Fejdyś, M.; Wlazeł, S.; Kusiak, E.; Kaczmarek, K.; Nepelski, M.; Lubiewski, P.; Kuczyńska, E.; Jakubczyk, R.; Kamiński, G.; Foryś, Ł.; et al. Mathematical Algorithm for Risk Assessment of Police Officer in VR Training Simulation. Appl. Sci. 2022, 12, 2169. [Google Scholar] [CrossRef]
  30. ISO Guide 73:2009; Risk Management—Vocabulary. ISO: Geneva, Switzerland, 2009.
  31. Li, G. A study on the engineering geological coupling theory. J. Eng. Geol. 2001, 9, 435–442. [Google Scholar]
  32. Xue, Y.; Liu, Y.; Zhang, T. Research on formation mechanism of coupled disaster risk. J. Nat. Dis. 2013, 22, 44–50. [Google Scholar]
  33. Zhang, Y. Selecting risk response strategies considering project risk interdependence. Int. J. Proj. Manag. 2016, 34, 819–830. [Google Scholar] [CrossRef] [Green Version]
  34. Fregnan, E.; Baum, T.; Palomba, F.; Bacchelli, A. A survey on software coupling relations and tools. Inf. Softw. Technol. 2019, 107, 159–178. [Google Scholar] [CrossRef] [Green Version]
  35. Jiang, S.; Fan, H. Credit risk contagion coupling with sentiment contagion. Phys. A 2018, 512, 186–202. [Google Scholar] [CrossRef]
  36. He, H.; Dou, L.; Gong, S.; He, J.; Zheng, Y.; Zhang, X. Microseismic and electromagnetic coupling method for coal bump risk assessment based on dynamic static energy principles. Saf. Sci. 2019, 114, 30–39. [Google Scholar] [CrossRef]
  37. Zhang, H.; Sun, Q. Risk Assessment of Shunting Derailment Based on Coupling. Symmetry 2019, 11, 1359. [Google Scholar] [CrossRef] [Green Version]
  38. IEC 31010-2009; Risk Management–Risk Assessment Techniques. ISO: Geneva, Switzerland, 2009.
  39. Huang, W.; Shuai, B.; Zhang, G. Improved WBS-RBS based identification of risks in railway transportation of dangerous goods. China Saf. Sci. J. 2018, 28, 93. [Google Scholar]
  40. Huang, W.; Shuai, B.; Zuo, B.; Xu, Y.; Antwi, E. A systematic railway dangerous goods transportation system risk analysis approach: The 24 model. J. Loss Prev. Process Ind. 2019, 61, 94–103. [Google Scholar] [CrossRef]
  41. Williams, T.M. The two-dimensionality of project risk. Int. J. Proj. Manag. 1996, 14, 185–186. [Google Scholar] [CrossRef]
  42. Hong, Y.; Pasman, H.J.; Quddus, N.; Mannan, M. Supporting risk management decision making by converting linguistic graded qualitative risk matrices through Interval Type-2 Fuzzy Sets. Process Saf. Environ. Prot. 2019, 134, 308–322. [Google Scholar] [CrossRef]
  43. Abrahamsen, E.B.; Abrahamsen, H.B.; Milazzo, M.F.; Selvik, J.T. Using the ALARP principle for safety management in the energy production sector of chemical industry. Reliab. Eng. Syst. Saf. 2018, 169, 160–165. [Google Scholar] [CrossRef]
  44. Kheybari, S.; Rezaie, F.M.; Farazmand, H. Analytic network process: An overview of applications. Appl. Math. Comput. 2020, 367, 124780. [Google Scholar] [CrossRef]
  45. Farias LM, S.; Santos, L.C.; Gohr, C.F.; Rocha, L.O. An ANP-based approach for lean and green performance assessment. Resour. Conserv. Recycl. 2019, 143, 77–89. [Google Scholar] [CrossRef]
  46. Cayir Ervural, B.; Zaim, S.; Demirel, O.F.; Aydin, Z.; Delen, D. An ANP and fuzzy TOPSIS-based SWOT analysis for Turkey’s energy planning. Renew. Sust. Energy Rev. 2018, 82, 1538–1550. [Google Scholar] [CrossRef]
  47. Arsić, S.; Nikolić, D.; Mihajlović, I.; Fedajev, A.; Zivkovic, Z. A New Approach within ANP-SWOT Framework for Prioritization of Ecosystem Management and Case Study of National Park Djerdap, Serbia. Ecol. Econ. 2018, 146, 85–95. [Google Scholar] [CrossRef]
  48. Ghaemi Rad, T.; Sadeghi-Niaraki, A.; Abbasi, A.; Choi, S. A methodological framework for assessment of ubiquitous cities using ANP and DEMATEL methods. Sust. Cities Soc. 2018, 37, 608–618. [Google Scholar] [CrossRef]
Figure 1. Grid, element and event interrelation.
Processes 10 00913 g001
Figure 2. Train operation department grid division.
Processes 10 00913 g002
Figure 3. Code structure of the train operation department grid.
Processes 10 00913 g003
Figure 4. Code structure of grid elements in the train operation department.
Processes 10 00913 g004
Figure 5. Code structure of grid events in the train operation department.
Processes 10 00913 g005
Figure 6. Grid-based risk assessment model.
Processes 10 00913 g006
Figure 7. Typical ANP hierarchy.
Processes 10 00913 g007
Figure 8. Location of Huangyangcheng Station.
Processes 10 00913 g008
Figure 9. Network structure diagram of hazard factors in grid G H .
Processes 10 00913 g009
Table 1. Grid attribute data of the train operation department.
Sequence NumberGrid Post Area CoverageArea (m2)
1 G 1 Station attendantNorth–south direction: k81 + 169 m–k81 + 175 m.
East–west direction: 16–22 m from the center line of Track 4.
36
2 G 2 TowermanNorth–south direction: k81 + 169 m–k81 + 175 m
East–west direction: 16–22 m from the center line of Track 4.
36
3 G 3 Train tail operatorNorth–south direction: k81 + 087 m–k81 + 257 m
East–west direction: center line of track 3—center line of Track 4 (20 m).
3400
k G k Passenger clerkPassenger platform (175 m × 12 m)2100
k + 1 G k + 1 Assistant watchmanNorth–south direction: k80 + 632 m–k81 + 705 m
East–west direction: center line of Track 4 to the outside of the safety line (25 m)
26,825
Table 2. Classification of grid elements in the train operation department.
Categories Responsibilities
Duty officerComprehensively understand and master the key points of station safety production, supervise and guide the on-site operation, coordinate and deal with various emergencies, and strengthen the patrol inspection during key periods.
Station attendantAccording to the plan and dispatch order, organize and deal with the receiving and dispatching work of stations and yards.
Assistant watchmanAssist attendant to receive and dispatch trains.
TowermanAccording to the station watchman’s order and shunting operation plan, deal with the operation of blocking, arranging access, opening and closing signal, monitoring receiving and dispatching function, and shunting.
YardmasterOrganize and direct the dispatching team to complete marshalling, pick-up, and delivery operations according to the dispatching operation plan.
Link memberResponsible for the breakdown of train and push watch in the shunting operation; confirms the vehicle connection status.
DispatcherAccording to daily shift plan and dispatch order, prepare and issue phase plan, and organize implementation.
Train statisticianOrganize and check the existing trains, compile the train marshalling order list, and handle the formalities with the head of operation or locomotive conductor.
Passenger duty officerOrganize, guide, and inspect the team to complete various passenger transport services.
Passenger clerkResponsible for the safety service of passengers entering and leaving the station and waiting for the train; responsible for checking, recovering, supplementing, and receiving the tickets of passengers entering and leaving the station; counting the number of passengers getting on and off the train; checking and blocking dangerous goods.
Ticket sellerResponsible for the sale of railway tickets: booking, expediting, processing refund, and updating change in procedures.
Cargo duty officerOrganize and lead the completion of cargo transportation, loading and unloading, delivery, and other operations according to the freight work plan.
Freight operatorHandle the operation of cargo transport, storage, unloading, supervision, and delivery.
Train tailor operatorResponsible for the installation and removal of the tailing device and the receiving and delivery of the returning equipment and fill in the operation ledger.
Table 3. Classification of grid events in the train operation department.
Categories Subevents
Dispatch command management work is not in placeThe marshalling train runs in violation of plan, does not prepare, and conveys operational and stage plans; inaccurate control of current train, etc.
Failure to meet the train as requiredIncorrect operation of equipment buttons, unqualified train delivery, irregular presence of field personnel, etc.
Shunting standards are not implementedChange the operation plan without authorization, and prepare the wrong route for the shunting operation; the shunting operation personnel do not call and answer according to the provisions, etc.
Anti-slip measures are not in placeFailure to take anti-slip measures according to the provisions, anti-slip equipment management is not in place, etc.
Organization of abnormal railway running is not in placeFailure to implement the standard for “Abnormal Train Transfer” when equipment is faulty, failure to implement relevant provisions during construction, blind train release due to bad weather, etc.
Equipment management is not in placeTransportation equipment is out of control and out of repair, the tailing device is out of control and out of repair, etc.
Safety management dereliction of dutyLack of rules and regulations management, dereliction of duty in cadre safety management, training and education management is not in place, labor discipline violations on duty, etc.
Failed to implement railway crossing and off-road management measuresThe blocking management of railway station is not in place, the protective net is not repaired in time, the crossing guard system is violated, etc.
Personal safety card control measures are not in placeInadequate occupational health management, illegal access to railway or improper protection, inadequate control of critical operations, etc.
Implementation of fire prevention and explosion prevention management system is not in placeLack of fire safety management, no regular inspection of fire facilities, etc.
Defects in road traffic safety managementFailure to establish traffic safety management system, illegal driving, etc.
Construction safety operation management is not in placeApproval of construction plans beyond the authority, construction organization work is not in place, blind opening without confirming the opening conditions, etc.
Table 4. Hazard factor division of “Construction organization work was not in place”.
Main CategoriesHazard Factors
Human factorsObsessive–compulsive symptom
Sensitive of interpersonal relationship
Somatization
Environment factorsFoggy conditions
Poor public safety environment
Management factorsLack of safety management system
Safety checks were not in place
Performance evaluation was not standardized
Employment mechanism was not perfect
Table 5. Safety behavior risk probability rating standard of the train operation department.
Language DescriptionFrequency RangeAverage RangeQualitative Estimate (Number/Year)Probability RangeGrade
Remote1 in 35 years to 1 in 175 years1 in 100 years0.01 [ 0 , 10 4 ) 1
Rare1 in 7 years to 1 in 35 years1 in 20 years0.05 [ 10 4 , 10 3 ) 2
Infrequent1 in 1.75 years to 1 in 7 years1 in 4 years0.25 [ 10 3 , 10 2 ) 3
Occasional1 in 3 months to 1 in 1.75 years1 in 9 months1.25 [ 10 2 , 10 1 ) 4
Regular1 in 20 days to 1 in 3 months1 in 2 months6.25 [ 10 1 , 1 ] 5
Table 6. Safety behavior risk consequence rating standard of the train operation department.
Language DescriptionQualitative DescriptionCasualty EstimateQualitative Estimate (Number/Year)
MinorMinor injury0.0051
MarginalMultiple minor injuries0.0252
ModerateSingle serious injury0.1253
SevereMultiple serious injuries or single fatal injury0.6254
Catastrophic2–5 fatal injuries3.1255
Table 7. Risk acceptance criteria of the train operation department.
Risk ScoresRisk CategoryDescription
[1,6]NegligibleRisk is acceptable with/without the agreement of the railway authority
[7,12]TolerableAcceptable with adequate control and with the agreement of the railway authority
[13,18]UndesirableShall only be accepted when risk
reduction is impracticable and with the agreement of the railway authority
[19,25]IntolerableRisk must be reduced in exceptional circumstances
Table 8. Hazard factor data of the Huangyangcheng station in Shenshuo Railway (part).
Time Qualitative Description
12 January 2016At 4:05, a yardmaster failed to inspect vehicles in the station as required.
28 March 2017At 9:30, an assistant watchman did not attend the operational learning program organized by the station.
23 December 201718 safety problems were found during the annual safety audit.
8 December 2018The lowest temperature at night reached –20 °C.
5 April 2019At 8:25, an assistant watchman did not take over as required.
7 June 2019At 15:20, a signalman failed to watch the train after it entered the line.
7 July 2019At 3:30, a signalman was on duty in a bad state of mind.
28 July 2019At 7:15, a yellow warning for lightning was issued.
15 November 2019At 16:00, based on on-duty personnel inspection, it was found that one to two lines between the water well cover were not covered.
Table 9. Basic information of experts.
ExpertsAgeEducational BackgroundProfessional Title Years of Working
Expert 145Junior CollegeEngineer22 years
Expert 250Junior CollegeSenior Engineer 28 years
Expert 330Graduate StudentEngineer5 years
Expert 442UndergraduateEngineer21 years
Expert 535UndergraduateAssistant Engineer13 years
Table 10. Hazard factors of “the assistant watchman did not appear as required” scenario.
Main CategoriesHazards
Human factors Obsessive–compulsive symptom A 1
Somatization ,   A 2
Business assessment is not up to standard, A 3
Environment factors Cold   weather   A 4
Lighting, ventilation, heat preservation, and other post conditions were poor, A 5
Equipment factors Equipment   failure ,   A 6
Management factors Operating standards and procedures were not standardized, A 7
Safety checks were not in place, A 8
Table 11. Hazard factor data set of “the assistant watchman did not appear as required” scenario.
Hazards FunctionsData Induced
Intensity
Comments
Obsessive symptom, A 1 Y T G = { 0.01 ,   3.9 n 5 0.008 ,   3.3 n 3.8 0.006 ,   2 n 2.9 0.004 ,   1.62 n < 2 0 ,   n < 1.62 Y T G :   At   time   interval   T ,   the   risk-induced   intensity   of   the   hazard   factor   in   grid   G . n :   Obsessive-compulsive   factor   score . (SCL-90) test
n = 2.5
0.006SCL-90: Symptom Check List-90, represents a list of 90 symptoms
Somatization, A 2 Y T G = { 0.02 ,   3.9 n 5 0.01 ,   3.3 n 3.8 0.006 ,   2 n 2.9 0.003 ,   1.37 n < 2 0 ,   n < 1.37 Y T G :   At   time   interval ,   the   risk-induced   intensity   of   the   hazard   factor   in   grid   G . n :   Obsessive compulsive   factor   score . (SCL-90) test n = 1.60.003SCL-90: Symptom Check List-90, represents a list of 90 symptoms
Business assessment was not up to standard, A 3 Y T G = { 100 a 10000 ,   80 < a < 90 0 ,   a 90 Y T G :   At   time   interval ,   the   risk-induced   intensity   of   the   hazard   factor   in   grid   G . n :   Business   examination   scores   of   the   post   staff   in   grid   G . Monthly safety production knowledge test score 850.0015Due to the importance of railway safety, the Shenshuo Railway stipulates that the examination score of 80 is qualified
Cold weather, A 4 Y T G = { 0.01 ,   the   lowest   temperature   dropped   below 20   ° C   in   24   h . 0.006 ,   the   lowest   temperature   dropped   below 10   ° C   in   24   h . 0.002 ,   the   lowest   temperature   dropped   below   0   ° C   in   24   h . Y T G :   At   time   interval   T ,   the   risk   induced   intensity   of   the   hazard   factor   in   grid   G . The lowest temperature of the day was −24 °C0.01According to the expert advice and the influence of low temperature on human body function, selecting different induced intensity values
Lighting, ventilation, heat preservation, and other post conditions were poor, A 5 Y T G = { 0 . 003 ,   job   conditions   are   not   available . 0 ,   others . Y T G :   At   time   interval   T ,   the   risk-induced   intensity   of   the   hazard   factor   in   grid   G . Poor lighting conditions in the station at night0.003Assigning values according to field operation conditions
Equipment failure, A 6 Y T G = { d 1000 D ,   d D 2 d 100 D ,   D 2 < d < D 0.01 ,   d D Y T G : At   time   interval   T ,   the   risk-induced   intensity   of   the   hazard   factor   in   grid   G . d :   Equipment   failure   time ( day ) . D :   Equipment   failure   threshold   ( day ) . The battery capacity was insufficient, which affected the intercom call reliability0.004Assigning values according to equipment inspection and maintenance statistics
Operating standards and procedures were not standardized, A 7 Y T G = { 0.003 ,   Operating   standards   and   procedures   are   not   standardized . 0 ,   others . Y T G :   At   time   interval   T , the   risk   induced   intensity   of   the   hazard   factor   in   grid   G . No mobile phone management system0.003Assigning values according to daily check statistics
Safety checks were not in place, A 8 Y T G = { t 1 t 2 10000 D ,   t 1 t 2 D 2 t 1 t 2 1000 D ,   D 2 < t 1 t 2 D 0.02 ,   t 1 t 2 > D Y T G : At   time   interval   T ,   the   risk-induced   intensity     of   the   hazard   factor   in   grid   G . t 1 t 2 :   Difference   between   the   specified   inspection     times   and   the   actual   inspection   times . D :   Threshold   between   the   specified   inspection   times   and   the   actual   inspection   times ( day ) . During the working week, checking was done twice0.02Assigning values according to the inspection statistics of the superior safety inspectors
Table 12. Weight value of hazard factor in grid G H .
HazardsNormalized by ClusterLimiting
Obsessive–compulsive symptom, A 1 0.370.19
Somatization, A 2 0.220.12
Business assessment was not up to standard, A 3 0.410.21
Cold weather, A 4 0.610.10
Lighting, ventilation, heat preservation, and other post conditions were poor, A 5 0.390.06
Equipment failure, A 6 0.200.06
Operating standards and procedures were not standardized, A 7 0.330.11
Safety checks were not in place, A 8 0.470.15
Table 13. Risk magnitude of “the assistant watchman did not appear as required” scenario.
Grid CodesNumerical ValueRisk Levels
000100440100030202016Negligible
000100440100030302018Tolerable
000100440100030402016Negligible
000100440100030502016Negligible
000100440100030602018Tolerable
000100440100030702016Negligible
000100440100030802018Tolerable
000100440100030902014Negligible
000100440100031002016Negligible
Table 14. Three violations data of “the assistant watchman did not appear as required” scenario.
Date Time Three Violations DescriptionInspection Situation
5 January 20165:30Sleeping on dutyYellow notice
20 March 201623:30Trains were not received in timeWhite notice
11 June 201617:00The busy board was not filled in timelyWhite notice
3 August 201614:00Failed to use intercom to answer call in timeWhite notice
26 November 201611:50Not standing in the correct position to meet the trainYellow notice
17 January 201713:00The busy board was not filledYellow notice
9 May 20174:30Doze off on dutyWhite notice
19 September 201715:45Not standing in the correct position to meet the trainYellow notice
22 November 20177:20Trains were not received in timeWhite notice
27 February 201810:00Walkie-talkies were not carried in field operationYellow notice
9 June 20182:30Sleeping on dutyYellow notice
21 August 201810:15Failed to use intercom to answer call in timeWhite notice
5 October 201813:30Doze off on dutyWhite notice
17 November 201822:00No pick-up trainYellow notice
Publisher’s Note: MDPI stays neutral with regard to jurisdictional claims in published maps and institutional affiliations.

