Abstract
The local gas holdup details and behaviors in the cylindrical split airlift column by using an unconventional gamma-ray densitometry (GRD) measurement in non-invasive manner technique was investigated for the first time in this work for such kind of airlift column. With different gas velocities, 1, 2, and 3 cm/s, at three various axial planes (different levels) in z = 3, 60, and 110 cm were studied for local distribution in radial gas holdup profiles. The distribution in gas–liquid phases (air-water system) in the entire split reactor column, in the rising and descending sides, including their behavior in the upper and lower zones of the split plate, were investigated as well. The results of this study showed that approximately all reactor zones had exemplary gas–liquid phases and that there was a large magnitude over both the dividing ring and the top sections. The results further indicated that the distribution of which flow variable in the implementation of the cylindrical split reactor can have an important impact on its behavior, especially for cultivating applications of microorganisms. These data can be used as benchmarks results for CFD simulations and validation.
1. Introduction
Many processes in wide industrial disciplinary involve gas–liquid, gas–solid–liquid, or gas–solid–liquid–liquid systems; a split airlift reactor is a multiphasic controller. The region is made up of three sections, downcomer, degassing, and the region of riser. Thus, in the center of this cylindrical reactor, a dividing plate is installed, forming a passage for the liquid to circulate inside the reactor [1,2,3,4,5,6,7].
The cylindrical split reactor is a popular choice for a variety of processes activities, including fermentation, micro-organism cell culture, and wastewater treatment, due to its natural fluid movement, low shear stress environments, good mass, and heat transfer rates with low energy consumption characteristics. The divided air lift reactor, however, provides a reliable application in a wide range of applications, including the cultivation of microalgae, since it offers better biomass production for a system than others, such as bubble columns and draft tube. Therefore, details of the hydrodynamic properties considerably influence the split reactor performance. With the accuracy of the hydrodynamic parameters, this cylindrical split reactor enables operators to improve their process and, therefore, improve the quality and quantity of the products. The main flow dynamic parameter in such a system is the gas holdup distribution [8,9,10,11,12,13,14,15].
A few literature contributions have been reported in recent years to study the gas holdup of split airlift reactors. Most of these contributions used an invasive technique to study the gas hold up, such as Ojha and Al Dahhan [10]; they used in their investigation four optical fiber probe technique which has many connection issues, as well as the difficulties with probe manufacturing complexity. Moreover, these investigations were limited in their work to perform measurements taken at specific locations. Furthermore, it could affect fluid flow and bubble behavior within the reactor by inserting intrusive techniques such as sample. Furthermore, additional measurements may need to evaluate the impact of any operational situations, which might necessitate substantial experimental work and expense, depending on those measurements that have been made at particular locations. Only non-intrusive techniques like gamma-ray techniques can do such measurements. These techniques enable researchers to better recognize the fundamental nature of such reactors, improving and optimizing their processes and providing detailed data a distribution system for gas holdup [12,13].
Furthermore, Laith et al. [14] produced the sole noteworthy experimental work that utilized computed tomography (CT) technique to study the distribution in gas holdup for split photobioreactor including microalgae culturing system. This technique obtained very high-quality results and information for such a system. However, this technique is hard to deal with reactors in an outside field (industrial field) due to many moving parts and connections. Therefore, in this work, gamma-rays densitometry GRD, this is the first time that utilized to investigate the gas holdup in such reactor. Then, this technique is capable of investigating the gas holdup performance inside the lab and in the industrial fields (portable device).
This work, thus, seeks to broaden the knowledge by quantifying the distribution of gas holdup in the cylindrical airlift reactor for air-water system. This parameter has been studied in addition to the height of the airlift split reactor and its entire cross-sectional area under bubble fluid, applying the state-of-the-art technique of non-invasive gamma-ray densitometry (GRD).
For a number of reasons, it is essential for the industry development to obtain a comprehensive hydrodynamic characteristic from the current and earlier studies in this sector for cylindrical split reactors. This includes, but is not limited to, better information and comprehension of the cylindrical split reactor; provision of this reactor’s design and scale-up will be aided by benchmark data for evaluating and validating simulation models, improved development of mechanical modeling for optimizing processes, and forecasting performance.
2. Experimental Work
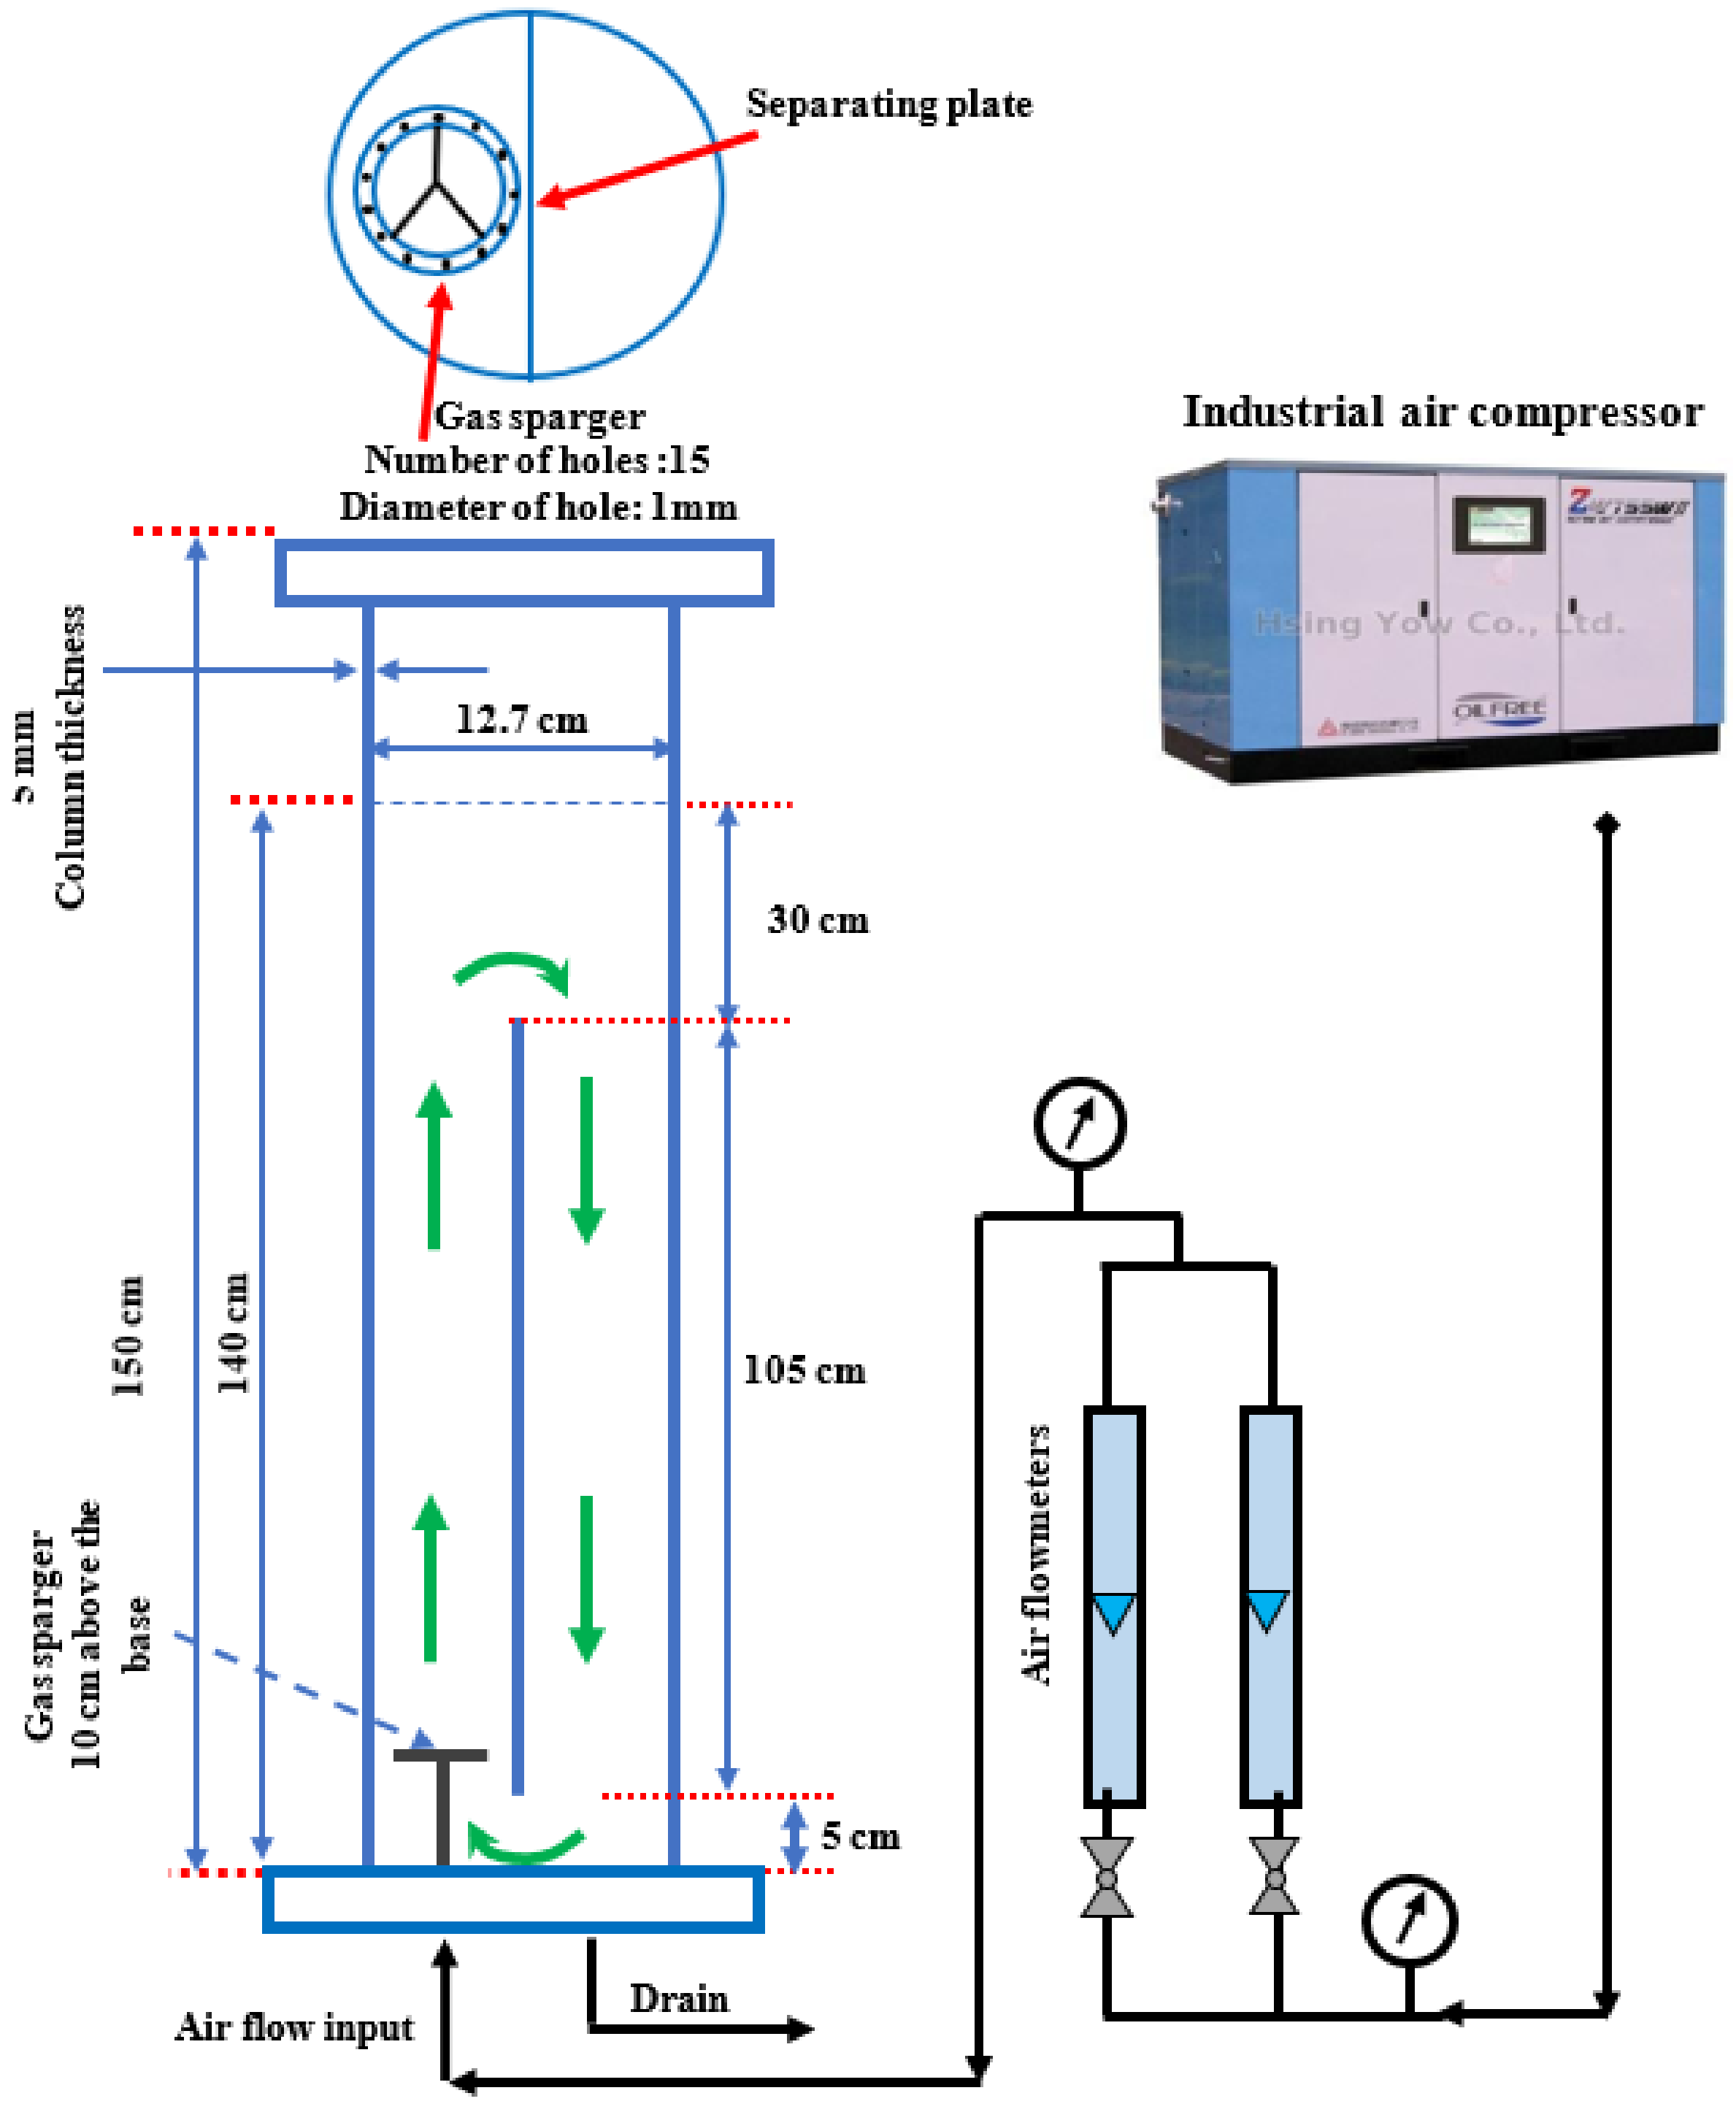
A cylindrical split-plate reactor consisted of a cylindrical column made from a Plexiglas material that had a split plate in the middle. In order to divide into two identical cross sections side, rise and fall, this plate was designed with a diameter 12.7 cm, and a height of 150 cm. An illustration of this reactor can be seen in Figure 1. There is a ring-shaped sparger (stainless steel) located at the base of the reactor’s riser zone that supplies air to it in T = 23 °C (ambient temperature).

Figure 1.
A cylindrical airlift split-plate reactor.
The air sparger contains fifteen 1mm holes uniformly spread across the sparger’s top surface. The gas utilized in this experiment was compressed air, which was delivered in continuous bursts of up to 1250 m3/h and 200 psig by an industrial compressor. Before entering the airflow controller, an air drier and a pressure regulator were used to dry and regulate the air supplied. Two calibrated air flow meters, two pressure gages, and two valve components were included in the airflow control system. The compressed air was introduced to the tap water in T = 23 °C in the riser section.
The hydrodynamic parameters measured on three levels were measured with the column height at the bottom of the split reactor of 3, 60, and 110 cm. The measurement of the heights were determined in order to detect a dividing airlift reactor hydrodynamic behavior in various regions (riser, top, downcomer, and bottom). A large number of useful data will be provided in measuring the hydrodynamic parameters of these three levels to meet the need for model validation for the researchers. Three different velocities of gas (air) in terms of riser superficial gas velocity, 1, 2, or 3 cm/s, were measured for the hydrodynamic parameters of the bubbly flow regime that is used for cultured microorganisms.
3. Measurement Technique
The GRD approach is an method that is not invasive and allows researchers to precisely determine the phase distribution among various multiphase flow systems or different reactors design under various operating conditions. The GRD approach, which was applied in this investigation, has already proven to be effective in determining how the gas phase is distributed in liquid in a packed bed column [16,17].
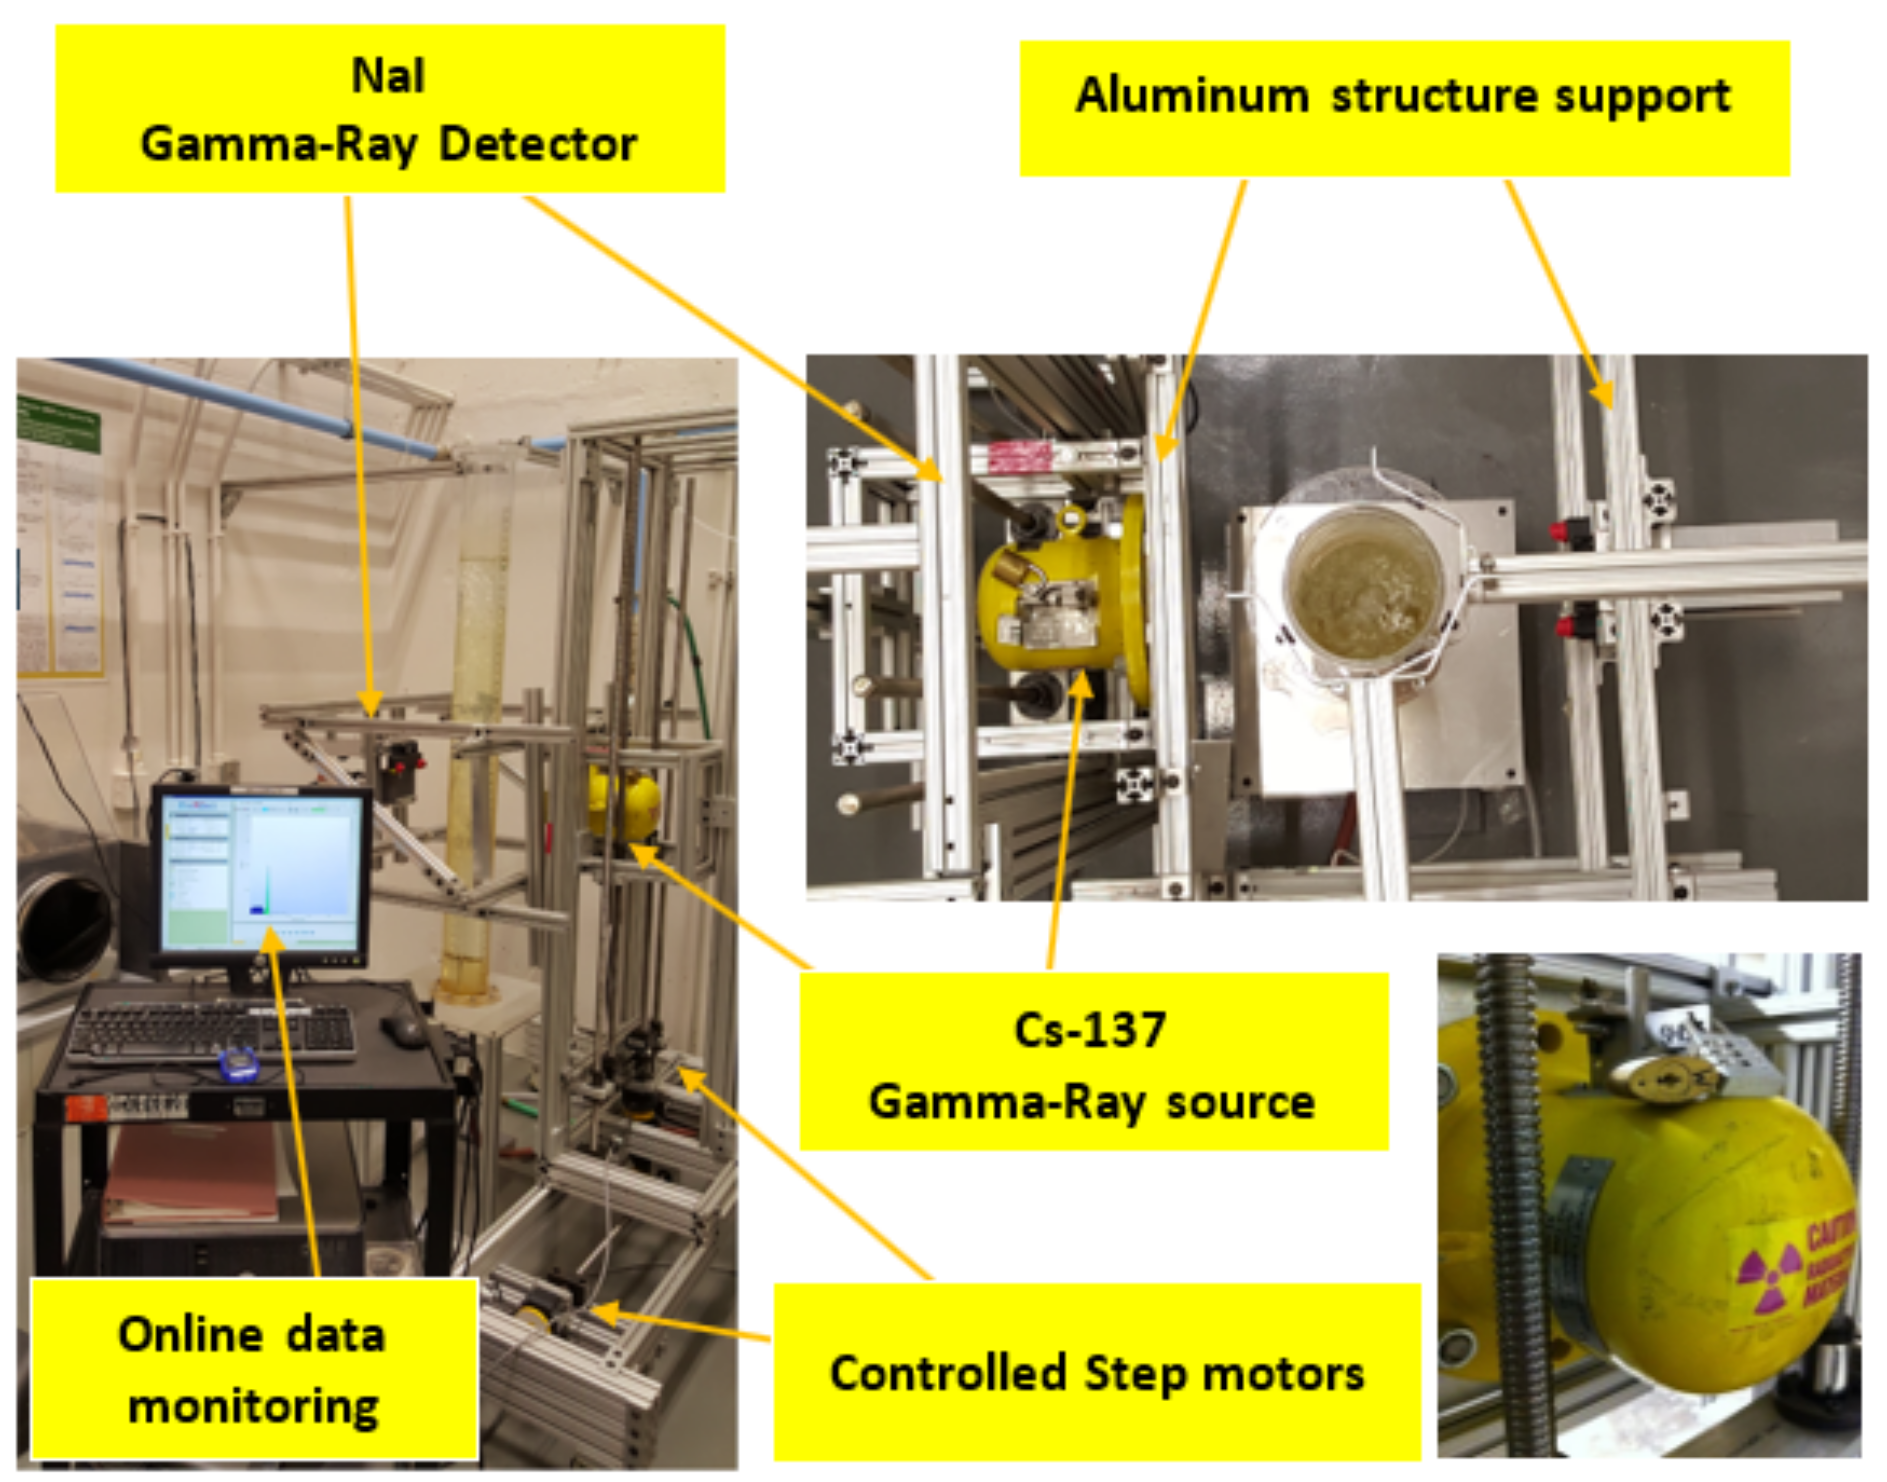
Figure 2 depicted the GRD approach with the cylindrical airlift column. The present GRD technique, set in the Department of Chemical and Biochemical Engineering at the Missouri University of Science and Technology in Multiphase Reactors Engineering and Applications Laboratory (mReal), consists of one gamma-ray source, Caesium-137 (CS-137), and could substitute it with different a gamma-ray source, such as Cobalt-60. This GRD was designed when three-phases are changing dynamically, to measure the distributions in the phases inside the multi-phase reactors. However, in this work, only two stages are involved in the split-plate airlift reactor, therefore, the source of CS-137 was sufficient to quantify the gas holdup. This CS-137 source, with the start of an activity of an enclosed 250-mCi Cs-137 with a 660 keV emission energy, inside a lead-shielded container, was enclosed and sealed. The distance between the gamma-ray source and the detector is 0.5 m and the pixel size 32 × 32.
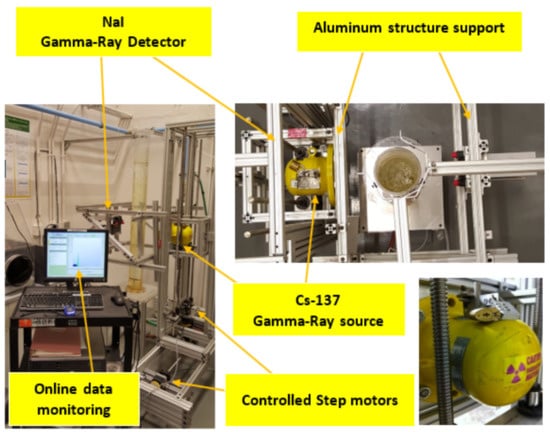
Figure 2.
Picture of GRD technique and Split Airlift Reactor.
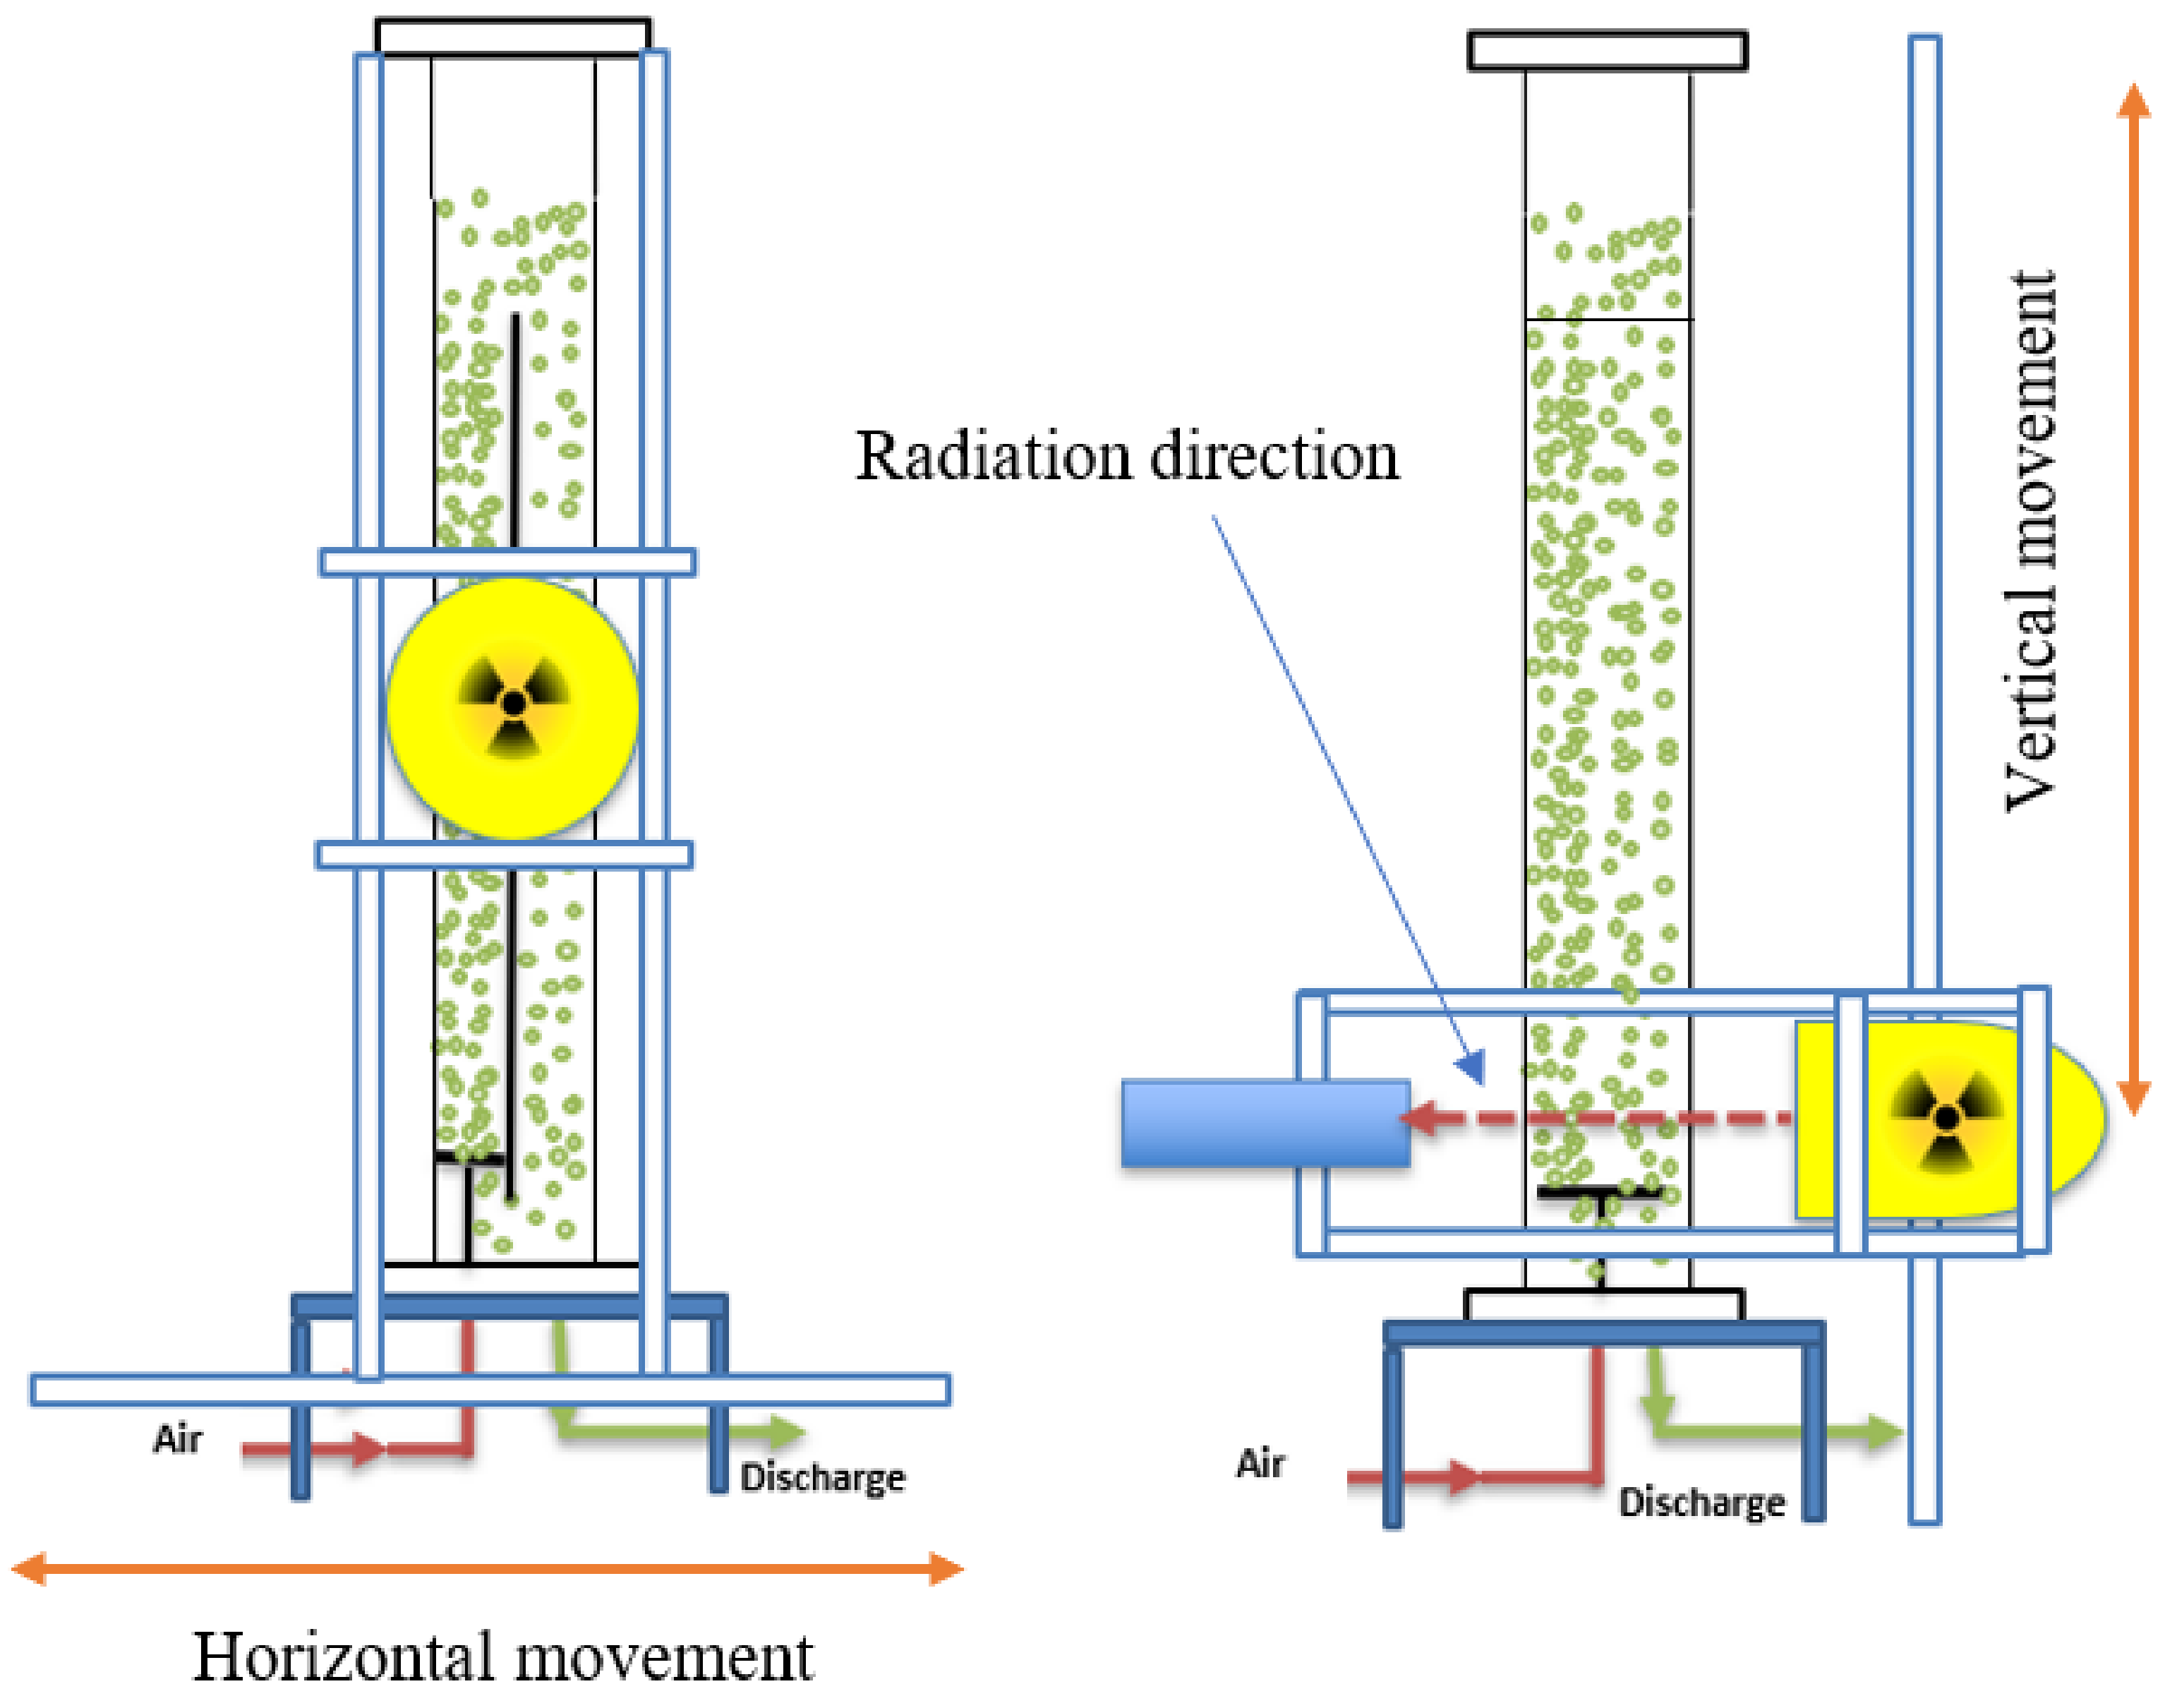
When gamma-ray is needed in GRD scanning, this lead shield has a hole for it to come out. As indicated schematically in Figure 3, the opening of the shield was collimated by lead plates to generate a gamma-ray line. In front of the gamma source (i.e., CS-137), an aluminum frame structure holds the source and detector. Both the Cs-137 source and the NaI (Tl) detector are lead-shielded and mounted symmetrically on opposing sides of an aluminum frame that has been extruded on the outside of this unit. To evaluate the gas holdup in this work, GRD scan measurements can be taken along the column’s diameter and at any axial location consideration. A ruler can be used to measure the horizontal and vertical measuring distances.
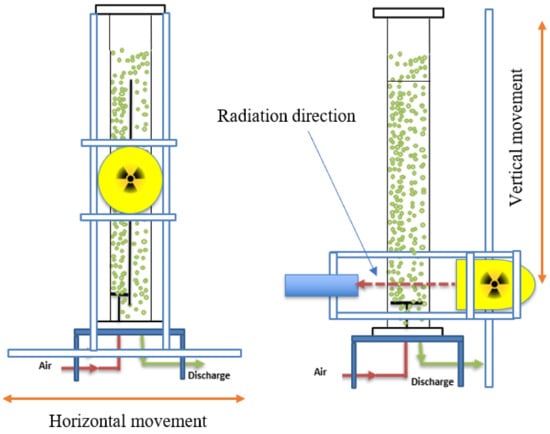
Figure 3.
GRD technique and Split Airlift Reactor.
The horizontal measurements were taken, and the results were then reported at r/R = ± 0.3, ± 0.6, and ± 0.9 at the middle section, as shown Figure 4; at the lower and the top sections, there is an extra point which was measured at 0 (center of the column). In each position, the measuring time was roughly 1 min.
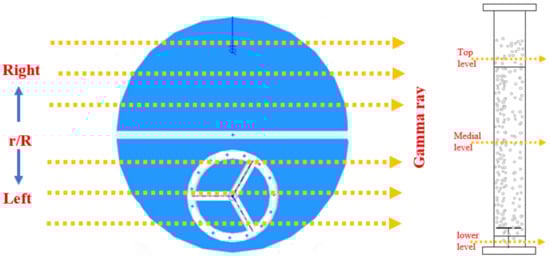
Figure 4.
Radial and vertical scanning positions.
The vertical measurement distance was at three different positions, lower level (under the split plate) 3 cm from the column base, middle level in 60 cm above the base, and top level at 110 cm from the column base.
The gamma source measurement technique has been well established and has played an essential role in multiphase system, which is used in a variety of industries, including the petroleum industry [18,19].
4. GRD Data Processing
To identify the capability and the accuracy of gamma ray densitometry (GRD) technique, the signals for the time series that obtained by GRD measurements for split column at various conditions were showed as a photon counts.
Photon Counts
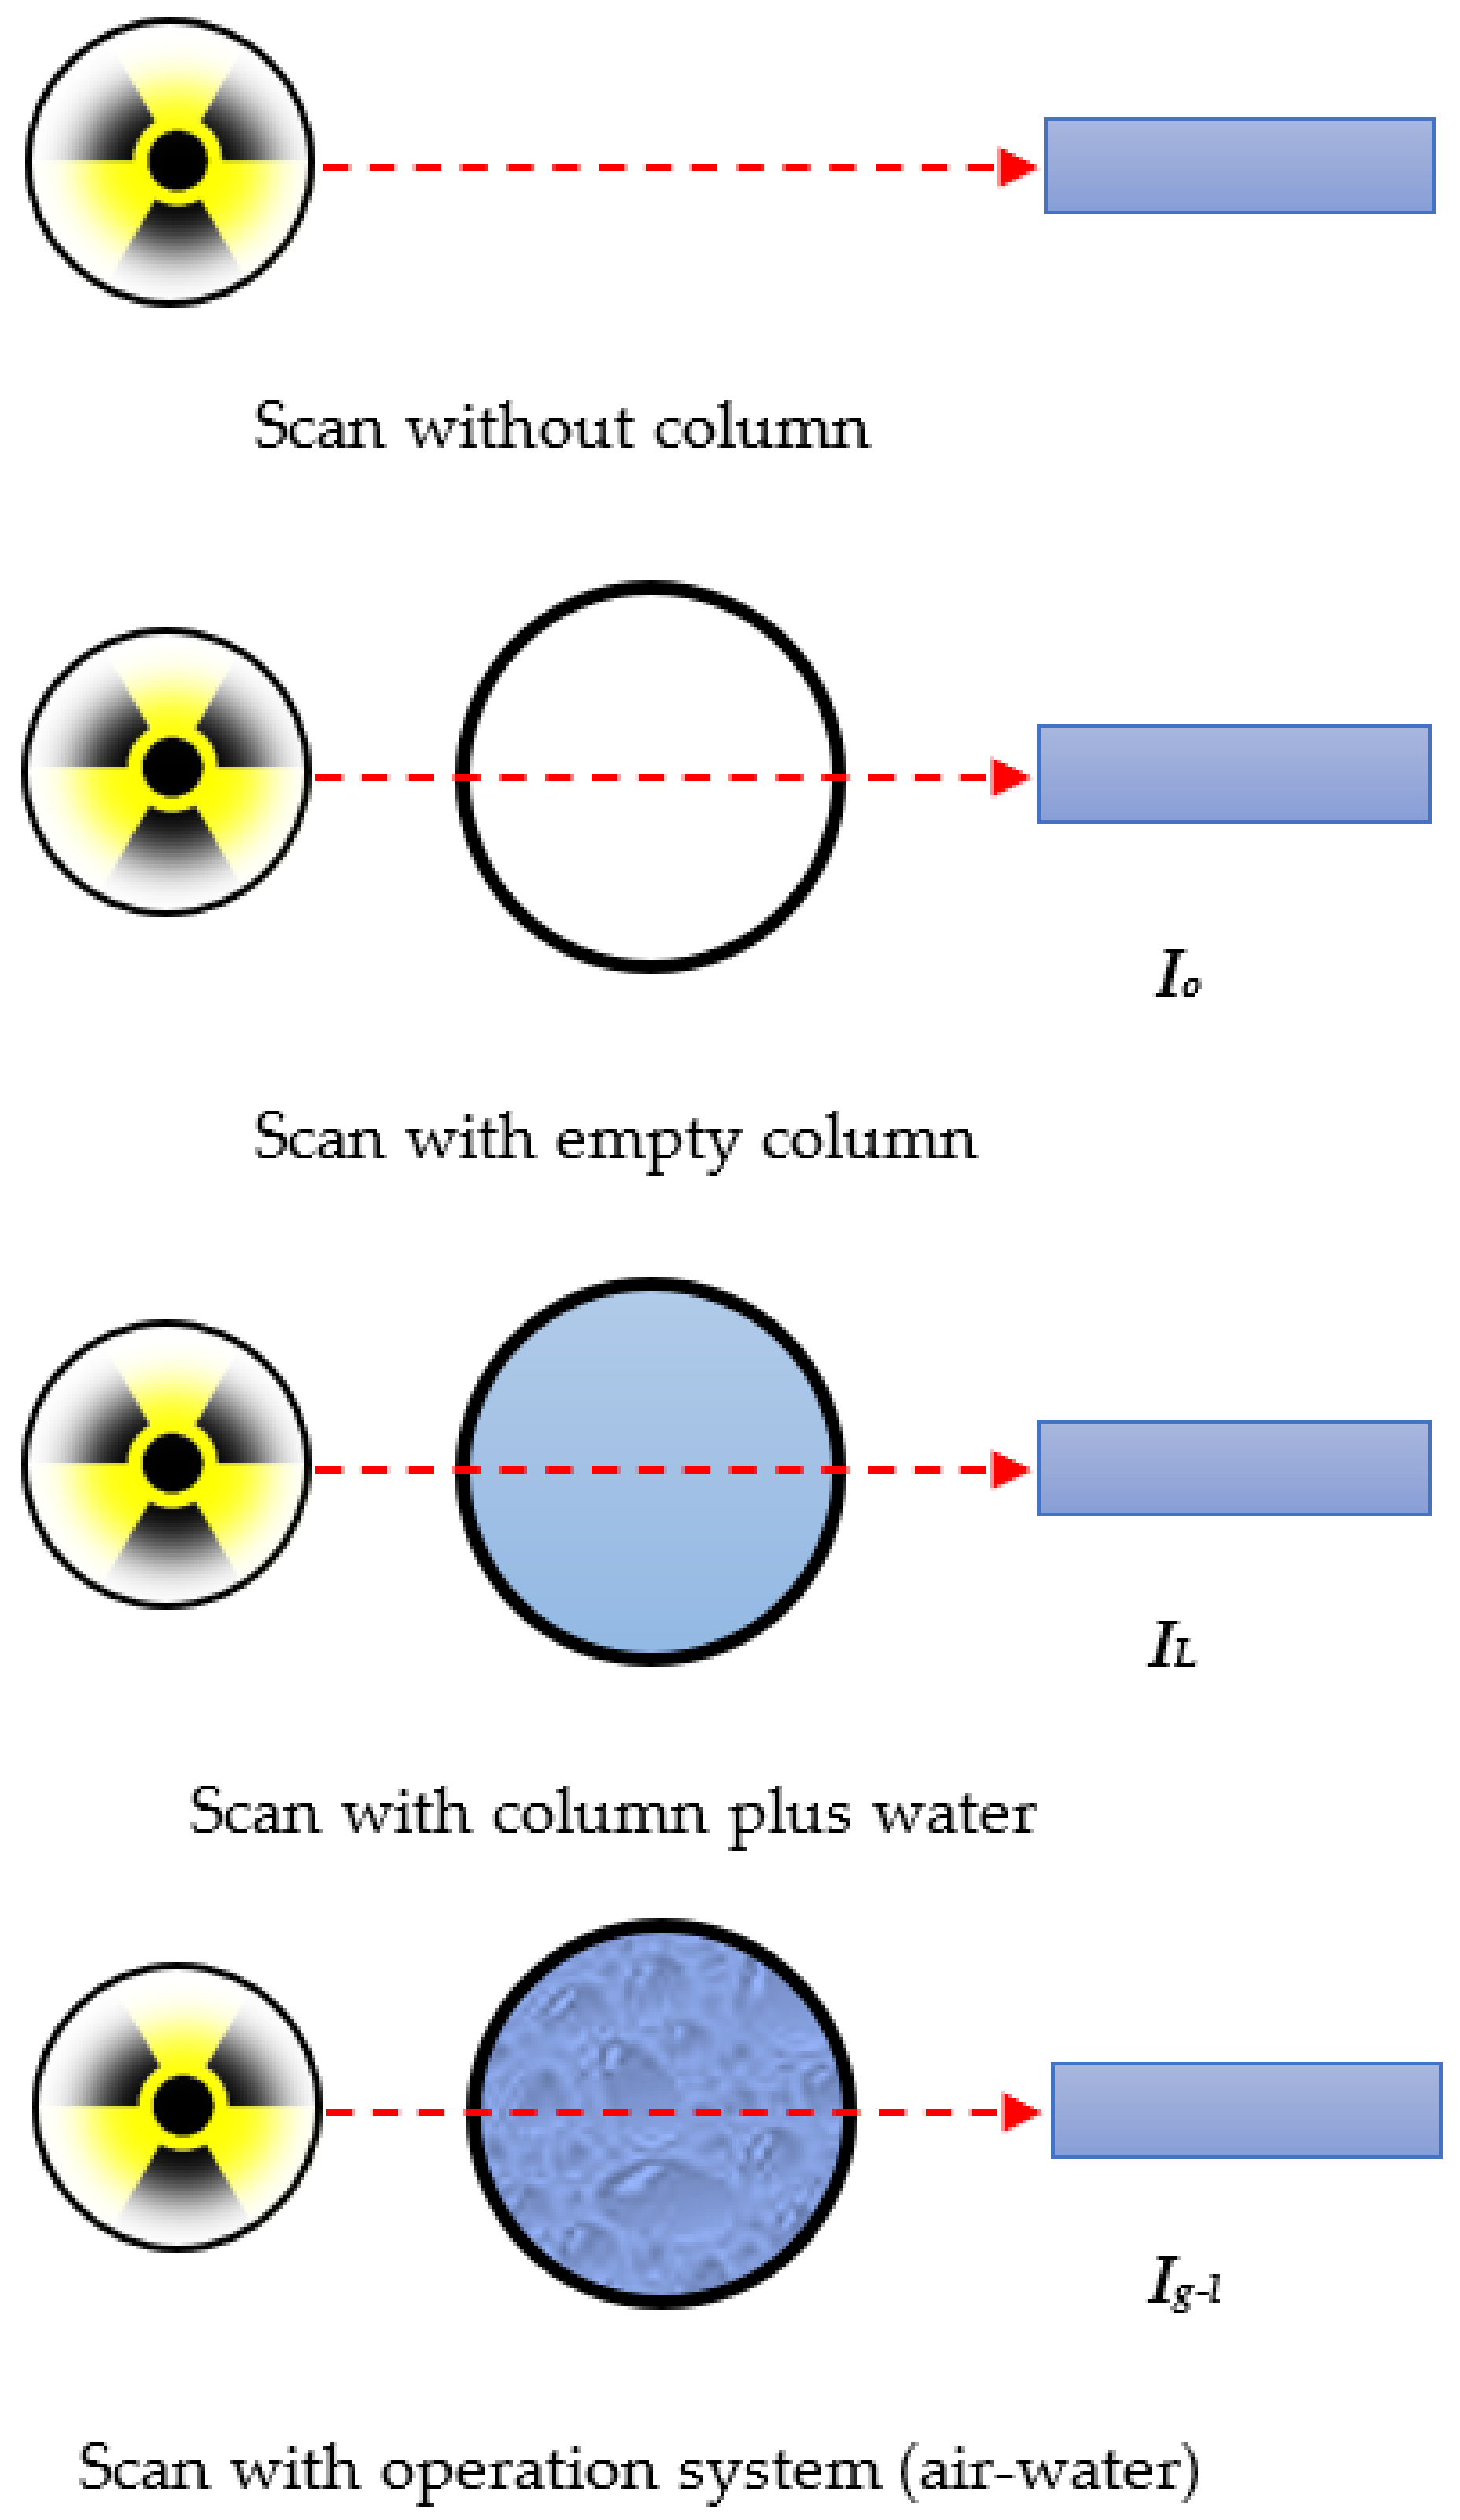
The time series was obtained over a 120 s data capture period at 50 Hz to highlight the nature of dynamic photon count fluctuations and how they fluctuate with changes in flow conditions. To evaluate the flow movement in this system, it has to take the scan, firstly, without column (empty space), secondly, only an empty column, thirdly, with a column filled in water, and, finally, scan the column in operation (gas–liquid) as shown in Figure 5.

Figure 5.
The procedure of experimental GRD scanning split column.
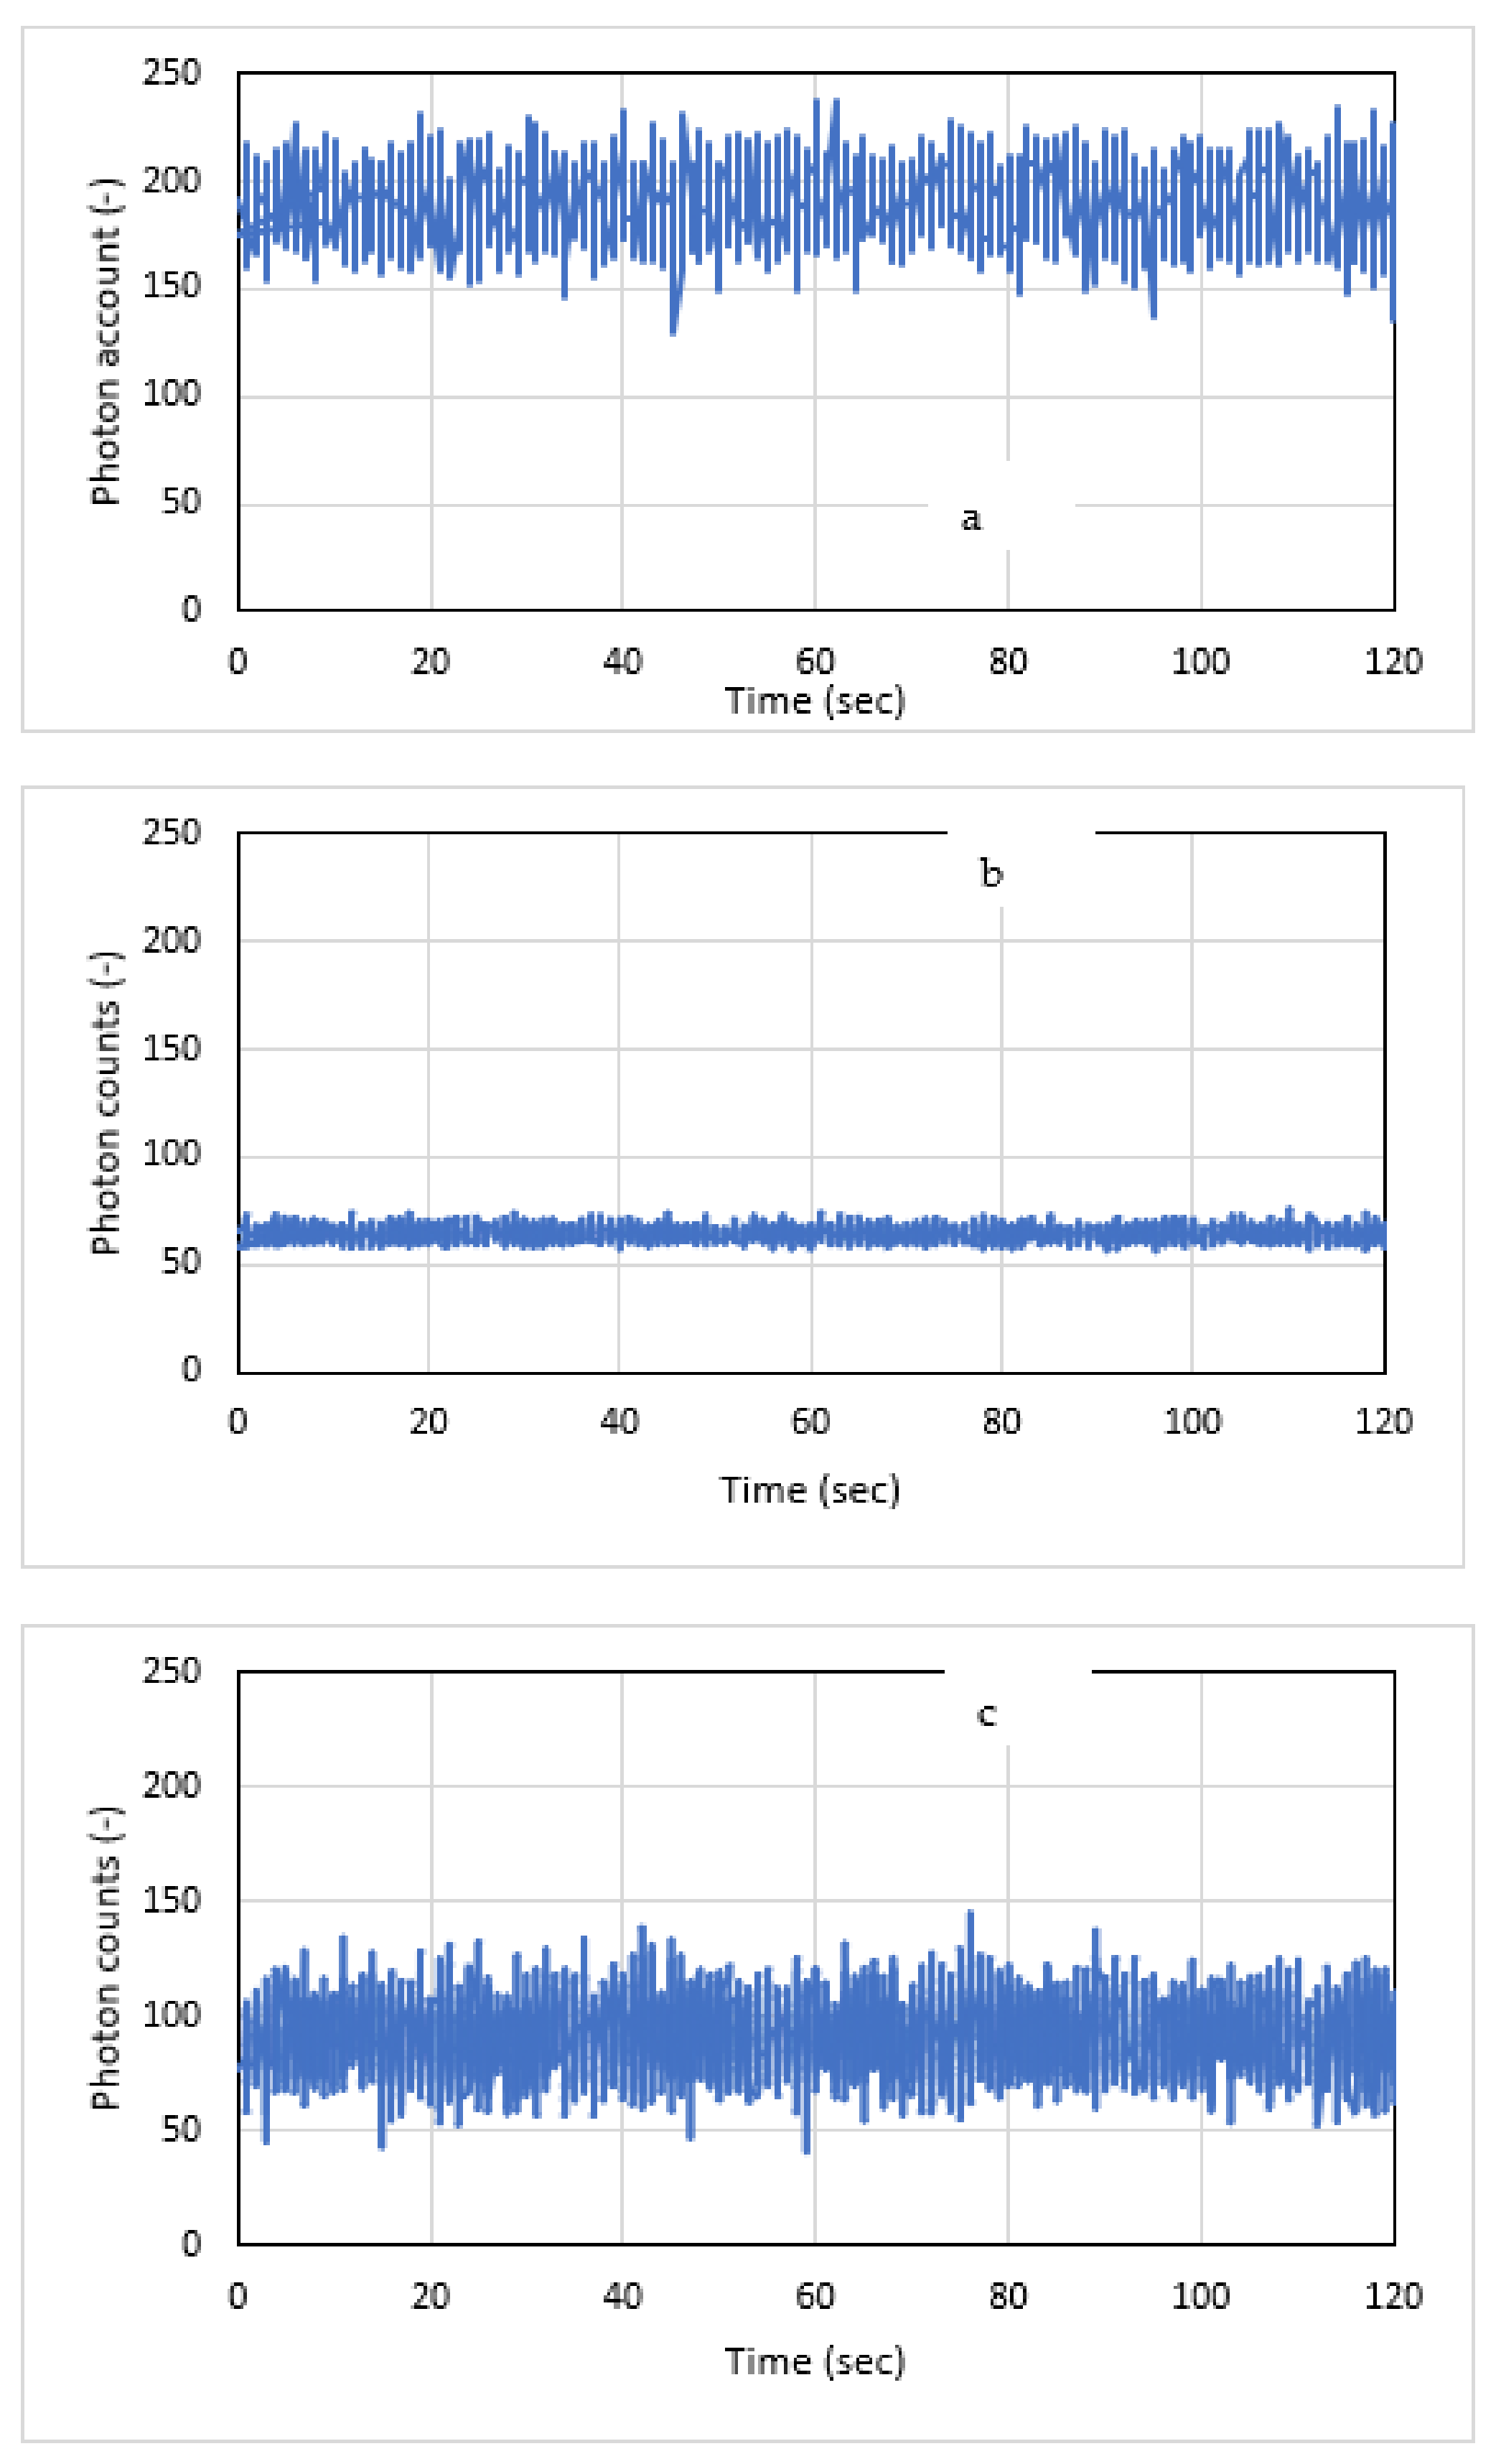
Figure 6 shows the signals as a series of photon count time series obtained by a NaI scintillation detector under varied settings. The GRD setup is made up of a scintillation detector (NaI) on one side and a source of gamma-ray radiation (Cs-137) on the other. After passing through the material, the quantity of attenuated radiation which reaches the scintillation detector is determined by the density of the air-water flow inside the split column. The attenuated radiation’s dynamic (flow dynamics) fluctuation contains information on the flow performance and attributes in this system [20].

Figure 6.
Fluctuations in photon count (Time-series) in a 12.7 cm diameter of split column in (a) empty column and (b) only water in column (c) air-water with gas velocities 3 cm/s.
The photon counts (time series) history collected in the current experiment in air and water (with and without gas [air] flow) clearly showed that the GRD scan was capable of displaying the differences in capacity, as well as oscillations (fluctuation) in photon counts, with variations in conditions in terms of without column, empty column, column filled with water, and column in operation.
5. Measurement Approaches Repeatability
To examine the accuracy of the GRD system results, the distribution of the gas holdup in cylindrical split reactor (airlift) was replicated. The center segment (z = 60 cm), the bottom zone (z = 3 cm), and the top zone (z = 110 cm) were replicated with a gas velocity of 3 cm/s and three different axial sections. The gas holdup distributions reveal that the consequences (tests 1 and 2) showed good similarity.
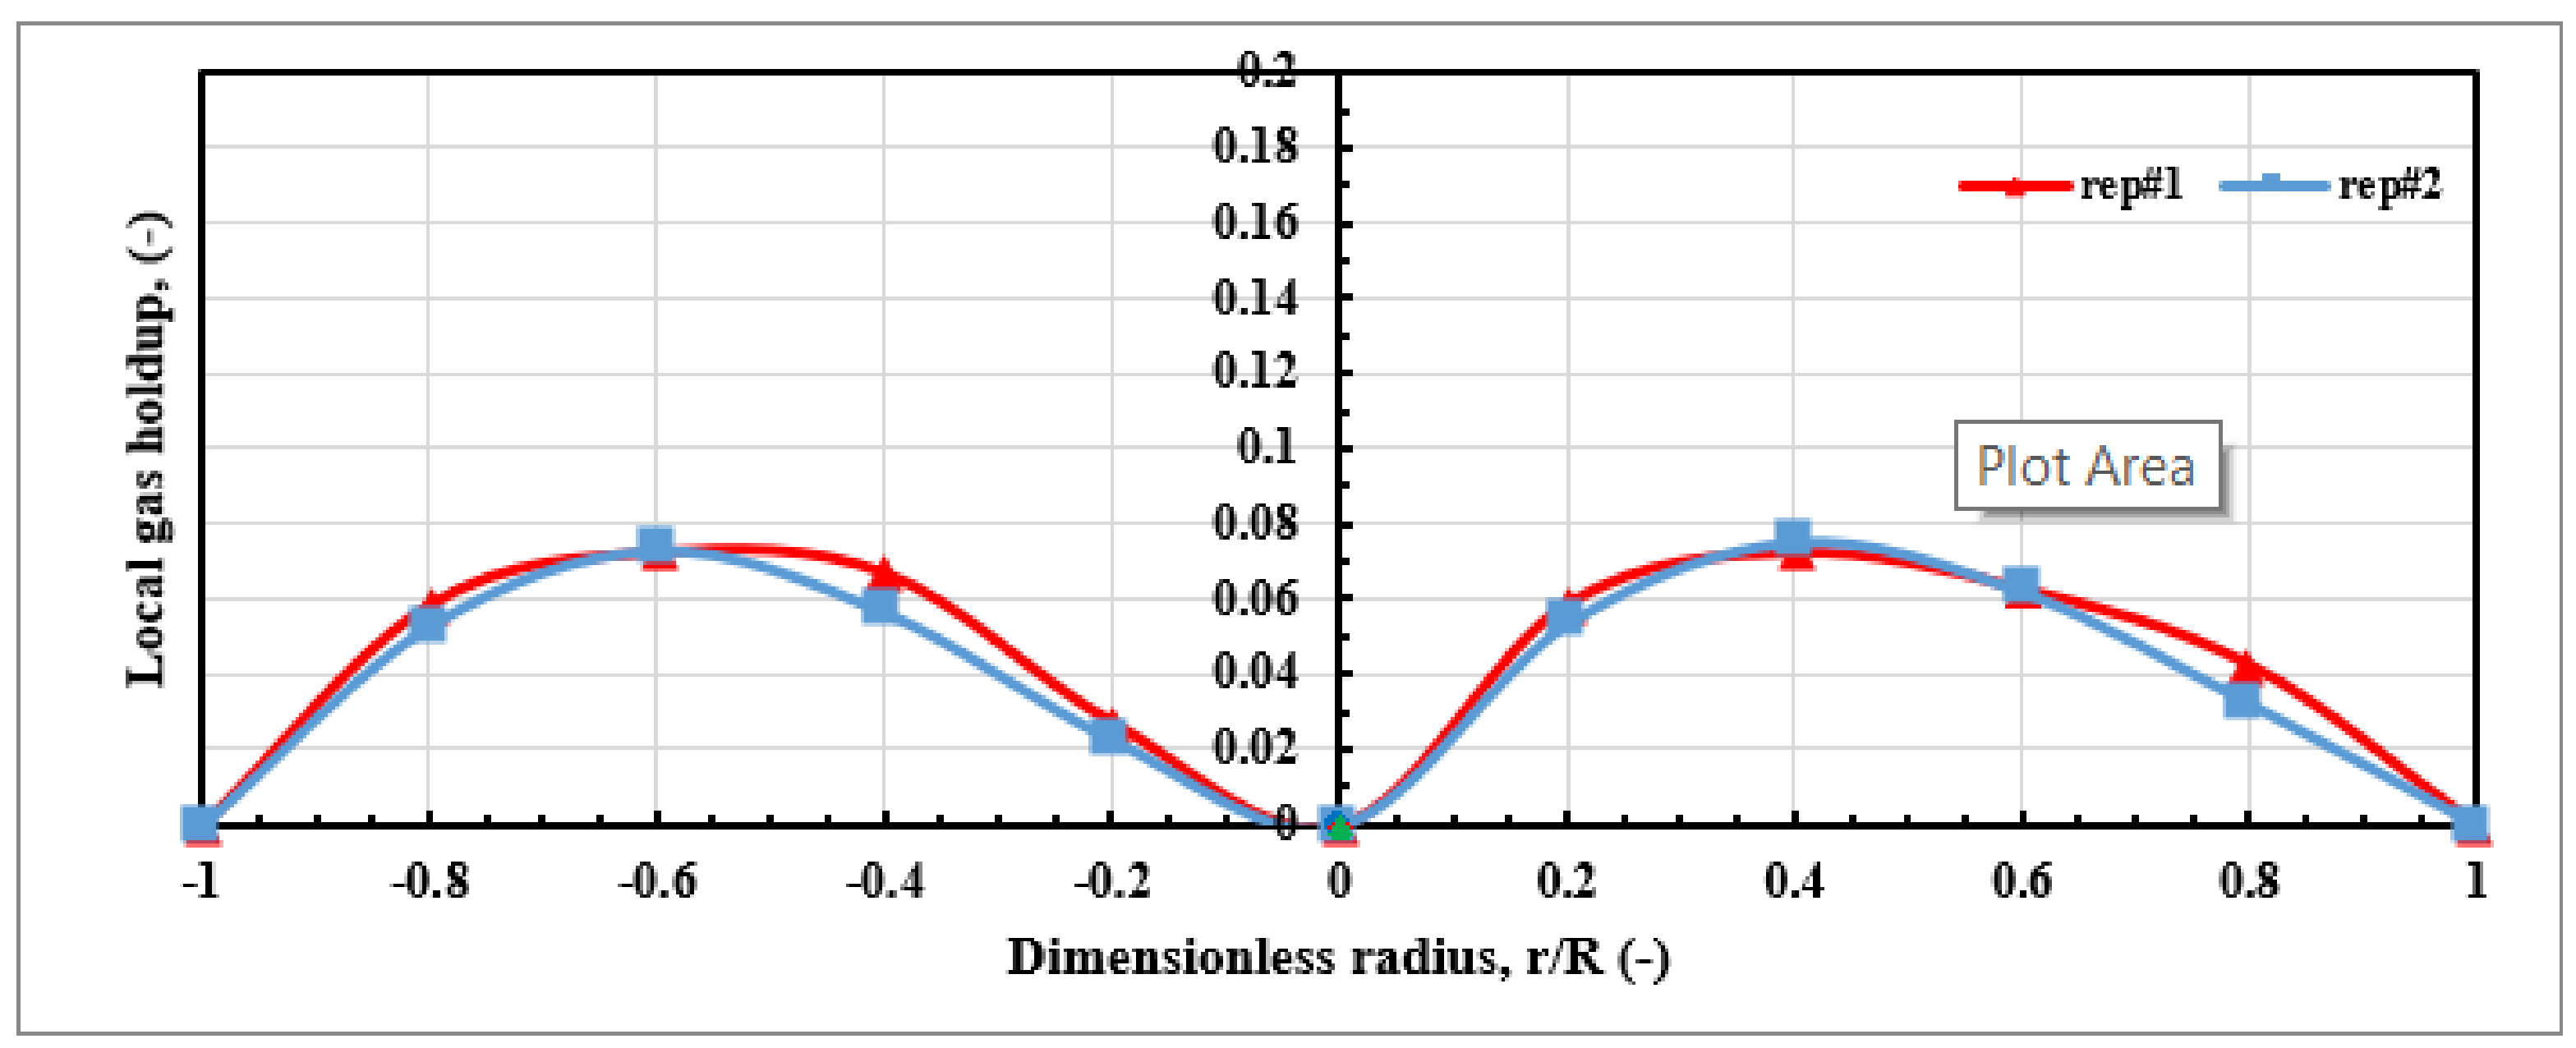
Furthermore, the repeatability of the gas holdup distribution was tested at three different axial levels: middle portion (z = 60 cm), bottom section (z = 3 cm), and top section (z = 110 cm) under 3 cm/s of gas velocity. The findings of the gas holdup distribution in tests 1 and 2 are comparable, as illustrated in Figure 7. Additionally, the gas holdup’s radial profiles, which, taken by having the semi-azimuthal averages, were estimated by computing the differences between the averages of the half-circumferences of the data.
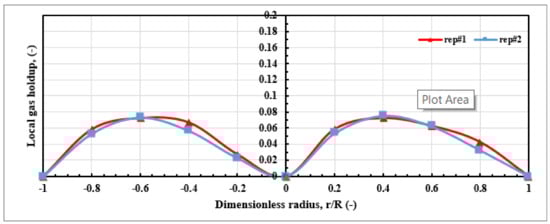
Figure 7.
Gas holdup reproducibility in radial profiles of a cylindrical split reactor at middle section and at 3 cm/s gas velocity.
Moreover, the results in Figure 7 present the gas holdup profiles in the middle level under the identical operating circumstances for test 1 and test 2. These comparisons are very much alike in magnitude and behavior for most column diameter locations in the split reactor column. Experiments 1 and 2 produced similar results along the riser and downcomer lengths, indicating the dependability and high accuracy of these measurement procedures. By utilizing the following equation, the average absolute relative difference (AARD) may be determined:
The experiment of test 1 is x1(r), and the experiment of test 2 is x2(r), both of which show the liquid velocity data. The letter N, which appears over the cross-sectional distribution, denotes the number of data points (column diameter).
At the middle position, the AARD values calculated at 3 cm/s (gas velocity) in two profiles was 3.73 percent. Origin Lab 2017 was used to do a statistical study utilizing one-way analysis of variance (ANOVA) with a significance level of p 0.05 to illustrate the significant effects of the replication test (experimental tests 1 and 2) on the accuracy of the GRD. In this level, the results show that there are no significant differences between the replicated outcomes, with p = 0.78. Furthermore, For the gas holdup, the AARD and ANOVA data showed that the GRD approach is extremely reproducible and exact.
6. Validation of the Technique
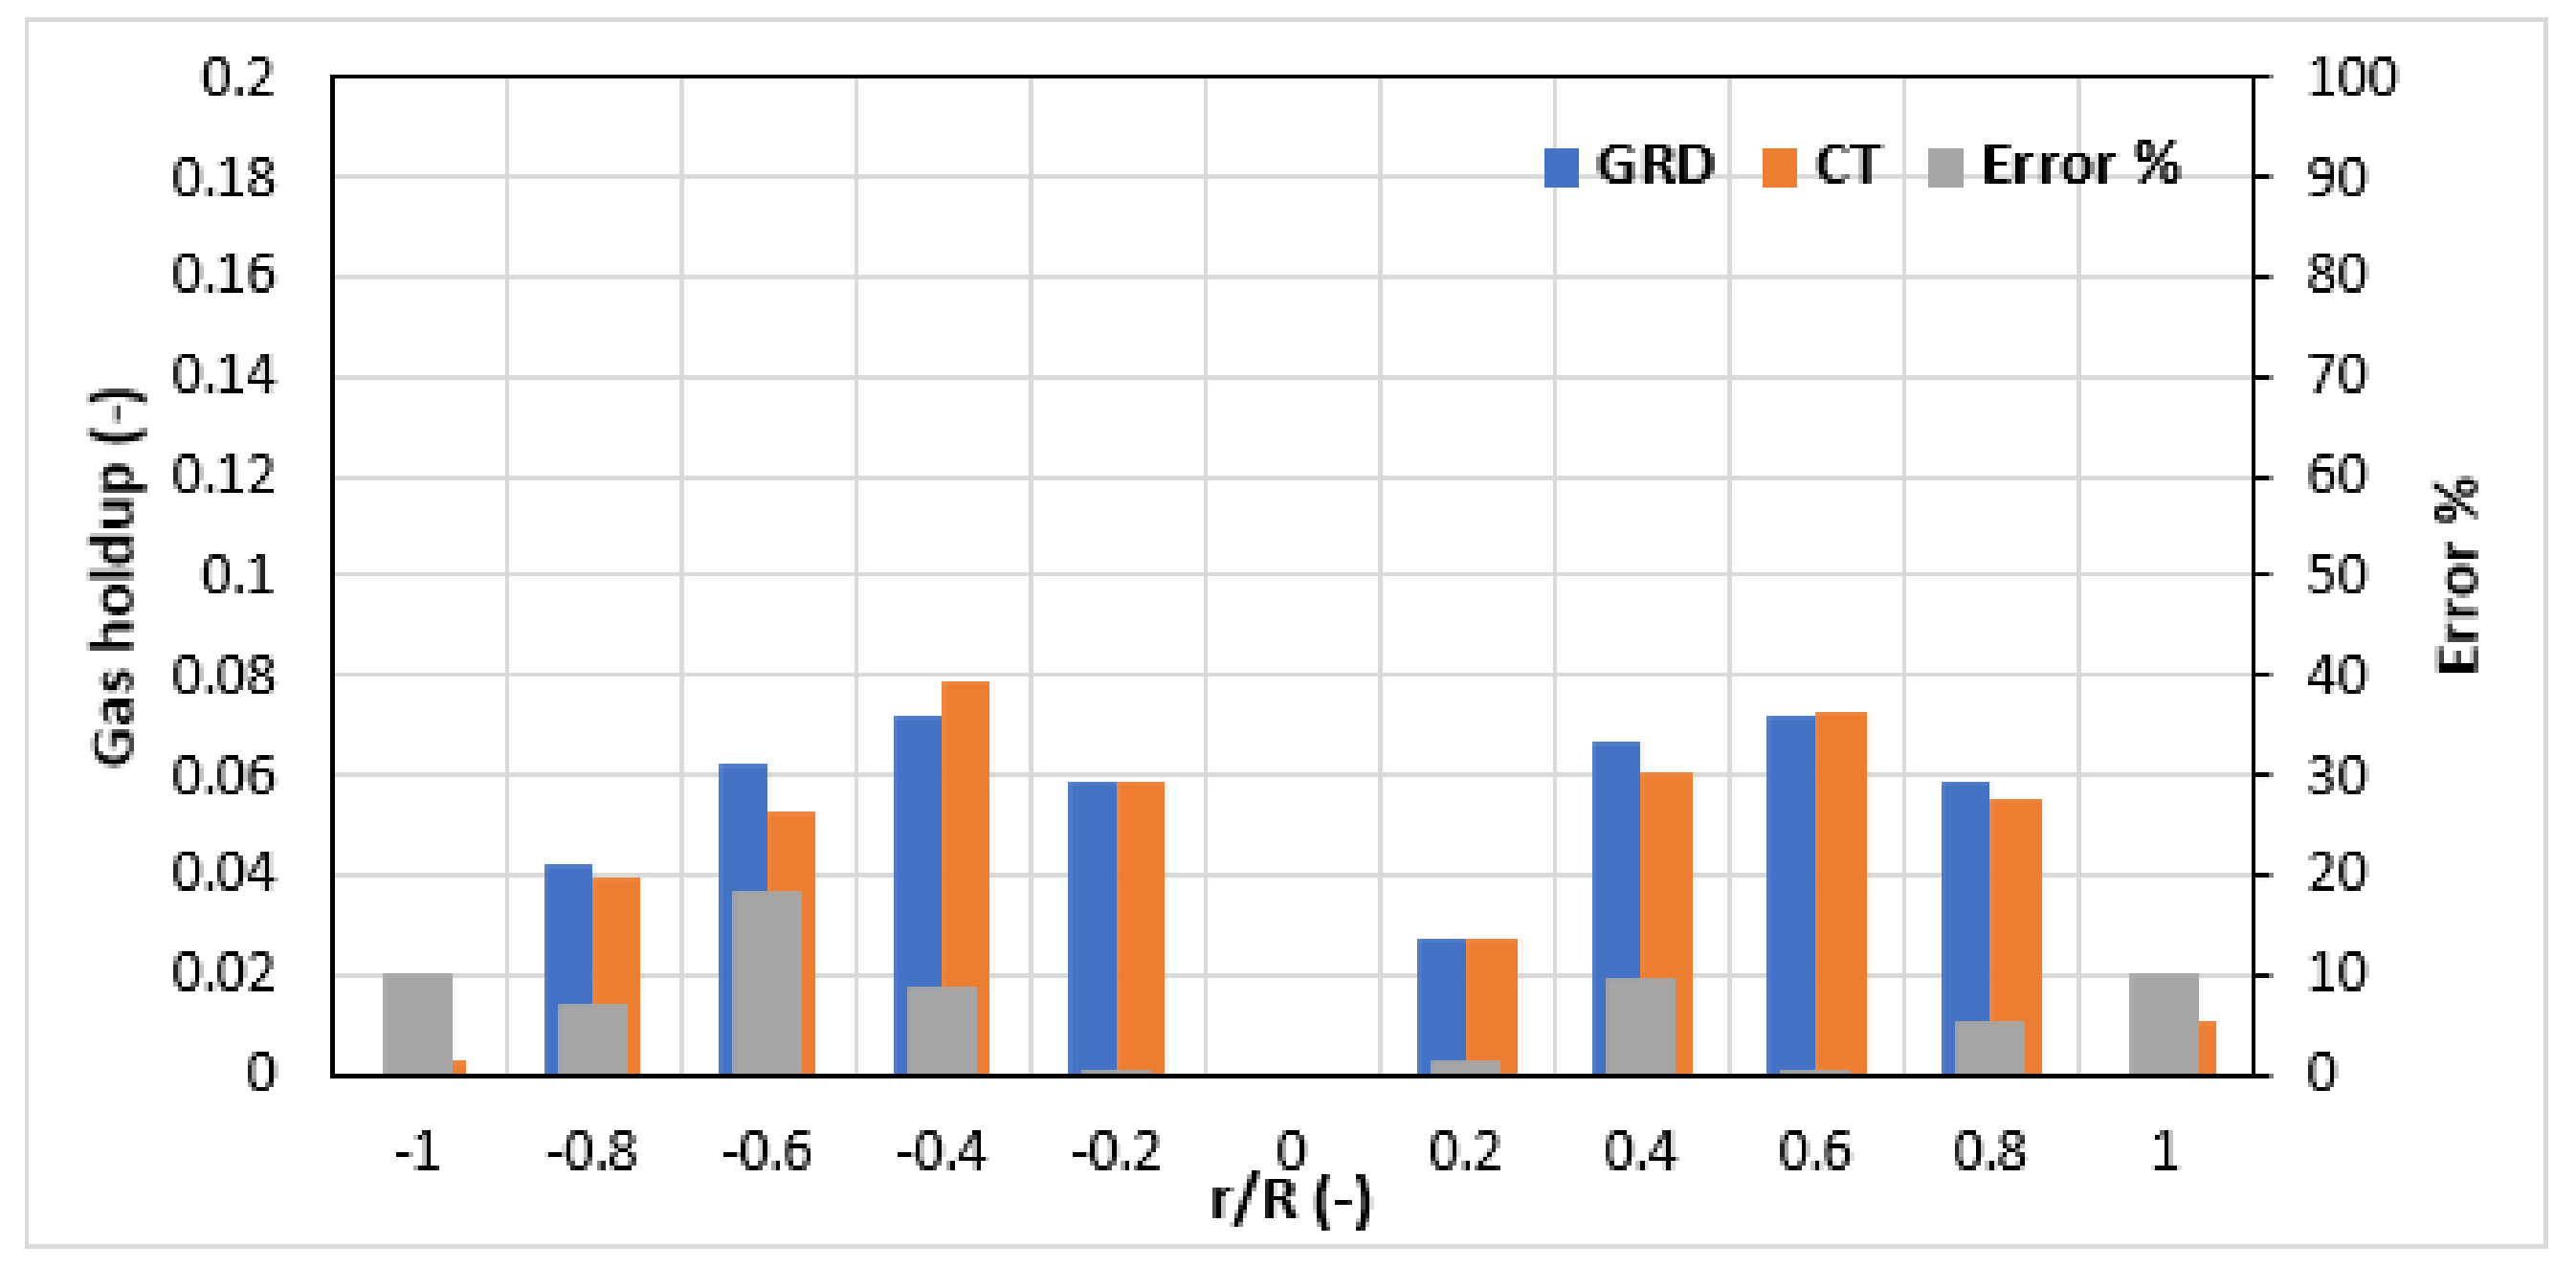
Comparison of GRD results of gas holdup distribution in this investigation with the Computed tomography CT results [14,18,19] (previous studies) is essential for validation and verification this technique. The percentage of error between the values of gas holdup is measured by CT and GRD techniques and calculated by the following equation:
Figure 8 shows these values present an accepted percentage error which have a maximum error value of about 18.5%, with a minimum value of 0.37% for gas holdup distribution at the medial level. There is good agreement in AARD value for this comparison with 7.3%. Therefore, according to this comparison, gas holdup can be measured using the GRD technique with high accuracy and reliability.

Figure 8.
The compression curves between GRD and CT experimental data of the gas holdup and their percentage error at medial section and operated at 3 cm/s (gas velocity).
7. Estimation of the Gas Holdup
With the Beer–Lambert equation, the local gas holdup for the cylindrical split reactor has been calculated, and the intensity of the gamma ray beam emitted by this column can be explained as shown in:
where ratio of transmission, : the intensity of the gamma ray through the reactor (W/m2), is the path length of the gamma ray through the medium (cm), and is the mass attenuation coefficient (cm2/g) of a material. Linear attenuation coefficient (µ, cm−1) value for air is µair = 0.0001 cm−1, for water is µwater = 0.0872 cm−1, and for Plexiglas µPlexiglas = 0.0988 cm−1; the density of Plexiglas is 1.18 g.cm−3.
The term is equal to the integral total of the attenuation measured as it passes through the materials along the beam path. In GRD scanning, some beam paths through the cylindrical split reactor measure attenuations. Each pixel’s total attenuation can be expressed in a two-phase column operating with a superficial gas speed investigated as follows:
because
.
Thus, Equation (4) will be:
because
, Equation (5) can be expressed as follows:
This equation can also be rearranged as follows:
Each pixel can be described as attenuation by, when just water is present in the scanned column (stagnant), .
When Equations (9) is substituted for Equation (8), the result is
Due to this conditional we can neglect , which is the phase’s attenuation induced only by gas (air), so Equation (10) will be:
where is the for each step or pixel, there is a local gas holdup. is the gamma-ray beam that goes across this pixel’s length, is the liquid’s linear attenuation in each pixel (cm−1), and is the gas liquid’s linear attenuation for each pixel (cm1).
8. Results and Discussion
The measurement of the quantity of distribution in local gas holdup is extremely important for scaling up, designing, and implementing the cylindrical split column simulations. In this cylindrical reactor, the significance and impact of the distribution of gas holdup arrives from the reality that the governs flow dynamics characteristics, due to the riser and downcomer sides, which have various gas holdups performance; this causes the liquid to circulate around the reactor column’s zones.
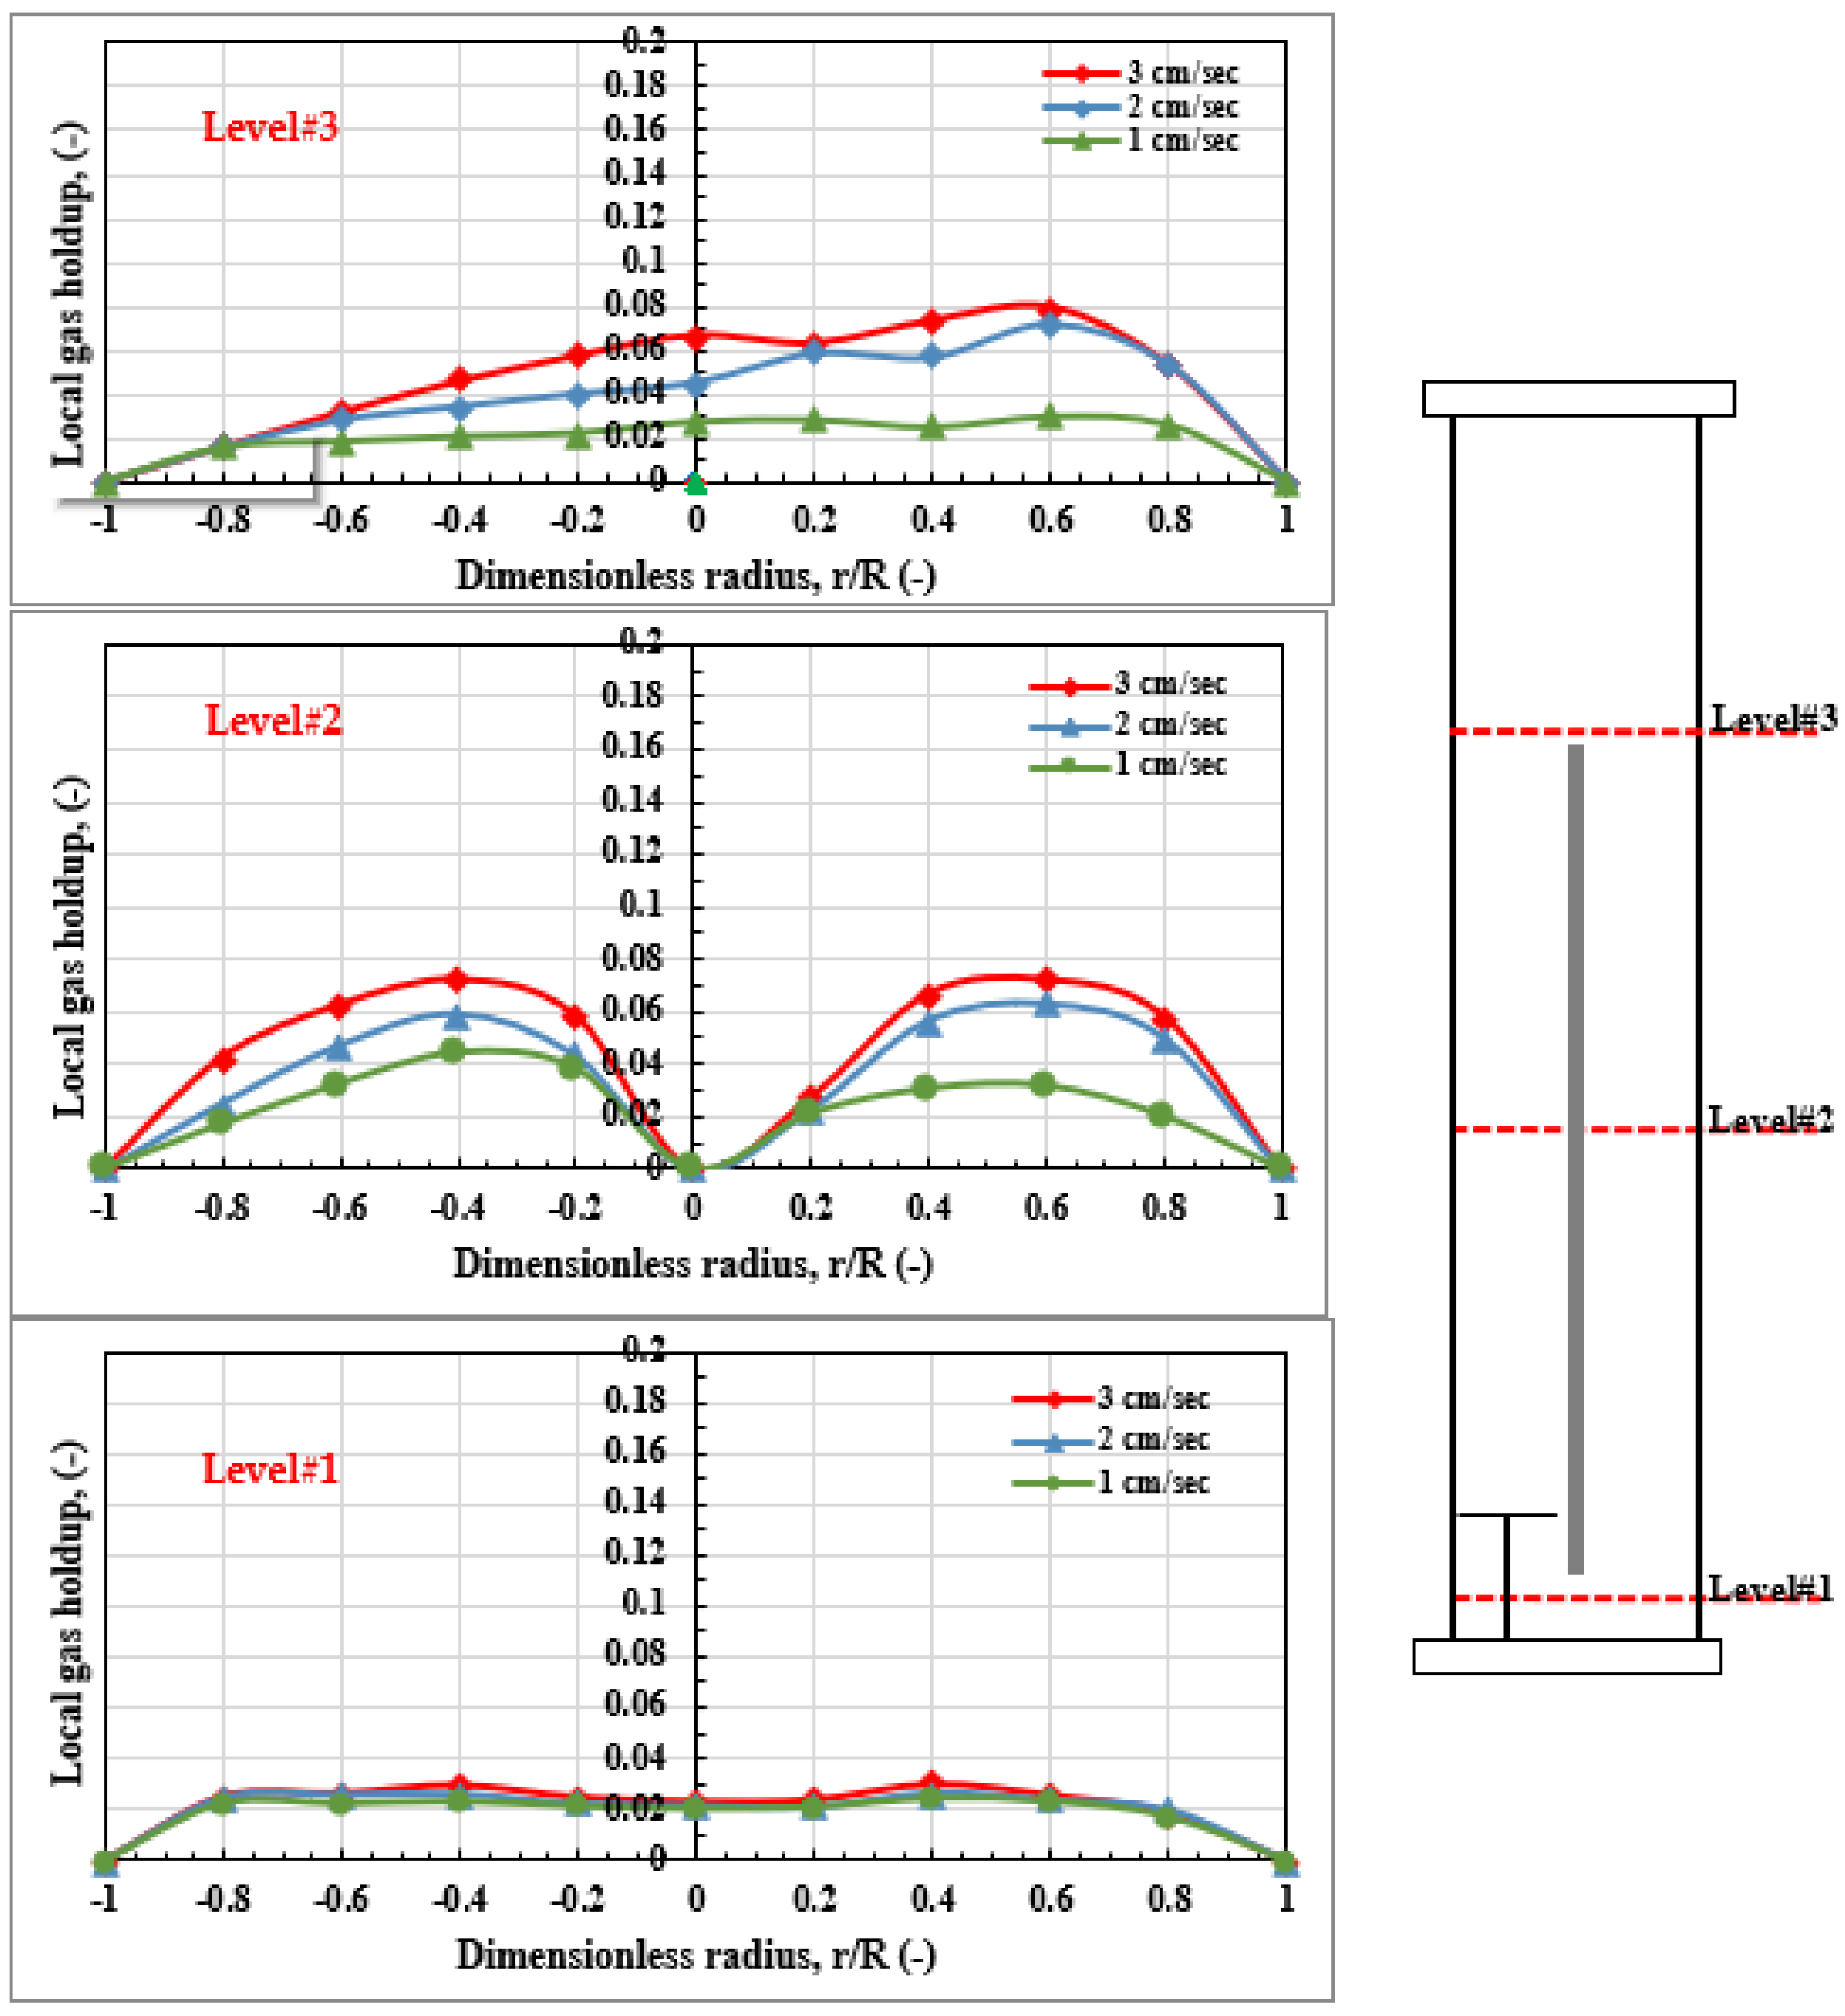
Therefore, GRD scans in this study were conducted through the cross-sectional area of the cylindrical reactor at 3, 60, and 110 cm that represent three various axial heights and 1, 2, and 3 cm/s, which represent a various three gas velocities in order to measure the gas holdup quantity. Figure 9 shows the axial distributions performance of the local gas holdup for all three gas velocities.
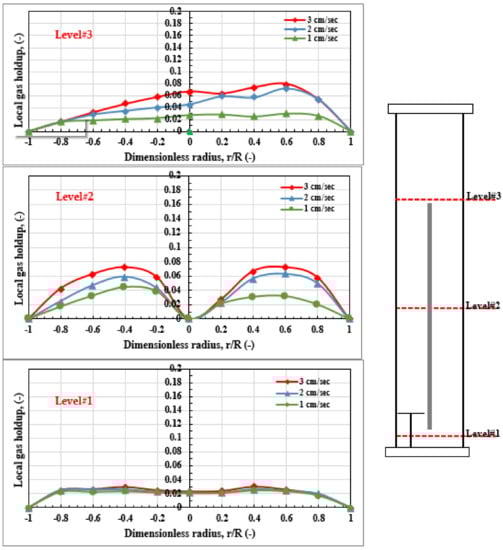
Figure 9.
Redial profile of local gas holdup under different gas velocities at different height level of cylindrical reactor operated.
Level #1 represents a height of 3 cm from the base of this cylindrical column (i.e., below the split plate). The distribution in gas holdup occurs at this section; level #1 presents a uniform distribution of the gas-phase despite the fact that the gas velocity magnitude varies, and the gas holdup magnitude values in this section are nearly comparable. The size of gas holdup was obtained by line averaging its values to compute such performance at this level, as shown in Figure 9. Clearly, this chart depicts the profiles of gas holdup, and the quantities are nearly identical. For example, 10.6% is the difference in percentage of average gas holdup amounts between 1 and 2 cm/s gas velocity, whereas 7.3 percent is the difference between 1 and 3 cm/s gas velocity.
The values of gas holdup are convergent at this section because there is more liquid available here than in other parts of the split column, where the liquid is forced vigorously to the riser area due to the short distance between the split plate end and the bottom base of the column. At a distance of 110 cm, named level #3, however, the distribution of gas holdup is nonuniform, with the right side of the column (i.e., the downcomer region) tending to have more gas than the left side (i.e., rise region of the column), indicating liquid circulation. This is explained by the fact that a portion of the gas bubbles separates from the liquid phase at the top of the split plate (on the left side) and flows to the right, then to the downcomer area. Other researchers have also reported similar behavior [7,12,20].
The rapid movement of gas bubbles toward the column wall, due to the high liquid velocity, is the cause of this non uniformity in gas holdup distribution at this level. Furthermore, as seen in Figure 9 (level #3), the gas holdup values and its magnitude substantially increases, in this section, the amplitude of surface gas velocities increases. The average proportion of gas holdup profiles varies by 137.3 percent between gas velocity 1 and 3 cm/s, for example. The gas and liquid distribution in this region (i.e., the riser zone on the left side of the column) and the downcomer zone is clearly visible in the GRD scan in 60 cm (i.e., above the gas sparger, level #2) axial height (right side column). These results (at axial level 2 and at gas velocities of 1, 2, and 3 cm/s) show that the gas sparger may discharge the gas phase virtually equally, with increased gas concentration in the riser region’s midpoint and less gas holdup on the downcomer side. Figure 9, level #2, shows gas hold forms with varied gas velocities were used to quantify this phenomenon.
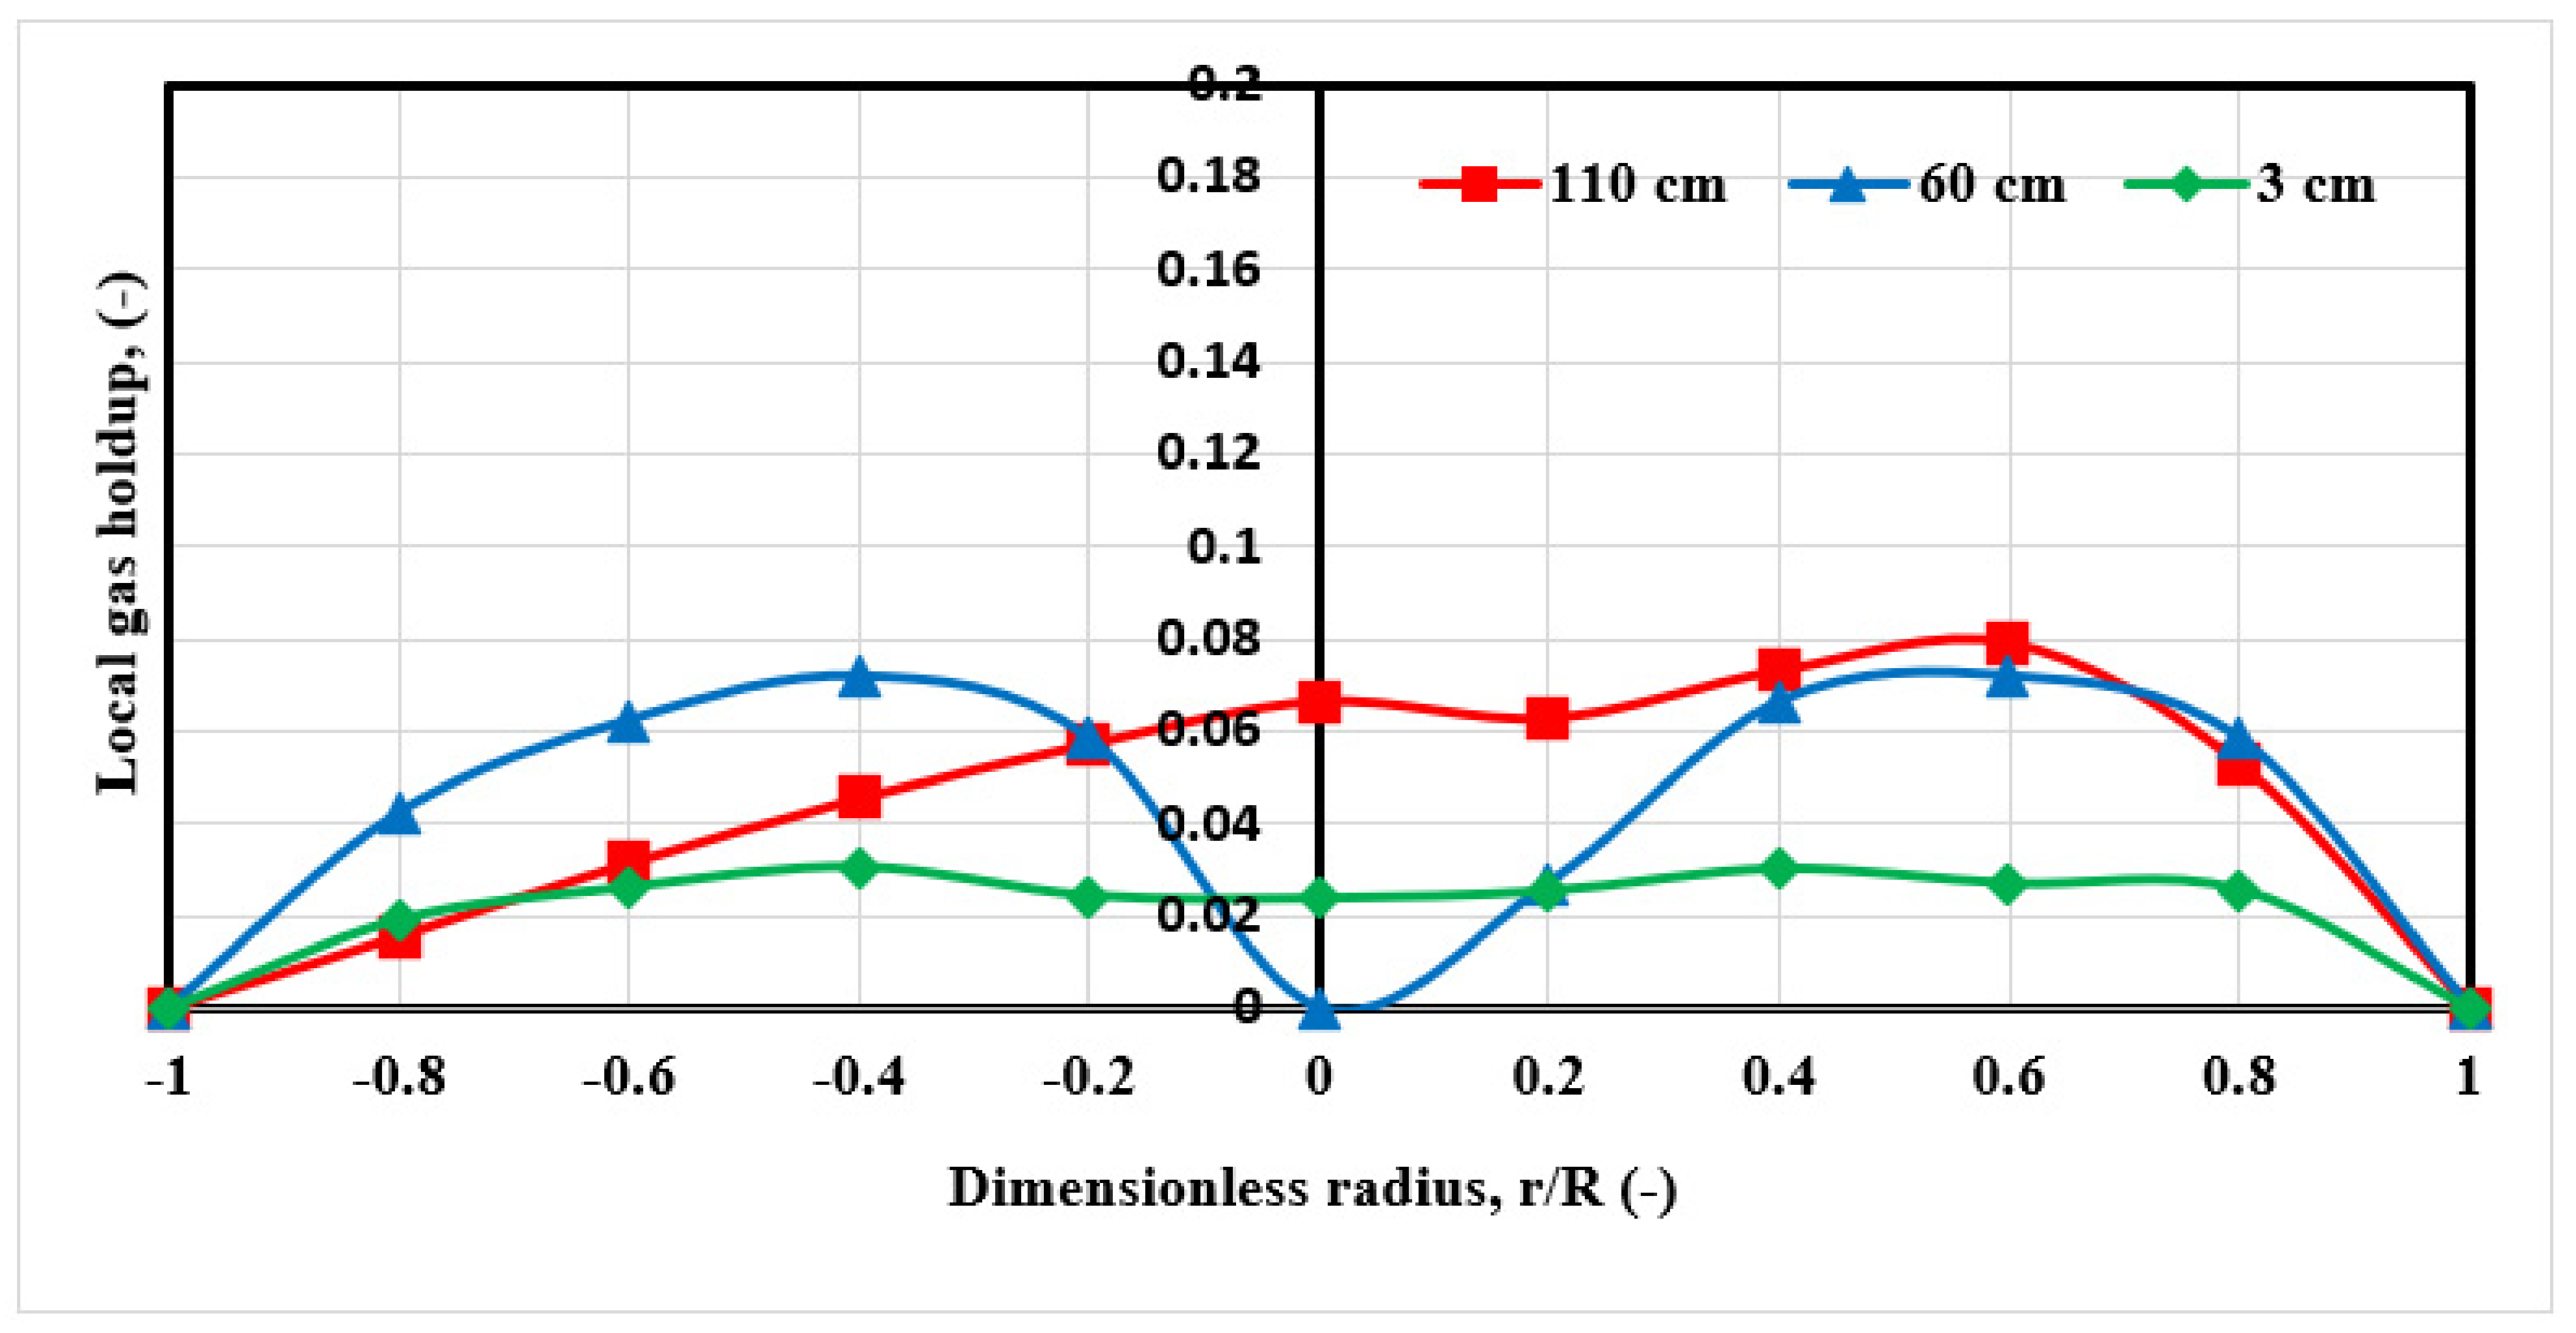
The gas holdup distribution occurs along the split reactor column height clearly in the riser and downcomer zones; the evolution of gas–liquid distributions was captured. Figure 10 show similar gas-phase distribution tendencies with varying magnitudes under different ranges of surface gas velocities. It is worth noting that the GRD scan approach was able to identify the (fully) established flow area, which was visible at axial levels of 60 cm (level #2), where the gas and liquid were uniformly dispersed.
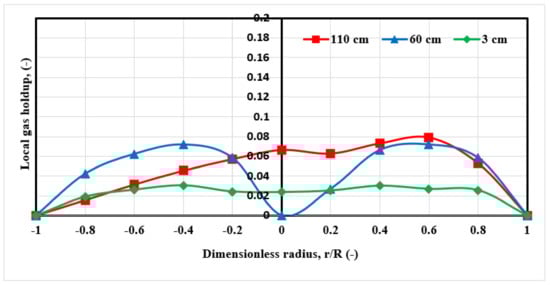
Figure 10.
Profiles of local gas holdup at different height of split airlift reactor operated under 3 cm/s gas velocities.
Furthermore, Figure 9 shows the profiles of gas holdup at the observed superficial gas velocities. Except in the fully formed flow sector, the profiles of gas holdup were clearly dependent on column height. The development of hydrodynamic models and simulations will be aided by obtaining gas holdup distributions along the split airlift reactor and its cross-sectional area, which will be validated using the newly obtained results. Engineers will benefit from validated models or simulations in designing, scaling up, or even analyzing the performance of this type of reactor in order to advance the microalgae cultivation sector, which thinks a cylindrical airlift reactor is the best alternative for this application.
9. Remarks
In this investigation, the local gas holdup results for gas–liquid system (air-water) were considered in a cylindrical split column by using a state-of-the-art noninvasive (GRD) technique (Gamma-ray densitometry). The objectives of this study were accomplished by doing a various experiment with this parameter.
The distribution in radial profiles of local gas-holdup was displayed with three different length levels of the cylindrical column were concentrate and explained with three different gas velocity. A comprehensive knowledge and understanding, required for reaching an efficient performance, will be obtained from all this information, as well as providing a benchmark and reliable database with CFD validate model. The consequences of this investigation can be represented briefly as follows:
- To determine the gas–liquid motions and behaviors in such a split reactor, a sophisticated gamma-ray densitometry GRD technique was used. It was found that this technique has the capability to perform a scan inside the lab or outside filed (industries field), which is more flexible than the other techniques like computed tomography CT and radioactive particle tracking RPT technique in these kinds of measurements;
- The radial profiles distribution of local gas holdup was clearly shown in r-z projection. The outcomes in the velocities of gas that starting with 1–3 cm/s represent a clear variation in magnitude of local gas holdup distributions. These results at gas velocity 3 cm/s shown a high behavior in all regions inside the cylinder split column which are related to high gas spreading;
- In this cylindrical internal-loop column, the flow structure was considerably influenced by adding a Plexiglas plate (split internal), which distributed flow to the left and right sides, and also upper and lower regions inside the cylindrical column. This internal plate provides respectable gas and liquid circulation performance and movements in all column zones which have a suitable influence in such columns, particularly with 3 cm/s.
Author Contributions
Conceptualization, L.S.S., A.J.S. and M.H.A.-D.; methodology, L.S.S., A.J.S.; software, L.S.S., A.J.S. and S.K.J.; validation, L.S.S., A.J.S. and S.K.J.; formal analysis, L.S.S., A.J.S.; investigation, L.S.S., A.J.S.; resources, L.S.S., A.J.S.; data curation, L.S.S., A.J.S. and S.K.J.; writing—original draft preparation, L.S.S. and A.J.S.; writing—review and editing, L.S.S. and A.J.S.; visualization, L.S.S., S.K.J. and A.J.S.; supervision, M.H.A.-D.; project administration, L.S.S. and A.J.S.; funding acquisition, H.S.M. All authors have read and agreed to the published version of the manuscript.
Funding
This research received no external funding.
Institutional Review Board Statement
Not applicable.
Informed Consent Statement
Not applicable.
Data Availability Statement
Not applicable.
Acknowledgments
The authors would like to acknowledge the financial aid provided by Al-Mustaqbal University College, Ministry of Higher Education Iraq and the Higher Committee for Education Development in Iraq (HCED).
Conflicts of Interest
The authors declare no conflict of interest.
References
- Rosa, E.A.R.; Bianchini, L.F.; da Silva Ramos, R.C.P.; Arantes, A.B.; da Silva, R.F.; Glassey, J. Hydrodynamics of split-rectangle-internal loop airlift bioreactor with variations in riser and downcomer cross-sectional areas based on the golden ratio. J. Chem. Technol. Biotechnol. 2019, 94, 1323–1329. [Google Scholar] [CrossRef]
- Esperança, M.N.; Béttega, R.; Badino, A.C. Effect of geometric design on performance of square cross-section concentric-duct and split airlift bioreactors. Can. J. Chem. Eng. 2017, 95, 2324–2332. [Google Scholar] [CrossRef]
- Sabri, L.S.; Sultan, A.J.; Al-Dahhan, M.H. Mapping of microalgae culturing via radioactive particle tracking. Chem. Eng. Sci. 2018, 192, 739–758. [Google Scholar] [CrossRef]
- Zhang, T.; We, C.; Ren, Y.; Feng, C.; Wu, H. Advances in airlift reactors: Modified design and optimization of operation conditions. Rev. Chem. Eng. 2017, 33, 163–182. [Google Scholar] [CrossRef]
- Sabri, L.S.; Sultan, A.J.; Al-Dahhan, M.H. Assessment of RPT calibration need during microalgae culturing and other biochemical processes. In Proceedings of the 2017 International Conference on Environmental Impacts of the Oil and Gas Industries: Kurdistan Region of Iraq as a Case Study (EIOGI), Koya-Erbil, Iraq, 17–19 April 2017; pp. 59–64. [Google Scholar] [CrossRef]
- Ojah, A.; Sabri, L.S.; Aldahhan, M.H. Local volumetric mass transfer coefficient estimation for Scenedesmus microalgae culture in a cylindrical airlift photobioreactor. J. Chem. Technol. Biotechnol. 2021, 96, 764–774. [Google Scholar] [CrossRef]
- Sabri, L.S.; Ojha, A.; Sultan, A.J.; Aldahhan, M.H. Integration of dynamic growth modeling and hydrodynamics in an internal-loop split photobioreactor. J. Chem. Technol. Biotechnol. 2022, 97, 1112–1127. [Google Scholar] [CrossRef]
- Luo, H.P.; Al-Dahhan, M.H. Macro-mixing in a draft-tube airlift bioreactor. Chem. Eng. Sci. 2008, 63, 1572–1585. [Google Scholar] [CrossRef]
- Fernandes, B.D.; Mota, A.; Ferreira, A.; Dragone, G.; Teixeira, J.A.; Vicente, A.A. Characterization of split cylinder airlift photobioreactors for efficient microalgae cultivation. Chem. Eng. Sci. 2014, 117, 445–454. [Google Scholar] [CrossRef] [Green Version]
- Ojha, A.; Al-Dahhan, M. Local gas holdup and bubble dynamics investigation during microalgae culturing in a split airlift photobioreactor. Chem. Eng. Sci. 2018, 175, 185–198. [Google Scholar] [CrossRef]
- Laith, S.S. Characterization of the Cylindrical Split Internal-Loop Photobioreactor with Scenedesmus Microalgae: Advanced Culturing, Modeling, and Hydrodynamics. Ph.D. Thesis, Missouri University of Science and Technology, Rolla, MO, USA, 2018. Available online: http://scholarsmine.mst.edu/cgi/viewcontent.cgi?article=3733&context=doctoral_dissertations (accessed on 14 April 2022).
- Merchuk, B.J.C. Airlift Bioreactors: Review of Recent Advances. Can. J. Chem. Eng. 2003, 81, 324–337. [Google Scholar] [CrossRef]
- Ganzeveld, K.J.; Chisti, Y.; Moo-Young, M. Hydrodynamic behavior of animal cell microcarrier suspensious in split-cylinder airlift bioreactors.pdf. Bioprocess Eng. 1995, 12, 239–247. [Google Scholar] [CrossRef]
- Sabri, L.S.; Sultan, A.J.; Al-Dahhan, M.H. Split internal-loop photobioreactor for Scenedesmus sp. microalgae: Culturing and hydrodynamics. Chin. J. Chem. Eng. 2021, 33, 236–248. [Google Scholar] [CrossRef]
- Jasim, A.A.; Sultan, A.J.; Al-Dahhan, M.H. Influence of heat-exchanging tubes diameter on the gas holdup and bubble dynamics in a bubble column. Fuel 2019, 236, 1191–1203. [Google Scholar] [CrossRef]
- Chen, J.; Rados, N.; Al-dahhan, M.H.; Dudukovic, M.P.; Nguyen, D.; Parimi, K. Particle Motion in Packed/Ebullated Beds by CT and CARPT. AIChE J. 2001, 47, 994–1004. [Google Scholar] [CrossRef]
- Roy, S.; Kemoun, A.; Al-Dahhan, M.H.; Dudukovic, M.P.; Skourlis, T.B.; Dautzenberg, F.M. Countercurrent flow distribution in structured packing via computed tomography. Chem. Eng. Process. Process. Intensif. 2005, 44, 59–69. [Google Scholar] [CrossRef]
- Sabri, L.S.; Sultan, A.J.; Majdi, H.S.; Jebur, S.K.; Al-Dahhan, M.H. A Detailed Hydrodynamic Study of the Split-Plate Airlift Reactor by Using Non-Invasive Gamma-Ray Techniques. ChemEngineering 2022, 6, 18. [Google Scholar] [CrossRef]
- Sultan, A.J.; Sabri, L.S.; Shao, J.; Al-Dahhan, M.H. Corrigendum to: Overcoming the gamma-ray computed tomography data processing pitfalls for bubble column equipped with vertical internal tubes. Can. J. Chem. Eng. 2019, 97, 2979. [Google Scholar] [CrossRef]
- Shaikh, A.; Al-Dahhan, M. A new method for online flow regime monitoring in bubble column reactors via nuclear gauge densitometry. Chem. Eng. Sci. 2013, 89, 120–132. [Google Scholar] [CrossRef]

Publisher’s Note: MDPI stays neutral with regard to jurisdictional claims in published maps and institutional affiliations. |
© 2022 by the authors. Licensee MDPI, Basel, Switzerland. This article is an open access article distributed under the terms and conditions of the Creative Commons Attribution (CC BY) license (https://creativecommons.org/licenses/by/4.0/).