Article

Determination of Gefitinib Using Routine and Greener Stability-Indicating HPTLC Methods: A Comparative Evaluation of Validation Parameters

1
Department of Pharmacognosy, College of Pharmacy, Prince Sattam Bin Abdulaziz University, Al-Kharj 11942, Saudi Arabia
2
Department of Pharmaceutics, College of Pharmacy, King Saud University, Riyadh 11451, Saudi Arabia
3
Department of Pharmacy Practice, College of Pharmacy, AlMaarefa University, Ad Diriyah 13713, Saudi Arabia
*
Author to whom correspondence should be addressed.
Processes 2022, 10(4), 762; https://doi.org/10.3390/pr10040762
Submission received: 29 March 2022 / Revised: 8 April 2022 / Accepted: 11 April 2022 / Published: 13 April 2022

Abstract

:
“High-performance thin-layer chromatography (HPTLC)” methods for gefitinib (GFT) estimation are scarce in the literature. In addition, greener analytical techniques for GFT estimation are also lacking in the literature. Accordingly, an attempt was undertaken to invent and validate a sensitive and greener normal-phase HPTLC method for GFT analysis in commercial tablets in comparison to the routine normal-phase HPTLC method. The greenness index for both methods was assessed using “Analytical GREENness (AGREE)” methodology. GFT detection was carried out using both methods at 332.0 nm. In the 30–700 ng/band and 20–1400 ng/band ranges, the routine and greener HPTLC assays were linear for GFT estimation. The greener HPTLC method was highly sensitive, more accurate, more precise, and more robust than the routine HPTLC assay for GFT estimation. Both methods were able to detect GFT in the presence of its degradation products, suggesting the stability-indicating property of both methods. The assay of GFT in commercial tablets was 92.45% and 99.74% using the routine and greener HPTLC assays, respectively. The AGREE index for routine and greener analytical assays was predicted to be 0.44 and 0.77, respectively, indicating the excellent greenness index of the greener HPTLC assay over the routine HPTLC assay. The greener HPTLC assay is considered superior to the routine HPTLC assay based on these results.

1. Introduction

Gefitinib (GFT) is a selective tyrosine kinase inhibitor, which is used in the treatment of non-small cell lung carcinoma (NSCLC) by targeting the epidermal growth factor receptor (EGFR) [1,2]. EGFR has over expression in various solid tumors, which includes lung, colon, breast, brain, and ovarian tumors [3,4,5]. GFT was approved as the first-line treatment for NSCLC by the United States Food and Drug Administration (USFDA) in 2015 [6,7]. It has been reported as practically insoluble in water and aqueous buffers, slightly soluble in methanol, ethanol, isopropanol, 1-butanol, ethylene glycol, and propylene glycol, sparingly soluble in 2-butanol, soluble in Carbitol and polyethylene glycol-400, and freely soluble in dimethyl sulfoxide at an ambient temperature [8,9]. GFT is available in the form of tablets (dose: 250 mg/day) on the market, which is sold under the trade name of Iressa® [6,9]. Hence, the qualitative and quantitative standardization of GFT is important in its commercial formulations.
The literature survey demonstrated different analytical assays of GFT estimation in commercial formulations and biological samples. For the estimation of GFT in its bulk drug and dosage forms, visible spectrometry and derivative spectrometry assays have been reported [10,11]. Different “high-performance liquid chromatography (HPLC)” techniques have also been used for the detection of GFT in its bulk form and pharmaceutical formulations [12,13,14,15]. An HPLC method has also been applied for the estimation of GFT process-related impurities [16]. A voltammetry technique has also been used for GFT estimation in pharmaceutical formulations and urine samples [17]. A system-biology-based in silico analysis was applied for the identification of off-targets of GFT [18]. Various “liquid chromatography mass spectrometry (LC-MS)” methods have been used to measure GFT in mouse and human plasma samples [19,20,21,22,23]. An ultra-performance liquid chromatography (UPLC) technique was also used for the GFT analysis in human plasma samples [24]. Iron-oxide-based magnetic nanoparticles were also utilized to estimate GFT in water and human plasma samples [25]. A wide range of analytical methods for GFT detection was found in published reports. However, none of the reported methods’ greenness indices were assessed. In addition, no GFT estimation has been recorded using the routine or greener “high-performance thin-layer chromatography (HPTLC)” assays. Various quantitative techniques have been reported for determining the greenness indices [26,27,28,29,30]. For the assessment of greenness index, only the “Analytical GREENness (AGREE)” methodology utilizes all twelve components of “green analytical chemistry (GAC)” [28]. Accordingly, the AGREE approach was used to evaluate the current HPTLC techniques’ greenness indices [28].
The purpose of the present study is to invent and validate a normal-phase HPTLC technique for GFT measurement in marketed tablets that is more precise, robust, sensitive, and greener than the routine normal-phase HPTLC assay. Using “The International Council for Harmonization (ICH)” Q2-R1 guidelines, routine and greener HPTLC assays for GFT estimation were validated [31].

2. Materials and Methods

2.1. Materials

The standard GFT was obtained “Beijing Mesochem Technology (Beijing, China)”. The HPLC-grade solvents such as ethanol (EOH), methanol (MOH), cyclohexane (CYH), and chloroform (Ch) were obtained “E-Merck (Darmstadt, Germany)”. GFT (Teressa®) marketed tablet dosage forms were obtained from a pharmacy in Riyadh, Saudi Arabia. The rest of the materials were of analytical reagent grade.

2.2. Instrumentation and Chromatographic Procedures

The “HPTLC CAMAG TLC system (CAMAG, Muttenz, Switzerland)” was utilized for the GFT estimation in marketed tablet dosage forms. The obtained samples were applied as 6 mm bands with the help of a “CAMAG Automatic TLC Sampler 4 (ATS4) Sample Applicator (CAMAG, Geneva, Switzerland)”. The “CAMAG microliter Syringe (Hamilton, Bonaduz, Switzerland)” was linked with the sample applicator. The TLC plates were “glass plates (plate size: 10 × 20 cm) pre-coated with normal-phase silica gel (particle size: 5 µm) 60F254S plates”. The application rate for GFT estimation was fixed to 150 nL/s. The HPTLC plates were developed in a “CAMAG automated developing chamber 2 (ADC2) (CAMAG, Muttenz, Switzerland)” with a spacing of 80 mm using linear ascending mode. The development chamber was saturated with the vapors of respective mobile phases for 30 min at 22 °C. A wavelength of 332 nm was used to detect GFT. The scanning rate and slit dimension were both set to 20 mm/s and 4 × 0.45 mm2, respectively. For each estimation, three or six replicates were used. “WinCAT’s (version 1.4.3.6336, CAMAG, Muttenz, Switzerland)” was the program utilized.
The same instrumentation and analytical settings were utilized in both analytical methods. The mobile phase compositions were the most significant differences between routine and greener procedures. The optimized mobile phase in the routine HPTLC assay was Ch/MOH (85:15, v/v), whereas the optimized mobile phase was EOH/CYH (80:20, v/v) in the greener HPTLC assay.

2.3. Calibration Curves and Quality Control (QC) Sample for GFT

The needed amount of GFT was dispensed into the provided volume of mobile phase, providing a stock solution with a GFT concentration of 100 µg/mL. GFT concentrations in the 30–700 ng/band range were produced using the routine HPTLC assay, whereas concentrations in the 20–1400 ng/band range were produced using the greener HPTLC assay, which involved diluting varying amounts of GFT stock solution with the corresponding mobile phase. An amount of 200 µL of each concentration of GFT was spotted to TLC plates for routine and greener HPTLC assays. The spot area of each GFT concentration was measured using both assays. GFT calibration curves were produced by plotting measured spot area vs. GFT concentrations in six replicates (n = 6). Three different QC samples were freshly produced for the evaluation of various validation parameters.

2.4. Sample Preparation for the Determination of GFT in Marketed Tablet Dosage Forms

The average weight of ten marketed tablets (each having 250 mg of GFT) was calculated. Using a glass pestle and mortar, the GFT-containing marketed tablets were crushed and finely powdered. MOH was used to extract a weight of powder equivalent to 250 mg of GFT. The MOH was evaporated, and the residue was dispensed separately in 100 mL MOH in a volumetric flask. This process was repeated three times in total. This sample was used as a test sample for both assays of estimating GFT in the marketed tablets.

2.5. Validation Studies

Routine and greener HPTLC assays for the estimation of GFT were validated for various parameters using the ICH-Q2-R1 guidelines [31]. GFT linearity was assessed by graphing measured spot area against GFT concentrations. The linearity of the routine HPTLC assay for GFT estimation was assessed in the 30–700 ng/band range (n = 6). GFT linearity was assessed in the 20–1400 ng/band range (n = 6) using the greener analytical assay.
The determination of “retardation factor (Rf), asymmetry factor (As), and theoretical plates number/meter (N/m)” was utilized to determine the parameters for the system suitability for routine and greener HPTLC assays for the estimation of GFT. For both assays, the “Rf, As, and N/m” data were determined using their standard formulae [30].
The accuracy of routine and greener HPTLC assays for estimating GFT was evaluated using percent recovery analysis. GFT was evaluated at three QC levels: low QC (LQC; 50 ng/band), middle QC (MQC; 400 ng/band), and high QC (HQC; 700 ng/band) to observe how accurate the routine HPTLC assay was. GFT was also evaluated at three QC levels: LQC (50 ng/band), MQC (400 ng/band), and HQC (1400 ng/band) to observe how accurate the greener HPTLC assay was. The percent of recovery for GFT was calculated using both assays at each QC level (n = 6).
For GFT, the intra/inter-assay precision of routine and greener HPTLC assays was studied. The intra-assay precision for GFT was studied using the estimation of freshly prepared GFT solutions at LQC, MQC, and HQC on the same day for both assays (n = 6). GFT inter-assay precision was studied using the estimation of freshly prepared GFT solutions at the same QC levels on three different days for both assays (n = 6).
The robustness of GFT was evaluated for both assays by introducing some planned adjustments to the mobile phase components. The routine mobile phase Ch/MOH (85:15, v/v) for GFT was modified to Ch/MOH (87:13, v/v) and Ch/MOH (83:17, v/v) for the routine HPTLC assay, and the variations in TLC response and Rf values were recorded (n = 6). For the greener HPTLC experiment, the greener mobile phase EOH/CYH (80:20, v/v) was changed to EOH/CYH (82:18, v/v) and EOH/CYH (78:22, v/v), and the variations in TLC response and Rf values were recorded (n = 6).
Utilizing a “standard deviation technique”, the sensitivity of routine and greener HPTLC assays for GFT was determined as “limit of detection (LOD) and limit of quantification (LOQ)”. GFT “LOD and LOQ” were calculated using their reported formulae for both assays (n = 6) [31].
The Rf values and ultra-violet (UV) spectra of GFT in marketed tablets were compared to those of standard GFT to evaluate the selectivity of routine and greener HPTLC assays for GFT.

2.6. Forced Degradation Studies

Under acid, basic, oxidative, and thermal stress conditions, the forced degradation of routine and greener HPTLC techniques were evaluated [30,32]. The MQC of GFT (400 ng/band) was subjected to 1M HCl (acid), 1M NaOH (base), 30% v/v H2O2 (oxidative), and a hot air oven at 55 °C for 24 h (thermal) for this investigation. The detailed procedures as reported in our previous publication were used for these investigation [32]. For routine and greener HPTLC procedures, GFT chromatograms were obtained and analyzed for decomposition products under different stress levels.

2.7. Application of Routine and Greener HPTLC Assays in the Determination of GFT in Marketed Tablets

For routine and greener HPTLC assays, the prepared samples of marketed tablets were spotted on normal-phase TLC plates, and the peak areas for GFT were measured (n = 3). For both assays, the quantity of GFT in marketed tablets was determined using the calibration curve of GFT.

2.8. Greenness Estimation

The AGREE approach [28] was utilized to determine the greenness index for routine and greener HPTLC assays for GFT estimation. The AGREE indices (0.0–1.0) for routine and greener HPTLC assays were obtained using “AGREE: The Analytical GREENness Calculator (version 0.5, Gdansk University of Technology, Gdansk, Poland, 2020)”.

3. Results and Discussion

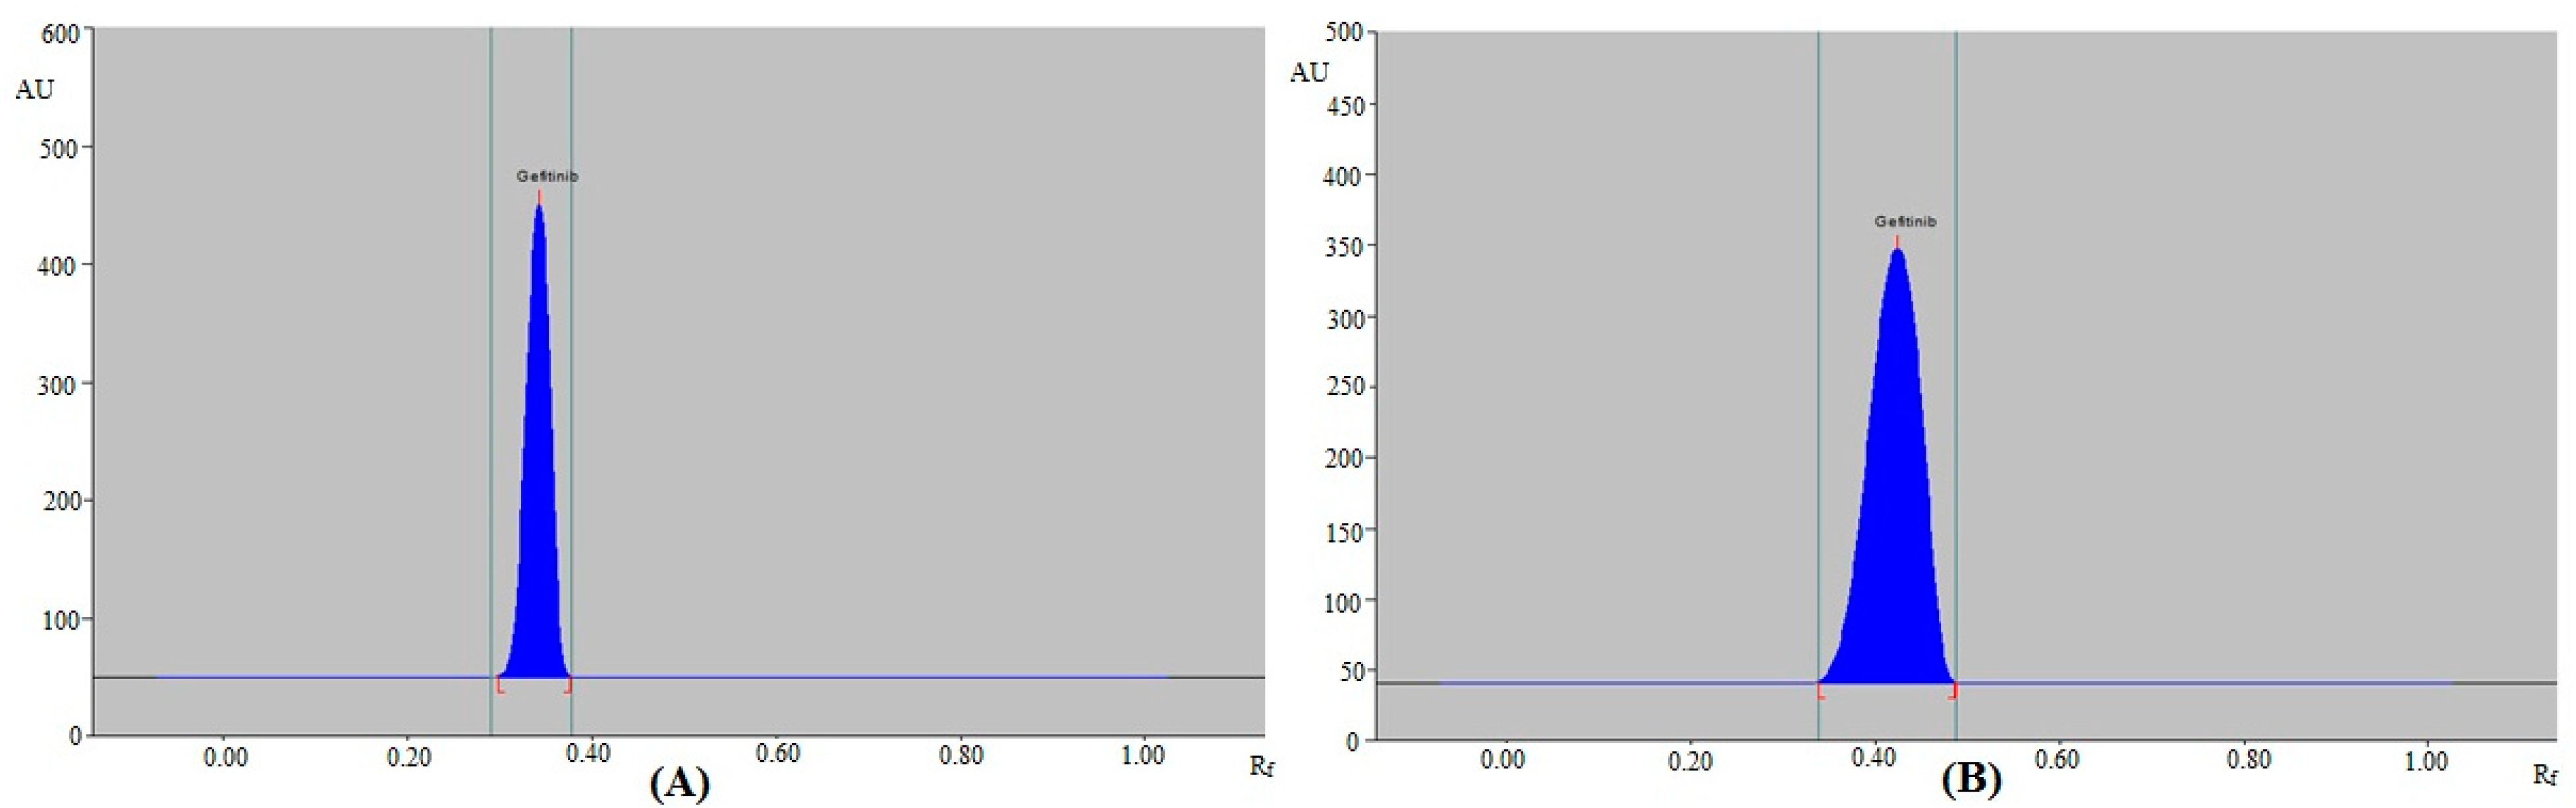
3.1. Method Development and Optimization

The system suitability parameters for routine and greener analytical assays are included in Table 1. For GFT estimation, the “Rf, As, and N/m” for the routine analytical assay were found to be acceptable. For GFT estimation, the “Rf, As, and N/m” for the greener analytical assay were also acceptable.
For the GFT estimation by the routine HPTLC assay, various Ch/MOH concentrations within the 45–90% Ch range were investigated as the routine mobile phases. The mobile phase compositions and various chromatographic parameters are summarized in Table 1. The results obtained showed that the routine mobile phase Ch/MOH (85:15, v/v) offered a well-resolved and intact chromatographic peak for GFT at Rf = 0.3600 ± 0.0100 (Figure 1A). GFT was also predicted to have As values of 1.040 ± 0.0200, which are suitable for GFT analysis. As a result, the Ch/MOH (85:15, v/v) was chosen as the final mobile phase for GFT estimation using the routine HPTLC assay.
For the GFT estimation using the greener HPTLC assay, various EOH/CYH concentrations within the 45–90% EOH range were investigated as the greener solvent systems. The mobile phase compositions and various chromatographic parameters for the greener analytical assay are also included in Table 1. The results obtained showed that the EOH/CYH (80:20, v/v) offered a well-resolved and intact chromatographic peak of GFT at Rf = 0.4300 ± 0.0100 (Figure 1B). GFT was also predicted to have As values of 1.080 ± 0.0200, which was suitable for GFT estimation. As a consequence, the EOH/CYH (80:20, v/v) was selected as the final greener mobile phase for GFT estimation using the greener HPTLC assay. The maximum TLC response was recorded at 332.0 nm for GFT when the spectral bands for GFT were evaluated under densitometry mode. As a consequence, the whole GFT estimation took place at 332.0 nm.

3.2. Validation Studies

Various factors for GFT estimation were evaluated using the ICH-Q2-R1 recommendations [31]. Table 2 summarizes the findings of the linear regression analysis of GFT calibration curves using both procedures. For the routine HPTLC assay, the GFT calibration curve was linear in the range of 30–700 ng/band. For the greener analytical method, the GFT calibration curve was linear in the range of 20–1400 ng/band. For the routine HPTLC experiment, GFT’s determination coefficient (R2) and regression coefficient (R) were 0.9945 and 0.9972, respectively. GFT’s R2 and R were 0.9964 and 0.9981, respectively, for the greener HPTLC assay. These data showed a good connection between the measured peak areas and GFT concentrations. All these findings indicated the suitability of both assays for GFT estimation. The greener HPTLC assay, on the other hand, was more linear than the routine HPTLC assay.
The percent of recovery was used to assess the accuracy of both assays for GFT estimation. The results for accuracy assessment for both assays are included in Table 3. For the routine HPTLC assay, the recoveries of GFT at three distinct QC levels were recorded as 96.13–103.4%. For the greener HPTLC assay, the recoveries of GFT at three distinct QC levels were estimated as 98.88–101.5%. These results suggested that both assays were accurate for GFT estimation, while the greener analytical assay was more accurate than the routine analytical assay in estimating GFT.
For GFT estimation, the precision of both assays was assessed as intra/inter-assay precision, and the results were represented as a percentage of the coefficient of variance (%CV). Table 4 shows the intra-day and inter-day precisions for both assays of GFT estimation. The CVs of GFT for the intra-day precision are 2.295–3.345% for the routine HPTLC assay. For the routine HPTLC assay, the CVs of GFT for inter-day precision are 2.298–3.275%. The CVs of GFT for the intra-day precision are 0.7893–0.8348% for the greener HPTLC assay. The CVs of GFT for inter-day precision are 0.8559–0.9391% for the greener HPTLC assay. These results suggested that both assays were precise for GFT estimation. For GFT estimation, however, the greener analytical method was more precise than the routine analytical method.
By making planned deliberate alterations in the components of mobile phases, the robustness of both assays for GFT estimation was investigated. Table 5 lists the resulting data of robustness assessment for both assays. For the routine HPTLC assay, the CVs for GFT are 2.745–2.977%. GFT Rf values were uncovered as 0.3500–0.3700 for the routine HPTLC assay. The CVs for GFT in the greener HPTLC are 0.9495–0.9632%. GFT Rf values were uncovered as 0.4200–0.4400 for the greener HPTLC assay. These results suggested that both assays were robust for GFT estimation. However, when it came to GFT estimation, the greener HPTLC assay outperformed the routine HPTLC assay.
The sensitivity of both assays of GFT estimation was assessed using the “LOD and LOQ”. The calculated values of “LOD and LOQ” for GFT using both assays are included in Table 1. For the routine HPTLC assay, the “LOD and LOQ” for GFT were uncovered as 11.14 ± 0.4100 and 33.42 ± 1.230 ng/band, respectively. For the greener analytical assay, the “LOD and LOQ” for GFT were uncovered as 6.720 ± 0.1000 and 20.16 ± 0.3000 ng/band, respectively. Both assays were found to be sensitive for GFT estimation based on these findings, while the greener analytical assay was more sensitive than the routine analytical assay for GFT estimation.
The selectivity of the suggested method of GFT estimation was investigated by comparing the Rf values and overlaid UV spectra of GFT in marketed tablets with those of standard GFT. The superimposed UV spectra of standard GFT and GFT in marketed tablets are included in Figure 2. The maximum response of GFT in standard GFT and marketed tablets was studied at a wavelength of 332.0 nm. The selectivity of the suggested HPTLC assay of GFT estimation was confirmed by the identical UV spectra, Rf values, and wavelengths of GFT in standard and commercial tablet dosage forms.

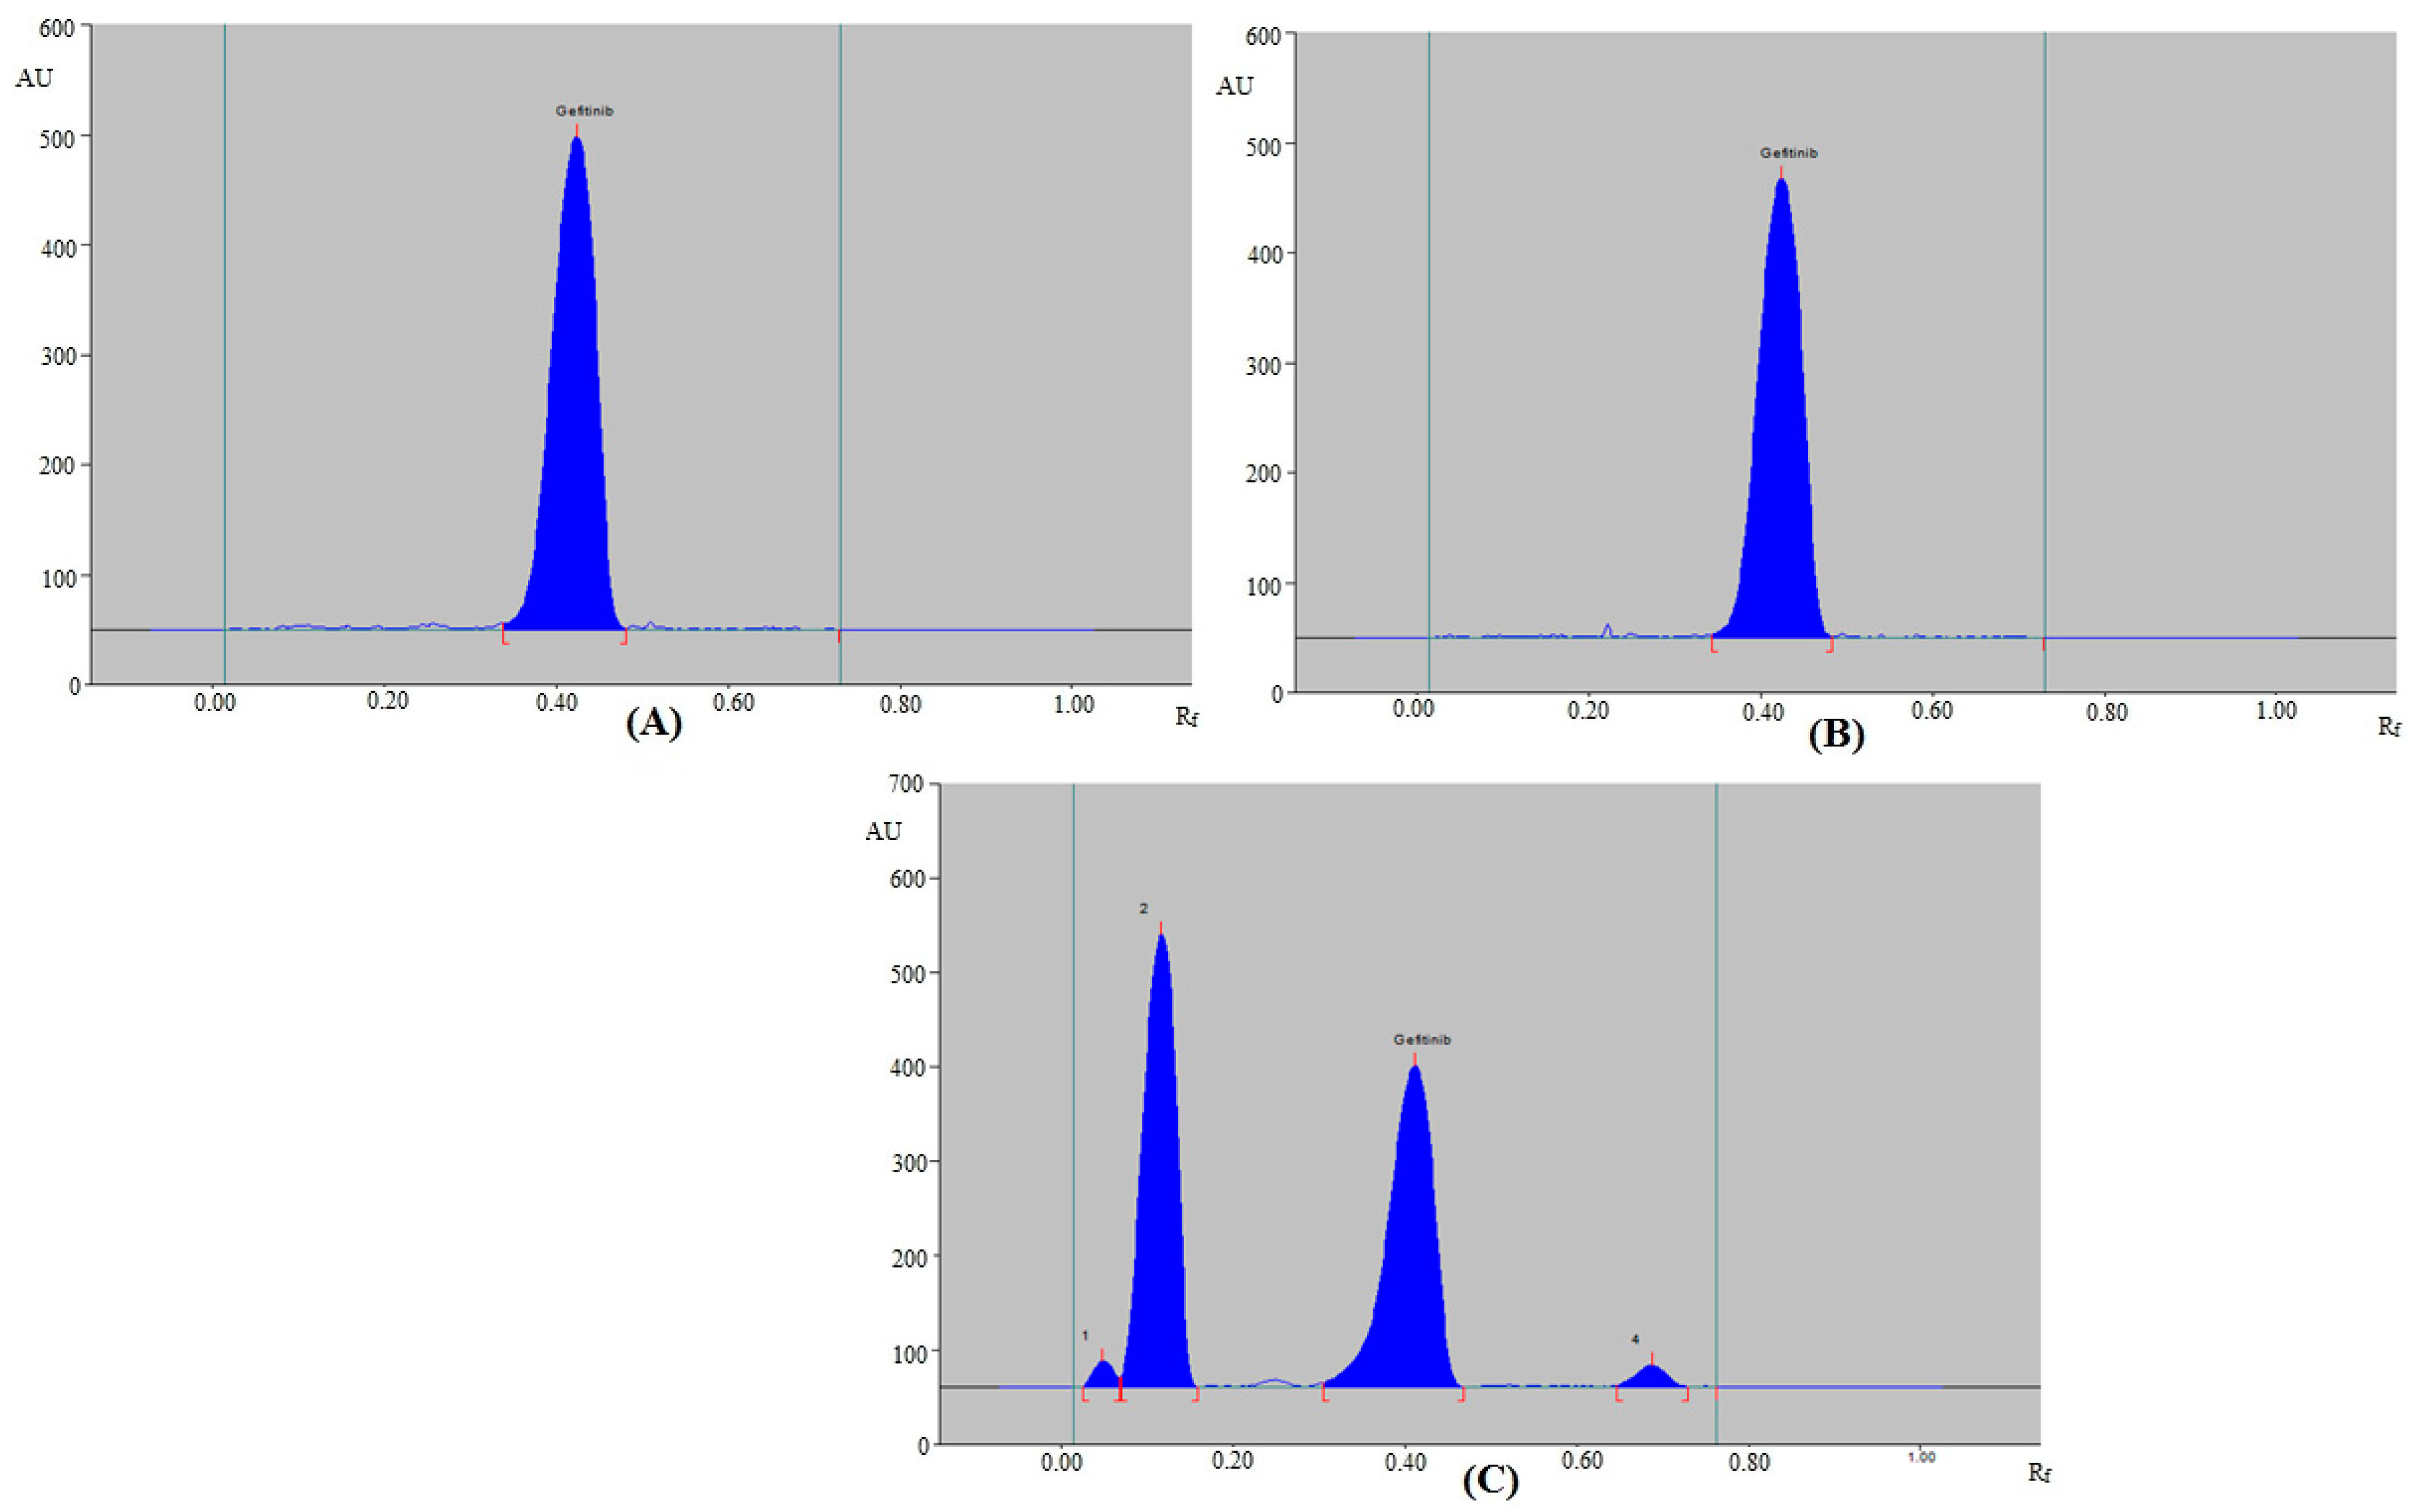
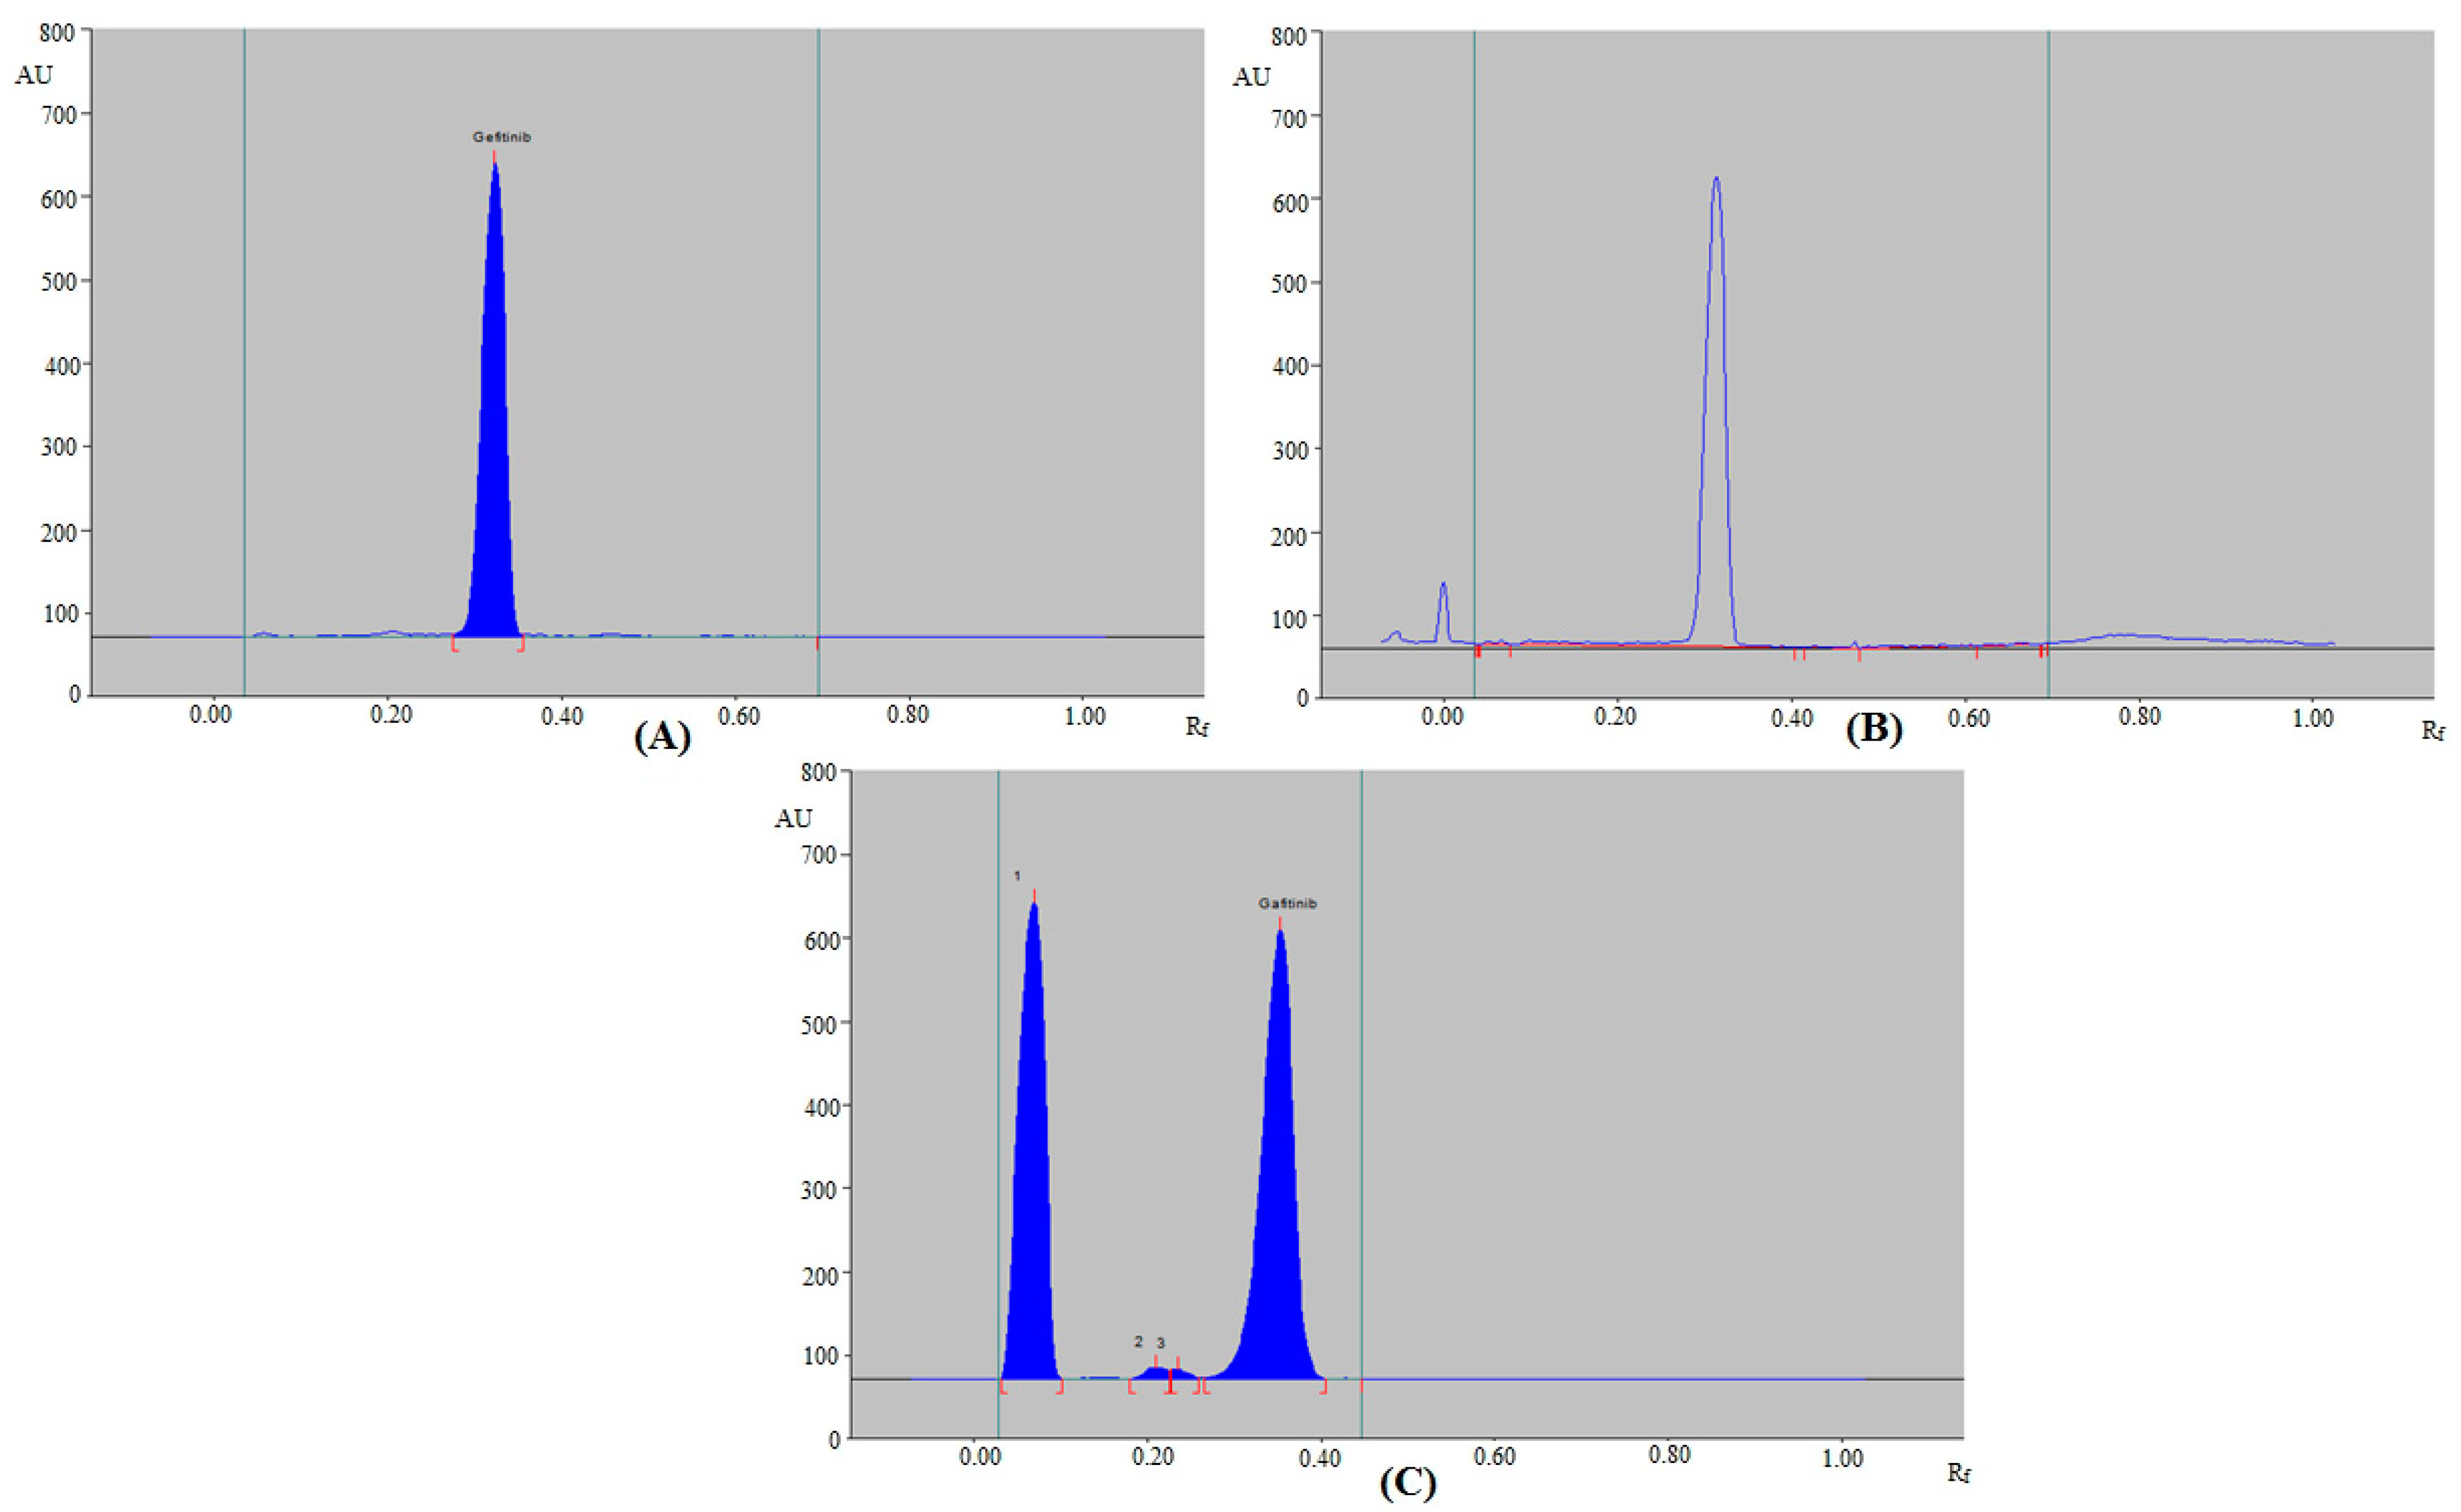
3.3. Forced Degradation Studies

The forced degradation of routine and greener HPTLC methods were investigated under various stress settings. Figure 3 and Table 6 present the findings of the routine HPTLC method. The GFT peak was well-separated at different stress conditions (Figure 3). Under acid (Figure 3A) and base degradation (Figure 3B) settings, 100.0% of GFT remained intact and no degradation of GFT was recorded. As a consequence, GFT was sufficiently stable under acid- and base-degradation settings. The Rf values of GFT under acid- and base-degradation settings were slightly shifted (Rf = 0.3700 in both cases). An amount of 52.23% of GFT remained after oxidative stress settings, while 47.77% was decomposed (Table 6 and Figure 3C). With Rf values of 0.0700, 0.2100, and 0.2400, the H2O2-induced degradation peaks (peaks 1, 2, and 3 in Figure 3C) were resolved. Under oxidative-degradation conditions, the Rf value of GFT was not shifted (Rf = 0.3600). GFT was also maintained at 100.0% during thermal stress settings (Table 6), and no degradation of GFT was recorded. As a consequence, GFT was also stable to thermal stress settings.
Figure 4 and Table 7 present the findings of the greener HPTLC method. The GFT peak was also well-separated at different stress conditions (Figure 4). Under acid- (Figure 4A) and base-degradation (Figure 4B) settings, 100.0% of GFT also remained intact, and no degradation of GFT was recorded. As a consequence, GFT was sufficiently stable under acid- and base-degradation settings. The Rf values of GFT under acid- and base-degradation settings were not shifted (Rf = 0.4300 in both cases). An amount of 47.68% of GFT remained after oxidative stress settings, while 52.32% was decomposed (Table 7 and Figure 4C). With Rf values of 0.0500, 0.1200, and 0.6900, the H2O2-induced degradation peaks (peaks 1, 2, and 4 in Figure 4C) were separated. Under oxidative-degradation conditions, GFT’s Rf value was slightly moved (Rf = 0.4100). GFT was also maintained at 100.0% during thermal stress settings (Table 7), and no degradation of GFT was recorded. As a consequence, GFT was also stable to thermal stress settings.
Under oxidative-degradation settings, the maximal degradation of GFT was recorded using routine and greener HPTLC methods. These findings suggested that GFT could be discovered in the presence of its degradation products utilizing routine and greener HPTLC methods. These findings pointed to the stability-indicating nature of routine and greener HPTLC procedures. For GFT detection, both approaches were stability-indicating.

3.4. Application of Routine and Greener HPTLC Assays in GFT Estimation in Marketed Tablets

For the estimation of GFT in marketed tablets, both assays were applied. The chromatogram of GFT from marketed tablets was verified by comparing its single TLC spot at Rf = 0.3600 ± 0.0100 for GFT with standard GFT using the routine HPTLC assay. The chromatographic peak for GFT in marketed tablets was identical to that of standard GFT using the routine HPTLC assay. The chromatogram of GFT from marketed tablets was verified by comparing its single TLC spot at Rf = 0.4300 ± 0.0100 for GFT with standard GFT using the greener HPTLC assay. The chromatographic peak of GFT in marketed tablets was also identical to that of standard GFT using the greener HPTLC assay. In addition, no additional peaks of excipients were detected in marketed tablets using both assays, suggesting no interaction between GFT and tablet excipients. The amount of GFT in marketed tablets was calculated using GFT calibration curve for both methods. Using the routine HPTLC assay, the assay of GFT in marketed tablets was uncovered as 92.45 ± 1.841%. Using the greener HPTLC assay, the assay of GFT in marketed tablets was uncovered as 99.74 ± 1.322%. Based on these results, the greener HPTLC assay is considered superior over the routine HPTLC assay for pharmaceutical assay of GFT.

3.5. Greenness Estimation

Various methodologies are used for the greenness evaluation of pharmaceutical analytical methods [26,27,28,29,30], while AGREE exclusively utilizes all 12 GAC components for greenness assessment [28]. Accordingly, the greenness index of both assays was assessed using “AGREE: The Analytical GREENness Calculator (version 0.5, Gdansk University of Technology, Gdansk, Poland, 2020)”. Figure 5 depicts a representative diagram for the AGREE index of routine and greener HPTLC assays. For routine and greener HPTLC assays, the AGREE index was found to be 0.44 and 0.77, respectively. These results demonstrated the excellent greenness index of the greener HPTLC assay compared to the routine HPTLC assay for GFT estimation.

4. Conclusions

HPTLC methods of GFT estimation are scarce in the literature. Furthermore, greener analytical methods for GFT estimation are also lacking in the literature. As a consequence, this work aims to invent and validate a sensitive and greener HPTLC approach for GFT estimation in marketed tablet dosage forms, as opposed to the routine HPTLC method. For GFT measurement, the greener HPTLC assay is more linear, accurate, precise, robust, and sensitive than the routine HPTLC assay. The percent assay of GFT was higher using the greener HPTLC assay than the routine HPTLC assay. Both the methods were found to be selective, with stability-indicating properties. The AGREE assessment suggested the excellent greenness index of the greener HPTLC assay over the routine HPTLC assay. Based on these data, the greener HPTLC assay is considered superior to the routine HPTLC assay for estimating GFT in commercial tablets.

Author Contributions

Conceptualization, W.A.M. and P.A.; methodology, P.A., A.I.F., M.H.A. and T.M.A.; software, M.M.G.; validation, S.A., M.M.G. and W.A.M.; formal analysis, M.M.G.; investigation, F.S. and A.I.F.; resources, W.A.M.; data curation, F.S.; writing—original draft preparation, F.S.; writing—review and editing, S.A., W.A.M. and M.M.G.; visualization, W.A.M.; supervision, P.A.; project administration, P.A.; funding acquisition, W.A.M. All authors have read and agreed to the published version of the manuscript.

Funding

This research was funded by the Researchers Supporting Project (number RSP2022R516) at King Saud University, Riyadh, Saudi Arabia, and the APC was funded by RSP.

Institutional Review Board Statement

Not applicable.

Informed Consent Statement

Not applicable.

Data Availability Statement

Not applicable.

Acknowledgments

Authors are thankful to Researchers Supporting Project (number RSP2022R516) at King Saud University, Riyadh, Saudi Arabia.

Conflicts of Interest

The authors declare no conflict of interest.

References

  1. Trummer, B.J.; Iyer, V.; Balu-Iyer, S.V.; Connor, R.O.; Straubinger, R.M. Physicochemical properties of EGF receptor inhibitors and development of nanoliposomal formulation of gefitinib. J. Pharm. Sci. 2012, 101, 2763–2776. [Google Scholar] [CrossRef] [Green Version]
  2. Srinivas, N.S.K.; Verma, R.; Kulyadi, G.P.; Kumar, L. A quality by design approach on polymeric nanocarrier delivery of gefitinib: Formulation, in vitro, and in vivo characterization. Int. J. Nanomed. 2017, 12, 15–18. [Google Scholar] [CrossRef] [PubMed] [Green Version]
  3. Arora, E.M.; Scholar, E.M. Role of tyrosine kinase inhibitors in cancer therapy. J. Pharmacol. Exp. Ther. 2005, 315, 971–979. [Google Scholar] [CrossRef] [PubMed] [Green Version]
  4. Schaeybroeck, S.V.; Karaiskou-McCaul, A.; Kelly, D.; Longley, D.; Galligan, L.; van Cutsem, E.; Johnston, P. Epidermal growth factor receptor activity determines responses of colorectal cancer cells to gefitinib alone and in combination with chemotherapy. Clin. Cancer Res. 2005, 11, 7480–7489. [Google Scholar] [CrossRef] [PubMed] [Green Version]
  5. Zhang, G.; Xie, X.; Liu, T.; Yang, J.; Jiao, S. Effects of pemetrexed, gefitinib and their combination on human colorectal cancer cells. Cancer Chemother. Pharmacol. 2013, 72, 767–775. [Google Scholar] [CrossRef]
  6. Li, X.; Wang, J.; Li, S.; Liu, Z.; Zheng, Z.; Zhang, Y. Development and evaluation of multifunctional poly(lactic-co-glycolic acid) nanoparticles embedded in carboxymethyl β-glucan porous microcapsules as a novel drug delivery system for gefitinib. Pharmaceutics 2019, 11, 469. [Google Scholar] [CrossRef] [Green Version]
  7. Alshehri, S.; Alanazi, A.; Elzayat, E.M.; Altamimi, M.A.; Imam, S.S.; Hussain, A.; Alqahtani, F.; Shakeel, F. Formulation, in vitro and in vivo evaluation of gefitinib solid dispersions prepared using different techniques. Processes 2021, 9, 1210. [Google Scholar] [CrossRef]
  8. Sordella, R.; Bell, D.W.; Haber, D.A.; Settleman, J. Gefitinib-sensitizing EGFR mutations in lung cancer activate anti-apoptotic pathways. Science 2004, 305, 1163–1167. [Google Scholar] [CrossRef]
  9. Alanazi, A.; Alshehri, S.; Altamimi, M.; Shakeel, F. Solubility determination and three dimensional Hansen solubility parameters of gefitinib in different organic solvents: Experimental and computational approaches. J. Mol. Liq. 2020, 299, 112211. [Google Scholar] [CrossRef]
  10. Varansi, M.B.; Khan, M.A.; Jangala, V.R.; Teja, B.B. Visible spectrophotometric determination of gefitinib in bulk drug and pharmaceutical formulations. Int. J. Chem. Sci. 2009, 7, 2449–2454. [Google Scholar]
  11. Patra, S.R.; Bali, A.; Saha, M. Derivative spectrophotometric methods for determination of gefitinib in bulk and in formulation. J. Appl. Spectroscop. 2021, 88, 1088–1094. [Google Scholar] [CrossRef]
  12. Sreedevi, A.; Rao, A.L.; Kalyani, L. Development and validation of stability indicating HPLC method for estimation of gefitinib in bulk and its pharmaceutical formulations. Int. J. Pharm. Chem. Biol. Sci. 2013, 3, 1305–1314. [Google Scholar]
  13. Varasala, S.M.; Mangamma, K. Analytical method development and validation for the estimation of gefitinib by RP-HPLC method in tablet dosage form. Int. J. Pharm. Biol. Sci. 2013, 3, 198–201. [Google Scholar]
  14. Siva Kumar, R.; Yogeshwara, K.R.; Gangrade, M.; Kanyawar, N.; Ganesh, S.; Jayachandran, J. Development and validation of stability indicating HPLC method for gefitinib and its related compounds and characterization of degradation impurities. J. Pharm. Drug Deliv. Res. 2017, 6, 1000161. [Google Scholar]
  15. Aluri, S.G.; Annapurna, M.M. A new stability indicating RP-HPLC method for the estimation of gefitinib tablets using an ion pairing agent. Res. J. Pharm. Technol. 2021, 14, 5449–5456. [Google Scholar] [CrossRef]
  16. Chandrashekara, K.A.; Udupi, A.; Reddy, C.G. Separation and estimation of process-related impurities of gefitinib by reverse-phase high-performance liquid chromatography. J. Chromatogr. Sci. 2014, 52, 799–805. [Google Scholar] [CrossRef] [Green Version]
  17. Reddy, C.N.; Prasad, P.R.; Sredhar, N.Y. Voltametric behavior of gefitinib and its adsorptive stripping voltametric determination in pharmaceutical formulations and urine samples. Int. J. Pharm. Pharm. Sci. 2011, 3, 141–145. [Google Scholar]
  18. Verma, N.; Rai, A.K.; Kaushik, V.; Brunner, D.; Chahar, K.R.; Pandey, J.; Goyal, P. Identification of gefitinib off-targets using a structure-based systems biology approach; Their validation with reverse docking and retrospective data mining. Sci. Rep. 2016, 6, 33949. [Google Scholar] [CrossRef] [Green Version]
  19. Bai, F.; Iacono, L.C.; Johnston, B.; Stewart, C.F. Determination of gefitinib in plasma by liquid chromatography with a C12 column and electrospray tandem mass spectrometry detection. J. Liq. Chromatogr. Rel. Technol. 2004, 27, 2743–2758. [Google Scholar] [CrossRef]
  20. Wang, L.-Z.; Lim, M.Y.-X.; Chin, T.-M.; Thuya, W.-L.; Nye, P.-L.; Wong, A.; Chan, S.-Y.; Goh, B.-C.; Ho, P.C. Rapid determination of gefitinib and its main metabolite, o-desmethyl gefitinib in human plasma using liquid chromatography tandem-mass spectrometry. J. Chromatogr. B 2011, 879, 2155–2161. [Google Scholar] [CrossRef]
  21. Hayashi, H.; Kita, Y.; Iihara, H.; Yanase, K.; Ohno, Y.; Hirose, C.; Yamada, M.; Todoroki, K.; Kitaichi, K.; Minatoguchi, S.; et al. Simultaneous and rapid determination of gefitinib, erlotinib and afatinib plasma levels using liquid chromatography/tandem mass spectrometry in patients with non-small-cell lung cancer. Biomed. Chromatogr. 2016, 30, 1150–1154. [Google Scholar] [CrossRef] [PubMed]
  22. Zheng, N.; Zhao, C.; He, X.-R.; Jiang, S.-T.; Han, S.-Y.; Xu, G.-B.; Li, P.-P. Simultaneous determination of gefitinib and its major metabolites in mouse plasma by HPLC-MS/MS and its application to a pharmacokinetics study. J. Chromatogr. B 2016, 1011, 215–222. [Google Scholar] [CrossRef] [PubMed]
  23. Liu, Y.; Liu, H.; Xia, Z.; Wang, Z.; Yun, Y.; Zhang, G.; Huang, L.; Gao, S.; Chen, W. Simultaneous and rapid determination of six tyrosine kinase inhibitors in patients with non-small cell lung cancer using HPLC-MS/MS. Int. J. Anal. Chem. 2021, 2021, 5524361. [Google Scholar] [CrossRef]
  24. Wang, C.; Zhang, J.; Zhou, S.; Yu, L.; Han, F.; Ling, R.; Ling, J. Tentative identification of gefitinib metabolites in non-small-cell lung cancer patient plasma using ultra-performance liquid chromatography coupled with triple quadrupole time-of-flight mass spectrometry. PLoS ONE 2020, 15, e0236523. [Google Scholar] [CrossRef] [PubMed]
  25. Borg, H.; Zambo, D.; Elmansi, H.; Hashem, H.M.; Nasr, J.J.; Walash, M.I.; Bigall, N.C.; Belal, F. Preconcentration and detection of gefitinib anti-cancer drug traces from water and human plasma samples by means of magnetic nanoparticles. Nanomaterials 2020, 10, 1196. [Google Scholar] [CrossRef]
  26. Abdelrahman, M.M.; Abdelwahab, N.S.; Hegazy, M.A.; Fares, M.Y.; El-Sayed, G.M. Determination of the abused intravenously administered madness drops (tropicamide) by liquid chromatography in rat plasma; An application to pharmacokinetic study and greenness profile assessment. Microchem. J. 2020, 159, 105582. [Google Scholar] [CrossRef]
  27. Duan, X.; Liu, X.; Dong, Y.; Yang, J.; Zhang, J.; He, S.; Yang, F.; Wang, Z.; Dong, Y. A green HPLC method for determination of nine sulfonamides in milk and beef, and its greenness assessment with analytical eco-scale and greenness profile. J. AOAC Int. 2020, 103, 1181–1189. [Google Scholar] [CrossRef]
  28. Pena-Pereira, F.; Wojnowski, W.; Tobiszewski, M. AGREE-Analytical GREEnness metric approach and software. Anal. Chem. 2020, 92, 10076–10082. [Google Scholar] [CrossRef]
  29. Alam, P.; Salem-Bekhit, M.M.; Al-Joufi, F.A.; Alqarni, M.H.; Shakeel, F. Quantitative analysis of cabozantinib in pharmaceutical dosage forms using green RP-HPTLC and green NP-HPTLC methods: A comparative evaluation. Sus. Chem. Pharm. 2021, 21, 100413. [Google Scholar] [CrossRef]
  30. Foudah, A.I.; Shakeel, F.; Alqarni, M.H.; Alam, P. A rapid and sensitive stability-indicating green RP-HPTLC method for the quantitation of flibanserin compared to green NP-HPTLC method: Validation studies and greenness assessment. Microchem. J. 2021, 164, 105960. [Google Scholar] [CrossRef]
  31. International Conference on Harmonization (ICH), Q2 (R1): Validation of Analytical Procedures–Text and Methodology; ICH Secretariat: Geneva, Switzerland, 2005.
  32. Alam, P.; Shakeel, F.; Alqarni, M.H.; Foudah, A.I.; Faiyazuddin, M.; Alshehri, S. Rapid, sensitive, and sustainable reversed-phase HPTLC method in comparison to the normal-phase HPTLC for the determination of pterostilbene in capsule dosage form. Processes 2021, 9, 1305. [Google Scholar] [CrossRef]
Figure 1. Representative “high-performance thin-layer chromatography (HPTLC)” densitograms of standard gefitinib (GFT) obtained using (A) routine HPTLC and (B) greener HPTLC methods.
Processes 10 00762 g001
Figure 2. Ultra-violet (UV) absorption spectra of standard GFT and commercial formulation, superimposed.
Processes 10 00762 g002
Figure 3. HPTLC densitograms of GFT obtained under (A) acid degradation, (B) base degradation, and (C) oxidative degradation of GFT using the routine HPTLC method.
Processes 10 00762 g003
Figure 4. HPTLC densitograms of GFT obtained under (A) acid degradation, (B) base degradation, and (C) oxidative degradation of GFT using the greener HPTLC method.
Processes 10 00762 g004
Figure 5. Representative diagrams for AGREE indices for the routine and greener analytical methods estimated utilizing “AGREE: The Analytical GREENness Calculator”.
Processes 10 00762 g005
Table 1. The optimization of the mobile phases and chromatographic conditions of gefitinib (GFT) analysis for the routine “high-performance thin-layer chromatography (HPTLC)” and the greener HPTLC methods (mean ± SD, n = 3).
Routine HPTLC
Mobile PhaseAsN/mRf
Ch/MOH (45:55, v/v)1.248 ± 0.03001585 ± 1.1830.4400 ± 0.0200
Ch/MOH (50:50, v/v)1.247 ± 0.03001598 ± 1.1940.4300 ± 0.0200
Ch/MOH (55:45, v/v)1.246 ± 0.02001642 ± 2.0140.4200 ± 0.0200
Ch/MOH (60:40, v/v)1.245 ± 0.03001692 ± 2.1120.4100 ± 0.0200
Ch/MOH (65:35, v/v)1.244 ± 0.03001763 ± 2.1620.4000 ± 0.0100
Ch/MOH (70:30, v/v)1.243 ± 0.02001854 ± 2.1820.3900 ± 0.0100
Ch/MOH (75:25, v/v)1.042 ± 0.03001985 ± 2.1920.3800 ± 0.0100
Ch/MOH (80:20, v/v)1.241 ± 0.03002014 ± 2.2130.3700 ± 0.0100
Ch/MOH (85:15, v/v)1.041 ± 0.02004972 ± 4.1410.3600 ± 0.0100
Ch/MOH (90:10, v/v)1.240 ± 0.03002278 ± 2.3210.3500 ± 0.0100
Greener HPTLC
EOH/CYH (45:55, v/v)1.267 ± 0.03001498 ± 1.8440.5000 ± 0.0200
EOH/CYH (50:50, v/v)1.266 ± 0.03001512 ± 1.8540.4900 ± 0.0200
EOH/CYH (55:45, v/v)1.265 ± 0.03001591 ± 1.9220.4800 ± 0.0200
EOH/CYH (60:40, v/v)1.264 ± 0.02001666 ± 2.1010.4700 ± 0.0200
EOH/CYH (65:35, v/v)1.263 ± 0.02001723 ± 2.1150.4600 ± 0.0200
EOH/CYH (70:30, v/v)1.262 ± 0.02001852 ± 2.1710.4500 ± 0.0100
EOH/CYH (75:25, v/v)1.261 ± 0.02001977 ± 2.2020.4400 ± 0.0100
EOH/CYH (80:20, v/v)1.080 ± 0.02004768 ± 3.9720.4300 ± 0.0100
EOH/CYH (85:15, v/v)1.269 ± 0.03002042 ± 2.5420.4200 ± 0.0100
EOH/CYH (90:10, v/v)1.268 ± 0.03002128 ± 2.6120.4100 ± 0.0100
Ch: chloroform; MOH: methanol; EOH: ethanol; CYH: cyclohexane; Rf: retardation factor; As: asymmetry factor; N/m: theoretical plates number per meter.
Table 2. Results for the linear regression analysis of GFT for the routine and greener HPTLC methods (mean ± SD; n = 6).
ParametersRoutine HPTLCGreener HPTLC
Linearity range (ng/band)30–70020–1400
Regression equationy = 15.29x + 895.96y = 21.31x + 614.79
R20.99450.9964
R0.99720.9981
SE of slope0.38380.3389
SE of intercept4.5892.213
95% CI of slope13.63–16.9419.85–22.76
95% CI of intercept876.2–915.7605.2–624.3
LOD ± SD (ng/band)11.14 ± 0.41006.720 ± 0.1000
LOQ ± SD (ng/band)33.42 ± 1.23020.16 ± 0.3000
R2: determination coefficient; R: regression coefficient; SE: standard error; CI: confidence interval; LOD: limit of detection; LOQ: limit of quantification.
Table 3. The percent recoveries of GFT for the routine HPTLC and the greener HPTLC methods (mean ± SD; n = 6).
Conc. (ng/Band)Conc. Found (ng/Band) ± SDRecovery (%)CV (%)
Routine HPTLC
5051.71 ± 1.640103.43.171
400384.5 ± 9.51096.132.473
700718.5 ± 16.14102.62.246
Greener HPTLC
5049.68 ± 0.5499.361.086
400406.3 ± 3.840101.50.9450
14001384.3 ± 12.3198.880.8892
Table 4. Determination of GFT precision for the routine HPTLC and the greener HPTLC methods (mean ± SD; n = 6).
Conc. (ng/Band)Intraday PrecisionInter-Day Precision
Conc. (ng/Band)SECV (%)Conc. (ng/Band)SECV (%)
Routine HPTLC
5048.13 ± 1.6100.65743.34552.21 ± 1.710.69823.275
400418.5 ± 11.314.6182.702382.4 ± 11.944.8753.122
700681.4 ± 15.646.3862.295721.3 ± 16.586.7702.298
Greener HPTLC
5050.31 ± 0.42000.17140.834848.98 ± 0.46000.18780.9391
400388.9 ± 3.1301.2780.8047406.2 ± 3.6101.4740.8886
14001411 ± 11.144.5480.78931392 ± 11.924.8670.8559
Table 5. Results of robustness analysis of GFT for the routine HPTLC and the greener HPTLC methods (mean ± SD; n = 6).
Conc. (ng/Band)Mobile Phase Composition (Chloroform-Methanol)Results
OriginalUsed Conc. (ng/Band)CV (%)Rf
Routine HPTLC
87:13+2.0385.4 ± 10.582.7450.3500
40085:1585:150.0392.6 ± 11.692.9770.3600
83:17−2.0412.5 ± 12.122.9370.3700
Greener HPTLC
Mobile phase composition (ethanol-cyclohexane)
82:18+2.0391.2 ± 3.7400.95590.4200
40080:2080:200.0402.3 ± 3.8200.94950.4300
78:22−2.0406.9 ± 3.9200.96320.4400
Table 6. Results of forced-degradation assessment of GFT at various stress conditions for the routine HPTLC method (mean ± SD; n = 3).
Stress Condition Number of Degradation Products (Rf)GFT RfGFT Remaining (ng/Band)GFT Recovered (%)
1M HCl00.3700400.0100.0 ± 0.0000
1M NaOH00.3700400.0100.0 ± 0.0000
30% H2O23 (0.0700, 0.2100, 0.2400)0.3600208.952.23 ± 1.740
Thermal00.3700400.0100.0 ± 0.0000
Table 7. Results of forced-degradation assessment of GFT at various stress conditions for the greener HPTLC method (mean ± SD; n = 3).
Stress Condition Number of Degradation Products (Rf)GFT RfGFT Remaining (ng/Band)GFT Recovered (%)
1M HCl00.4300400.0100.0 ± 0.0000
1M NaOH00.4300400.0100.0 ± 0.0000
30% H2O23 (0.0500, 0.1200, 0.6900)0.4100190.747.68 ± 1.630
Thermal00.4300400.0100.0 ± 0.0000
Publisher’s Note: MDPI stays neutral with regard to jurisdictional claims in published maps and institutional affiliations.

