Abstract
Turbulent emulsification is an important unit operation in chemical engineering. Due to its high energy cost, there is substantial interest in increasing the fundamental understanding of drop breakup in these devices, e.g., for optimization. In this study, numerical breakup experiments are used to study turbulent fragmentation of viscous drops, under conditions similar to emulsification devices such as high-pressure homogenizers and rotor-stator mixers. The drop diameter was kept larger than the Kolmogorov length scale (i.e., turbulent inertial breakup). When varying the Weber number (We) and the disperse-to-continuous phase viscosity ratio in a range applicable to emulsification, three distinct breakup morphologies are identified: sheet breakup (large We and/or low viscosity ratio), thread breakup (intermediary We and viscosity ratio > 5), and bulb breakup (low We). The number and size of resulting fragments differ between these three morphologies. Moreover, results also confirm previous findings showing drops with different We differing in how they attenuate the surrounding turbulent flow. This can create ‘exclaves’ in the phase space, i.e., narrow We-intervals, where drops with lower We break and drops with higher We do not (due to the latter attenuating the surrounding turbulence stresses more).
1. Introduction
Turbulent emulsification using high-pressure homogenizers and rotor-stator mixers is an important chemical engineering process with applications ranging from foods to pharmaceutical and healthcare products [1,2,3,4]. These devices have many advantages; they allow for high productivity and are available on a large range of scales. However, turbulent emulsification comes at a high energy cost. We argue that an improved understanding of turbulent emulsification is required to improve its energy efficiency.
The traditional approach to studying emulsification devices is via emulsification experiments, pumping coarse emulsions through the apparatus using different valve designs and operational conditions, and measuring the resulting drop sizes [5,6,7,8,9,10]. These investigations suggest that the largest drop diameter surviving passage, Dmax, can be accurately predicted by the viscosity-corrected Kolmogorov –Hinze theory [8,11]. This theoretical framework is based on a balance where disruptive (turbulent) stress is compared to the total resistance to deformation resulting from Laplace pressure and viscous resistance. Breakup events occur in one of two regimes: in the turbulent inertial regime, if the drop diameter is larger than the Kolmogorov length scale, D > η,
(where μC denotes continuous phase viscosity, ρC denotes continuous phase viscosity and ε denotes dissipation rate of turbulent kinetic energy) and in the turbulent viscous regime if the drop is smaller, D < η. For the turbulent inertial regime, the viscosity-corrected Kolmogorov–Hinze theory predicts [8,11]:
where c1 and c2 are empirical constants (c1 = 0.86 and c2 = 0.37, [8]), γ is interfacial tension and μD is the disperse phase viscosity. This semi-empirical relationship can be transformed into a dimensionless form using a Weber number,
a disperse to continuous phase viscosity ratio, μD/μC, and the ratio between drop diameter and Kolmogorov length scale, D/η, resulting in [12]:
Note that disperse phase viscosity enters the Kolmogorov–Hinze theory as an added stability factor (the factor multiplied with c2 in Equation (2)). Thus, in terms of how it influences the largest surviving drop diameter, increasing the interfacial tension or increasing the disperse phase viscosity (ratio) are two interchangeable effects, according to the theoretical framework.
During the last decades, several new insights on the nature of turbulent emulsification have been obtained by single drop breakup studies. These include both experimental visualizations using high-speed photography [13,14,15,16,17,18,19,20] and numerical breakup experiments combining direct numerical simulation (DNS) and highly resolved interface tracking [21,22,23,24,25,26,27].
In a previous contribution, we used numerical single drop breakup experiments to show that drops deform and break in fundamentally different ‘morphological sub-regimes’ depending on the Weber number [12]; large drops (high We) are rapidly deformed into multiple directions giving rise to a large number of small fragments, whereas smaller drops (low We) are elongated, deforming so as to create a thin neck separating two bulbs and later breaking into two larger fragments and an array of small satellite drops. Both these breakup morphologies were found in what is described as the turbulent inertial regime in Kolmogorov–Hinze theory. These results were, however, obtained at a single viscosity ratio. Recently, we have used this numerical methodology to show how small variations in drop viscosity (μD/μC = 10–24) translate into small variations in the morphology at the initial breakup (e.g., extending the length of the thin neck before breakup and delaying the deformation sequence). These results also comply rather well with emulsification experiments [28].
However, the range of drop sizes (We) and viscosities (μD/μC) in these previous studies is small in comparison to the industrially relevant conditions for emulsification. Little is still known on at what We the transition between different breakup morphologies occur, and it is still unknown if larger viscosity differences can lead to not only a slight modification of breakup morphology [28] but also transitions between breakup morphologies.
A good understanding of under which conditions different breakup morphologies prevail is essential for understanding a turbulent breakup. Moreover, it is vital for improving emulsification modeling. A growing number of studies are attempting to predict the outcome of turbulent emulsification run under different conditions [29,30,31,32,33]. These attempts depend on models that accurately describe breakup frequency and fragment drop size distributions [34,35,36]. In order to evaluate and develop such models, it is critical to fully understand differences in breakup morphologies.
The aim of this study is to improve our understanding of how Weber number and drop viscosity influence initial breakup morphology in turbulent emulsification under conditions similar to those occurring in an emulsification device and, more specifically, to create a parameter map over We and viscosity ratio in the turbulent inertial regime, to distinguish the different breakup morphologies. This is achieved using numerical single drop breakup experiments. Due to the large computational costs involved, some limitations are imposed. Firstly, investigations are limited to isotropic homogeneous turbulence with a Taylor–Reynolds number of 33. Secondly, the investigations focus on a single flow realization.
2. Materials and Methods
2.1. Numerical Drop Breakup Experiments
Each numerical experiment is carried out by injecting a single drop with a given Weber number and viscosity ratio into a homogeneous isotropic turbulent flow. The drop is tracked, either until the point where the first fragment detached from it (‘initial breakup’ in the terminology of Solsvik et al., [37]) or until it has spent time comparable to passage through the efficient breakup region of an emulsification device in the turbulent flow. Care is taken to ensure that conditions are similar to those in a turbulent emulsification device such as a high-pressure homogenizer. A full methodological description is found elsewhere [12]. Details of the numerical implementations can be found in previous studies [25,38,39]. A brief summary of the methodology is presented below:
In-house code is used, combining DNS for describing turbulent flow and a highly resolved volume-of-fluid (VOF) method [25,40] for describing how the drop interface evolves in time. The simulation domain consists of a periodic box, with size (π D0)3, where D0 is the size of the initial injected drop. This corresponds to a volume fraction of 1.7%, which can be compared to the 1–20% typically used in emulsification using high-pressure homogenizers in industrially relevant settings. Turbulence is continuously injected into the domain using ABC-forcing [41,42], ensuring a Taylor-scale Reynolds number of 33.
Before injecting the drop, the continuous phase flow is run until statistical convergence (measured by the dissipation rate of turbulent kinetic energy averaged across the domain), corresponding to 900 Kolmogorov timescales,
The maximum simulation end-time, i.e., time for passing through the efficient breakup region, is estimated to be 90 τη [12]. A drop that does not reach a critically deformed state [43] during this time is considered to survive passage.
The spatial resolution corresponds to 41 cells across the drop diameter and two cells across a Kolmogorov length scale, and doubling the mesh resolution has no significant effect on the resulting breakup morphology [12]. The simulation time-step was set adaptively, ensuring a Courant–Friedrichs–Lewy number of less than 0.25, which ensures a time-step independent solution according to experience from previous studies [39]. This results in a typical time-step of 0.002 τη.
Turbulent intermittency implies that the flow field varies stochastically. Consequently, turbulent stresses acting on a drop are occasionally substantially larger (or smaller) than the time-averaged ones [44,45]. Thus, in an experimental setting, each drop traveling through the device will experience a different trajectory and stress history. This is a challenge when attempting to study the systematic effects of parameters in an experimental setting. To study the effect of Weber number and viscosity ratio in isolation, each drop was injected into the same flow realization in the present study.
2.2. Investigated Cases
Numerical breakup experiments are run for viscosity ratios between 1.0 and 40, corresponding to the conditions of industrially relevant emulsification in, e.g., high-pressure homogenizers or rotor-stator mixers.
The Weber number is varied in the range of 0.96–100. The upper limit (We = 100) corresponds approximately to the Weber number of the largest drops entering an industrial device, whereas the largest drops surviving passage through an HPH have a Weber number slightly larger than 1.0 [12]. A varying Weber number is obtained by adjusting the interfacial tension between simulations. The drop diameter, D0, and the drop diameter to Kolmogorov length scale ratio, D0/η, were kept constant throughout all simulations in order to ensure that the spatial resolution (in terms of computational cells per drop diameter), as well as the breakup regime as described by the viscosity-corrected Kolmogorov–Hinze framework did not vary between condition (i.e., remained in the turbulent inertial regime, D0/η = 22). Furthermore, note that the viscosity-corrected Kolmogorov–Hinze theory suggests that the outcome of an emulsification experiment is determined by only three dimensionless numbers: the Weber number, the viscosity ratio and the drop diameter to Kolmogorov length scale (Equation (4)). Keeping the latter constant suggests that all remaining variation could be described in terms of the first two.
Table 1 displays the investigated Weber numbers for each viscosity ratio. Due to the high computational cost of the simulations, only a subset of all possible combinations was investigated. Each new set of simulation cases was chosen iteratively from an investigation of previous sets. The emphasis is on resolving the demarcation between breakup morphologies in general and identifying breakup morphologies close to the critical Weber number in particular. (See Appendix A for the individual parameter values used to generate the cases in Table 1 in the code used for the numerical breakup experiments).

Table 1.
Investigated cases (marked X).
2.3. Dissipation Rate of Turbulent Kinetic Energy
The local dissipation rate of turbulent kinetic energy (TKE) is calculated directly from its definition [46],
(where ui denotes velocity in dimension xi), based on the continuous phase DNS data and averaged across the computational domain.
2.4. Quantifying Interfacial Area
The total drop interfacial area is used to quantify the global extent of deformation. It is calculated by integrating the VOF-gradient (cf. refs. [47,48]):
where α denotes the VOF level-set method distance function.
3. Results and Discussion
The results and discussion section is organized as follows: First, the effect on breakup morphology is investigated by varying the Weber number but keeping the viscosity ratio constant: Section 3.1 discusses the low viscosity case (μD/μC = 1), Section 3.2 the intermediary-viscosity case (μD/μC = 22) and Section 3.3 the high-viscosity case (μD/μC = 40). Section 3.4 discusses the phenomenon of non-monotonic transitions between breakup morphologies and its relation to turbulence modulation. Section 3.5 constructs an initial breakup morphology map based on We and the viscosity ratio, and Section 3.6 discusses implications for emulsification processing.
3.1. Effect of We at a Low Viscosity Ratio (μD/μC = 1.0)
Figure 1 shows a large drop (We = 100) with a low viscosity (μD/μC = 1) deforming in the turbulent flow (iso-surface at α = 0.5). Results comply with previous investigations [12,22,26]: The spherical shape is lost almost instantly, and the drop deforms in several directions. As time progresses, a sheet structure develops. When sufficiently thin, holes appear and deform further into narrow threads from which the first fragment detaches. The time of initial breakup—defined from when the first fragment detached [37]—is 7.2 τη. However, note that the initial breakup time is difficult to characterize under this morphology since the limiting spatial resolution makes it difficult to fully distinguish detachment from rupture without fragmentation (i.e., hole formation) (see Figure 1).
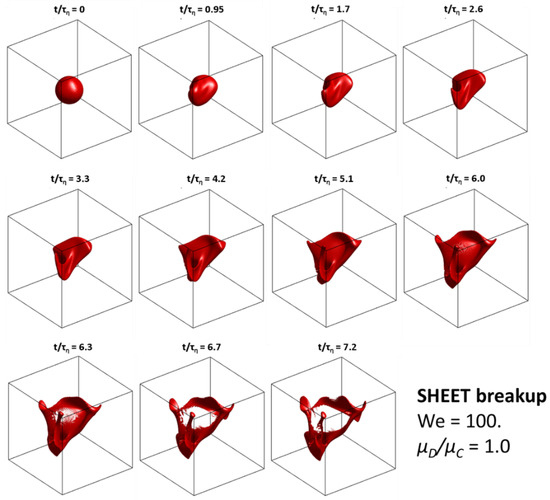
Figure 1.
Breakup sequence for We = 100, μD/μC = 1. Illustrating the sheet breakup morphology. (Iso-surfaces at α = 0.5).
Figure 2 shows the drop morphology at the initial breakup for the whole range of Weber numbers (1 < We < 100, μD/μC = 1). As the external stress becomes smaller in relation to stabilization (i.e., as We decreases from 100 to 11), the morphology gradually shifts from a case where the drop is breaking as a sheet that almost appears to be ‘dissolving’ due to its poor ability resist external stress (We = 100), to a case with a sheet breaking into a coherent network of threads (We = 11). However, throughout this range (We = 11–100), a breakup occurs via a highly deformed sheet. This will be referred to as a ‘sheet breakup morphology’ in the present study. Sheet breakup, with its high multi-directional deformation and with rupture occurring almost simultaneously in several locations, is similar to what Komrakova [22] refers to as ‘burst breakup’ and has elements of what is referred to as ‘bag breakup’ under conditions of liquid drops breaking in gaseous jets [49].
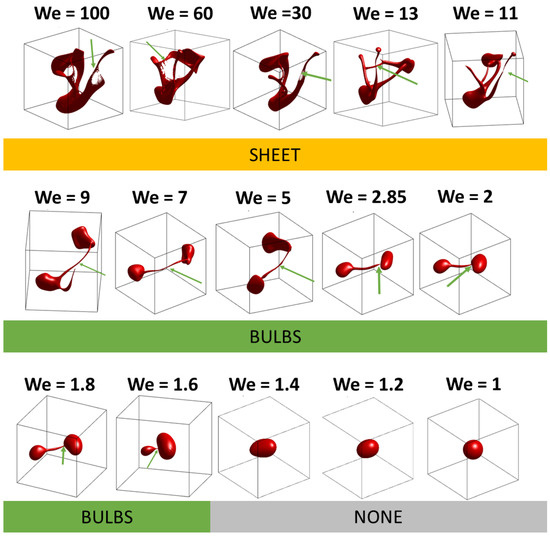
Figure 2.
Morphology at the initial breakup as a function of Weber number for a low viscosity drop (μD/μC = 1). Green arrows show the point of initial detachment.
Figure 3 displays the initial breakup time as a function of Weber number (at a constant, low viscosity ratio, μD/μC = 1). Within the sheet breakup regime (We = 11–100), there is a trend of increased breakup time with decreasing Weber number. The trend is comparable but less steep than the breakup time prediction suggested by Rivière et al. [24]; see line in Figure 3.
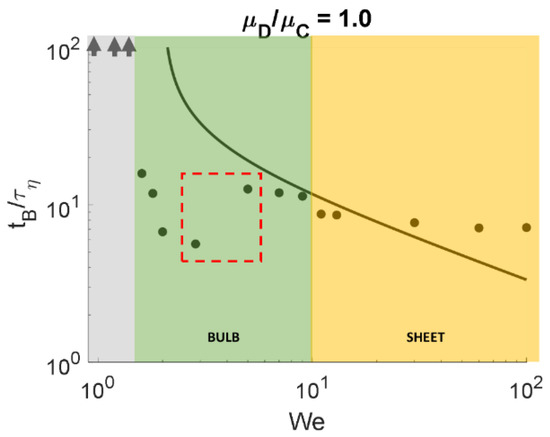
Figure 3.
Time of initial breakup, tB, as a function of Weber number, We, for a low viscosity drop (μD/μC = 1). Solid line displays average breakup time as suggested by Rivière et al. [24]. Arrows indicate cases with tB > 90 τη. Colored fields show breakup morphology; see Figure 2. Red box displays the non-monotonic breakup time trend; see Section 3.4.
Turning to Weber numbers below 11, Figure 2 shows a different breakup morphology. At Weber numbers between 13 and 1.6, the sheet never develops (apparently, the cohesive Laplace pressure is large enough to ensure that this extent of deformation is not possible given the external stress levels). The drop is, instead, elongated followed by a gradual development of a narrowing neck separating two bulbs (Figure 4). The morphological details and mechanism of how external stress deforms the neck until reaching a critical state have been discussed in more detail elsewhere [43]. This breakup morphology will be referred to as ‘bulb breakup’ and is similar to the breakup morphology seen in several experimental high-speed photography visualizations [13,14,15,17,18,20,50,51].
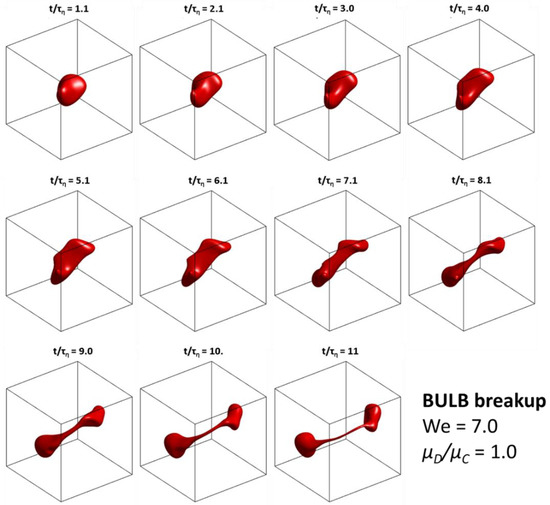
Figure 4.
Breakup sequence for We = 7.0, μD/μC = 1, illustrating the bulb breakup morphology. (Iso-surfaces at α = 0.5).
It is interesting to note that although the breakup morphology is similar in the entire bulb-breakup range (We = 13–1.6), a minor shift can be seen. The point of first detachment switches from a position in the middle of the neck for higher Weber numbers (We ≥ 5) to a position where the neck is connected to one of the bulbs at lower Weber numbers (We ≤ 2.85); see Figure 2, where the green arrow indicates the point of first detachment.
As in the sheet regime, the time required to reach the initial breakup also increases with decreasing Weber number (see Figure 3, We = 1.6–13). However, note that between We = 2.85 and 5 (red box in Figure 3), breakup time decreases with increasing Weber number. Furthermore, note that this effect occurs at the same point where the minor transition in detachment point location is found (Figure 2). Such behavior is somewhat counterintuitive at first glance suggesting that the drop breaks earlier when better stabilized (at least in a narrow We interval) and is discussed in more detail in Section 3.4.
As seen in Figure 2, drops with a Weber number below 1.6 do not break (under the investigated time interval, i.e., tB > 90 τη). These drops go through several sequences of deformation–relaxation but never reach a critically deformed state. Thus, the critical Weber number for the low viscosity ratio (at the investigated flow realization) is in the range of 1.4–1.6.
3.2. Effect of We at an Intermediate Viscosity Ratio (μD/μC = 22)
Figure 5 shows the morphology at initial breakup for an intermediary viscosity ratio drop (μD/μC = 22) as a function of Weber number. In a previous investigation, we identified sheet breakup at a high Weber number and bulb breakup at lower values for this viscosity ratio [12]. Figure 5 suggests that the sheet regime extends down to We = 30, and the bulb breakup regime starts from We = 11. The corresponding initial breakup times can be seen in Figure 6.
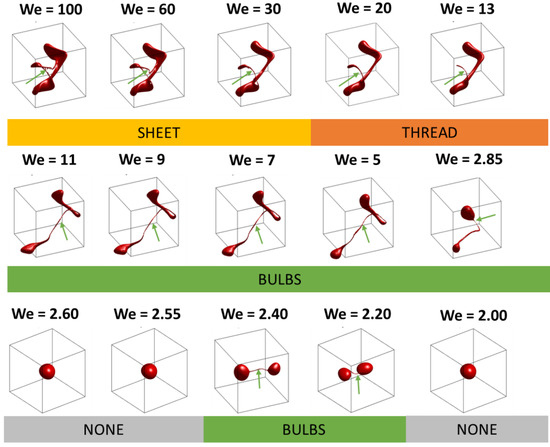
Figure 5.
Morphology at initial breakup as a function of Weber number for in intermediary viscosity drop (μD/μC = 22). Green arrows show the point of initial detachment.
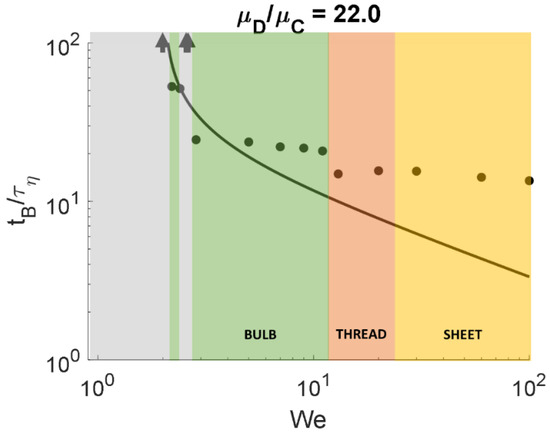
Figure 6.
Time of initial breakup, tB, as a function of Weber number, We, for an intermediary viscosity drop (μD/μC = 22). Solid line displays average breakup time as suggested by Rivière et al. [24]. Arrows indicate cases with tB > 90 τη. Colored fields show breakup morphology; see Figure 2.
However, the more detailed investigations underlying Figure 5 suggest a third intermediary breakup morphology in-between sheet and bulb breakup, where the first detachment is of a small drop from a narrow thread (Figure 5, We = 20). At We = 13–20, the Laplace pressure is sufficient to resist external stress deforming the drop into a sheet thin enough to give rise to direct breakup (see sequence in Figure 7). However, the stress is still sufficiently large to flatten the drop considerably. The flattened drop relaxes into an elongated form (as for the bulb breakup morphology, cf. Figure 4). However, before a critical deformed neck has had time to form, a thin thread detangles itself from the surface (t/τη = 10–13, Figure 7). When the thread-neck has become sufficiently thin, the structure is critically deformed and will eventually release a small fragment from the top of the thread (Figure 7, t/τη = 15). This breakup morphology is referred to as ‘thread breakup’ in the present study.
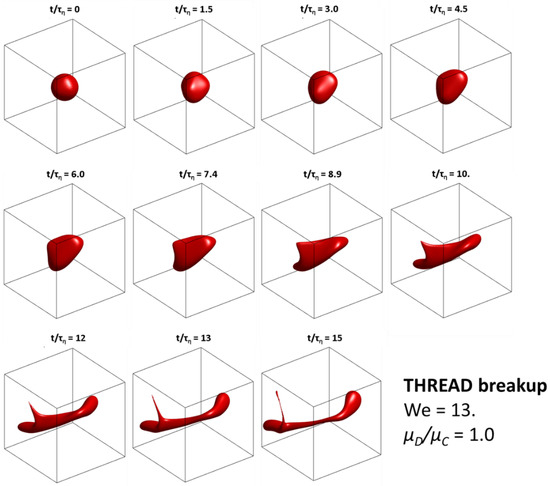
Figure 7.
Breakup sequence for We = 7.0, μD/μC = 1. Illustrating the thread breakup morphology. (Iso-surfaces at α = 0.5).
Returning to Figure 5, the bulb breakup morphology persists to We = 2.85, whereas We = 2.60 results in no breakup occurring before t = 90 τη. This suggests that the critical Weber number for the intermediary viscosity ratio is in the range 2.6–2.85, i.e., somewhat higher than for the low viscosity case (which is expected due to the extra resistance to deformation offered by the viscous resistance, cf. Equation (4)). However, as seen in Figure 5, if We is decreased further (from We = 2.55 to 2.4), bulb breakup re-appears in a narrow range (We = 2.2–2.4). Lowering the Weber number below We = 2.2, again, results in no breakup taking place during the investigated time span. This non-monotonous effect is, again, surprising (suggesting a more stabilized drop breaking when a less stabilized do not) and relates to the non-monotonous trend in breakup time observed for the low-viscosity case (red box in Figure 3). This phenomenon is discussed further in Section 3.4.
3.3. Effect of We at a High Viscosity Ratio (μD/μC = 40)
Figure 8 displays the morphology at initial breakup for the high-viscosity ratio drop (μD/μC = 40), as a function of Weber number. The corresponding breakup time can be seen in Figure 9. As seen in Figure 8, the drop is always stabilized enough to avoid it from thinning into a sheet (in the Weber number range investigated). The cases with a high Weber number (We = 100 and We = 60), result in thread breakup. At lower Weber numbers (We from 30 to 2.85), the combination of Laplace pressure and viscous stabilization hinders the thread from being pulled out from the drop, and deformation proceeds onwards to bulb breakup. A drop with a Weber number of two or below passes through a sequence of deformation–relaxation cycles but does not reach critical deformation under the investigated time span (i.e., tB > 90 τη). Thus, the critical Weber number is in the range 2.0–2.85 at this viscosity ratio.
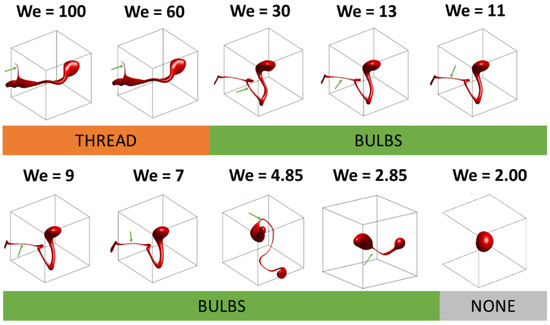
Figure 8.
Morphology at initial breakup as a function of Weber number for a high viscosity drop (μD/μC = 40). Green arrows show the point of initial detachment.
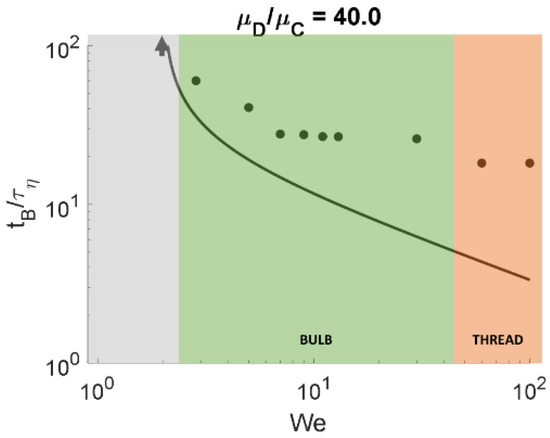
Figure 9.
Time of initial breakup, tB, as a function of Weber number, We, for a high viscosity drop (μD/μC = 40). Solid line displays average breakup time as suggested by Rivière et al. [24]. Arrows indicate cases with tB > 90 τη. Colored fields show breakup morphology; see Figure 8.
As seen from comparing Figure 8 (high viscosity) and Figure 2 (low viscosity), the viscosity clearly influences the breakup morphology. From previous investigations using emulsification experiments, it is well-known that viscosity adds a stabilizing term to the stress balance (Equation (2)), making larger fragments survive at increasing drop viscosities [6,8,11]. Furthermore, comparing Figure 2 and Figure 8 shows that viscosity also affects the fundamental morphology through which breakup takes place, i.e., modifying at which Weber number the transition between sheet and bulb breakup takes place and introducing an intermediary thread breakup under conditions of non-negligible viscous resistance.
3.4. Non-Monotonous Breakup and Turbulence Modulation
For both the low and the intermediary viscosity drop, we observe non-monotonic effects when varying the Weber number. In Figure 3 (μD/μC = 1.0), We = 2.85 breaks before We = 4.85, despite being more stabilized. Moreover, for the intermediary viscosity ratio case (μD/μC = 22), a We = 2.4 drop breaks, whereas at We = 2.6, the drop does not (see Figure 5). Both phenomena appear in relatively narrow We-intervals, indicating that they are secondary effects—the main effect is still an increased breakup tendency with increasing Weber number (as seen from breakup times in Figure 3, Figure 6 and Figure 9). However, the cause of this deviatory behavior must be understood in order to understand what controls the transition between breakup regimes.
The observed effects appear contra-intuitive at first glance since the Weber number is a direct measure of the external deforming stress in relation to the stabilizing Laplace pressure. Moreover, the viscosity ratio is constant, and the Ohnesorge number [52,53],
(where ρD denotes disperse phase density), describing the relative effect of viscous stabilization, is monotonically increasing across Weber numbers. Thus, there is no reason to expect drops with a lower Weber number to be more susceptible to breakup than higher Weber number drops simply due to viscous stabilization.
To understand the cause of this phenomenon, it must be kept in mind that We is defined based on the value of the time-averaged dissipation rate of turbulent kinetic energy, obtained from averaging before injecting the drop. All numerical experiments are conducted using a single flow realization (to ensure that the initial condition for the continuous phase is identical; see Section 2.2). However, it is well-known that the presence (as well as the deformation/breakup and coalescence) of dispersed drops, modulate the turbulence [45,46,47,48,49,50,51,52,53,54,55,56,57]. Thus, if the drops have different turbulence modulating effects, they do not necessarily experience the same turbulent stress, despite starting from the same flow realization. Figure 10A displays the dissipation rate of TKE (averaged across the simulation domain) as a function of time, comparing different Weber numbers, for the low-viscosity case. The dissipation rate of TKE varies over time, as expected due to intermittency [44,45]. A peak in turbulent dissipation can be seen close to t = 4 τη. This appears to correlate to the time when the total interfacial area of the deforming drop starts to increase rapidly (indicating fast deformation globally; see Figure 10B). As seen in Figure 10A, there is a systematic effect of the turbulence being slightly more suppressed the higher the Weber number. Thus, the more stabilized drop encounters somewhat stronger turbulent stresses. This trend of increased turbulence suppression with increasing Weber number is consistent with previous investigations of turbulence modulation in isotropic homogenous turbulence and has been hypothesized to relate to the increased extent of energy exchange for more deformable interfaces [39].
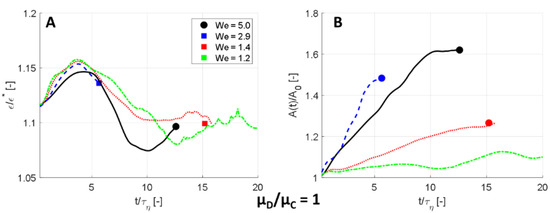
Figure 10.
Suppression of turbulence for the low viscosity drop (μD/μC = 1.0). (A) Dissipation rate of TKE, ε, normalized to the one-phase flow time-averaged value, ε*, as a function of time, t. (B) Total interfacial area, A, normalized with its initial value, A0.
Since turbulence suppression is a relatively weak function of Weber number, the general trend is still a faster deformation at lower Weber numbers at the low viscosity ratio. However, as seen in Figure 3, the effect is large enough to bring about a non-monotonic jump in breakup time, delaying breakup for a narrow range close to the critical Weber number (see red box in Figure 3).
Figure 11A displays the modulation of dissipation rate of TKE in the intermediary viscosity case (µD/µC = 22). From Figure 11B, showing the evolution of interfacial area with time, there appears to be two major periods of intense deformation (~8 τη and ~35 τη). Especially in the later deformation period, a clear and monotonic effect can be seen where the higher the Weber number, the greater the dissipation rate of TKE. The effect is still minor. However, when comparing drops with a relatively small difference in Weber number, it explains why more stabilized drops can sometimes break when less stabilized ones do not. From Figure 5, we see that We = 2.60 (less stabilized) does not break, whereas We = 2.40 (more stabilized) does break. The Laplace pressure stabilization is 7.4% higher for We = 2.40 compared to We = 2.6. This can be compared to the turbulence modulation effect, which gives a 3.1% lower dissipation rate of TKE for the high We drop. Since the turbulent disruptive stress scales with a dissipation rate of TKE to a power of 2/3 (Equation (3)), this results in a 9.9% higher disruptive stress for the We = 2.4 drop. Consequently, the turbulent decreases faster than the Laplace stabilization in this region of Weber numbers and the We = 2.4 drop breaks, despite being more stabilized, as observed in Figure 5.
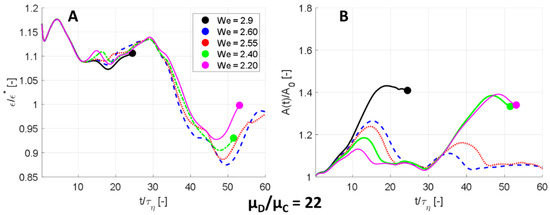
Figure 11.
Suppression of turbulence for an intermediary viscosity drop (μD/μC = 22). (A) Dissipation rate of TKE, ε, normalized to the one-phase flow time-averaged value, ε*, as a function of time, t. (B) Total interfacial area, A, normalized with its initial value, A0.
Finally, Figure 12A shows the turbulence modulation for the high viscosity case (μD/μC = 40). The same effect of increased turbulence attenuation with increasing We can be seen for the lower viscosity cases, at least for some intervals (i.e., at the deformation occurring at t/τη = 20 and between t/τη = 30–40; see Figure 12B). However, non-monotonic effects were not observed, either in terms of critical Weber number nor in terms of breakup time (see Figure 8 and Figure 9). This might be due to the increased stabilizing effect of viscosity (Oh = 0.5 at the critical Weber number for the high-viscosity case, as compared to Oh = 0.25 for the intermediary viscosity case).
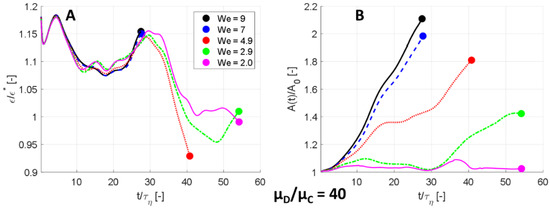
Figure 12.
Suppression of turbulence for a high viscosity drop (μD/μC = 40). (A) Dissipation rate of TKE, ε, normalized to the one-phase flow time-averaged value, ε*, as a function of time, t. (B) Total interfacial area, A, normalized with its initial value, A0.
3.5. A Parameter Map for Initial Breakup
A parameter map for the morphology of the initial breakup can be seen in Figure 13. Each marker displays the result of a numerical single drop breakup experiment, labeled according to type: S (sheet), T (thread), B (bulb) or N (no break occurring in the investigated time span). Note that Figure 13 includes all five viscosity ratios investigated (see Section 2.2). The horizontal axis displays the Weber number, and the vertical axis displays the viscosity ratio. Solid lines and colored fields have been added (free-hand) to illustrate the demarcation between regimes. As discussed above (Section 3.4), the opposing effect of turbulence modulation (suppression increases with increasing We) and stability (resisting Laplace pressure increases with We) can lead to non-monotonic transitions between regimes. This corresponds to narrow ‘exclaves’ in the phase space (see Figure 13). Only one such region was observed in the numerical experiments, but since the underlying phenomena can be seen at other viscosity ratios as well, narrow exclaves are expected to exist in the demarcation zone between bulb breakup and no breakup more generally.
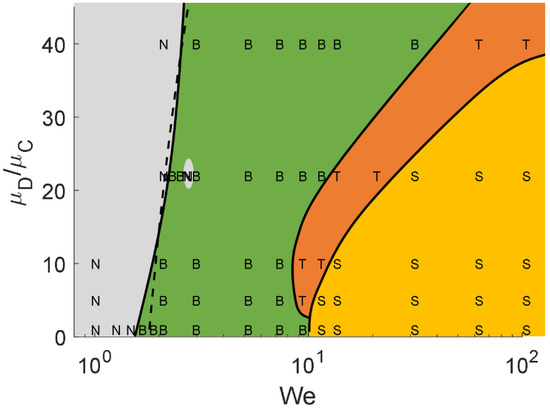
Figure 13.
Parameter map, showing the initial breakup morphology (S: Sheet, T: Thread, B: bulb; N: none) as a function of Weber number, We, and viscosity ratio, μD/μC. Solid lines and colored fields are free-hand attempts to illustrate demarcations between morphologies. Dashed line shows the effect of the viscosity ratio on critical Weber number according to the viscosity-corrected Kolmogorov–Hinze theory [8] (rescaled with a proportionality constant complying with the numerical simulations; see text).
The map in Figure 13 can be used for obtaining an overview of how the different factors influence breakup morphology: First, if the Weber number is sufficiently low, no breakup occurs. The demarcation line to the grey region (‘no breakup’) corresponds to the critical Weber number. As seen in Figure 13 (and discussed above) it increases slowly with increasing viscosity ratio. Such a gradual increase is also predicted by the viscosity-corrected Kolmogorov–Hinze theory (Equation (2)). The particular fitting parameters suggested by Vankova et al. [8] predict a lower critical Weber number than above (c1 = 0.86 and c2 = 0.37 corresponds to WeCr = 0.61 at μD/μC = 1). To allow for a quantitative comparison of how the critical Weber number scales with viscosity according to Kolmogorov–Hinze theory, however, the semi-empirical prediction of critical Weber number has been introduced as a dashed line in Figure 13, scaled so as to give a critical Weber number of 1.8 at μD/μC = 1. As seen in the figure, similar trends of how viscosity influences the critical Weber number are obtained after rescaling.
Returning to the parameter map in Figure 13, the lower right corner of the map corresponds to conditions where the drops are poorly stabilized (high We and low viscosity). The lack of resistance to breakup results in the heavily and multi-directionally deformed sheet breakup morphology. The parameter range of sheet breakup grows narrower the higher the viscosity ratio, further illustrating the effect of viscosity in contributing to the stability of the drop.
The thread breakup morphology occurs as an intermediary between the bulb and sheet breakup and appears in a wider Weber number range the higher the viscosity ratio (at the expense of the sheet breakup regime). Thread breakup does not occur if the viscosity ratio is too low (see Figure 2), indicating that thread formation can be attributed to drop viscosity.
The bulb breakup regime, finally, exists in a wide interval of intermediary Weber numbers. The span of Weber numbers giving rise to bulb breakup varies with viscosity ratio and is minimal at an intermediary viscosity ratio (μD/μC ~5–10).
Here it should be remembered that the investigations in this study are based on one flow realization. Turbulence intermittence implies that each drop entering the turbulence (i.e., the effective region of breakup in the emulsification device) will experience a different stress history and stress distribution. Extensive comparisons between flow realizations at constant Weber number and viscosity ratio also show some variation in terms of when transitions occur [12,43]. However, these effects are relatively small when comparing over spans of Weber number and viscosity ratios in Figure 13.
It could also be mentioned that the effect of Weber number was studied by varying interfacial tension (see Section 2.2). As discussed above, the large amount of experimental data captured by the viscosity-corrected Kolmogorov–Hinze theory suggests that the parameters contained in the Weber number do not influence the outcome individually (but only in their combined effect on We); see Equations (2)–(4). However, this has not been explicitly tested in the current study.
Lastly, the results in the present study are based on numerical experiments. In comparison to in vitro experiments (e.g., in the form of high-speed photographic breakup visualizations) would be an interesting continuation of the present study, not at least since there is a general lack of such comparisons in the field of numerical breakup visualizations [21,22,23,24,25,26,27].
3.6. Practical Implications for Emulsification Processes
Emulsification processes such as high-pressure homogenizers and rotor-stator mixers are common unit operations. However, they give rise to a relatively high energy cost. To ensure that the resulting emulsion has the desired properties (i.e., the drop-size distribution giving rise to the desired texture, appearance and physical stability) at minimal energy cost, process optimization is essential. Population balance modeling is one commonly suggested approach for predicting how the resulting drop-size distribution depends on operating conditions [3,29,30]. However, this approach requires accurate specification of drop breakup rates and fragment size distributions.
The Kolmogorov–Hinze theory, with its modifications for drop viscosity [6,8,11] and intermittency [44] suggests two breakup regimes [3,8,58]: turbulent inertial breakup and turbulent viscous breakup depending on the drop diameter to Kolmogorov length scale ratio. This distinction has often been used in attempts to model emulsification processes, e.g., specifying one breakup frequency and fragment size distribution for each regime [29,30,59].
The initial drop diameter to Kolmogorov length scale is well above unity (D/η = 22) for all We and viscosity ratios investigated in the present study. Thus, the studied cases are all in the turbulent inertial regime. However, the numerical single drop breakup experiments show three distinctive breakup morphologies. Note that there are considerable differences between these morphologies, especially in terms of the amount and size of fragments that are formed. As an example, an almost uniform fragment size assumption [60,61] is expected to fit the breakup in the sheet regime (since the extensively deformed sheet breaks chaotically into multiple small fragments), whereas a distribution skewed to larger sizes [62,63,64,65] is more likely to fit a breakup occurring in the bulb regime (where a breakup generates two larger fragments and an array of satellites). This suggests that predictive emulsification modeling needs to describe the transition between these breakup morphologies occurring inside the turbulent inertial breakup regime.
Although three distinct breakup morphologies can be identified, the bulb morphology is of special interest. Considering an industrial setting using an emulsification device such as a high-pressure homogenizer or a rotor-stator mixer, a broad range of drop sizes enter the turbulent breakup zone. Drops of different sizes have different Weber numbers and, consequently, experience different breakup morphologies. The physical stability of the resulting emulsion is determined by the largest drops surviving passage, and these are, in turn, determined by the largest drops surviving passage through the turbulent zone. Figure 13 suggests that this limiting breakup event will take place through the bulb morphology, regardless of the viscosity ratio.
Moreover, Section 3.4 also shows the importance of correctly including turbulence modulation in the modeling emulsification processes. Whereas turbulence suppression from having a high-volume fraction of disperse phase is well-known and has been included in breakup frequency models since the 1970s [63], the Weber-number dependence on turbulence remains to be included in these modeling frameworks.
4. Conclusions
Three breakup morphologies (or ‘sub-regimes’) can be identified when comparing across different Weber numbers and viscosity ratios: sheet, thread and bulb breakup. All three morphologies are found under conditions where the initial drop diameter is larger than the Kolmogorov length scale (corresponding to the turbulent inertial regime).
Sheet breakup occurs when the disruptive stress is large in relation to the Laplace pressure and the viscous stabilization; the drop is heavily deformed into a thin sheet which, in a rapid succession of breakup events, fragments into multiple small drops.
Thread breakup only occurs at viscosity ratios above unity and becomes more pronounced with increasing drop viscosity. It consists of external stresses pulling out a small drop volume, extending it into a narrow thread from which a small fragment is eventually detached.
Bulb breakup (drop first elongating, then forming a narrowing neck between two bulbs) occurs in intermediary Weber numbers. The limiting drop in a Kolmogorov–Hinze interpretation (i.e., the drop that is just large enough to become critically deformed) breaks in the bulb regime, regardless of the viscosity ratio. This suggests that bulb breakup is the morphology of interest for attempts to better understand what limits turbulent drop breakup.
Beyond a critical Weber number, no breakup takes place. This critical Weber number increases somewhat with viscosity ratio (in agreement with previously suggested correlations based on emulsification experiments).
Moreover, the simulations show cases of non-monotonic trends, where more stabilized drops (higher We) break faster than less stabilized drops and where more stabilized drops break under conditions where less stabilized drops do not. This can be explained by the difference in how drops of different Weber numbers modulate the turbulence in the region around the drop. However, it also suggests that a morphology map (Figure 13) can include ‘exclaves’ (i.e., narrow parameter ranges leading to no breakup inside of the bulb breakup regime).
Author Contributions
Conceptualization, A.H. and F.I.; methodology, A.H. and P.O.; software, A.H.; validation, A.H. and P.O.; formal analysis, A.H.; investigation, A.H.; resources, A.H.; writing—original draft preparation, A.H.; writing—review and editing, P.O.; supervision, A.H. and F.I.; funding acquisition, A.H. All authors have read and agreed to the published version of the manuscript, with the exception of F.I., who passed away before the manuscript was submitted.
Funding
This research was funded by The Swedish Research Council (VR), grant number 2018–03820, and Tetra Pak Processing Systems AB.
Institutional Review Board Statement
Not applicable.
Informed Consent Statement
Not applicable.
Data Availability Statement
Data available via corresponding author.
Acknowledgments
Luca Brandt and Marco Crialesi-Esposito are gratefully acknowledged for supplying the in-house code used for the numerical breakup experiments.
Conflicts of Interest
The authors declare no conflict of interest.
Appendix A
The code for running the numerical drop breakup experiments is based on dimensionless parameters. The detailed parameter values (in the dimensionless form used in the code) representing the cases in Table 1, can be found in Table A1 and Table A2.

Table A1.
Parameter settings (densities and viscosities) corresponding to the simulated cases (see Table 1) in the dimensionless units used in the code. The dissipation rate of TKE (averaged over space and time) is 3.07 (-), and the initial drop diameter is 2 (-). The length of the simulation domain is 2π.
| μD/μC | ρC (-) | ρC (-) | μC (-) | μD (-) |
|---|---|---|---|---|
| 1.0 | 1.0 | 1.0 | 0.06 | 0.06 |
| 5.0 | 1.0 | 1.0 | 0.06 | 0.30 |
| 10 | 1.0 | 1.0 | 0.06 | 0.60 |
| 22 | 1.0 | 1.0 | 0.06 | 1.32 |
| 40 | 1.0 | 1.0 | 0.06 | 2.40 |

Table A2.
Parameter settings (interfacial tension) corresponding to the simulated cases (see Table 1) in the dimensionless units used in the code. The dissipation rate of TKE (averaged over space and time) is 3.07 (-), and the initial drop diameter is 2 (-). The length of the simulation domain is 2π.
| We | 100 | 60 | 30 | 20 | 13 | 11 | 9.0 | 7.0 | 4.85 | 2.85 | 2.60 | 2.55 | 2.40 | 2.20 | 2.00 | 1.80 | 1.60 | 1.40 | 1.20 | 0.96 |
| γ (-) | 0.13 | 0.23 | 0.469 | 0.67 | 1.00 | 1.22 | 1.49 | 1.92 | 2.80 | 4.70 | 5.16 | 5.26 | 5.54 | 6.09 | 6.70 | 7.45 | 8.38 | 9.58 | 11.18 | 14.0 |
References
- McClements, D.J. Food Emulsions: Principles, Practices, and Techniques, 3rd ed.; CRC Press: Boca Raton, FL, USA, 2016. [Google Scholar]
- Tadros, T.F. Emulsion Formation and Stability; Wiley-VCH: Weinheim, Germany, 2013. [Google Scholar]
- Håkansson, A. Emulsion Formation by Homogenization: Current Understanding and Future Perspectives. Annu. Rev. Food Sci. Technol. 2019, 10, 239–258. [Google Scholar] [CrossRef] [PubMed]
- Kale, S.N.; Deore, S.L. Emulsion Micro Emulsion and Nano Emulsion: A Review. Syst. Rev. Pharm. 2017, 8, 39–47. [Google Scholar] [CrossRef]
- Walstra, P. Effect of homogenization on teh fat globule size distribution in milk. Neth. Milk Dairy J. 1975, 29, 279–294. [Google Scholar]
- Calabrese, R.V.; Chang, T.P.K.; Dang, P.T. Drop breakup in turbulent stirred-tank contactors. Part I: Effect of dispersed-phase viscosity. AIChE J. 1986, 32, 657–666. [Google Scholar] [CrossRef]
- Pandolfe, W.D.J. Effect of dispersed and continuous phase viscosity on droplet size of emulsions generated by homogenization. Dispers. Sci. Technol. 1981, 2, 459–474. [Google Scholar] [CrossRef]
- Vankova, N.; Tcholakova, S.; Denkov, N.D.; Ivanov, I.; Vulchev, V.D.; Danner, T.J. Emulsification in turbulent flow: 1. Mean and maximum drop diameters in inertial and viscous regimes. Colloid Interface Sci. 2007, 312, 363–380. [Google Scholar] [CrossRef] [PubMed]
- Boxall, J.A.; Koh, C.A.; Sloan, E.D.; Sum, A.K.; Wu, D.T. Droplet size scaling of water-in-oil emulsions under turbulent flow. Langmuir 2012, 28, 104–110. [Google Scholar] [CrossRef]
- Gupta, A.; Eral, H.B.; Hatton, T.A.; Doyle, P.S. Controlling and predicting droplet size of nanoemulsions: Scaling relations with experimental validation. Soft Matter 2016, 12, 1452–1458. [Google Scholar] [CrossRef]
- Davies, J.T. Drop sizes of emulsions related to turbulent energy dissipation rates. Chem. Eng. Sci. 1985, 40, 839–842. [Google Scholar] [CrossRef]
- Håkansson, A.; Brandt, L. Deformation and initial breakup morphology of viscous emulsion drops in isotropic homogeneous turbulence with relevance for emulsification devices. Chem. Eng. Sci. 2022, 253, e117599. [Google Scholar] [CrossRef]
- Herø, E.H.; La Forgia, N.; Solsvik, J.; Jakobsen, H.A. Single drop breakage in turbulent flow: Statistical data analysis. Chem. Eng. Sci. X 2020, 8, 100082. [Google Scholar] [CrossRef]
- Kelemen, K.; Gepperth, S.; Koch, R.; Bauer, H.J.; Schuchmann, H.P. On the visualization of droplet deformation and breakup during high-pressure homogenization. Microfluid. Nanofluid. 2015, 19, 1139–1158. [Google Scholar] [CrossRef]
- La Forgia, N.; Herø, E.H.; Jakobsen, H.A. High-speed image processing of fluid particle breakage in turbulent flow. Chem. Eng. Sci. X 2021, 12, e100117. [Google Scholar] [CrossRef]
- Maaß, S.; Kraume, M. Determination of breakage rates using single drop experiments. Chem. Eng. Sci. 2012, 70, 146–164. [Google Scholar] [CrossRef]
- Masuk, A.U.M.; Salibindla, A.K.R.; Ni, R.J. Simultaneous measurements of deforming Hinze-scale bubbles with surrounding turbulence. Fluid Mech. 2021, 910, A21. [Google Scholar] [CrossRef]
- Qi, Y.; Tan, S.; Corbitt, N.; Urbanik, C.; Salibindla, A.K.R.; Ni, R. Fragmentation in turbulence by small eddies. Nat. Commun. 2022, 13, 469. [Google Scholar] [CrossRef]
- Solsvik, J.; Jakobsen, H.A. A review of the statistical turbulence theory required extending the population balance closure models to the entire spectrum of turbulence. AIChE J. 2016, 62, 1795–1820. [Google Scholar] [CrossRef]
- Vejražka, J.; Zedníková, M.; Stranovský, P. Experiments on breakup of bubbles in a turbulent flow. AIChE J. 2018, 64, 740–757. [Google Scholar] [CrossRef]
- Karimi, M.; Andersson, R. Dual mechanism model for fluid particle breakup in the entire turbulent spectrum. AIChE J. 2019, 65, e16600. [Google Scholar] [CrossRef]
- Komrakova, A.E. Single drop breakup in turbulent flow. Can. J. Chem. Eng. 2019, 97, 2727–2739. [Google Scholar] [CrossRef]
- Qian, D.; McLaughlin, J.B.; Sankaranarayanan, K.; Sundaresan, S.; Kontomaris, K. Simulation of bubble breakup dynamics in homogeneous turbulence. Chem. Eng. Commun. 2006, 193, 1038–1063. [Google Scholar] [CrossRef]
- Rivière, A.; Mostert, W.; Perrard, S.; Deike, L.J. Sub-Hinze scale bubble production in turbulent bubble break-up. Fluid Mech. 2021, 917, A40. [Google Scholar] [CrossRef]
- Rosti, M.E.; De Vita, F.; Brandt, L. Numerical simulations of emulsions in shear flows. Acta Mech. 2019, 230, 667–682. [Google Scholar] [CrossRef]
- Shao, C.; Luo, K.; Yang, Y.; Fan, J. Direct numerical simulation of droplet breakup in homogeneous isotropic turbulence: The effect of the Weber number. Int. J. Multiph. Flow 2018, 107, 263–274. [Google Scholar] [CrossRef]
- Vela-Martín, A.; Avila, M. Deformation of drops by outer eddies in turbulence. J. Fluid Mech. 2021, 929, A38. [Google Scholar] [CrossRef]
- Lewerentz, F.; Pappas, K.; Bergenståhl, B.; Håkansson, A. The effect of disperse phase viscosity in the emulsification of a semi-dairy beverage–combining emulsification experiments and numerical single drop breakup simulations. Food Bioprod. Process. 2022; submitted. [Google Scholar]
- Raikar, N.B.; Bhatia, S.R.; Malone, M.F.; McClements, D.J.; Henson, M.A. Predicting the Effect of the Homogenization Pressure on Emulsion Drop-Size Distributions. Ind. Eng. Chem. 2011, 50, 6089–6100. [Google Scholar] [CrossRef]
- Maindarkar, S.N.; Hoogland, H.; Hansen, M.A. Predicting the combined effects of oil and surfactant concentrations on the drop size distributions of homogenized emulsions. Coll. Surf. A Physicochem. Eng. Asp. 2015, 467, 18–30. [Google Scholar] [CrossRef]
- Guan, X.; Yang, N.; Nigam, K.D. Prediction of Droplet Size Distribution for High Pressure Homogenizers with Heterogeneous Turbulent Dissipation Rate. Ind. Eng. Chem. Res. 2020, 59, 4020–4032. [Google Scholar] [CrossRef]
- Aiyer, A.K.; Yang, D.; Chamecki, M.; Meneveau, C. A population balance model for large eddy simulation of polydisperse droplet evolution. J. Fluid Mech. 2019, 878, 700–739. [Google Scholar] [CrossRef]
- Salehi, F.; Cleary, M.J.; Masri, A.R. Population balance equation for turbulent polydispersed inertial droplets and particles. J. Fluid Mech. 2017, 831, 719–742. [Google Scholar] [CrossRef]
- Liao, Y.; Lucas, D. A literature review of theoretical models for drop and bubble breakup in turbulent dispersions. Chem. Eng. Sci. 2009, 64, 3389–3406. [Google Scholar] [CrossRef]
- Solsvik, J.; Tangen, S.; Jakobsen, H.A. On the constitutive equations for fluid particle breakage. Rev. Chem. Eng. 2013, 29, 241–356. [Google Scholar] [CrossRef]
- Håkansson, A. Towards a Standard Method for Estimating Fragmentation Rates in Emulsification Experiments. Processes 2021, 9, 2242. [Google Scholar] [CrossRef]
- Solsvik, J.; Maaß, S.; Jakobsen, H.A. Definition of the Single Drop Breakup Event. Ind. Eng. Chem. 2016, 55, 2872–2882. [Google Scholar] [CrossRef]
- Costa, P. A FFT-based finite-difference solver for massively-parallel direct numerical simulations of turbulent flows. Comput. Math. Appl. 2018, 76, 1853–1862. [Google Scholar] [CrossRef]
- Crialesi-Esposito, M.; Rosti, M.E.; Chibbaro, S.; Brandt, L.J. Modulation of homogeneous and isotropic turbulence in emulsions. Fluid. Mech. 2022, 940, A19. [Google Scholar] [CrossRef]
- Ii, S.; Xie, B.; Xiao, F.J. An interface capturing method with a continuous function: The THINC method on unstructured triangular and tetrahedral meshes. Comput. Phys. 2014, 259, 260–269. [Google Scholar] [CrossRef]
- Mininni, P.D.; Alexakis, A.; Pouquet, A. Large-scale flow effects, energy transfer, and self-similarity on turbulence. Phys. Rev. E 2016, 74, 016303. [Google Scholar] [CrossRef]
- Vallefuoco, D.; Naso, A.; Godeferd, F.S. Small-scale anisotropy induced by spectral forcing and by rotation in non-helical and helical turbulence. J. Turbul. 2018, 19, 107–140. [Google Scholar] [CrossRef]
- Håkansson, A.; Crialesi-Esposito, M.; Nilsson, L.; Brandt, L. A criterion for when an emulsion drop undergoing turbulent deformation has reached a critically deformed state. Coll. Surf. A Physicochem. Eng. Asp. 2022, 648, 129213. [Google Scholar] [CrossRef]
- Bałdyga, J.; Podgorska, W. Drop break-up in intermittent turbulence: Maximum stable and transient sizes of drops. Can. J. Chem. Eng. 1998, 76, 456–470. [Google Scholar] [CrossRef]
- Pope, S.B. Turbulent Flows; Cambridge University Press: Cambridge, UK, 2000. [Google Scholar]
- Wang, G.; Yang, F.; Wu, K.; Ma, Y.; Peng, C.; Liu, T.; Wang, L.-P. Estimation of the dissipation rate of turbulent kinetic energy: A review. Chem. Eng. Sci. 2021, 229, 116133. [Google Scholar] [CrossRef]
- Guo, Z.; Fletcher, D.F.; Haynes, B.S. A Review of Computational Modelling of Flow Boiling in Microchannels. J. Comput. Multiph. Flows 2014, 6, 79–110. [Google Scholar] [CrossRef]
- Soh, G.Y.; Yeoh, G.H.; Timchenko, V. An algorithm to calculate interfacial area for multiphase mass transfer through the volume-of-fluid method. Int. J. Heat Mass Transf. 2016, 100, 573–581. [Google Scholar] [CrossRef]
- Kulkarni, V.; Sojka, P.E. Bag breakup of low viscosity drops in the presence of a continuous air jet. Phys. Fluids 2014, 26, 072103. [Google Scholar] [CrossRef]
- Innings, F.; Trägårdh, C. Visualization of the Drop Deformation and Break-Up Process in a High Pressure Homogenizer. Chem. Eng. Tech. 2005, 28, 882–891. [Google Scholar] [CrossRef]
- Preiss, F.J.; Mutsch, B.; Kähler, C.J.; Karbstein, H.P. Scaling of Droplet Breakup in High-Pressure Homogenizer Orifices. Part I: Comparison of Velocity Profiles in Scaled Coaxial Orifices. ChemEngineering 2021, 5, 7. [Google Scholar] [CrossRef]
- Elghobashi, S. Direct Numerical Simulation of Turbulent Flows Laden with Droplets or Bubbles. Annu. Rev. Fluid Mech 2019, 51, 217–244. [Google Scholar] [CrossRef]
- Lalanne, B.; Masbernat, O.; Risso, R. A model for drop and bubble breakup frequency based on turbulence spectra. AIChE J. 2019, 65, 347–359. [Google Scholar] [CrossRef]
- Poelma, C.; Ooms, G. Particle-Turbulence Interaction in a Homogeneous, Isotropic Turbulent Suspension. Appl. Mech. Rev. 2006, 59, 78–90. [Google Scholar] [CrossRef]
- Håkansson, A.; Fuchs, L.; Innings, F.; Revstedt, J.; Trägårdh, C.; Bergenståhl, B. Particle-Turbulence Interaction in a Homogeneous, Isotropic Turbulent Suspension. Chem. Eng. Commun. 2013, 200, 93–114. [Google Scholar] [CrossRef]
- Hetstroni, G. Particles-turbulence interaction. Int. J. Multiph. Flow 1989, 15, 735–746. [Google Scholar] [CrossRef]
- Brandt, L.; Coletti, F. Particle-Laden Turbulence: Progress and Perspectives. Annu. Rev. Fluid Mech. 2022, 54, 159–189. [Google Scholar] [CrossRef]
- Walstra, P.; Smulders, P.E.A. Emulsion Formation. In Modern Aspects of Emulsion Science; Binks, B.P., Ed.; The Royal Society of Chemistry: Cambridge, UK, 1998; pp. 56–99. [Google Scholar]
- Håkansson, A.; Trägårdh, C.; Bergenståhl, B. Dynamic simulation of emulsion formation in a high pressure homogenizer. Chem. Eng. Sci. 2009, 64, 2915–2925. [Google Scholar] [CrossRef]
- Prince, M.J.; Blanch, H.W. Bubble coalescence and break-up in air-sparged bubble columns. AIChE J. 1990, 36, 1485–1499. [Google Scholar] [CrossRef]
- Narsimhan, G.; Gupta, J.P.; Ramkrishna, D. A model for transitional breakage probability of droplets in agitated lean liquid-liquid dispersions. Chem. Eng. Sci. 1979, 34, 357. [Google Scholar] [CrossRef]
- Tcholakova, S.; Vankova, N.; Denkov, N.D.; Danner, T.J. Emulsification in turbulent flow: 3. Daughter drop-size distribution. Colloid Interface Sci. 2007, 310, 570. [Google Scholar] [CrossRef]
- Coulaloglou, C.A.; Tavlarides, L.L. Description of interaction processes in agitated liquid-liquid dispersions. Chem. Eng. Sci. 1977, 32, 1289. [Google Scholar] [CrossRef]
- Martínez-Bazán, C.; Montañés, J.L.; Lasheras, J.C. On the breakup of an air bubble injected into a fully developed turbulent flow. Part 1. Breakup frequency. J. Fluid Mech. 1999, 401, 157. [Google Scholar] [CrossRef]
- Xing, C.; Wang, T.; Guo, K.; Wang, J. A unified theoretical model for breakup of bubbles and droplets in turbulent flows. AIChE J. 2015, 61, 1391. [Google Scholar] [CrossRef]
Publisher’s Note: MDPI stays neutral with regard to jurisdictional claims in published maps and institutional affiliations. |
© 2022 by the authors. Licensee MDPI, Basel, Switzerland. This article is an open access article distributed under the terms and conditions of the Creative Commons Attribution (CC BY) license (https://creativecommons.org/licenses/by/4.0/).