Abstract
Renewable energy is a key technology for achieving carbon-free energy transitions, and solar power systems are one of the most reliable resources for achieving this. Solar power systems have a simple structure and are inexpensive. However, depending on the input irradiance, the existing maximum output control algorithm (P&O) has disadvantages due to its slow transient response and steady-state vibration. Therefore, in this paper, we propose a maximum output control algorithm based on a deep learning algorithm that can predict the input irradiance. This can achieve a quick transient response and steady-state stability. The proposed method predicts the irradiance based on the output voltage/current and power of the photovoltaic (PV) system and calculates the duty ratio that can accurately follow the maximum output point according to the irradiance. The deep learning model applied in this study was trained based on the experimental results using a 100 W PV panel, and the performance of the proposed algorithm was verified by comparing its performance with that of the conventional algorithm under various input irradiance conditions. The proposed algorithm exhibits a maximum efficiency increase of 11.24% under the same input conditions as those of the existing algorithms.
1. Introduction
Many countries are already making efforts on low carbon and greenhouse gas reduction for carbon neutrality. The method using renewable energy is the most important policy for carbon neutrality [1]. Among existing renewable energy sources, photovoltaics is a promising resource that provide large amounts of energy [2,3,4]. In addition, the PV (solar photovoltaic) power generation system can easily expand its capacity and can be an alternative to environmental pollution. Furthermore, it is characterized by low maintenance costs. However, PV solar power faces several challenges, including high installation costs, low efficiencies, and weather-dependent energy generation [5,6,7,8]. Taking into account the changing environmental conditions, the efficiency of solar panels is between 9% and 17% [9]. In addition, the weather dependence of solar energy makes the solar system an unstable power source. Therefore, a good control strategy is essential to ensure the efficient and safe operation of PV systems. The I-V and P-V characteristic curves of a solar panel change non-linearly according to the amount of insolation and the temperature of the module. A unique point on the P-V curve, called the maximum power point (MPP), is where the optimal power is delivered. Therefore, different tracking algorithms have been proposed for the maximum power point tracking (MPPT) in PV applications under different irradiance conditions [10,11,12,13,14]. Among MPPT technologies for photovoltaic power generation, the industry mainly uses partial short current, partial open circuit voltage, perturbation and observation (P&O), hill climbing (HC) and incremental conductance (IC) methods due to their low cost [15,16,17]. Although the simple method is widely applied in industry, it does not guarantee accurate operations under varying insolation and shading conditions. These methods have major problems involving low tracking rates and high steady-state oscillations. Therefore, research has been conducted to overcome the shortcomings of existing technology by applying soft computing-based MPPT technology. Typical examples include fuzzy logic control, sliding mode control, artificial neural networks, and genetic algorithms.
These MPPT methods can overcome the limitations of general algorithms by applying computational methods and follow the global optimum. However, the computational burden and complexity of these computational algorithms are unavoidable problems [5,18,19]. Researchers have invested efforts into developing MPPT algorithms to improve the response of PV systems. Ghassami et al. in [20] reported that an improved P&O MPPT algorithm was introduced to improve the tracking efficiency of PV systems under rapidly changing irradiation conditions. However, steady-state system oscillations exhibit slow tracking responses in PV systems with high oscillations. Elgendy et al. applied IC MPPT technology to set a dynamic response that satisfies certain permissible conditions even under rapidly changing insolation conditions. However, in order to satisfy this method, a special controller specification is inevitably required, and the amount of calculation rapidly increased. Belkaid et al. in [21] reported that an MPPT algorithm that considered IC trackers was presented to improve the dynamic response of the system. However, it still had a relatively slow response time compared with that of other algorithms. In [22], MPPT technology that considered a photodiode as an irradiance sensor was presented. However, the proposed method was applicable only to small and simple PV systems. Bayod-Rújula et al. applied a new MPPT algorithm to improve the dynamic response and accuracy. The method shown in [23] had a low relative MPP follow-up rate. In conclusion, a neural network-based [24] paper was studied. However, implementing an MPPT strategy involved a complex computational burden. Ahmed et al. proposed an improved P&O algorithm, which enabled steady-state vibration reductions. Ali et al. showed a fast transient response and changed the size of the voltage increment step according to the PV operating area. However, steady-state oscillations were observed in the PV system. Existing studies focused on fast response or steady-state vibration reduction; however, there are limitations.
Recently, extensive research on deep learning algorithms focused on the excellent learning ability from environmental interaction historical data instead of the requirements of the complex mathematical models of control systems as in the conventional MPPT method [25,26]. In Kofinas et al.’s study [27], RL is a potential tool for optimally solving MPPT control problems because of its shorter computation time and higher convergence stability compared to meta-heuristic methods. In particular, research implementing deep learning for MPPT control of solar energy conversion systems can be found in [27,28,29]. However, this approach has the disadvantage of data count. Kofinas et al. [27] used a combination of 800 states and 5 actions to form a state action space of 4000 state actions, whereas Hsu et al. [28] and Youssef [29] only used four states. As a result, systems with large states and workspaces required longer periods for computation. Additionally, a new deep learning algorithm-based MPPT control for PV systems under partial shade conditions has been developed [30] and a deep learning algorithm approach has been studied to deal with the global maximum power point tracking problem [31,32]. However, in general, the main drawbacks of the aforementioned methods are that they are fast computations and use large amounts of data. However, the method proposed in this paper was able to implement the algorithm of the deep learning model with a simple learned model.
Therefore, in this paper, irradiance is predicted using a deep learning algorithm, and the duty ratio that follows the maximum output point is calculated based on these predicted irradiance data. Because it precisely follows the optimum point, it is possible to minimize the vibration with a quick dynamic response and steady-state operation. The proposed tracking algorithm was applied to various actual insolation data, which confirmed the efficiency of the proposed tracking algorithm in the irradiance estimation strategy. The proposed algorithm showed an efficiency increase of up to 11.24% under actual insolation conditions compared with the existing algorithm.
The remainder of this paper is organized as follows. Section 2 describes the modeling and control algorithm of the existing solar power generation system, and Section 3 describes the proposed algorithm. Section 4 describes the deep learning model applied in this study, and Section 5 presents the results and analysis. Finally, conclusions are presented in Section 6.
2. Solar Power Generation System Modeling and Conventional Control Algorithms
2.1. PV Cell Modeling
PV cells are the main component of solar power systems that can be used by customers to convert solar energy into electrical energy. Solar cells can be combined in parallel and series to change the output voltage, current and rating of the solar panel. That is, the power required by the load can be satisfied by configuring the solar cells in series and in parallel.
Figure 1 shows the configuration of a typical PV system. The solar power system consists of two stages. The solar cell outputs a DC voltage that charges the battery via a DC/DC converter, and the battery voltage is connected to the grid via an AC inverter. The mathematical modeling of the solar panel can be represented by a simplified model, and the equivalent circuit model is shown in Figure 2.
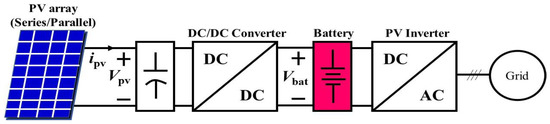
Figure 1.
Configuration diagram of a typical PV system with two stages (DC-DC converter and DC-AC inverter).
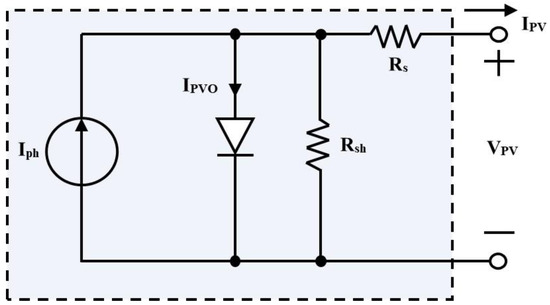
Figure 2.
Single-diode PV cell equivalent circuit.
The voltage–current relationship in a PV system can be described as follows:
where Rs and Rsh are the series and shunt resistors, respectively; Iph is the photocurrent of the PV cell; A is the p-n ideality factor; IPVO is the reverse saturation current; K is the Boltzmann constant (1.38 × 10⁻²³ J/K); q is the electronic charge (1.602 × 10⁻¹⁹ C); T is the temperature of the cell (in Kelvin).
To optimize the fill factor, the ratio of the photocurrent to the reverse saturation current was maximized while minimizing the series resistance, Rs, and the maximum shunt resistance Rsh within the PV cell. Therefore, it can be assumed that the series resistor Rs is close to zero and the shunt resistor Rsh is close to infinity. We can simplify (2) by ignoring Rs and Rsh, as shown in the formula below [33].
2.2. Boost Converter (BC) Modeling
The power conversion system (DC-DC) is the path that connects the solar cell and the grid inverter. The power conversion system (DC-DC) is used for boosting DC voltages and for the optimal operation of solar panels [34].
The dynamic model of the power converter (DC-DC) can be expressed as follows [35].
Here, Vo is the DC-DC output DC voltage, and idc is the current of the grid inverter. The power converter’s (DC-DC) output voltage can be expressed as a function of input voltage Vpv and converter switch duty ratio D. L represents an inductor of BC, and Cout represents the output filter capacitor.
2.3. Conventional MPPT Control Algorithm (P&O Algorithm)
The PV cell must implement an MPPT algorithm so that the voltage operates close to the maximum power point in an environment with changing inputs. A solar power system consists of a PV panel, DC/DC converter, battery, and control algorithm, which are typically controlled by a controller to keep track of maximum power. The MPPT is also used to provide a constant voltage to the required load.
Because the general MPPT method is simple and easy to implement, it is currently applied in multiple areas in the industry. The most applied P&O algorithm changes the output power (ΔP) of the solar panel and changes the operating position appropriately through voltage increments (ΔV) in Figure 3. The red line in Figure 3 is an increasing voltage and the blue line is a decreasing voltage. That is, the maximum power point is found by changing the step up to the maximum power point (MPP). The ratio of the change in power (P) to voltage (V) is considered the duty ratio, D, which is the slope of each operating point over a short sampling time. That is, when the magnitude of the voltage increment increased, a fast response can be obtained, but the stability of the steady state is reduced. Conversely, when the magnitude of the voltage increment decreases, a fast response cannot be ob-tained. P&O methods must overcome these limitations.
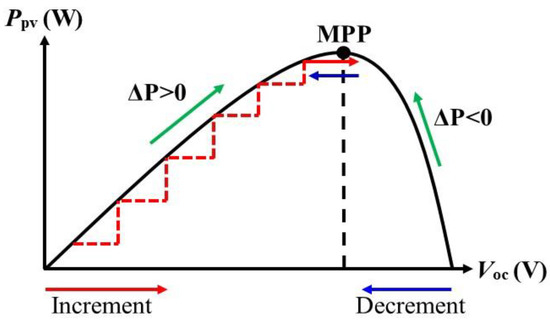
Figure 3.
Control strategy of the conventional P&O algorithm.
3. Proposed Maximum Power Point Tracking Algorithm
The PV system must apply the MPPT algorithm to operate close to the maximum power, depending on the environmental inputs. Among the existing PV system MPPT methods, the P&O method has many advantages, such as the simplicity of control implementation and simple settings; however, the voltage ripple may increase at the optimum point depending on the voltage’s increment size. It also has the disadvantage that tracking can be extremely slow during transient periods. Therefore, in this study, we applied a deep learning algorithm to predict the illuminance, and based on the illuminance, we directly calculated the duty ratio that could follow the MPP. As the maximum output point changes according to the illuminance of the solar power generation system, it is always possible to quickly calculate the duty ratio to follow the maximum output point to predict the illuminance. A deep learning algorithm for predicting illuminance constructs a deep learning neural network based on the solar panel voltage and current. Figure 4 shows a block diagram of the proposed algorithm for PV power generation.
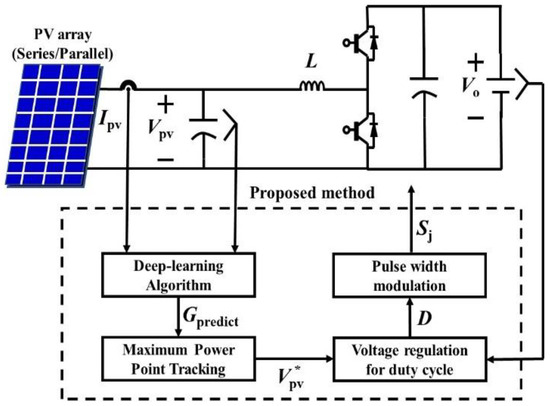
Figure 4.
Block diagram of the proposed control algorithm for solar power generation.
The proposed algorithm predicts illuminance by composing a deep-learning model based on the solar panel voltage and current. Long short-term memory (LSTM) was applied to the deep learning algorithm used in this study, and learning was performed on training datasets of PV voltage and current according to irradiation changes. Based on the predicted illuminance, the solar power generation’s reference voltage that follows the maximum output point can be calculated. Figure 5 shows the change in the maximum output point according to the change in irradiation. That is, the proposed method can calculate the solar power generation reference voltage and obtain the maximum output point from the amount of irradiation based on the predicted illuminance.
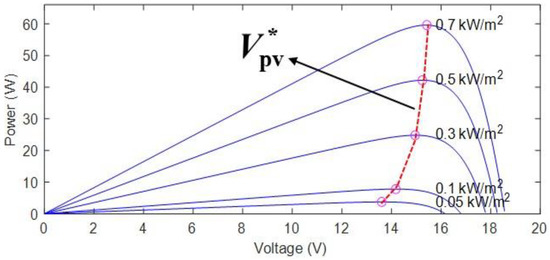
Figure 5.
Control strategy of the conventional P&O algorithm.
Based on the solar power generation reference and output voltages, the duty ratio (D) of the DC/DC converter can be calculated as follows.
The proposed method based on the calculated duty ratio has the advantage of being able to accurately follow the maximum output point even if the amount of irradiation changes and it is able to quickly follow the maximum output point. It can mitigate disadvantages of the widely used P&O method: steady-state voltage ripple and slow tracking speeds of the transients. Figure 6 shows a flowchart of the proposed algorithm.
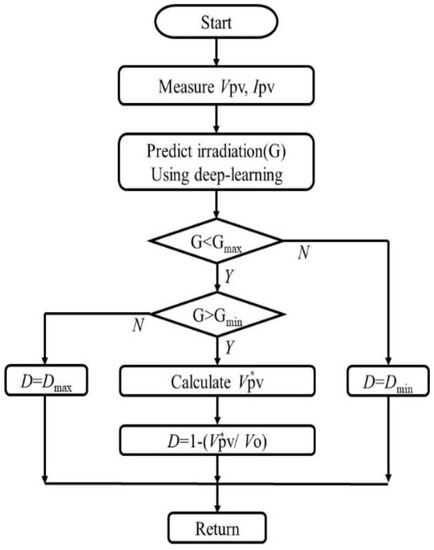
Figure 6.
Block diagram of the proposed control algorithm for solar power generation.
4. Deep Learning Algorithm Model Construction
Experimental data obtained using the DFSP-100M model of DOKIO were used as training data. Figure 7 shows images of the experimental setup, including the solar panel, load system, and instrumentation used in this study. Table 1 lists the specifications of the solar panels used in this study. The generated voltage and current of the solar power generation system were used. Based on this, a survey to follow the maximum output point was predicted. Because the output power generation voltage and current are directly affected by irradiation, the voltage and current of the solar power generation system were used when constructing the deep learning neural network.
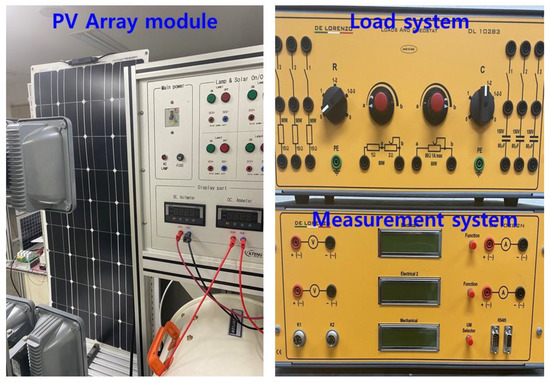
Figure 7.
Photograph of the experimental setup of the solar power system.

Table 1.
DOKIO DFSP-100M PV Module Characteristics.
Irradiation data were obtained by measuring the voltage and current of the PV system while changing the amount of irradiation (200, 400, 600, and 800 W/m2). The values of the measured data were interpolated using linear interpolation and extrapolation. For survey data that could not be obtained via experiments, additional data were derived using MATLAB/Simulink PV module blocks based on the specifications presented in Table 1. In addition, the derived data verified the validity of the data by directly comparing them with the experimental data. Figure 8 shows the data obtained during the experiment. The solid line in Figure 8 represents the simulation result, and the dot represents the experimental result.
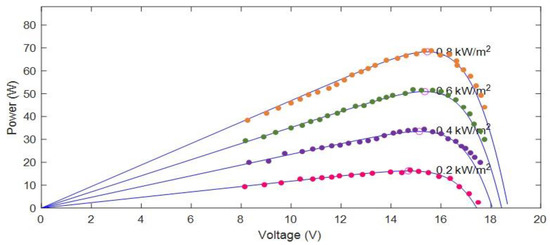
Figure 8.
Comparison of the experimental and simulated data for the deep learning model.
In the deep learning algorithms, we constructed a model that predicted the output based on training data. The root mean squared error was used in the model’s evaluation to update the model weights. The loss model used for model evaluation can be constructed as follows:
where Gmeasure is the actual value, Gpredict is the predicted value, and N is the sample size. A low root mean square error (RMSE) value indicated a well-trained model. The weight update period was optimized using the Adam function of the KERAS optimizer, which is an advanced gradient-descent method. Keras is an open-source neural network library written in Python.
Figure 9 shows the results of the correlation analysis between the data for the deep-learning model. The closer the number is to 1, the higher the correlation; the closer it is to 0, the lower the correlation. In addition, the closer the color is to white, the higher the correlation, and the closer the color is to black, the lower the correlation. The deep learning model uses the output voltage, current, and power of the PV system as input data and provides the input illuminance as the prediction result.
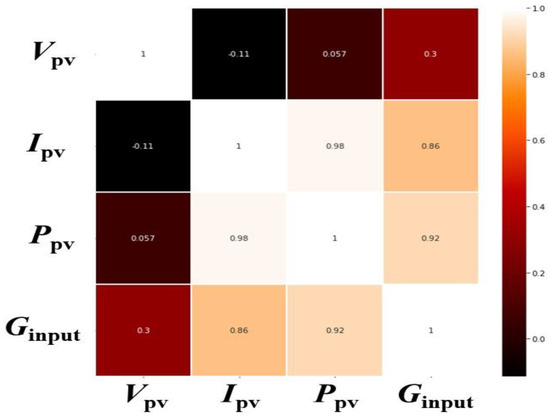
Figure 9.
Comparison of the experimental and simulated data for the deep learning model.
Figure 10 shows the actual and predicted illuminance values using the LSTM algorithm. The predicted value of illuminance via the deep learning model based on the input data according to the actual illuminance change shows results that are almost similar to the actual value. Because the proposed method controls the maximum output using the predicted illuminance, accurately tracking the actual value reaches the maximum output point and reduces the variability at steady state. The analysis of the output data according to the error change is performed in detail in the subsequent section.
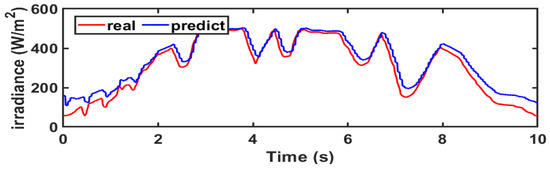
Figure 10.
Comparison of real and predicted data to check deep learning model performance.
5. Results and Discussion
To evaluate the efficiency of the proposed MPPT algorithm, a detailed model of the PV system shown in Figure 1 was implemented in Matlab/Simulink. To evaluate the performance of the proposed MPPT algorithm, PV systems were simulated under various solar irradiance profiles (e.g., ramps, sine waves, and daily irradiance profiles), assuming a fixed ambient temperature of 25 °C. In addition, a comparison with the existing P&O algorithm was conducted to highlight the advantages of the proposed MPPT strategy. The existing MPPT method uses voltage increments to reach the maximum output point. Since there are advantages and disadvantages depending on the size of the voltage increment, in this paper, the voltage increment that changes greatly and the voltage increment that has minimal changes are applied. The existing P&O algorithm applies a large-step P&O (LS-PO) algorithm with a large voltage increment and a short-step P&O (SS-PO) algorithm with a small voltage increment. Overall, the proposed deep-learning-based maximum power control algorithm shows improved MPPT efficiency and dynamic performance compared to existing algorithms. Additionally, the analysis of MPPT method can be analyzed by applying IET EN50530 to more accurately analyze the performance of the algorithm [36]. The parameters of DC-DC converter for simulation are shown in Table 2.
Table 2.
System Specifications.
The result of Figure 11a is congested with abrupt and gentle changes in the changing illuminance profile. The performance of the proposed method was evaluated under these conditions. The proposed method showed superior tracking performance than existing methods (LS-PO SS-PO). It showed the same results for output, efficiency, and voltage/current. Clearly, the algorithm proposed in Figure 11b,c provides steady-state oscillations of low power/current and small stabilization time compared to the conventional method. In addition, as shown in Figure 11d, the proposed method exhibits steady-state oscillations of low voltage, whereas the existing SS-PO strategy and LS-PO technology exhibit high steady-state oscillations. Therefore, the proposed algorithm exhibits a faster response and lower steady-state oscillation than the LS-PO and SS-PO. Regarding the performance improvement, the proposed method, as shown in Figure 11e, showed a high value with an average efficiency of 98.4% due to the low steady-state vibration. Meanwhile, the SS-PO algorithm shows an improved efficiency in the steady state but a significant decrease in efficiency in the transient state due to slow operations (86.1%). The LS-PO algorithm increased efficiencies under transient conditions due to its fast operation but decreased efficiencies under steady-state conditions (85.9%). In conclusion, the proposed algorithm shows improved tracking efficiency in transient and steady-state conditions, increased MPPT speed, and reduced steady-state oscillations.
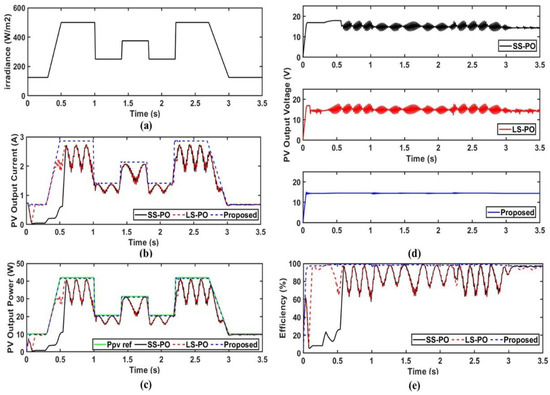
Figure 11.
PV results: (a) Ropp irradiance profile. (b) PV output current. (c) PV output power and (d) PV output voltage. (e) System-tracking efficiency.
Although the dynamic characteristics of Figure 12 are abrupt conditions, the proposed method showed excellent performance even under non-linear slope conditions. The proposed algorithm showed excellent performance even in the sine wave illuminance profile. As shown in Figure 12a, the sinusoidal irradiance profile starts at 300 W/m2, exhibits a sinusoidal change at t = 0.9 s, peaks at 400 W/m2 and decreases at 300 W/m2. The tracking performance of the proposed algorithm and the existing technique can be compared in terms of the output power and current/voltage, as shown in Figure 12b–d. Evidently, the proposed algorithm improved the overall performance compared to the existing P&O-MPPT technology. However, the proposed algorithm shows the highest efficiency in Figure 12e because of its high tracking performance and steady-state stability. Figure 13 compares the performance based on the profile for one day, and the proposed method shows excellent performance.
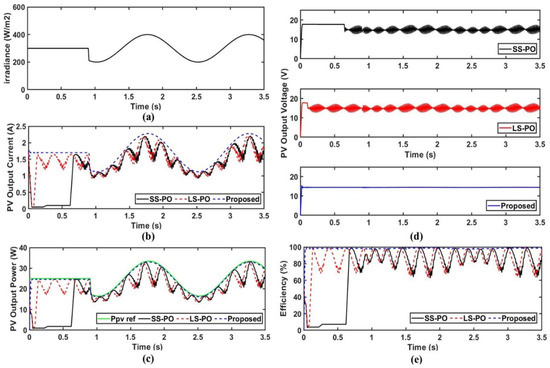
Figure 12.
PV results: (a) sinusoidal irradiance profile. (b) PV output current. (c) PV output power. (d) PV output voltage. (e) System-tracking efficiency.
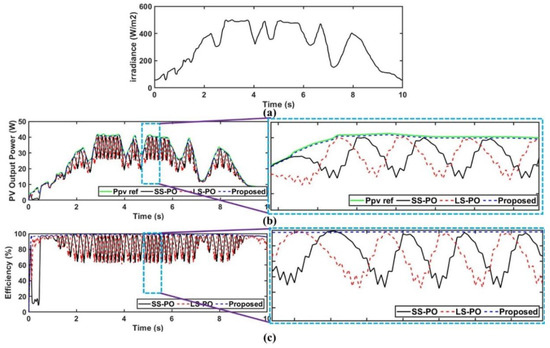
Figure 13.
PV results: (a) One-day irradiance profile, (b) PV output power and (c) system-tracking efficiency.
Figure 14 shows a histogram of the output voltage and the efficiency of the PV system. As shown in Figure 14a, the proposed method accurately tracks the PV voltage for following the MPP; therefore, it can be confirmed that the voltage fluctuation is low in the steady state. However, existing PO methods significantly fluctuate the PV voltage to follow the MPP. Accordingly, as shown in Figure 14b, the proposed method has high efficiencies even when the input illuminance changes. However, it can be confirmed that the existing method greatly changes efficiencies according to the illuminance change. Table 3 summarizes the results for the average and standard deviation of the output voltage and efficiency of the PV system according to the change in the insolation. The proposed method can confirm the result of the increase in average efficiency by up to 11.24% compared to the existing algorithm according to Table 3. This is because the proposed method reduces steady-state vibrations and obtains a fast response.
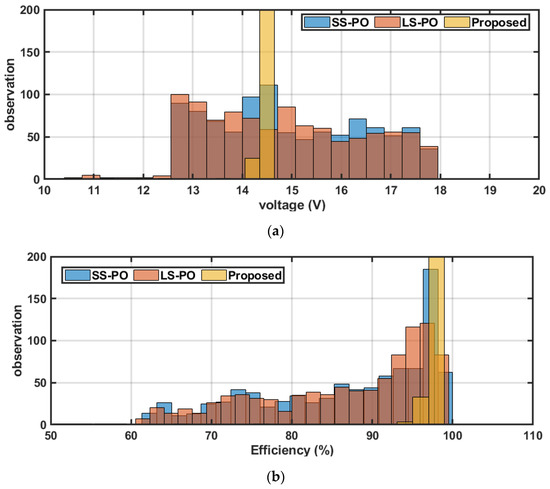
Figure 14.
Histogram of PV results: (a) PV output voltage and (b) system-tracking efficiency.
Table 3.
Comparison of Output Results Among Various P&O MPPT Algorithms.
Figure 15 shows the normalization of the average value and standard deviation of the PV system output power generation according to the change in the average error of the deep-learning model. Because the proposed algorithm performs the maximum power control based on the predicted illuminance, a power generation performance analysis was performed according to the accuracy of the deep learning model. The average error of the predicted model is calculated as follows.
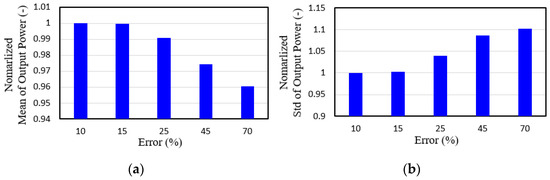
Figure 15.
Histogram of PV results: (a) PV output voltage and (b) system-tracking efficiency.
As the average error increases, the average power generation of the proposed algorithm to which the deep learning model is applied decreases. Even if an average error of approximately 70% occurs compared with the average error of 10% used in this study, the average power generation is reduced by approximately 4%. In addition, it was confirmed that the standard deviation value of the power generation increased as the error increased, and when an average error of approximately 70% occurred, the standard deviation value increased by approximately 10%.
6. Conclusions
The proposed algorithm could obtain a fast transient response and steady-state stability under irregular input irradiation conditions. The existing maximum output control algorithm has the advantage of being simple and easy to implement. However, its efficiency may be reduced due to the slow response and steady-state vibration. Therefore, the proposed algorithm can solve the fast transient response and steady-state vibration. This is because it predicts the current irradiation by applying a deep learning algorithm. Furthermore, the proposed algorithm directly calculates the duty ratio that can obtain the maximum output according to the irradiation value. The deep learning model was trained based on the experimental data of a 100 W class PV panel. In summary, the proposed algorithm showed superior results compared to the existing algorithm, even under various irradiation conditions. The method proposed in daily dose data-based conditions showed an average efficiency increase of up to 11.24% and a fast transient response of 0.11 s was obtained.
In a future study, we will analyze the effect of the irradiation prediction performance of a deep learning model and the amount of power generated by it when operating multiple PV panels.
Funding
This research was supported by Basic Science Research Program through the National Research Foundation of Korea (NRF) funded by the Ministry of Education (No. RS-2022-00165789).
Data Availability Statement
Not applicable.
Conflicts of Interest
The author declares no conflict of interest.
References
- Ali, A.I.; Sayed, M.A.; Mohamed, E.E. Modified efficient perturb and observe maximum power point tracking technique for grid-tied PV system. Int. J. Electr. Power Energy Syst. 2018, 99, 192–202. [Google Scholar] [CrossRef]
- Solangi, K.H.; Islam, M.R.; Saidur, R.; Rahim, N.A.; Fayaz, H. A review on global solar energy policy. Renew. Sustain. Energy Rev. 2011, 15, 2149–2163. [Google Scholar] [CrossRef]
- Sayed, M.A.; Mohamed, E.E.; Ali, A.I. Maximum power point tracking technique for grid tie PV system. In Proceedings of the 7th International Middle East Power Systems Conference (MEPCON’15), Mansoura, Egypt, 15–17 December 2015. [Google Scholar]
- Ali, A.I.M.; Sayed, M.A.; Takeshita, T.; Hassan, A.M.M.; Azmy, A.M. A single-phase modular multilevel inverter based on controlled DC-cells under two SPWM techniques for renewable energy applications. Int. Trans. Electr. Energy Syst. 2020, 31, e12599. [Google Scholar] [CrossRef]
- Hanzaei, S.H.; Gorji, S.A.; Ektesabi, M. A Scheme-Based Review of MPPT Techniques with Respect to Input Variables Including Solar Irradiance and PV Arrays’ Temperature. IEEE Access 2020, 8, 182229–182239. [Google Scholar] [CrossRef]
- Nofuentes, G.; Gueymard, C.; Aguilera, J.; Pérez-Godoy, M.; Charte, F. Is the average photon energy a unique characteristic of the spectral distribution of global irradiance? Sol. Energy 2017, 149, 32–43. [Google Scholar] [CrossRef]
- Gunasekaran, M.; Krishnasamy, V.; Selvam, S.; Almakhles, D.J.; Anglani, N. An Adaptive Resistance Perturbation Based MPPT Algorithm for Photovoltaic Applications. IEEE Access 2020, 8, 196890–196901. [Google Scholar] [CrossRef]
- Hirata, Y.; Aihara, K. Improving time series prediction of solar irradiance after sunrise: Comparison among three methods for time series prediction. Sol. Energy 2017, 149, 294–301. [Google Scholar] [CrossRef]
- Huynh, D.C.; Dunnigan, M.W. Development and Comparison of an Improved Incremental Conductance Algorithm for Tracking the MPP of a Solar PV Panel. IEEE Trans. Sustain. Energy 2016, 7, 1421–1429. [Google Scholar] [CrossRef]
- Ishaque, K.; Salam, Z. A review of maximum power point tracking techniques of PV system for uniform insolation and partial shading condition. Renew. Sustain. Energy Rev. 2013, 19, 475–488. [Google Scholar] [CrossRef]
- Eltawil, M.A.; Zhao, Z. MPPT techniques for photovoltaic applications. Renew. Sustain. Energy Rev. 2013, 25, 793–813. [Google Scholar] [CrossRef]
- Ali, A.I.; Sayed, M.A.; Mohamed, E.E. Maximum PowerPoint Tracking technique applied on partial shaded grid connected PV system. In Proceedings of the Eighteenth International Middle East Power Systems Conference (MEPCON), Cairo, Egypt, 27–29 December 2016; Volume 2016, pp. 656–663. [Google Scholar]
- Ali, A.I.M.; Sayed, M.A.; Takeshita, T. Isolated single-phase single-stage DC-AC cascaded transformer-based multilevel inverter for stand-alone and grid-tied applications. Int. J. Electr. Power Energy Syst. 2020, 125, 106534. [Google Scholar] [CrossRef]
- Ali, A.I.M.; Sayed, M.A.; Takeshita, T. Analysis and design of high-power single-stage three-phase differential-based flyback inverter for photovoltaic applications. In Proceedings of the 2020 22nd European Conference on Power Electronics and Applications (EPE’20 ECCE Europe), Lyon, France, 7–11 September 2020; Volume 2020, pp. 1–8. [Google Scholar]
- Ahmed, J.; Salam, Z. An improved perturb and observe (P&O) maximum power point tracking (MPPT) algorithm for higher efficiency. Appl. Energy 2015, 150, 97–108. [Google Scholar] [CrossRef]
- Tafticht, T.; Agbossou, K.; Doumbia, M.; Chériti, A. An improved maximum power point tracking method for photovoltaic systems. Renew. Energy 2008, 33, 1508–1516. [Google Scholar] [CrossRef]
- Elgendy, M.A.; Zahawi, B.; Atkinson, D.J. Assessment of the Incremental Conductance Maximum Power Point Tracking Algorithm. IEEE Trans. Sustain. Energy 2012, 4, 108–117. [Google Scholar] [CrossRef]
- Liu, Y.-H.; Huang, S.-C.; Huang, J.-W.; Liang, W.-C. A Particle Swarm Optimization-Based Maximum Power Point Tracking Algorithm for PV Systems Operating Under Partially Shaded Conditions. IEEE Trans. Energy Convers. 2012, 27, 1027–1035. [Google Scholar] [CrossRef]
- Kamran, M.; Mudassar, M.; Fazal, M.R.; Asghar, M.U.; Bilal, M.; Asghar, R. Implementation of improved Perturb & Observe MPPT technique with confined search space for standalone photovoltaic system. J. King Saud Univ. Eng. Sci. 2018, 32, 432–441. [Google Scholar] [CrossRef]
- Ghassami, A.A.; Sadeghzadeh, S.M.; Soleimani, A. A high performance maximum power point tracker for PV systems. Int. J. Electr. Power Energy Syst. 2013, 53, 237–243. [Google Scholar] [CrossRef]
- Belkaid, A.; Colak, I.; Isik, O. Photovoltaic maximum power point tracking under fast varying of solar radiation. Appl. Energy 2016, 179, 523–530. [Google Scholar] [CrossRef]
- Bayod-Rújula, Á.; Cebollero-Abián, J.-A. A novel MPPT method for PV systems with irradiance measurement. Sol. Energy 2014, 109, 95–104. [Google Scholar] [CrossRef]
- Fathabadi, H. Novel fast dynamic MPPT (maximum power point tracking) technique with the capability of very high accurate power tracking. Energy 2016, 94, 466–475. [Google Scholar] [CrossRef]
- Rizzo, S.A.; Scelba, G. ANN based MPPT method for rapidly variable shading conditions. Appl. Energy 2015, 145, 124–132. [Google Scholar] [CrossRef]
- Sutton, R.S.; Barto, A.G. Reinforcement Learning: An Introduction, 2nd ed.; MIT Press: Cambridge, MA, USA, 2018. [Google Scholar]
- Glavic, M. (Deep) Reinforcement learning for electric power system control and related problems: A short review and perspectives. Annu. Rev. Control 2019, 48, 22–35. [Google Scholar] [CrossRef]
- Kofinas, P.; Doltsinis, S.; Dounis, A.; Vouros, G. A reinforcement learning approach for MPPT control method of photovoltaic sources. Renew. Energy 2017, 108, 461–473. [Google Scholar] [CrossRef]
- Hsu, R.C.; Liu, C.-T.; Chen, W.-Y.; Hsieh, H.-I.; Wang, H.-L. A Reinforcement Learning-Based Maximum Power Point Tracking Method for Photovoltaic Array. Int. J. Photoenergy 2015, 2015, 1–12. [Google Scholar] [CrossRef]
- Youssef, A.; Telbany, M.E.; Zekry, A. Reinforcement Learning for Online Maximum Power Point Tracking Control. J. Clean Energy Technol. 2015, 4, 245–248. [Google Scholar] [CrossRef]
- Zhang, X.; Li, S.; He, T.; Yang, B.; Yu, T.; Li, H.; Jiang, L.; Sun, L. Memetic reinforcement learning based maximum power point tracking design for PV systems under partial shading condition. Energy 2019, 174, 1079–1090. [Google Scholar] [CrossRef]
- Ding, M.; Lv, D.; Yang, C.; Li, S.; Fang, Q.; Yang, B.; Zhang, X. Global Maximum Power Point Tracking of PV Systems under Partial Shading Condition: A Transfer Reinforcement Learning Approach. Appl. Sci. 2019, 9, 2769. [Google Scholar] [CrossRef]
- Blinov, A.; Korkh, O.; Chub, A.; Vinnikov, D.; Peftitsis, D.; Norrga, S.; Galkin, I. High Gain DC–AC High-Frequency Link Inverter with Improved Quasi-Resonant Modulation. IEEE Trans. Ind. Electron. 2021, 69, 1465–1476. [Google Scholar] [CrossRef]
- Ali, A.I.M.; Mohamed, H.R.A. Improved P&O MPPT algorithm with efficient open-circuit voltage estimation for two-stage grid-integrated PV system under realistic solar radiation. Int. J. Electr. Power Energy Syst. 2022, 137, 107805. [Google Scholar] [CrossRef]
- Tey, K.S.; Mekhilef, S. Modified incremental conductance MPPT algorithm to mitigate inaccurate responses under fast-changing solar irradiation level. Sol. Energy 2014, 101, 333–342. [Google Scholar] [CrossRef]
- Houssamo, I.; Locment, F.; Sechilariu, M. Maximum power tracking for photovoltaic power system: Development and experimental comparison of two algorithms. Renew. Energy 2010, 35, 2381–2387. [Google Scholar] [CrossRef]
- Bründlinger, R.; Henze, N.; Häberlin, H.; Burger, B.; Bergmann, A.; Baumgartner, F. prEN 50530—The new European standard for performance characterisation of PV inverters. In Proceedings of the 24th European Photovoltaic Solar Energy Conference, Hamburg, Germany, 21–25 September 2009; WIP Wirtschaft und Infrastruktur GmbH: Hamburg, Germany, 2009; pp. 3105–3109. [Google Scholar]
Publisher’s Note: MDPI stays neutral with regard to jurisdictional claims in published maps and institutional affiliations. |
© 2022 by the author. Licensee MDPI, Basel, Switzerland. This article is an open access article distributed under the terms and conditions of the Creative Commons Attribution (CC BY) license (https://creativecommons.org/licenses/by/4.0/).