


Stochastic Allocation of Photovoltaic Energy Resources in Distribution Systems Considering Uncertainties Using New Improved Meta-Heuristic Algorithm

 ,
,  ,
,  ,
,  , and
, and
Abstract
1. Introduction
1.1. Literature Review
1.2. Research Gap
1.3. Contributions
- Stochastic allocation of photovoltaic resource in the distribution system
- Multi-objective optimization considering losses, voltage profile, and voltage stability
- Using an improved human learning optimization algorithm
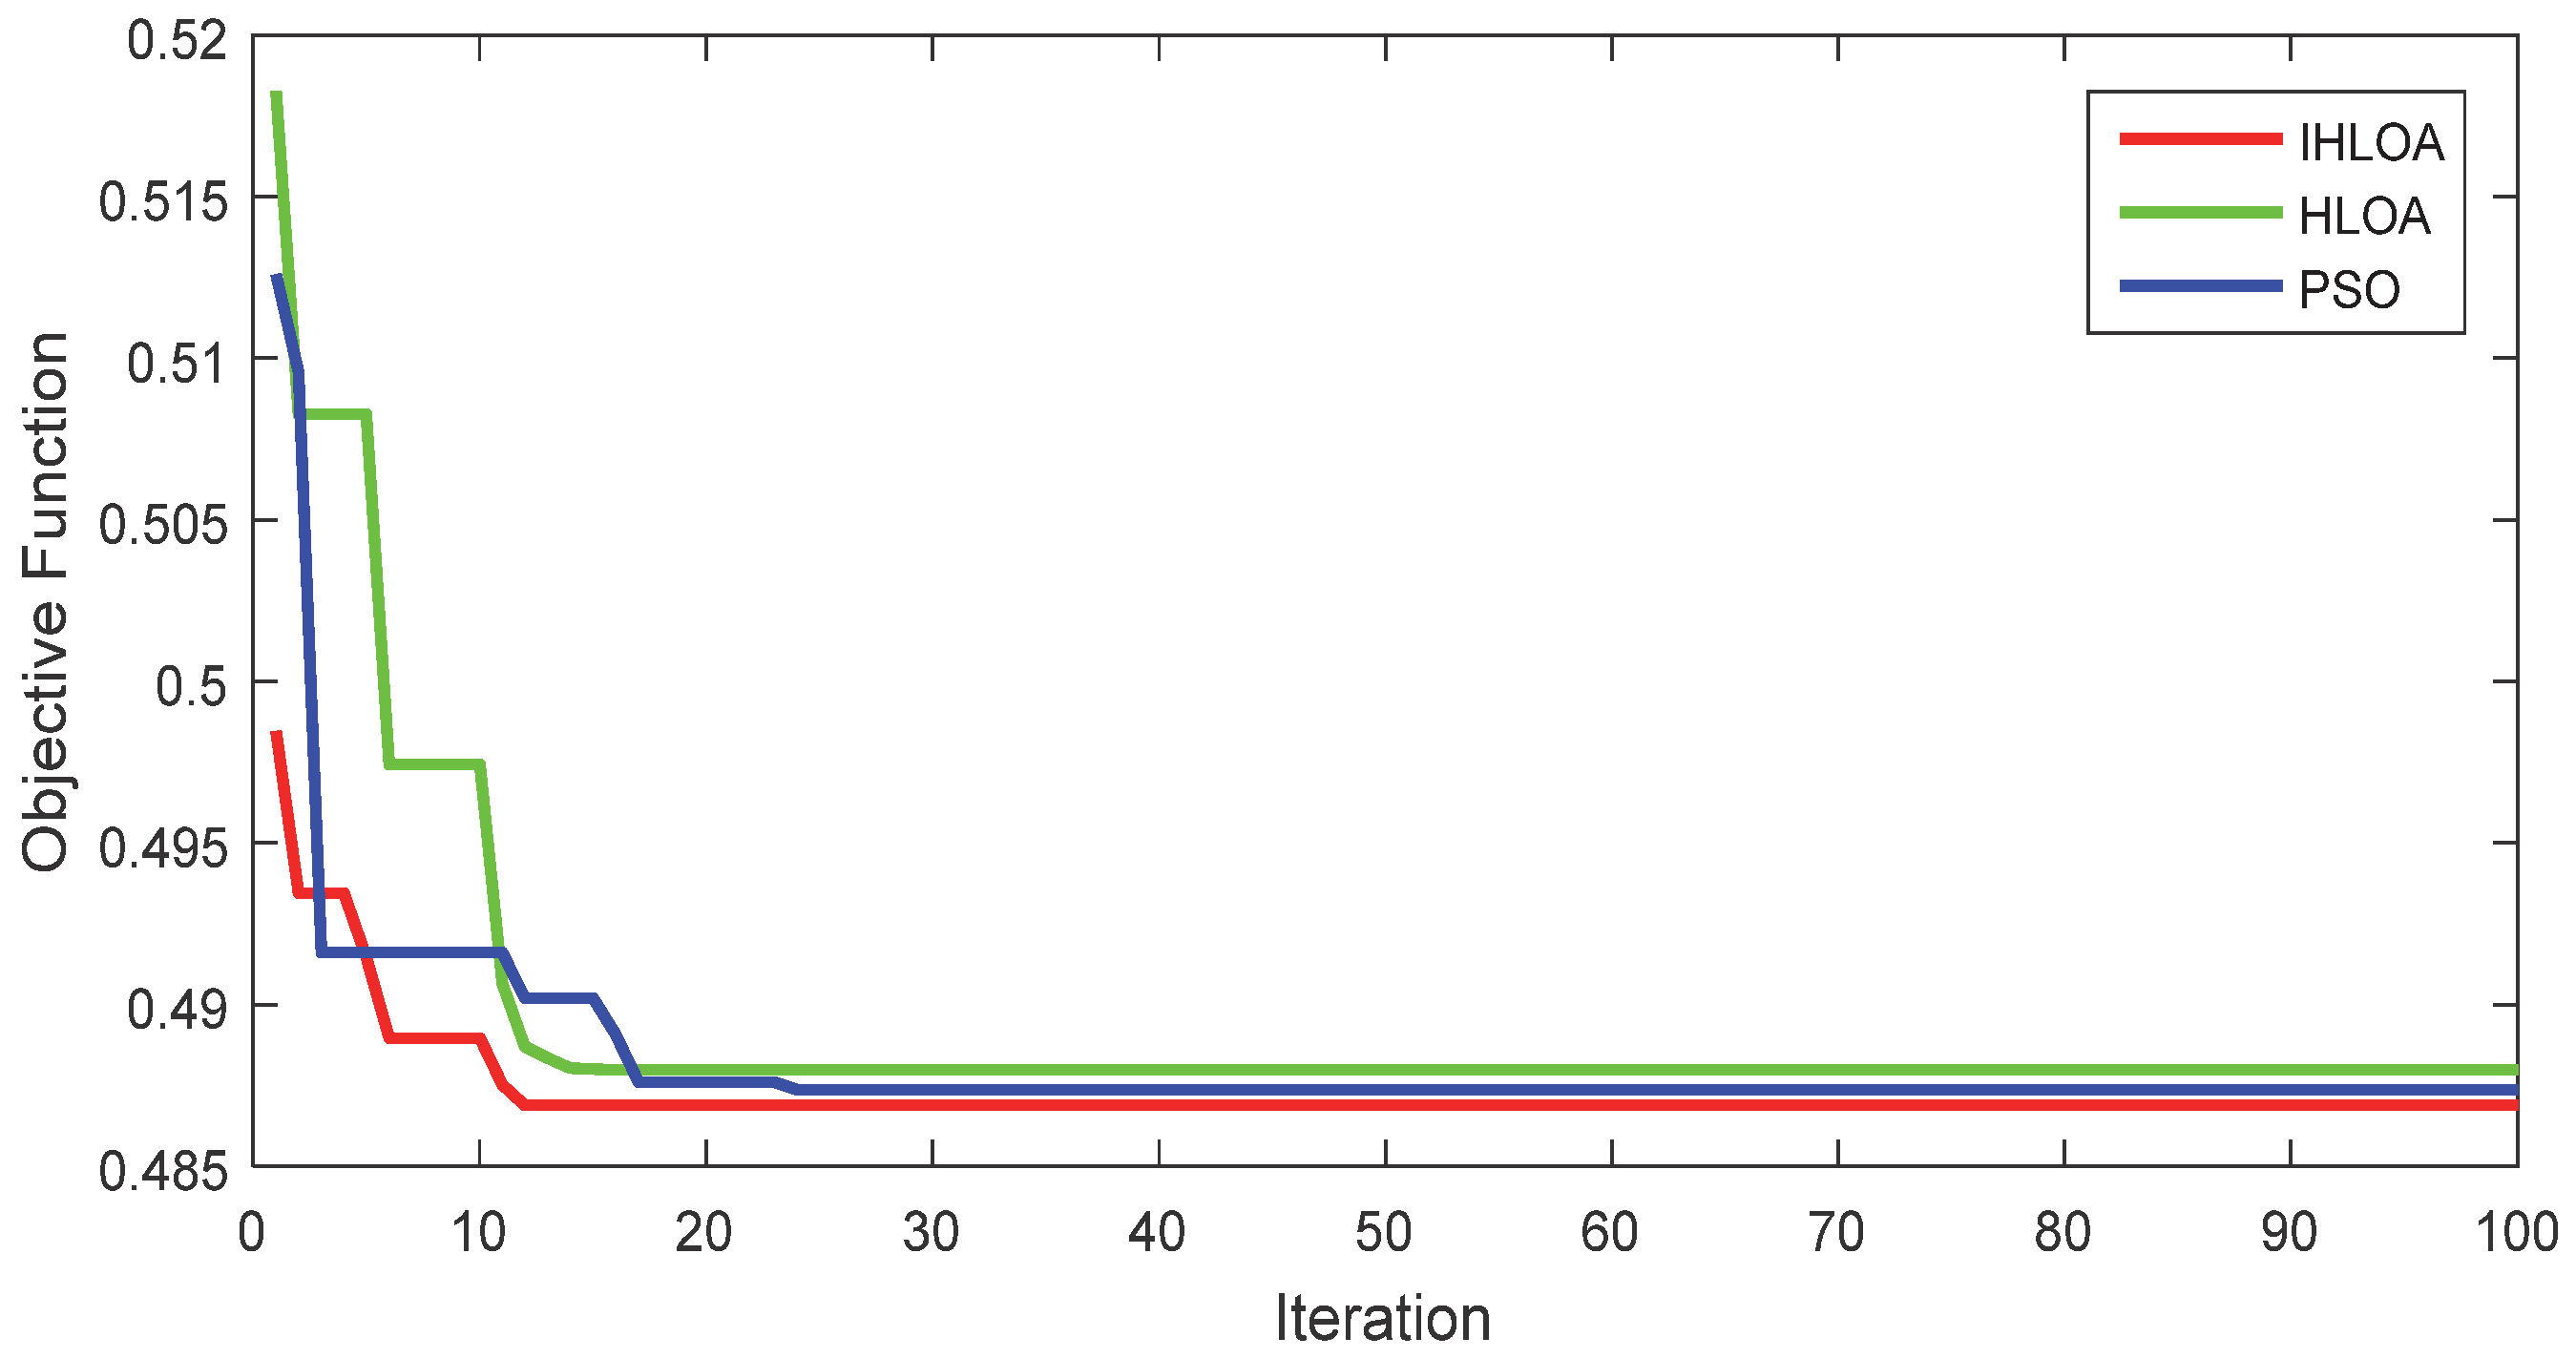
- The superior performance of the IHLOA in comparison with HLOA and PSO
- Increasing losses and weakening the voltage profile and stability with uncertainty
1.4. Paper Structure
2. Problem Formulation
2.1. Objective Function
2.2. Constraints
- Equality constraints
- Inequality constraints
2.3. Weighted Coefficient Method
2.4. Uncertainty Models of PV Power and Load
3. Overview of Proposed Algorithm
3.1. Overview of HLOA
3.1.1. Initialization
3.1.2. Learning Operators
3.1.3. IKD and SKD Update
3.1.4. Implementation of HLOA
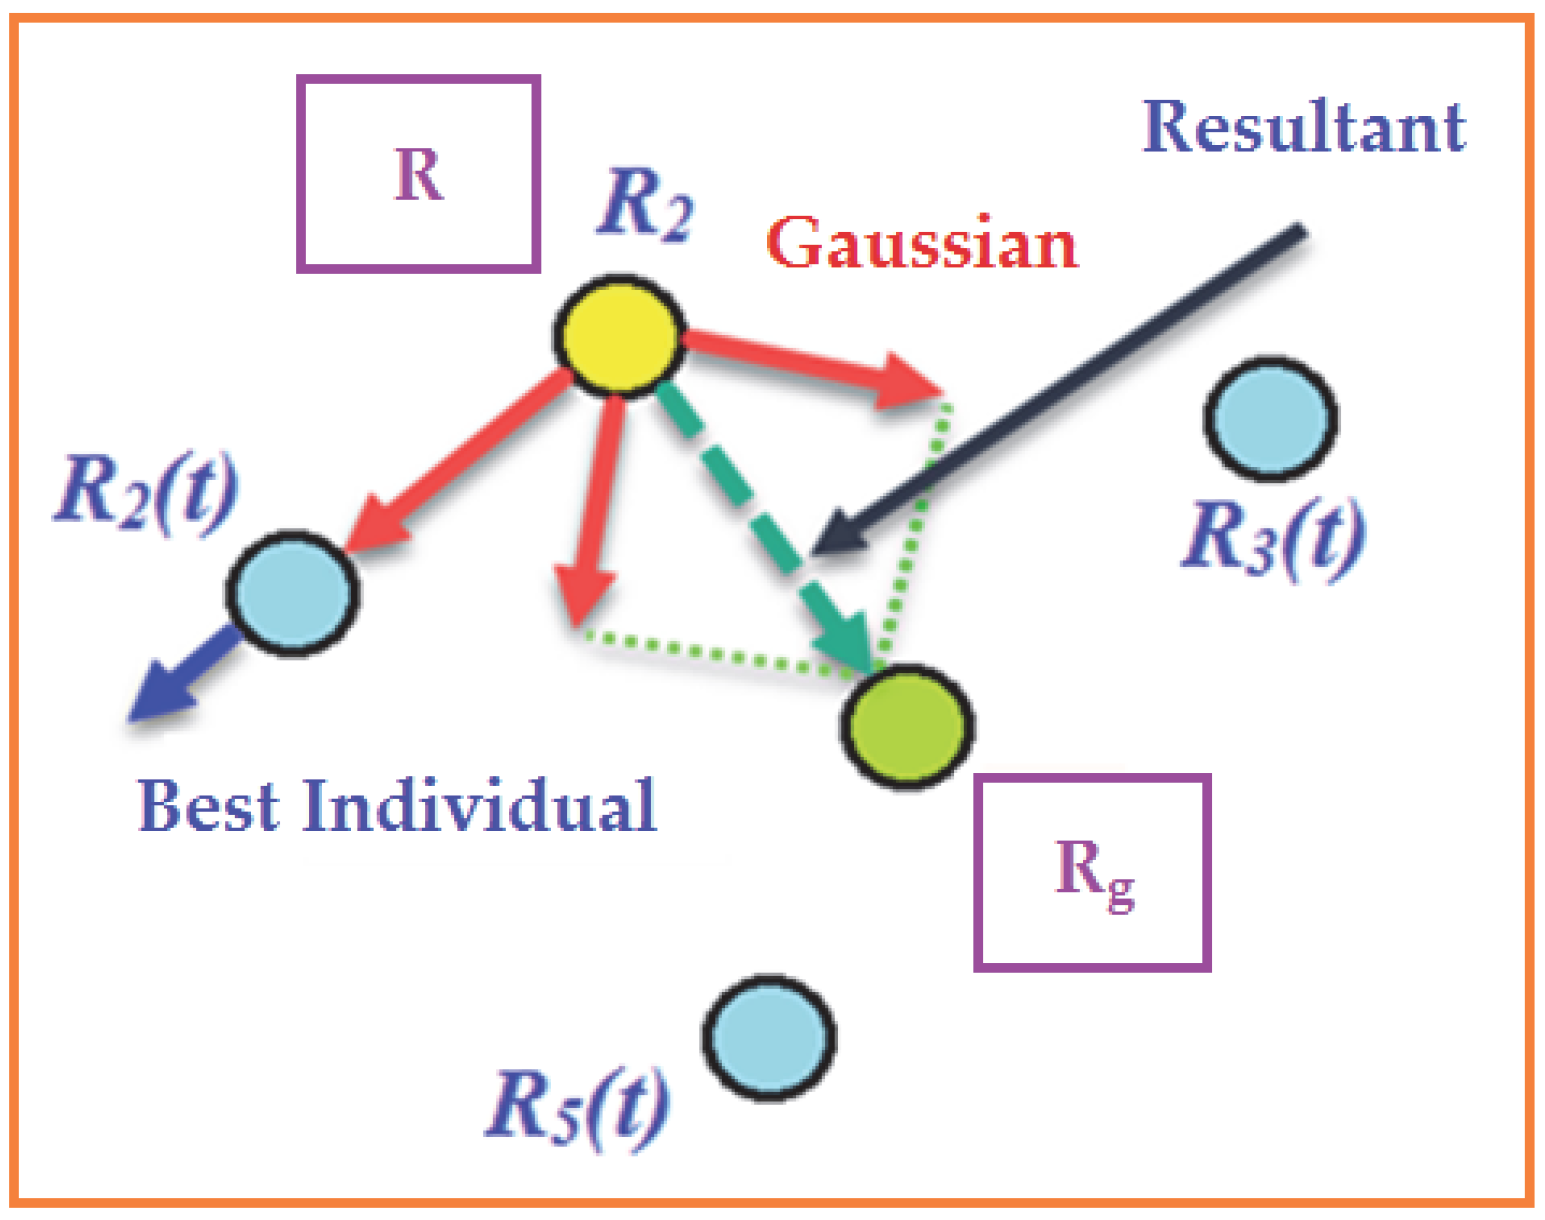
3.2. Overview of IHLOA
4. Problem Solving Considering Uncertainties
- Data initialization
- Problem Solution using the MCS
- Deterministic solution
5. Results and Discussion
5.1. Results of Base Networks
5.2. Results of Deterministic Allocation of PVs
5.3. Results of Stochastic Allocation of PVs
5.3.1. Results of Base Networks
5.3.2. Results of PVs Placement and Sizing
5.4. Comparison of the Deterministic and Stochastic Results
6. Conclusions
Author Contributions
Funding
Data Availability Statement
Acknowledgments
Conflicts of Interest
Nomenclature
| Voltage of bus i | |
| Voltage of bus j | |
| Minimum voltage of buses | |
| Maximum voltage of buses | |
| Passing current through line k | |
| Best solution for the ith person | |
| Number of components contained in the knowledge | |
| m | Mean value |
| Current passing through the network lines | |
| Allowable current passing through the network lines | |
| N | Number of buses |
| Number of network lines | |
| number of populations | |
| Nsamp | Sample number of Monte Carlo simulation |
| Active load demand | |
| Maximum active power of DG | |
| Total active power losses | |
| Active power losses magnitude at line k | |
| Active power of bus m + 1 | |
| Active power of post | |
| PV power | |
| Random exploratory learning probability | |
| Rated PV power | |
| Reactive load demand | |
| DG reactive power payments | |
| Minimum reactive power of DG | |
| Maximum reactive power of DG | |
| Total reactive power losses of the network lines | |
| Reactive power losses magnitude at line k | |
| Active power of bus m + 1 | |
| Reactive power of post | |
| Position resulting from the mutation process | |
| Resistance of line k | |
| , | Lower and upper values of the variables |
| rand | A number in the range [0, 1) |
| Total apparent power losses | |
| Apparent losses with PVs | |
| Apparent losses without PVs | |
| skdq | Social knowledge of qth in SKD |
| st | Standard deviation |
| Total voltage deviations | |
| Voltage deviations with PVs | |
| Voltage deviations without PVs | |
| Voltage stability index | |
| VSI with PVs | |
| Weighted coefficients of three objectives | |
| ith person | |
| Reactance of line k | |
| Total reactive power losses of the network lines | |
| Irradiance | |
| Reference irradiance | |
| PV MPPT efficiency | |
| Stochastic PDF of beta | |
| Beta PDF parameters | |
| Mean value in PDF of beta | |
| Deviation value in PDF of beta |
References
- Nguyen, T.T.; Nguyen, T.T.; Duong, L.T.; Truong, V.A. An effective method to solve the problem of electric distribution network reconfiguration considering distributed generations for energy loss reduction. Neural Comput. Appl. 2021, 33, 1625–1641. [Google Scholar] [CrossRef]
- Naderipour, A.; Abdullah, A.; Marzbali, M.H.; Nowdeh, S.A. An improved corona-virus herd immunity optimizer algorithm for network reconfiguration based on fuzzy multi-criteria approach. Expert Syst. Appl. 2022, 187, 115914. [Google Scholar] [CrossRef] [PubMed]
- Naderipour, A.; Abdul-Malek, Z.; Arabi Nowdeh, S.; Gandoman, F.H.; Hadidian Moghaddam, M.J. A multi-objective optimization problem for optimal site selection of wind turbines for reduce losses and improve voltage profile of distribution grids. Energies 2019, 12, 2621. [Google Scholar] [CrossRef]
- Moghaddam, M.J.H.; Kalam, A.; Shi, J.; Nowdeh, S.A.; Gandoman, F.H.; Ahmadi, A. A new model for reconfiguration and distributed generation allocation in distribution network considering power quality indices and network losses. IEEE Syst. J. 2020, 14, 3530–3538. [Google Scholar] [CrossRef]
- Fan, V.H.; Dong, Z.; Meng, K. Integrated distribution expansion planning considering stochastic renewable energy resources and electric vehicles. Appl. Energy 2020, 278, 115720. [Google Scholar] [CrossRef]
- Zhang, X.; Tan, T.; Zhou, B.; Yu, T.; Yang, B.; Huang, X. Adaptive distributed auction-based algorithm for optimal mileage based AGC dispatch with high participation of renewable energy. Int. J. Electr. Power Energy Syst. 2021, 124, 106371. [Google Scholar] [CrossRef]
- Hadidian-Moghaddam, M.J.; Arabi-Nowdeh, S.; Bigdeli, M.; Azizian, D. A multi-objective optimal sizing and siting of distributed generation using ant lion optimization technique. Ain Shams Eng. J. 2018, 9, 2101–2109. [Google Scholar] [CrossRef]
- Joshi, K.A.; Pindoriya, N.M. Case-specificity and its implications in distribution network analysis with increasing penetration of photovoltaic generation. CSEE J. Power Energy Syst. 2017, 3, 101–113. [Google Scholar] [CrossRef]
- Ibrahim, A.M.; Swief, R.A. Comparison of modern heuristic algorithms for loss reduction in power distribution network equipped with renewable energy resources. Ain Shams Eng. J. 2018, 9, 3347–3358. [Google Scholar] [CrossRef]
- Rastgou, A.; Moshtagh, J.; Bahramara, S. Improved harmony search algorithm for electrical distribution network expansion planning in the presence of distributed generators. Energy 2018, 151, 178–202. [Google Scholar] [CrossRef]
- Montoya, O.D.; Gil-González, W.; Grisales-Noreña, L.F. An exact MINLP model for optimal location and sizing of DGs in distribution networks: A general algebraic modeling system approach. Ain Shams Eng. J. 2020, 11, 409–418. [Google Scholar] [CrossRef]
- Arasteh, A.; Alemi, P.; Beiraghi, M. Optimal allocation of photovoltaic/wind energy system in distribution network using meta-heuristic algorithm. Appl. Soft Comput. 2021, 109, 107594. [Google Scholar] [CrossRef]
- Janamala, V.; Radha Rani, K. Optimal allocation of solar photovoltaic distributed generation in electrical distribution networks using Archimedes optimization algorithm. Clean Energy 2022, 6, 271–287. [Google Scholar] [CrossRef]
- Adeagbo, A.P.; Ariyo, F.K.; Makinde, K.A.; Salimon, S.A.; Adewuyi, O.B.; Akinde, O.K. Integration of Solar Photovoltaic Distributed Generators in Distribution Networks Based on Site’s Condition. Solar 2022, 2, 52–63. [Google Scholar] [CrossRef]
- Malik, M.Z.; Kumar, M.; Soomro, A.M.; Baloch, M.H.; Farhan, M.; Gul, M.; Kaloi, G.S. Strategic planning of renewable distributed generation in radial distribution system using advanced MOPSO method. Energy Rep. 2020, 6, 2872–2886. [Google Scholar] [CrossRef]
- Montoya, O.D.; Grisales-Noreña, L.F.; Ramos-Paja, C.A. Optimal Allocation and Sizing of PV Generation Units in Distribution Networks via the Generalized Normal Distribution Optimization Approach. Computers 2022, 11, 53. [Google Scholar] [CrossRef]
- Farh, H.M.; Al-Shaalan, A.M.; Eltamaly, A.M.; Al-Shamma’a, A.A. A novel severity performance index for optimal allocation and sizing of photovoltaic distributed generations. Energy Rep. 2020, 6, 2180–2190. [Google Scholar] [CrossRef]
- Ali, E.S.; Elazim, S.A.; Abdelaziz, A.Y. Ant Lion Optimization Algorithm for optimal location and sizing of renewable distributed generations. Renew. Energy 2017, 101, 1311–1324. [Google Scholar] [CrossRef]
- Safaei, A.; Vahidi, B.; Askarian-Abyaneh, H.; Azad-Farsani, E.; Ahadi, S.M. A two step optimization algorithm for wind turbine generator placement considering maximum allowable capacity. Renew. Energy 2016, 92, 75–82. [Google Scholar] [CrossRef]
- Shaheen, A.M.; Elsayed, A.M.; El-Sehiemy, R.A.; Abdelaziz, A.Y. Equilibrium optimization algorithm for network reconfiguration and distributed generation allocation in power systems. Appl. Soft Comput. 2021, 98, 106867. [Google Scholar] [CrossRef]
- Karimi Madahi, S.S.; Sarić, A.T. Multi-Criteria optimal sizing and allocation of renewable and non-renewable distributed generation resources at 63 kv/20 kv substations. Energies 2020, 13, 5364. [Google Scholar] [CrossRef]
- Younesi, A.; Shayeghi, H.; Safari, A.; Siano, P. Assessing the resilience of multi microgrid based widespread power systems against natural disasters using Monte Carlo Simulation. Energy 2020, 207, 118220. [Google Scholar] [CrossRef]
- Chakravorty, M.; Das, D. Voltage stability analysis of radial distribution networks. Int. J. Electr. Power Energy Syst. 2001, 23, 129–135. [Google Scholar] [CrossRef]
- Wang, L.; Yang, R.; Ni, H.; Ye, W.; Fei, M.; Pardalos, P.M. A human learning optimization algorithm and its application to multi-dimensional knapsack problems. Appl. Soft Comput. 2015, 34, 736–743. [Google Scholar] [CrossRef]
- Ding, H.; Gu, X. Hybrid of human learning optimization algorithm and particle swarm optimization algorithm with scheduling strategies for the flexible job-shop scheduling problem. Neurocomputing 2020, 414, 313–332. [Google Scholar] [CrossRef]
- Zhang, X.; Xu, Y.; Yu, C.; Heidari, A.A.; Li, S.; Chen, H.; Li, C. Gaussian mutational chaotic fruit fly-built optimization and feature selection. Expert Syst. Appl. 2020, 141, 112976. [Google Scholar] [CrossRef]
- Nowdeh, S.A.; Davoudkhani, I.F.; Moghaddam, M.H.; Najmi, E.S.; Abdelaziz, A.Y.; Ahmadi, A.; Gandoman, F.H. Fuzzy multi-objective placement of renewable energy sources in distribution system with objective of loss reduction and reliability improvement using a novel hybrid method. Appl. Soft Comput. 2019, 77, 761–779. [Google Scholar] [CrossRef]
- Jafar-Nowdeh, A.; Babanezhad, M.; Arabi-Nowdeh, S.; Naderipour, A.; Kamyab, H.; Abdul-Malek, Z.; Ramachandaramurthy, V.K. Meta-heuristic matrix moth–flame algorithm for optimal reconfiguration of distribution networks and placement of solar and wind renewable sources considering reliability. Environ. Technol. Innov. 2020, 20, 101118. [Google Scholar] [CrossRef]
- Babanezhad, M.; Nowdeh, S.A.; Abdelaziz, A.Y.; AboRas, K.M.; Kotb, H. Reactive power based capacitors allocation in distribution network using mathematical remora optimization algorithm considering operation cost and loading conditions. Alex. Eng. J. 2022, 61, 10511–10526. [Google Scholar] [CrossRef]
- Naderipour, A.; Ramtin, A.R.; Abdullah, A.; Marzbali, M.H.; Nowdeh, S.A.; Kamyab, H. Hybrid energy system optimization with battery storage for remote area application considering loss of energy probability and economic analysis. Energy 2022, 239, 122303. [Google Scholar] [CrossRef]
- Rajabi-Ghahnavieh, A.; Nowdeh, S.A. Optimal PV–FC hybrid system operation considering reliability. Int. J. Electr. Power Energy Syst. 2014, 60, 325–333. [Google Scholar] [CrossRef]
- Hadidian-Moghaddam, M.J.; Arabi-Nowdeh, S.; Bigdeli, M. Optimal sizing of a stand-alone hybrid photovoltaic/wind system using new grey wolf optimizer considering reliability. J. Renew. Sustain. Energy 2016, 8, 035903. [Google Scholar] [CrossRef]
- Luo, Y.; Wang, X.; Yan, S. Risk assessment of photovoltaic distribution network based on adaptive kernel density estimation and cumulant method. Energy Rep. 2022, 8, 1152–1159. [Google Scholar] [CrossRef]
- Song, S.; Wang, P.; Heidari, A.A.; Wang, M.; Zhao, X.; Chen, H.; Xu, S. Dimension decided Harris hawks optimization with Gaussian mutation: Balance analysis and diversity patterns. Knowl.-Based Syst. 2020, 215, 106425. [Google Scholar] [CrossRef]
- Baran, M.E.; Wu, F.F. Network reconfiguration in distribution systems for loss reduction and load balancing. IEEE Trans. Power Deliv. 1989, 4, 1401–1407. [Google Scholar] [CrossRef]
- Baran, M.E.; Wu, F.F. Optimal capacitor placement on radial distribution systems. IEEE Trans. Power Deliv. 1989, 4, 725–734. [Google Scholar] [CrossRef]
- Venkatesan, C.; Kannadasan, R.; Alsharif, M.H.; Kim, M.K.; Nebhen, J. A novel multiobjective hybrid technique for siting and sizing of distributed generation and capacitor banks in radial distribution systems. Sustainability 2021, 13, 3308. [Google Scholar] [CrossRef]
- Abdelaziz, A.Y.; Ali, E.S.; Elazim, S.A. Flower pollination algorithm and loss sensitivity factors for optimal sizing and placement of capacitors in radial distribution systems. Int. J. Electr. Power Energy Syst. 2016, 78, 207–214. [Google Scholar] [CrossRef]
- Sultana, S.; Roy, P.K. Oppositional krill herd algorithm for optimal location of capacitor with reconfiguration in radial distribution system. Int. J. Electr. Power Energy Syst. 2016, 74, 78–90. [Google Scholar] [CrossRef]
- Hassan, A.A.; Fahmy, F.H.; Nafeh, A.E.S.A.; Abu-elmagd, M.A. Genetic single objective optimisation for sizing and allocation of renewable DG systems. Int. J. Sustain. Energy 2017, 36, 545–562. [Google Scholar] [CrossRef]
- Manafi, H.; Ghadimi, N.; Ojaroudi, M.; Farhadi, P. Optimal placement of distributed generations in radial distribution systems using various PSO and DE algorithms. Elektron. Ir Elektrotech. 2013, 19, 53–57. [Google Scholar] [CrossRef]
- Tan, W.S.; Hassan, M.Y.; Majid, M.S.; Rahman, H.A. Allocation and sizing of DG using cuckoo search algorithm. In Proceedings of the 2012 IEEE International Conference Power and Energy (PECon), Kota Kinabalu, Malaysia, 2–5 December 2012; IEEE: Piscataway, NJ, USA, 2012; pp. 133–138. [Google Scholar]
- García, J.A.M.; Mena, A.J.G. Optimal distributed generation location and size using a modified teaching–learning based optimization algorithm. Int. J. Electr. Power Energy Syst. 2013, 50, 65–75. [Google Scholar] [CrossRef]


| IHLOA | 0.4869 | 0.4872 | 0.4878 | 0.08546 |
| HLOA | 0.4882 | 0.4892 | 0.4897 | 0.01137 |
| PSO | 0.4874 | 0.4880 | 0.4886 | 0.01038 |
| IHLOA | 0.4379 | 0.4385 | 0.4389 | 0.09594 |
| HLOA | 0.4407 | 0.4414 | 0.4421 | 0.01419 |
| PSO | 0.4396 | 0.4405 | 0.4409 | 0.01302 |
| System/Item | Size and Location | Losses (kW) | Minimum Voltage (pu) | VSI (pu) | Annual Cost of Losses (USD) | Saving (USD/Year) |
|---|---|---|---|---|---|---|
| 33 Bus | ||||||
| IHLOA | 846.6 (13), 1160 (30) | 82.34 | 0.9789 | 29.479 | 43,277.90 | 67,613.19 |
| HLOA | 822.8 (13), 1143 (29) | 82.81 | 0.978 | 29.368 | 43,524.93 | 67,366.15 |
| PSO | 843.5 (13), 1157 (30) | 82.55 | 0.9785 | 29.457 | 43,388.28 | 67,502.80 |
| ALO [18] | 850 (13), 1191.1 (30) | 82.6 | 0.9732 | 29.479 | 43,414.56 | 67,476.54 |
| GA [40] | 837.5 (13), 1212.2 (29) | 82.7 | 0. 96846 | -- | -- | -- |
| DAPSO [41] | 1227 (13), 738 (32) | 95.93 | 0.9651 | -- | -- | -- |
| BSOA [41] | 880 (13), 924 (31) | 89.34 | 0.9665 | -- | -- | -- |
| 69 Bus | ||||||
| IHLOA | 733 (14), 2001 (61) | 70.16 | 0.9876 | 65.865 | 36,876.09 | 81,352.36 |
| HLOA | 673 (14), 1975 (62) | 70.44 | 0.9872 | 65.8312 | 37,023.26 | 81,220.96 |
| PSO | 731 (14), 1996 (61) | 70.29 | 0.9874 | 65.8537 | 36,944.42 | 81,299.81 |
| ALO [18] | 538.77 (17), 1700 (61) | 70.75 | 0.9801 | 65.8042 | 37,186.20 | 81,042.26 |
| GA [40] | 1777 (61), 555 (11) | 71.79 | -- | -- | -- | -- |
| SGA [42] | 1000 (17), 2400 (61) | 82.9 | -- | -- | -- | -- |
| PSO [42] | 700 (14), 2100 (62) | 78.8 | 0.9732 | 29.479 | -- | -- |
| MTLBO [43] | 519.7 (17), 1732(61) | 71.77 | 0.9732 | 29.479 | -- | -- |
| System/Item | Power Loss | Minimum Voltage | Voltage Stability Index |
|---|---|---|---|
| Deterministic | 82.34 | 0.9789 | 29.479 |
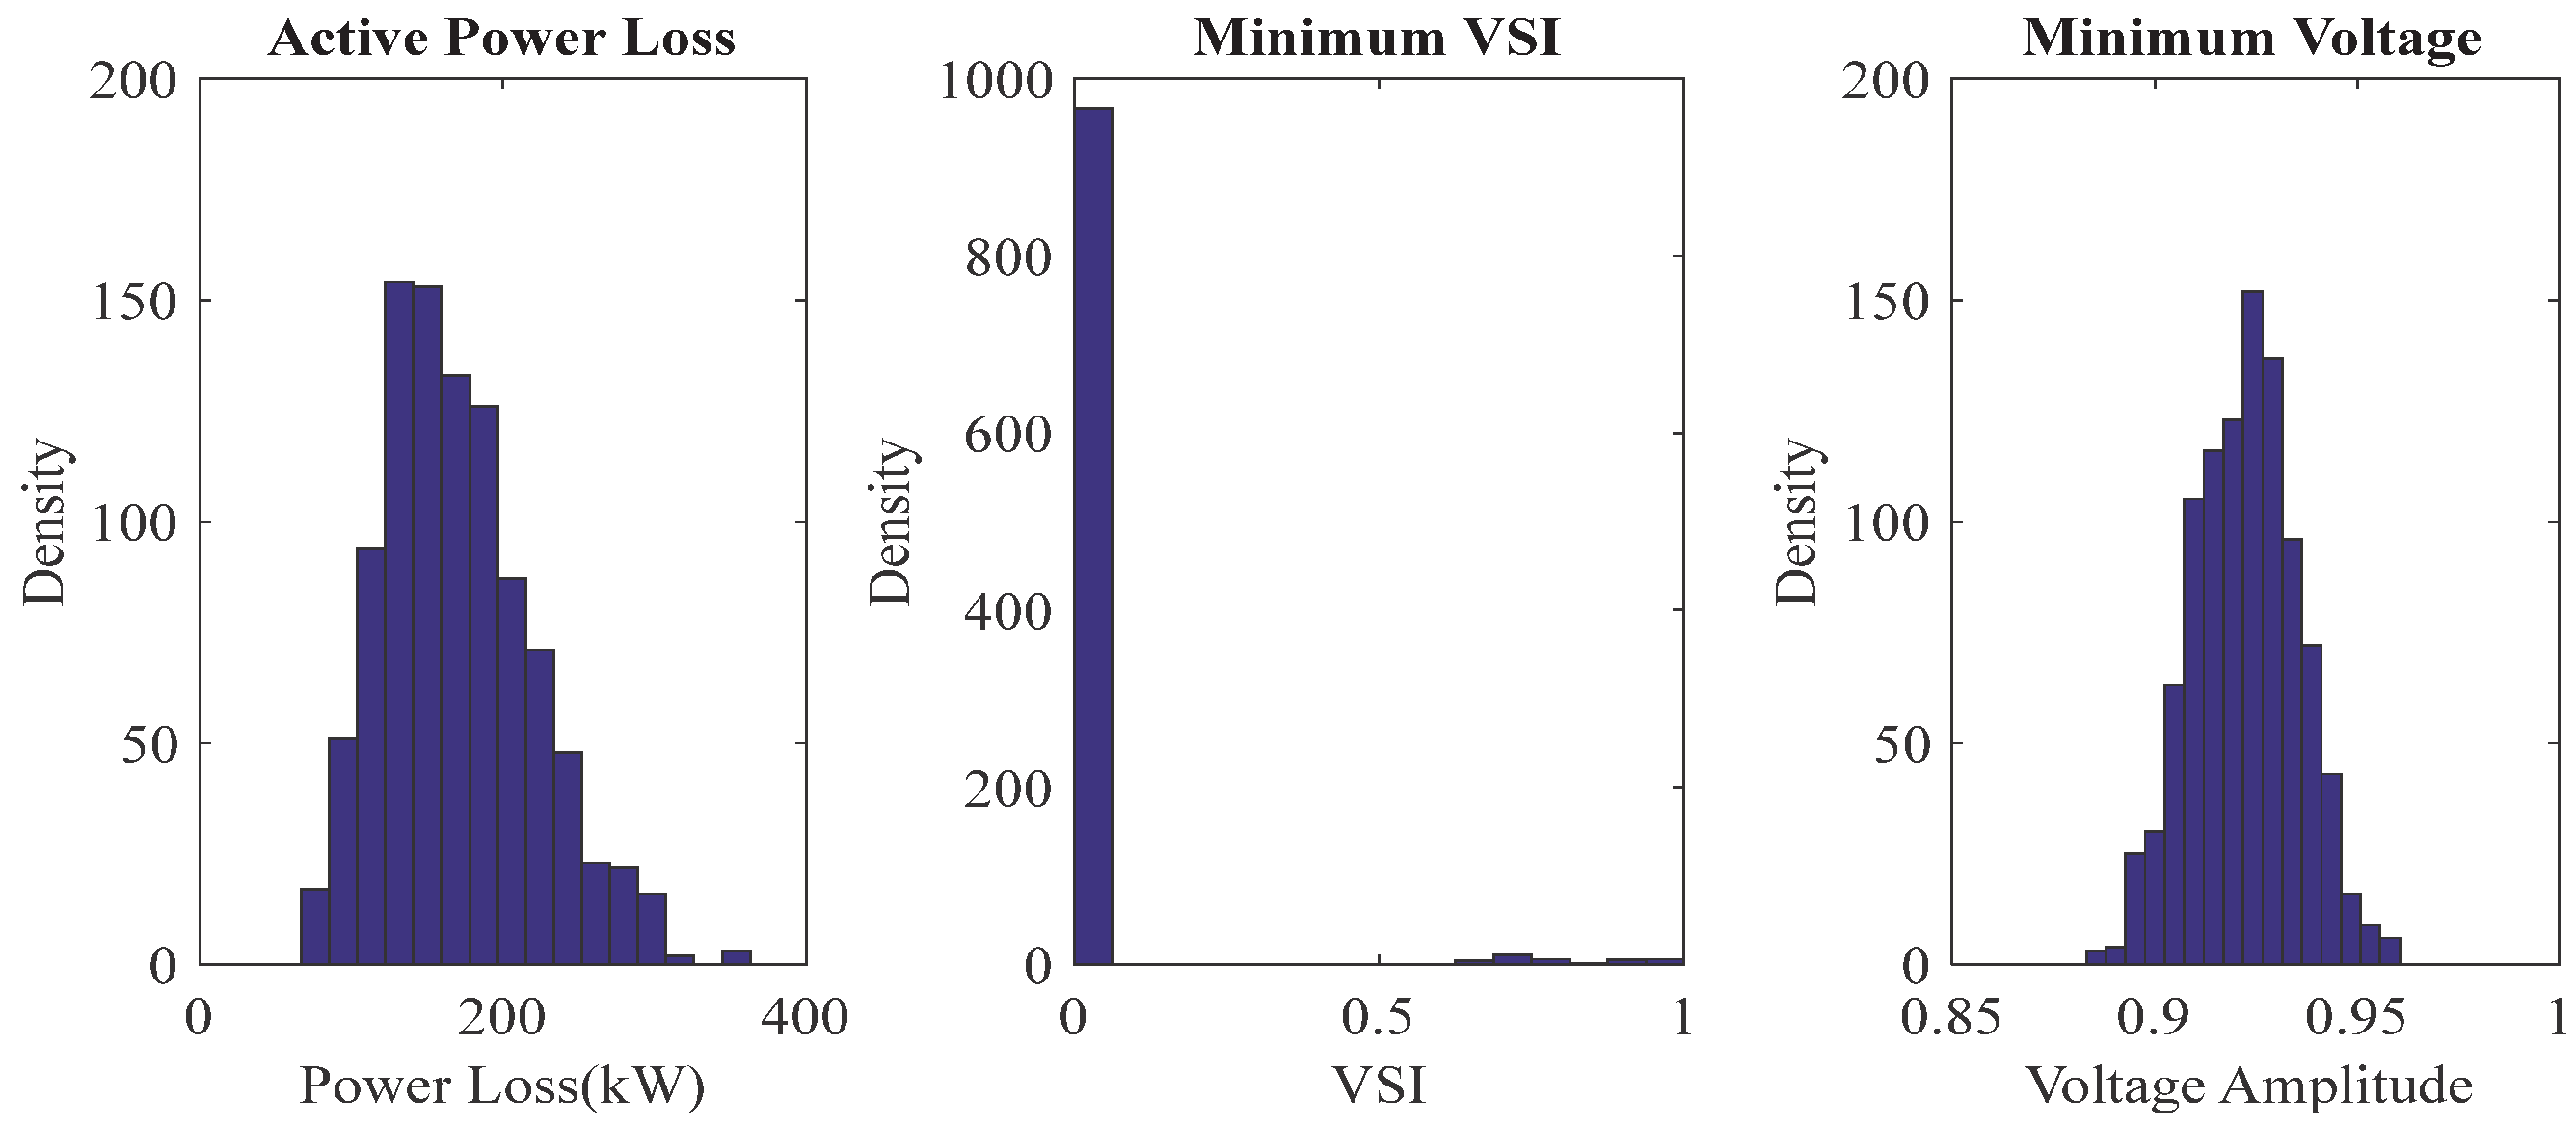
| Stochastic | 91.34 | 0.9665 | 28.087 |
| System/Item | Power Loss | Minimum Voltage | Voltage Stability Index |
|---|---|---|---|
| Deterministic | 70.16 | 0.9876 | 65.865 |
| Stochastic | 76.63 | 0.9752 | 63.427 |
Publisher’s Note: MDPI stays neutral with regard to jurisdictional claims in published maps and institutional affiliations. |
© 2022 by the authors. Licensee MDPI, Basel, Switzerland. This article is an open access article distributed under the terms and conditions of the Creative Commons Attribution (CC BY) license (https://creativecommons.org/licenses/by/4.0/).
Share and Cite
Alanazi, A.; Alanazi, M.; Abdelaziz, A.Y.; Kotb, H.; Milyani, A.H.; Azhari, A.A. Stochastic Allocation of Photovoltaic Energy Resources in Distribution Systems Considering Uncertainties Using New Improved Meta-Heuristic Algorithm. Processes 2022, 10, 2179. https://doi.org/10.3390/pr10112179
Alanazi A, Alanazi M, Abdelaziz AY, Kotb H, Milyani AH, Azhari AA. Stochastic Allocation of Photovoltaic Energy Resources in Distribution Systems Considering Uncertainties Using New Improved Meta-Heuristic Algorithm. Processes. 2022; 10(11):2179. https://doi.org/10.3390/pr10112179
Chicago/Turabian StyleAlanazi, Abdulaziz, Mohana Alanazi, Almoataz Y. Abdelaziz, Hossam Kotb, Ahmad H. Milyani, and Abdullah Ahmed Azhari. 2022. "Stochastic Allocation of Photovoltaic Energy Resources in Distribution Systems Considering Uncertainties Using New Improved Meta-Heuristic Algorithm" Processes 10, no. 11: 2179. https://doi.org/10.3390/pr10112179
APA StyleAlanazi, A., Alanazi, M., Abdelaziz, A. Y., Kotb, H., Milyani, A. H., & Azhari, A. A. (2022). Stochastic Allocation of Photovoltaic Energy Resources in Distribution Systems Considering Uncertainties Using New Improved Meta-Heuristic Algorithm. Processes, 10(11), 2179. https://doi.org/10.3390/pr10112179