Article

Statistical Optimisation of Used-Cooking-Oil Degradation by Burkholderia vietnamiensis AQ5-12 and Burkholderia sp. AQ5-13

by
Mariyam Shabeena Ahmed
1,2,
Siti Aqlima Ahmad
3,
Mohd Yunus Shukor
3 and
Mohd Termizi Yusof
1,*
1
Department of Microbiology, Faculty of Biotechnology and Biomolecular Sciences, Universiti Putra Malaysia, Serdang 43400, Selangor, Malaysia
2
Research Development Office, The Maldives National University, Rahdhebai Higun, Machangolhi, Malé 20371, Maldives
3
Department of Biochemistry, Faculty of Biotechnology and Biomolecular Sciences, Universiti Putra Malaysia, Serdang 43400, Selangor, Malaysia
*
Author to whom correspondence should be addressed.
Processes 2022, 10(11), 2178; https://doi.org/10.3390/pr10112178
Submission received: 27 September 2022 / Revised: 19 October 2022 / Accepted: 20 October 2022 / Published: 24 October 2022
(This article belongs to the Special Issue Control, Removal and Optimization of Environmental Contaminants)

Abstract

:
Used cooking oil (UCO) is a hydrocarbon that causes significant environmental pollution globally. Oil is a difficult pollutant to remove from the environment due to its hydrophobic nature. Bioremediation is preferred over chemical and physical remediation approaches as it is more economical and environmentally friendly. Hence, the search for a microbe with outstanding degrading capability is imperative due to the nature of hydrocarbons as pollutants. The current study evaluates the ability of glyphosate degrader isolates, Burkholderia vietnamiensis AQ5-12 and Burkholderia sp. AQ5-13, to degrade UCO as the sole carbon source. The physico-cultural conditions affecting the activities of the isolates were studied using one-factor-at-a-time (OFAT) and response-surface methodology (RSM). The temperature, agitation speed, UCO concentration, nitrogen supply, yeast extract concentration, and inoculum size were optimised during a 7-day incubation period. Based on the OFAT results, the highest degradations were 62.23% and 58.33% for the isolates AQ5-12 and AQ5-13, respectively. The optimisation of RSM showed 83.42% and 87.09% degradation of the UCO by the AQ5-12 and AQ5-13 isolates. Parameters including the temperature, yeast extract, and ammonium sulphate concentration provided significant interaction for the RSM model in the isolate AQ5-12. Meanwhile, AQ5-13 showed significance in all five parameters: pH, UCO concentration, temperature, yeast extract, and ammonium sulphate concentration. The degradation efficiency validated via RSM demonstrated better results than the OFAT approach. The model validation has verified no significant difference between the experimental and predicted values. The ability of these two bacterial isolates to degrade UCO is a worthwhile procedure in the bioremediation of hydrocarbon-rich areas.

1. Introduction

Cooking oil (CO) is one of the most significant ingredients in the human diet. It is one of the most essential components in the preparation of food worldwide [1]. Inevitably, the increased population growth and anthropogenic effect due to industrialisation, urbanisation, changes in eating patterns from indigenous food to fast food and increased food production have led to the increased use of CO. This has, in turn, led to an increased amount of waste or used cooking oil (UCO). The production rate of UCO has risen exponentially, threatening both the environment and human health [2,3]. The increased usage of and demand for oil worldwide have led to CO becoming one of the world’s largest pollutants [4]. In 2018, the worldwide production of edible vegetable oil was 203.83 million metric tonnes, with consumption of 197.33 million metric tonnes [5]. The global oil market is estimated to increase its production from USD 83.4 (2015) to USD 130.3 billion by 2024 [6].
The Food and Agricultural Organisation (FAO) stated that the major use of CO is in frying, with urbanisation increasing the consumption of oil in countries around the world [7]. UCO is the end-product of frying foods using CO, which contains processed plants or animal fats. Waste is a material, substance or by-product that is no longer useful or required [8]. Oil undergoes vast chemical changes due to heat during the cooking process, which changes its chemical composition. The frying process introduces other substances via leaching, enriching the oil composition with metal traces, spices and other organic molecules [9]. The chemical analysis of UCO revealed a complex mixture of chemicals such as aldehydes, alcohols, dienes and heterocycles [10]. An analysis before and after several cycles of frying revealed the presence of many chemicals, such as hexanal, heptanal, limonene, furan 2-penty, nonanal, 1-octen-3-ol. furfural, cyclohexanol-dimethyl-2, benzaldehyde, 2-nonenal, 2-furan-methanol, 2-decenal, 2-undecenal and 2,4 decadienal [11]. These compounds are known to cause non-communicable diseases with mutagenic and carcinogenic effects [12].
UCO degradation is a major challenge as these pollutants contaminate land and water resources [1,13]. When oil is oxidised into alcohols, aldehydes, ketones, and various other harmful chemicals, it threatens the health of the entire biotic ecosystem [4]. Discharged UCO into rivers, drainage systems, and landfills exerts detrimental effects on the terrestrial and aquatic biota, leading to environmental pollution [3]. The accumulation of oil harbours a high concentration of potentially pathogenic organisms that harm public health [14]. In the environment, UCO has physical properties similar to those of petroleum oil. It forms a thin layer over water, which reduces the dissolved oxygen concentration required for underwater living creatures, causing the death of aquatic animals. This later results in high chemical-oxygen demand (COD) in wastewater, reduced oxygen transfer rate, and the oil coating of animals and plants [1]. In soil, respiration and absorption by plants are hindered, resulting in plant death [14]. When UCO is disposed of directly into kitchen sinks, it can solidify and block sewer pipes.
Many remediation technologies have been applied to remove contaminated hydrocarbon, including physical and chemical treatments. Biodegradation is a process in which microbial activity is utilised for pollutant removal. It is a promising alternative to solving the secondary issues caused by physical and chemical treatments [3]. This option is one of the most environmentally friendly techniques to remediate contaminated environmental sites and can also be applied to large hydrocarbon-contaminated areas and oil spills in soils and oceans [15,16]. Bioremediation involves microbial degradation, in which the organic pollutant is mineralised completely into carbon dioxide, water, inorganic compounds and cell protein, or the complex organic contaminants are transformed into other simpler organic compounds [17]. The usage of microorganisms to decompose a pollutant through biological treatment is considered an important tool in waste treatment [3]. This technology is economical, efficient, versatile, and environmentally sound. A range of aerobic and anaerobic microorganisms that can break down oils depend on the chemical characteristics of the oil to determine its biodegradability efficiency. Nonetheless, it is necessary to select microorganisms that can degrade contaminated materials under various temperatures, pH, salinity, and nutrient concentrations to ensure successful bioremediation. Several bacterial genera, either individually or in combination, have been identified as having oil-degrading abilities. These include Pseudomonas, Burkholderia, Acinetobacter, Escherichia, Bacillus, Serratia, Rhodococcus, Staphylococcus, Arthrobacter, Enterobacter, Lactobacillus, Klebsiella, Corynebacterium, Gordonia, Brevibacterium, Aeromicrobium, Dietzia, and Mycobacterium [4,17,18,19,20,21].
Burkholderia is a known bacterial genus capable of degrading persistent hydrocarbon compounds. The genus has been used as a model to study its degradation ability [22]. The Burkholderia species is ubiquitous in soil, water, plants, and animals, as well as polluted, contaminated sites. Despite its presence in varied environments, this genus is underexplored compared to other well-known bacterial genera, such as Pseudomonas or Bacillus. Hence, further research is required to assess their potential in bioremediation and other biotechnological applications [23]. The current study is the first to report the use of Burkholderia vietnamiensis AQ5-12 and Burkholderia sp. AQ5-13 isolate to degrade UCO. This study aims to optimise the growth and degradation conditions of UCO. The conventional method of one-factor-at-a-time (OFAT) and the statistical method were applied in this study.

2. Materials and Methods

2.1. Sampling of UCO

UCO was the sole carbon source used in this study and was collected from several households in the Kajang district, Selangor, Malaysia. The UCO collected for this study was used for several cycles of deep frying.

2.2. Bacterial Culture Maintenance and Media Preparation

B. vietnamiensis AQ5-12 and Burkholderia sp. AQ5-13 were provided by the Eco-Remediation Technology Laboratory, Faculty of Biotechnology and Biomolecular Science, Universiti Putra Malaysia. The isolates were maintained on nutrient agar and preserved in 50% (v/v) glycerol at −80 °C for long-term storage.

2.3. Assessment of UCO Degradation by B. vietnamiensis AQ5-12 and Burkholderia sp. AQ5-13

The inoculum was prepared by inoculating the bacterial cultures onto minimal salt medium (MSM) consisting of: 0.1% (w/v) (NH4)2SO4, 0.09% (w/v) K2HPO4, 0.06% (w/v) KH2PO4, 0.02% (w/v) MgSO4.7H20 and 0.01% (w/v) yeast extract supplemented with 1% (v/v) initial concentration of UCO [24].
The method is a modified version of Rahman et al.’s method [15]. The isolates were cultured in nutrient broth and incubated on a rotary shaker at 150 rpm and 30 °C for 4 days. At the end of incubation, the bacterial cultures were centrifuged at 10,000 rpm for 10 min. The resting cells and the inoculum size of the bacterial samples were standardised to an optical density (OD) of 1.0 ± at a wavelength of 600 nm. The cultured cell was transferred into universal bottles containing 9 mL of the MSM media and 100 µL of UCO as the single source of carbon. The culture bottles were incubated at 30 °C for 14 days and agitated at 150 rpm. At a 24 h interval, a set of bottles was used to determine the degradation and bacterial growth by measuring the absorption spectrophotometrically at OD 600 nm.

2.4. Determination of UCO Degradation by Gravimetric Method

The gravimetric analysis method was used to calculate the amount of residual UCO [21,25] Bacterial culture at the exponential-growth phase was supplemented with 1% UCO in 9 mL of MSM media. After incubation at 24 h, a 1 mL sample was removed to measure the bacterial growth by OD at a 600-nanometer wavelength (UV mini 1240 Shimadzu, Japan). For the extraction of the residual oil, 10 mL of n-hexane was added to the medium forming two layers. The mixture was separated into two layers; the upper layer, which contained the oil and n-hexane, was collected in a pre-weighed Petri dish. The percentage degradation of UCO was calculated using the following formula proposed by Sihag and Pathak [21].
U C O   d e g r a d a t i o n   ( % ) = X Y X × 100
where X = the original mass of the UCO added to the medium. Y = the mass of the residual UCO.
The assessment of each bacterial isolate for its ability to degrade UCO was observed for an incubation period of 14 days.

2.5. Bacterial Growth and UCO Degradation Optimisation Using OFAT

The initial bacterial growth and UCO degradation assessment were conducted using the OFAT approach. The seven parameters selected for this study were temperature, agitation speed, substrate-oil concentration, nitrogen source, pH, yeast extract concentration, and inoculum size. As in traditional optimisation, each tested parameter was optimised while keeping all other parameters constant. The effect of temperature was assessed at 20, 25, 30, 35, 40, and 45 °C and agitation speed at 90, 130, 150, 200, and 250 rpm. The substrate-oil concentration was set at 1%, 2%, 3%, 4%, 5%, and 7%. The evaluated nitrogen sources included ammonium nitrate, ammonium sulphate, sodium nitrate, ammonium chloride, urea, and aspartic acid. The medium without nitrogen was set as the control while the pH was optimised using acetate buffer pH (5.0–5.5), phosphate buffer (pH 6.0–6.8) and Tri-HCl buffer (pH 7.0–9.0). The yeast concentration was analysed using 0.05, 0.1, 0.2, 0.3, 0.4, and 0.5 g/L. The influence of UCO substrate was evaluated at 1%, 2%, 4%, 6%, 8%, 10%, 15%, and 20% (v/v). The effects were assessed by inoculation; fresh bacterial culture (OD 600 nm 1.2–1.3) was inoculated in the liquid media supplemented with 1% UCO for 7 days. The degradation and growth were monitored from culture densities that measured the absorption spectrophotometrically at 600 nm. All the experiments were conducted in triplicate, including the negative control.

2.6. Statistical Optimisation Using Response-Surface Methodology (RSM)

Optimisation of UCO degradation using the response-surface method (RSM) comprised two steps: the Placket–Burman design (PBD) as a screening step and the popular central composite design (CCD) as a further optimisation step. RSM has been exploited for optimisation and interactionfor different parameters in bioremediation and involves a minimum number of tests [26,27]. RSM can be used to define the relationship between the response and independent variables. PBD and CCD can be used to study the combined effect of different variables in an experiment.

2.6.1. Screening for Significant Factors Using Plackett–Burman Design (PBD)

The PBD was utilised to find the most significant parameters for the UCO-degrading bacteria. The significant parameters obtained were further optimised using CCD. The design of the experiment and the statistical analysis of the data were conducted using Design Expert software versions 6.0.08 and 10.0 (Stat-Ease Inc., Minneapolis, MI, USA). The parameters used in OFAT were further analysed by PB to confirm their significance. The five independent factors, i.e., pH, substrate-oil concentration, temperature, yeast extract, and ammonium sulphate concentration, were screened to evaluate their effects on the UCO degradation and bacterial growth (OD600 nm) using the PBD. The selected variables in this analysis were each coded at three levels: −1, 0 and 1 (Table 1). A total of 12 experimental variables were generated using software screening for degradation and their response for both isolates.

2.6.2. Optimisation of UCO Degradation by B. vietnamiensis AQ5-12 and Burkholderia sp. AQ5-13 Using CCD

The influential variables from the PB screening (p < 0.05) were selected and optimised by quadratic factorial CCD by combining two factor points: the central point and two other points (+1, 0, −1). A total of 20 and 50 runs for the B. vietnamiensis AQ5-12 and Burkholderia sp. AQ5-13 isolates were performed. The variables were coded according to the following equation:
x i = ( X i X 0 ) Δ X i = 1 , 2 ,   k
where xi is the dimensionless value of an independent variable, Xi is the real value of an independent variable, the value of Xi is the centre point, and ∆X is the step change [18]. CCD is extensively used in statistical methods, depending on the multivariate nonlinear model for optimisation, and is additionally used to determine regression model equations and operational conditions [28]. Hence, the optimisation process can be summarised in three steps: (1) performing the statistical design experiment, (2) estimating the coefficients in a mathematical model, and (3) checking the response and adequacy of the model. A higher-degree second-order model was applied in the polynomial regression. The second-order model polynomial regression model contains linear, quadratic, and interaction coefficients to predict the optimal conditions and interactions between significant variables. The second-order model was utilised according to the following formulae [29,30,31,32].
Y = β 0 + i = 1 k   β i x i + i = 1 k   β ii x i 2 + i = j k j = i + 1 k   β ij x i x j + ε
The generalised second-order polynomial model used in the response-surface analysis involved Y as the response variable (UCO degradation), k as the number of variables and Xi and Xj as the independent parameters. Meanwhile, β0, βi, βii, and βij are the coefficients of intercept, linear, quadratic, and interaction impact. The ε is the random error [18,33]. The significance of the model and regression coefficients was determined by analysis of variance (ANOVA). The coefficient (R2) was determined to evaluate the fit of the model. The response and contour structure of the model’s expected response determine the mutual correction between the relevant parameters. Hence, the optimum condition was obtained by solving the regression equation and analysing the response-surface contour plots.

2.7. Statistical Analysis

All the experiments were conducted in triplicate, and the data are presented as mean ± standard deviation. One-way ANOVA was used to compare data within the groups, and Tukey’s test was performed to conduct post hoc pairwise tests to observe for significance.

3. Results

3.1. Assessing UCO Degradation by B. vietnamiensis AQ5-12 and Burkholderia sp. AQ5-13

Both bacterial isolates showed the ability to degrade UCO over 14 days (Figure 1). The degradation increased from day 1 to 7. The highest degradation was obtained at day 7, with 82.67% and 68% for B. vietnamiensis AQ5-12 and Burkholderia sp. AQ5-13, respectively. The degradation decreased and remained steady for both bacteria from days 7 to 14. The bacterial incubation time was set to 7 days in the subsequent experimental runs. The performances of B. vietnamiensis AQ5-12 and Burkholderia sp. AQ5-13 differed significantly. In comparison, B. vietnamiensis AQ5-124 demonstrated greater degradation and bacterial growth than Burkholderia sp. AQ5-13. The highest degradation was obtained for B. vietnamiensis AQ5-12, at 82.33%, whereas AQ5-13 had 68.00% degradation.

3.2. Optimisation of Each Parameter for UCO Degradation Using OFAT

3.2.1. Effects of Temperature and Agitation Speed

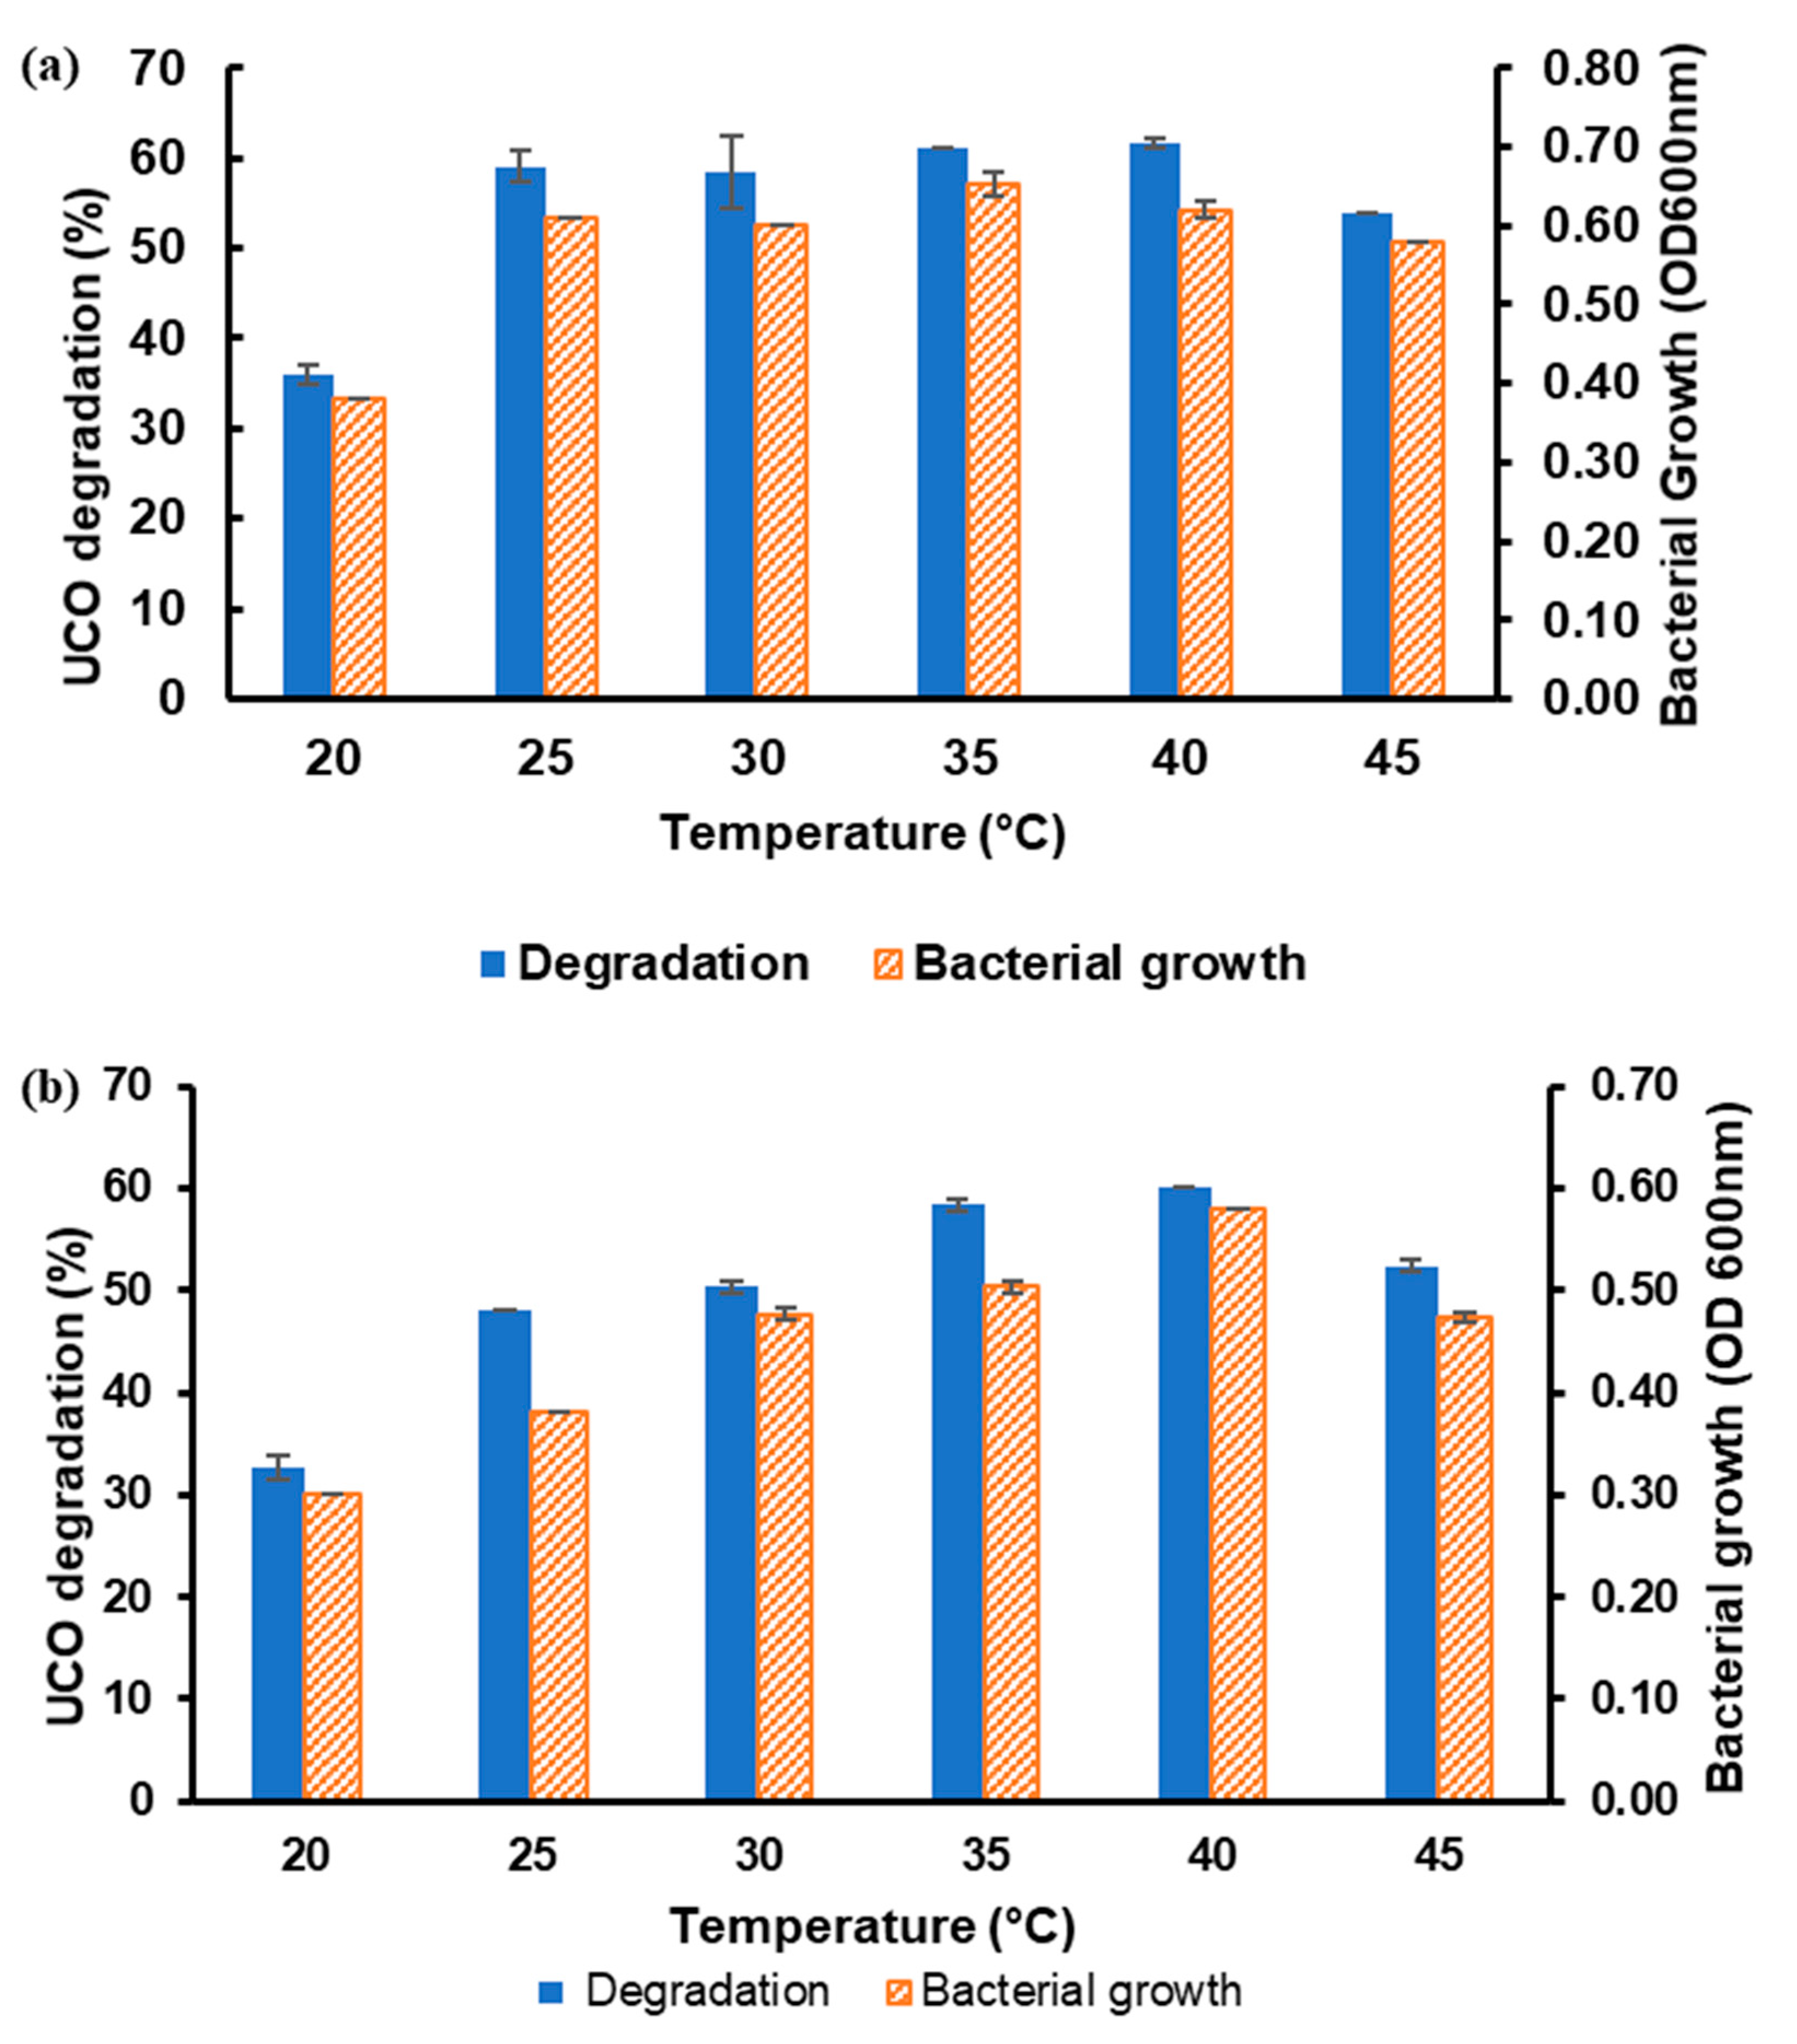
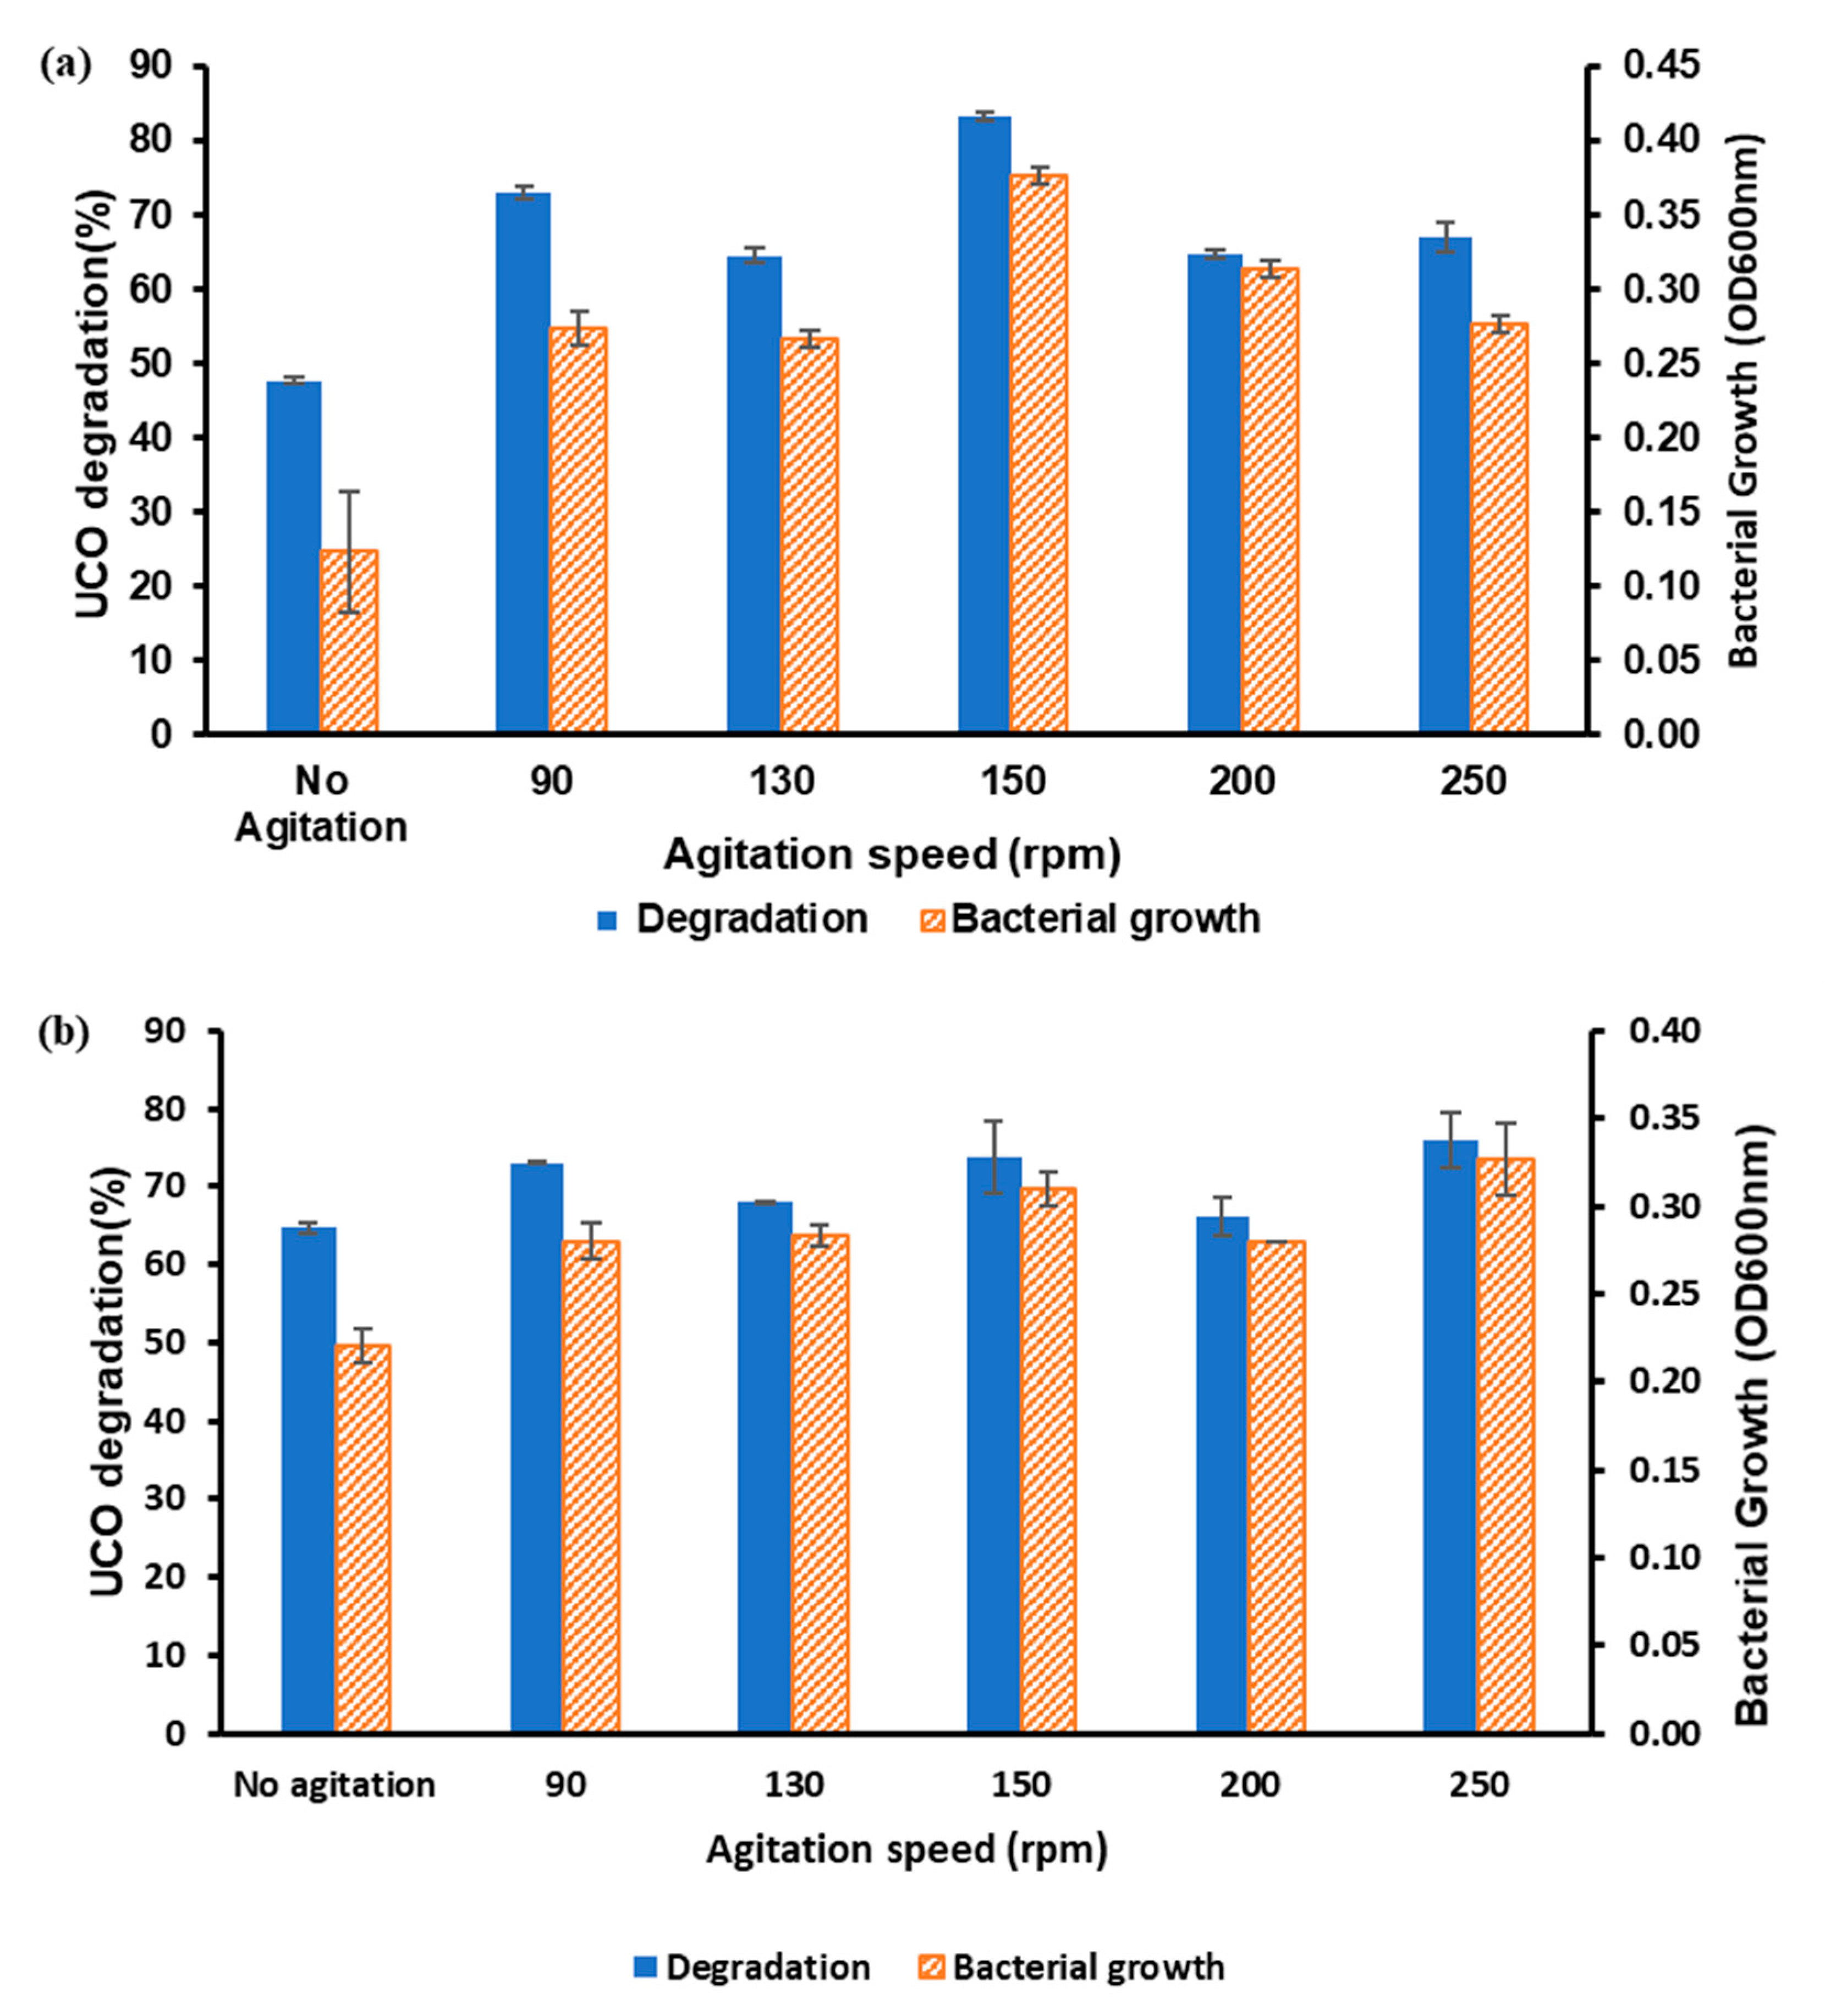
The influence of the temperature on the UCO degradation by B. vietnamiensis AQ5-12 and Burkholderia sp. AQ5-13 is presented in Figure 2. Both isolates showed a gradual increase in UCO degradation and growth from 25 to 40 °C. Both isolates had optimum degradation and growth at 40 °C. The one-way ANOVA displayed a significant overall difference between the culture temperatures in terms of growth and degradation (p < 0.001). The post hoc comparison indicated no significant difference between the degradation and bacterial growth at 25 °C and 40 °C for isolate AQ5-12 and 35 °C and 40 °C for isolate AQ5-13. The optimum degradation and growth were at 150 rpm of agitation speed for B. vietnamiensis AQ5-12 (Figure 3).
The results of the analysis of the agitation speed demonstrated that Burkholderia sp. AQ5-13 had the optimum degradation and growth at 250 rpm (Figure 2). There was a significant difference between the 150 rpm and the rest of the agitation speeds for the B. vietnamiensis AQ5-12 isolate (p < 0.001). This result was similar to the significant difference between the 250 rpm and the rest of the agitation speeds for the Burkholderia sp. AQ5-13 isolate (p < 0.001).

3.2.2. Effects of Substrate Concentration and Nitrogen Source

The effects of different oil concentrations (1–7%) were analysed (Figure 4). The optimum substrate concentration for both B. vietnamiensis AQ5-12 and Burkholderia sp. AQ5-13 was a 3% oil concentration. There was a gradual decrease in the UCO degradation and growth when the substrate-oil concentration increased from 3% to 7%. The one-way ANOVA showed a significant difference between the 3% oil concentration and the rest of the substrate concentrations for both AQ5-12 and AQ5-13 (p < 0.001).
The influence of various nitrogen sources is shown in Figure 5. Six nitrogen sources were tested, namely, ammonium nitrate, ammonium sulphate, sodium nitrate, ammonium chloride, urea, and aspartic acid. Of these, ammonium sulphate gave the optimum degradation and growth for the B. vietnamiensis AQ5-12 and Burkholderia sp. AQ5-13 isolates. The one-way ANOVA demonstrated that both isolates have overall significance for the different nitrogen sources tested (p < 0.001).

3.2.3. Effects of pH, Yeast Extract Concentration, and Inoculum Size

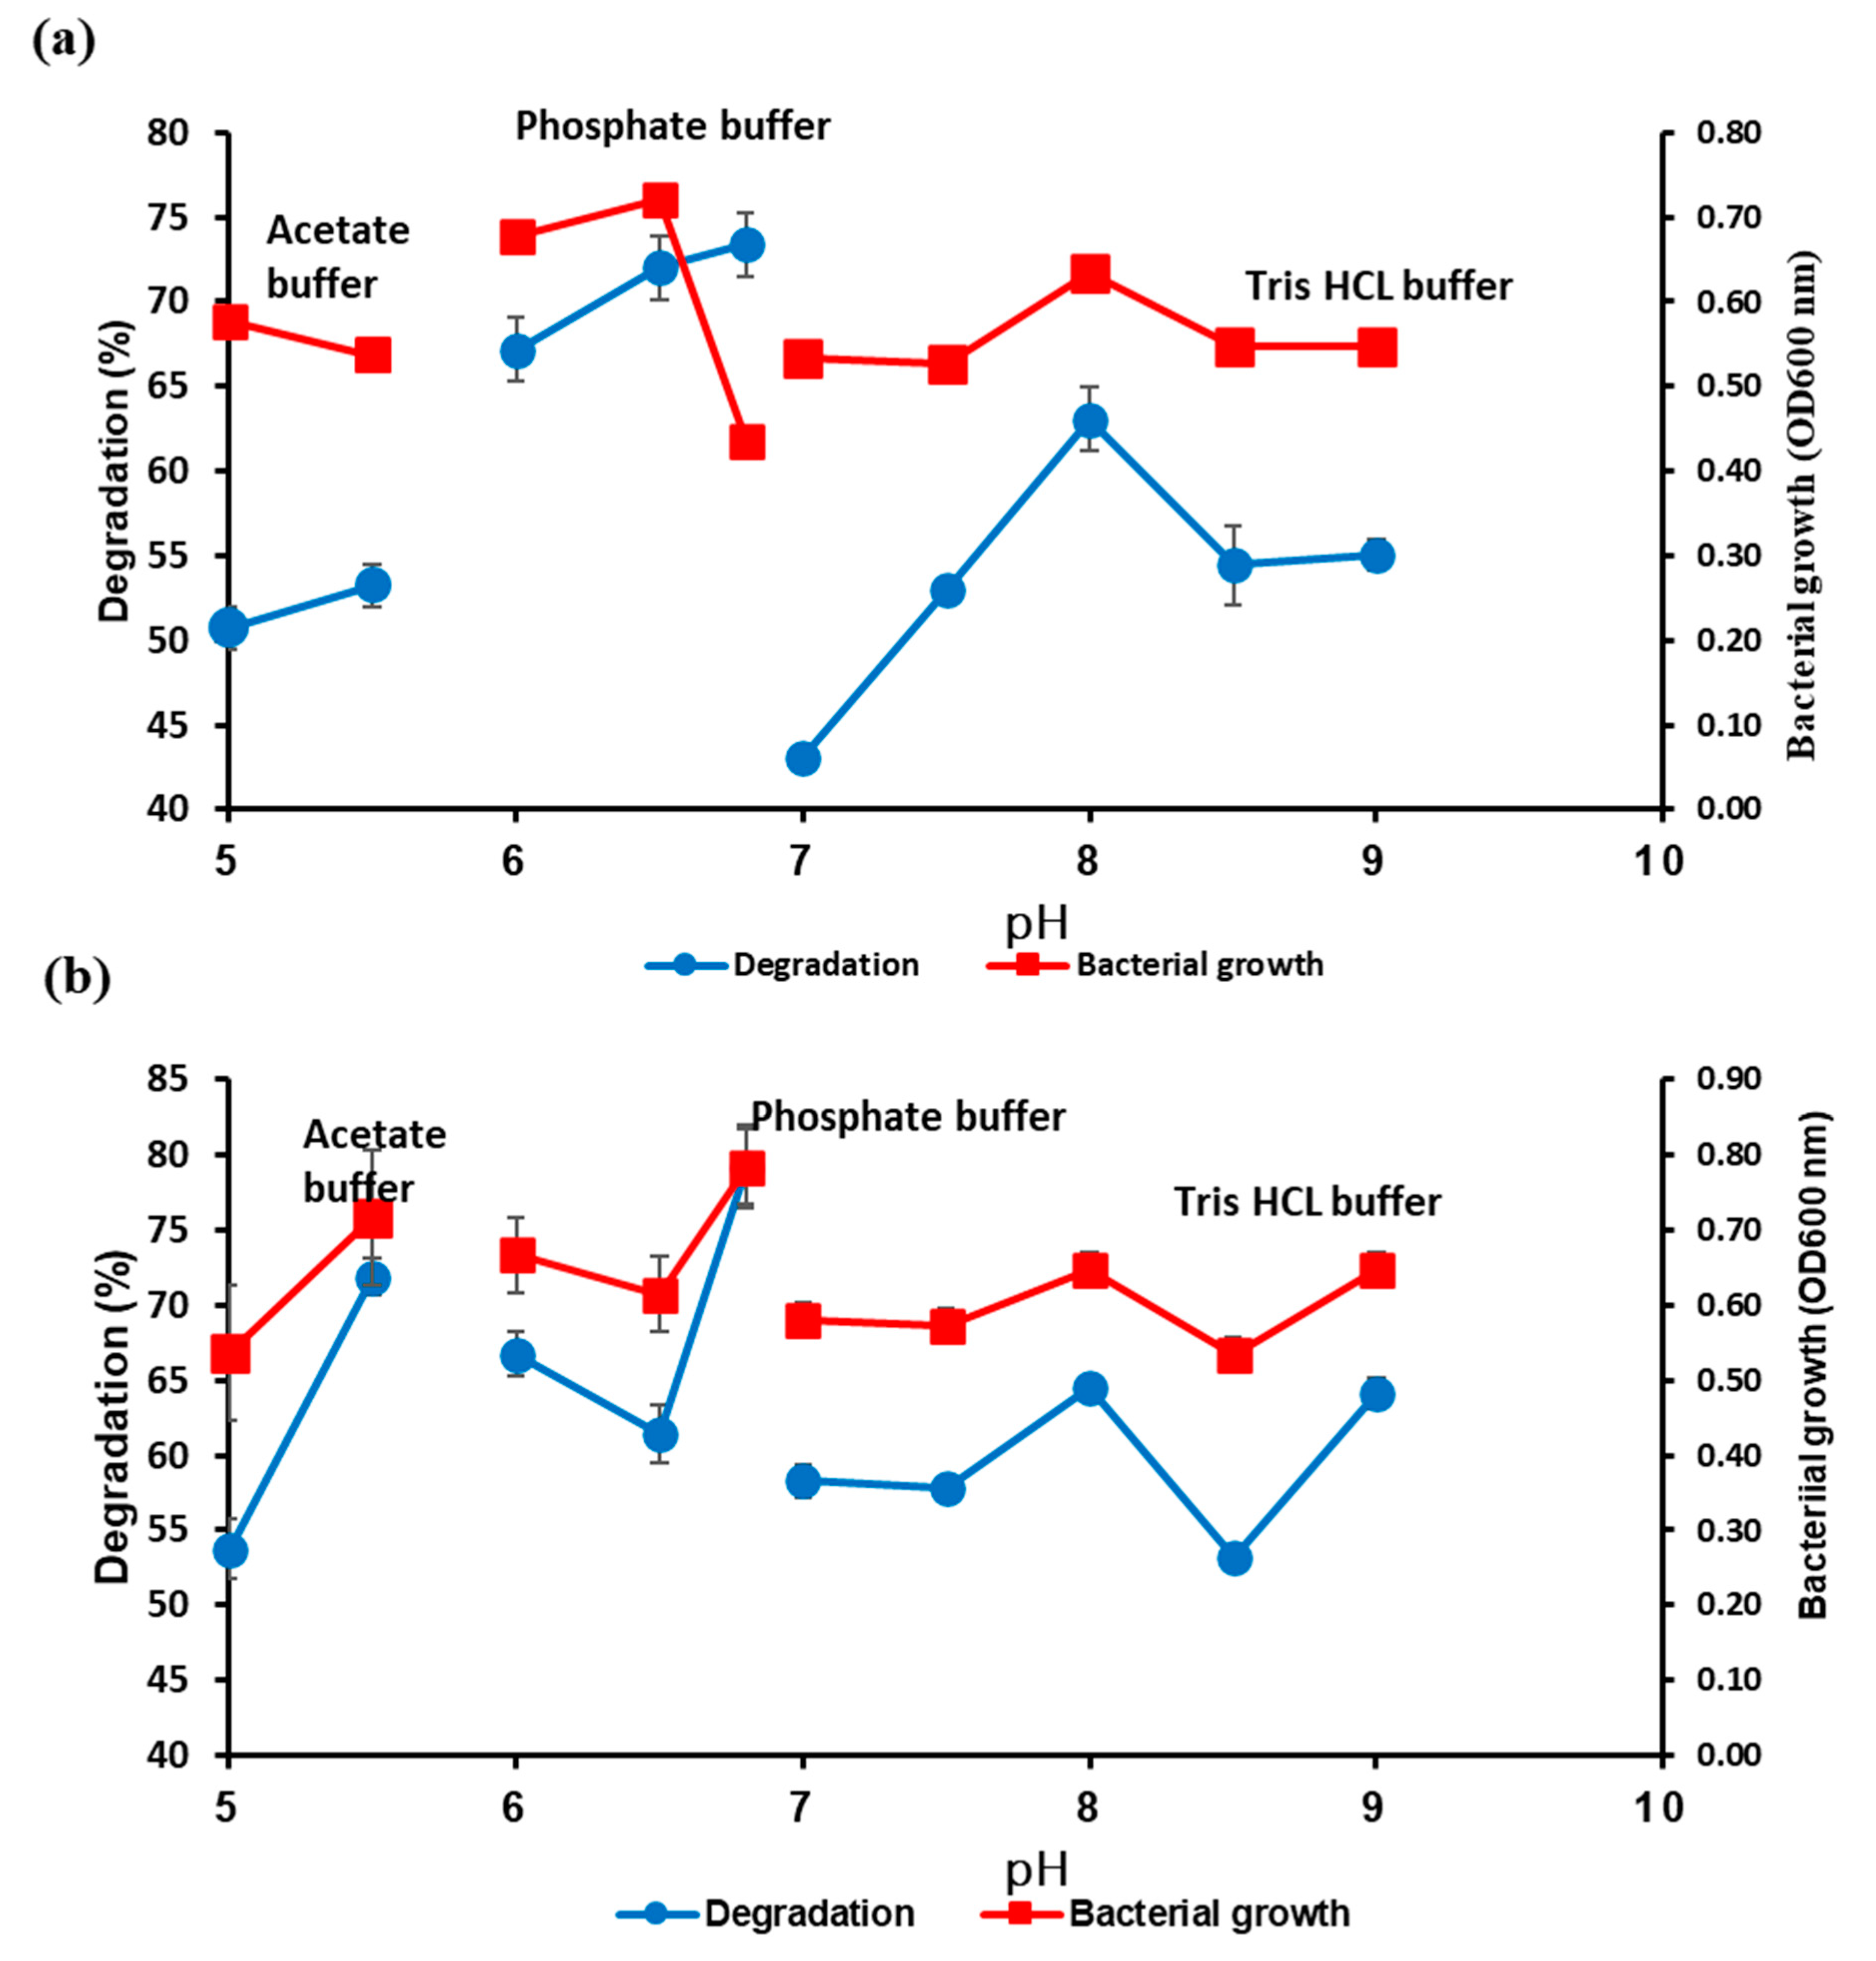
The effect of pH for both the isolates B. vietnamiensis AQ5-12 and Burkholderia sp. AQ5-13 on the UCO degradation and growth are shown in Figure 6. The optimum degradation and growth were observed in slightly acid conditions. The optimum degradation was observed at pH 6.8, with 73.40% degradation for isolate AQ5-12 and 79.17% for AQ5-13. Meanwhile, the optimum growth and degradation were achieved at 0.4 g/L of yeast extract for both isolates (Figure 7). The increasing yeast extract concentrations increased the degradation from 0.05 to 0.40 g/L.
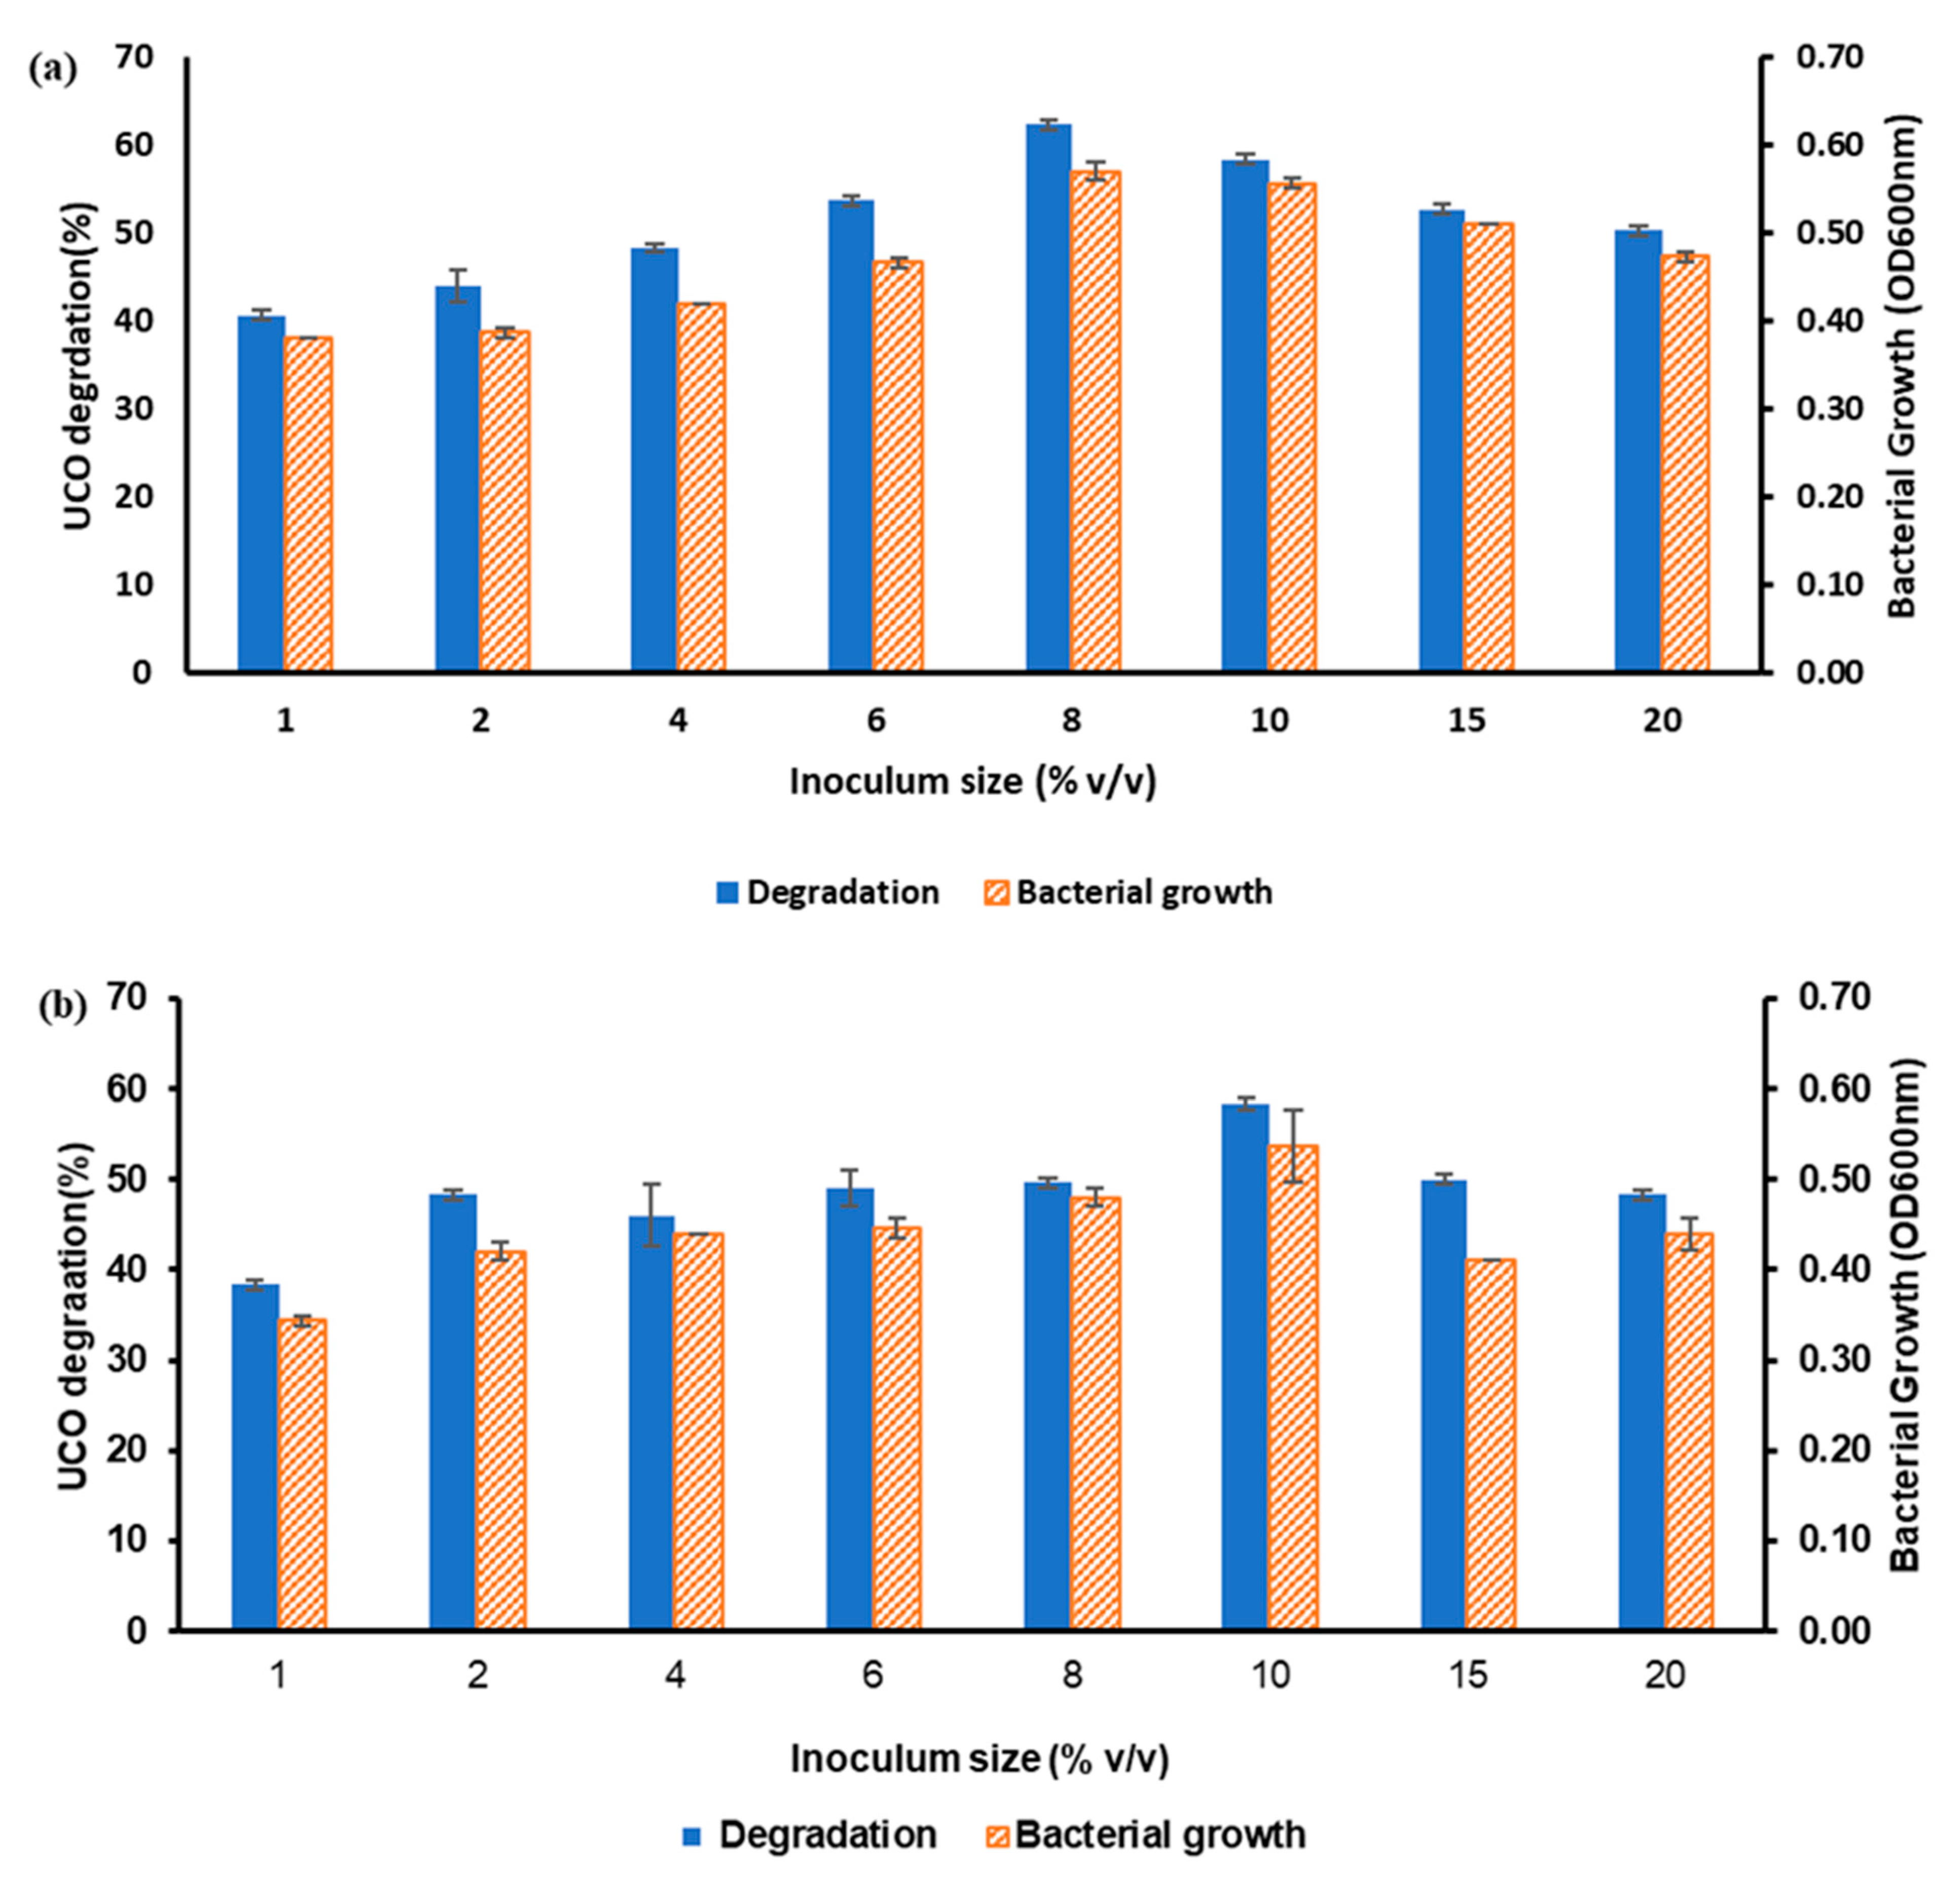
The effects of inoculum size over 1–20% (v/v) were studied (Figure 8). The bacterial growth and UCO degradation were optimal in the 8–10% (v/v) inoculum size range for both isolates. The AQ5-12 isolate showed its highest degradation at 8% (v/v) inoculum size, whereas AQ5-13 showed its highest degradation at 10% (v/v) inoculum size. The one-way ANOVA indicated that the effects of pH, yeast extract concentration, and inoculum size on UCO degradation and bacterial growth were significant for both the AQ5-12 and AQ5-13 isolates (p < 0.001).

3.3. Optimisation of Bacterial Growth and Degradation by Response-Surface Methodology (RSM)

3.3.1. Plackett–Burman Design (PBD) Assessing the Significant Factors

The PBD experiment design generated 12 runs for the degradation percentage responses for both isolates. The significance of five selected variables was analysed through PBD (Table 2 and Table 3). The results indicated that three factors, namely temperature (p = 0.0373), yeast extract concentration (p = 0.0188) and nitrogen source (p = 0.0330) were significant for B. vietnamiensis AQ5-12. Meanwhile, all the parameters (pH, oil concentration, temperature, yeast extract concentration and nitrogen source) were significant (p < 0.05) in Burkholderia sp. AQ5-13. The significant factors were selected for further optimisation in central composite design (CCD). The reliability of the experimental data was confirmed through the coefficient of determination, R2, with values of p = 0.9998 and p = 1.0000 for B. vietnamiensis AQ5-12 and Burkholderia sp. AQ5-13, respectively.

3.3.2. Optimisation of UCO Degradation Using Central Composite Design (CCD)

The significant individual parameters and interactions analysed during the PBD design were incorporated into the CCD as the output response of the percentage degradation of the UCO. There were three parameters for B. vietnamiensis AQ5-12 and five parameters for Burkholderia sp. AQ5-13. A total of 20 and 50 experiments for the AQ5-12 and AQ5-13 isolates, respectively, were run at different combinations. The similarities between the actual and predicted values obtained in CCD for UCO for the isolates AQ5-12 and AQ5-13 were observed. The highest degradation was 89%, compared to the predicted value of 82.67% for B. vietnamiensis AQ5-12. Meanwhile, the lowest degradation, of 25%, was obtained for the B. vietnamiensis AQ5-12 isolate. Burkholderia sp. AQ5-13 showed the highest degradation, of 87.67%, while the predicted value was 86.12%. Additionally, the lowest values obtained were 2% for AQ5-13.
The second-order response-surface model results of the UCO degradation for the B. vietnamiensis AQ5-12 and Burkholderia sp. AQ5-13 isolates are summarised in Table 4 and Table 5. The linear terms (A, B and C), squared terms (A2, B2 and C2), and three quadratic terms (AB, AC and BC) were significant for AQ5-12. The terms B, B2, BC, and CD were significant, indicating the significant factors to be the substrate-oil concentration and significant noise. The multiple-regression analysis of the observed results is presented in quadratic Equations (4) and (5) for the AQ5-12 and AQ5-13 isolates, respectively.
For the isolate AQ5-13, the lack of fit term is not significant, implying that the model is
Y   ( % ) = 296.04606 + 21.25138 A + 49.71423 B + 91.74789 C 0.80000 A B 3.55556 A C accurate   without + 24.88889 B C 0.31126 A ² 10.07125 B ² 34.06171   C
Y ( % ) = 25.17882 + 11.53739 A 11.4653 B + 1.65060 C + 1.94959 D + 5.2050 E 0.73732 A B 0.17822 A C + 0.89185 A E 1.33663 A E + 0.40314 B C + 0.076651 B D 0.52071 B E 0.24480 C D + 0.24650 C E 1.05027 D E 0.27410 A ² 476174 B ² 0.014202   C ²
where Y is the response (UCO degradation), and the coded variables in the equations indicate the significant factors identified in Table 4 and Table 5.
Table 4. Analysis variance (ANOVA) for central composite data design (CCD) for UCO degradation response by B. vietnamiensis AQ5-12.
SourceSum of SquaresDFMean SquareF ValueProb > F
Model7537.239837.4728.49<0.0001Significant
A207.451207.457.060.0240
B366.171368.1712.520.0054
C215.681215.687.340.0220
A2872.601872.6029.680.0003
B23568.7013568.70121.40<0.0001
C2685.621686.6223.320.0007
AB2001200.006.800.0261
AC5121512.0017.420.0019
BC1568.0011568.0053.34<0.0001
Residual293.971029.40
Lack of Fit215.14543.032.730.1473Not significant
Pure Error78.83515.77
Cor Total7831.2019
R20.9626 Pred R20.7631
Adj R20.9287 Adeq Precision16.218
Note: A = temperature (°C); B = yeast extract concentration (g/L); and C = nitrogen source, (NH4)2SO4 (g/L).
Table 5. Analysis variance (ANOVA) for central composite data design.
SourceSum of SquaresDFMean SquareF ValueProb > F
Model23,033.97181279.6621.62<0.0001Significant
A—pH6.8116.810.120.7367
B—Used-oil concentration15,431.21115,431.21260.76<0.0001
C—Temperature66.63166.631.130.2968
D—Yeast concentration4.8114.810.0810.7775
E—Ammonium sulphate5.0115.010.0850.7731
A24.2514.250.0720.7906
B21262.5311262.5321.33<0.0001
C286.65186.651.460.2354
AB16.84116.840.280.5976
AC97.31197.311.640.2092
AD35.88135.880.610.4421
AE10.62110.620.180.6748
BC513.651513.658.680.0061
BD0.2810.284.702×1030.9458
BE1.7011.700.0290.8667
CD296.601296.605.010.0325
CE36.68136.680.620.4371
DE10.21110.210.170.6808
Residual1834.483159.18
Lack of Fit1679.372469.973.160.0609Not significant
Pure Error155.11722.16
Cor Total24,868.4549
R20.9262 Pred R20.7824
Adj R20.8834 Adeq Precision22.453
Note: A = pH; B = UCO concentration (%); C = temperature (°C); D = yeast extract concentration (g/L); and E = nitrogen source, (NH4)2SO4 (g/L).
The similarities between the predicted and actual analyses of the effects of the variables on the UCO degradation for both isolates are shown in Figure 9. The plots reveal a close correlation between the predicted and actual values since the data points accumulated closer to the line that bisected the plot at a 45° angle. Overall, the results indicate that the predicted values achieved from the quadratic model were in suitable agreement with the experimental values.
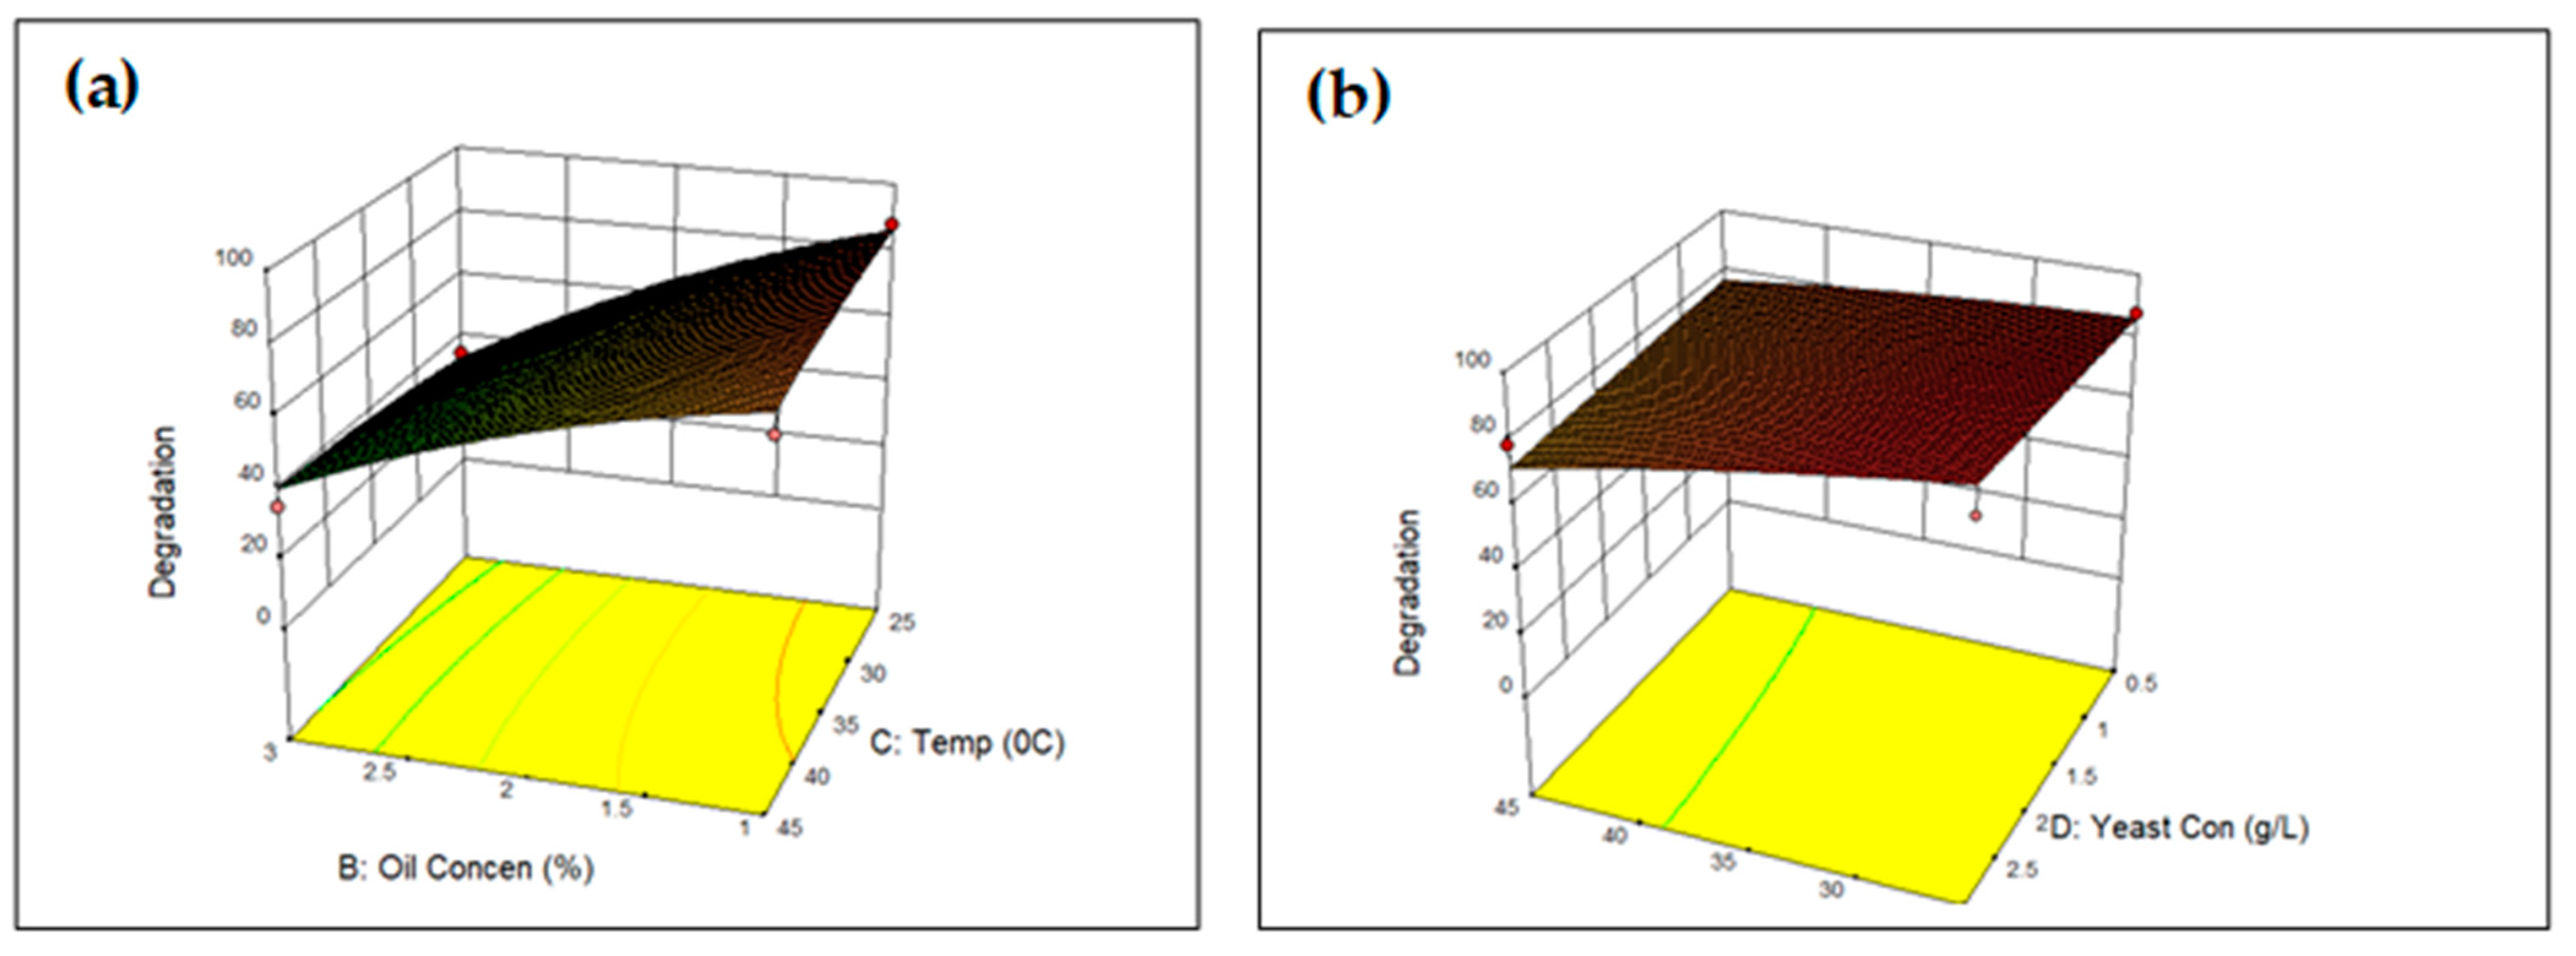
The 3D response surface was plotted to visualise the interaction effects of the variable pairs for both isolates (Figure 10 and Figure 11). The maximum degradation was predicted at the highest point in each 3D-surface plot. The model validation revealed no significant difference between the experimental and predicted values (p > 0.05). Figure 10a demonstrates the interaction between temperature X1 and yeast concentration X2 for B. vietnamiensis AQ5-12 while maintaining a constant ammonium sulphate concentration X3 at 0.55 g/L. The highest degradation efficiency (83.42%) was achieved at 25 °C with a 2.5 g/L yeast concentration from the contour plot. Figure 10b shows the interaction between temperature X1 and the ammonium sulphate concentration while maintaining a constant yeast concentration X3 at 1.75 g/L. The degradation was 81.24% at 25 °C with 0.9 g/L ammonium sulphate. Figure 10c shows the interaction between X1, the yeast concentration and X2 ammonium sulphate while keeping the temperature constant at 25 °C. In this case, the highest degradation (83.04%) was achieved with 0.2 g/L ammonium sulphate and a yeast concentration of 2.0 g/L.
The isolate Burkholderia sp. AQ5-13 in Figure 11a illustrates the interaction between the oil concentration X1 and temperature X2 while keeping a constant pH at 7.5, yeast concentration of 1.75 g/L and ammonium sulphate level at 0.55 g/L. The degradation efficiency achieved was 87.09% at 25 °C with a 1% UCO concentration. Finally, the Burkholderia sp. AQ5-13 isolate in Figure 11b shows the interaction between the temperature X1 and yeast concentration X2 while keeping the pH at 7.5, oil concentration at 2 g/L and ammonium sulphate at 0.55 g/L. The degradation efficiency achieved was 68.62% at 25 °C with a 2.5 g/L yeast concentration.

3.4. Validation of the Model

The model-validation experimental results revealed no significant difference between the experimental and the predicted values (Table 6). In the optimised condition, the predicted responses for the UCO degradation were 83.5% and 89.1%, while the experimental values were 89.1% and 90.1% for the AQ5-12 and AQ5-13 isolates, respectively. The results confirmed the validity of the model, and the experimental values were close to the predicted values.

4. Discussion

The frying process modifies the structure of cooking oil and increases its toxicity [19]. Many chemical reactions occur in the frying process, such a thermolysis, oxidation and hydrolysis [19,33]. Lipase-based enzyme activity has been proven to decrease the high cytotoxic hydrocarbon in oil degradation. The reaction is due to the lipase producing the microorganism degradation of oils and fats [34]. Lipases (EC 3.1.13 triglycerol acyl-hydrolases) enzyme are responsible for the catalysis and hydrolysis of water-insoluble triglycerides to di- and monoacylglycerides, free fatty acids, and glycerol. In emulsified esters, the highest catalytic activity of lipases occurs in the water/lipid interface [35]. The enzymes have high temperatures and solvent stability in addition to substrate affinity, allowing the breakdown of the transformation of many lipids [36]. Lipases are known to be stable in hydrophobic organic solvents. The bacterial enzyme activity increases with 10–50% (v/v) of short-chain alkanes, benzene and toluene [9,37]. Lipases behave differently depending on the kind of organic solvent, indicating different levels of resistance in different settings [33].
The genera indicated differences in their hydrocarbon-degrading abilities [38]. In addition, the metabolisation strength of the pollutants depends on abiotic factors such as pH, temperature, nitrogen source, inoculum size, oil concentration, and yeast extract. The bacteria are sensitive to these factors [39]. The process of optimisation using these parameters is imperative to obtain maximum UCO degradation. The physio-chemical changes in the UCO include a change in colour, odour, viscosity, and calorie count. The free-fatty-acid (FFA) content of UCO is very high compared to that of unused cooking oil. If the FFA in UCO is less than 15%, the colour becomes yellow grace; otherwise, it is known as brown grace (15–60% FFA by weight) and has much greater viscosity [1]. The difference might depend on the composition, state, and concentration of the oil or hydrocarbon. The increased number of saturated fatty acids in UCO compared to the unused oil indicates that the composition of steric and oleic compounds increases along with the decreasing number of linoleic and linolenic fatty acids in waste oil [33]. Chemicals with highly reduced carbon backbones, such as hydrogen-rich alkanes, are potentially suitable electron donors. In linear alkanes, the energy value can be expected to be considerably higher in comparison to that in branched alkanes [40] The net energetic gain from the digestion of oil is higher compared to proteins and carbohydrates. This explains why lipids are commonly used for energy storage in the majority of organisms. Adaptation occurs when microbes are exposed to hydrocarbons, and the hydrocarbon degradation rates increase. The process of adaptation is brought about by the selective enrichment of hydrocarbon-utilising microorganisms and the amplification of the pool of hydrocarbon-catabolising genes [40], as well as the use of hydrocarbons as energy sources. In this case, both isolates have the ability to degrade the pollutants depending on their ability to attack the pollutant and convert it into innocuous products [41].
The results from the qualitative and quantitative analysis demonstrated a decrease and increased in the fatty acid after the treatment with bacterial cultures. The gas chromatogram demonstrated 16 fatty acids in UCO, consisting of nine saturated fatty acids and seven unsaturated fatty acids. The increased and decreased levels of the fatty acids could have been due to the degradation and biosynthesis process of fatty acids, which occur simultaneously. The oxidation of long-chain fatty acids through β-oxidation forms increased levels of short-chain fatty acids. The reduction in long-chain fatty acids through β- oxidation transforms acyl-Co A into acetyl-Co A. The elevated levels of several long-chain unsaturated fatty acids are the result of the desaturation reaction of fatty acids. There were decreased levels of saturated fats, such as decanoic, myristic, pentadecanoic, palmitoleic, heptadecanoic, stearic, and pentacosanoic. In addition, unsaturated fatty acids, such as palmitoleic, oleic, and linolenic acid, were increased in level after treatment with bacterial isolates [42].
Microorganisms such as bacteria are known to acclimatise, and prolonged acclimatisation is a sustainable mechanism through which to increase the microbiome and enhance the degradation ability [43]. Understanding the optimum incubation period will generate optimum degradation, which is important for each bacterial performance. In this study, the optimum UCO degradation and bacterial growth were observed at 7 days of incubation. It was observed that the degradation steadily increased until the optimum UCO degradation on day 7. After the seventh day, there was a decrease in the degradation, which could be attributed to the utilisation of carbon sources and the accumulation of bacterial metabolic wastes, which could have hindered the growth and degradation. This was similar to the findings of the study of Acinetobacter sp. Ud-4 to degrade five types of edible oil [44]. Acinetobacter sp. Ud-4 was reported to degrade various edible oils within 7 days at 25 °C. In another related study, Burkholderia sp DW2-1 degraded salad oil within 7 days of cultivation [45] Microorganisms have different levels of tolerance to physical factors such as temperature, pH, and other environmental conditions. This is true of different microorganisms and of different species of the same genus. Both the isolates in this study performed as mesophilic bacteria that prefer moderate temperature ranges (20–45 °C). They thrive at these optimum temperatures and the enzyme–substrate reaction is specific [43]. In this study, both isolates showed optimal growth and their highest degradation at 40 °C. Temperatures of less than 25 °C did not support the degradation of the UCO compared to other corresponding degradations. Nonetheless, temperatures of more than 40 °C did not support the isolates. The reason for this could be enzyme inactivation [46]. Many studies have been conducted on oil degradation by mesophilic bacteria. The degradation of olive oil mill wastes by Bacillus sp. occurred at 40 °C [47]. In another study, Pseudomonas aeruginosa G23 and Aeromonas punctata G30 degraded fats, oil, and grease at 37 °C [48]. In studies of mesophilic bacteria, the optimum temperature ranged between 27 and 30 °C. In addition, Pseudomonas aeruginosa KM110 utilised olive oil as the substrate at an optimum temperature between 35 and 45 °C [49]. Single and mixed cultures of Acinetobacter sp. KUL8, Bacillus sp. KUL3 and Pseudomonas sp. KLB1 are mesophilic, as were the AQ5-12 and AQ5-13 isolates in this study [40].
Although the agitation speed is an important factor in increasing oxygen transfer and enhancing degradation [50], it is not widely studied. Some studies applied an agitation speed of 150–250 rpm for the degradation of hydrocarbon [14,40] For instance, Bhumibhamon et al. [39] used single and mixed cultures of Acinetobacter sp. KUL8, Bacillus sp. KUL3, and Pseudomonas sp. KLB1 to treat palm-oil- and bakery-industry wastewater at an agitation speed of 250 rpm.
A high concentration of hydrocarbon in an oil substrate exerts a toxic effect on microorganisms, causing the inhibition of biodegradation by nutrient or oxygen limitation [51]. Studies by Kamble et al. [52] and Matsumiya et al. [44] demonstrated an optimum degradation concentration at an initial 1% concentration [44,51]. Shon et al. [53] reported olive oil degradation by Pseudomonas sp. isolate D2D3 at initial concentrations of 0.1% to 5%, which was similar to the findings of this study.
The presence of a nitrogen (inorganic or organic) source in the medium influences the yield of the enzyme by the microorganisms. Microorganisms’ preference for nitrogen is attributed to the presence of minerals, vitamins or growth factors [54]. A higher nitrogen-source concentration inhibits enzyme production due to nitrogen’s metabolite repression [50]. A previous study indicated that ammonium sulphates are the preferred sources of nitrogen, providing the optimum degradation of UCO, similar to the findings in this study [24,55]. Manogaran et al. [23] also demonstrated similar findings for the Burkholderia vietnamiensis AQ5-12 and Burkholderia sp. AQ5-13 isolates in a molybdenum (Mo) reduction.
The initial pH is vital, as pH levels stimulate the growth of bacteria for the secretion of biocatalysts. It is suggested in the literature that the maximum lipase production by bacteria occurs at neutral or alkaline pH [50]. A bioremediation study in the field and in a laboratory demonstrated the optimal pH for bacterial growth of hydrocarbon range to be between 6.5 and 7.5 [56]. This was in line with the finding in this study that the optimal pH is 6.8, slightly acidic but close to neutral. Other studies report that the optimum pH for Pseudomonas G9 and G38 was found to be neutral in degrading shea-nut butter [57]. Similarly, Ren et al. [4] reported Klebsiella quasivariicola IUMR-B53 to degrade soybean oil at a neutral pH.
Yeast extract is a water-soluble portion of autolysed yeast containing vitamins, nitrogen, and amino acid, which promotes the degradation of hydrocarbon. In bioremediation, yeast extract co-oxidised hydrocarbon, which is a primary growth substance for microorganisms [58]. The results from this study revealed that the addition of yeast extract at a higher level promoted the biodegradation of oil, which was in agreement with the results of a study on the degradation of oil hydrocarbon by Bacillus cereus A, Bacillus cereus B, and Bacillus sp. ZD [58]. The marine bacterium Pseudomonas sp. sp48 degraded oil at an optimum concentration of 0.5 g/L [58].
An increased amount of bacteria loaded into the media positively affects the acclimatisation of cells and enhances oil degradation [59]. A smaller inoculum size indicates that low cell density might not replicate enough cells to initiate extensive biodegradation [60]. Recent studies indicated the ability of the inoculum size to initiate the growth of the microbial population [61]. A study used the same isolates, B. vietnamiensis AQ5-12 and Burkholderia sp. AQ5-13, at a 2% inoculum size, to reduce molybdenum [23]. In previous oil-degradation studies, an increase in the inoculum size by up to 6% increased the degradation. By contrast, an inoculum size of 4.18 mL % was the best for oil degradation [24,59]. Results similar to those of the current study were demonstrated by Ibrahim et al. [54], using waste canola oil, with an optimum degradation between 8% and 10%.
RSM is a well-established and important method used to increase production without increasing costs and to improve the action of the systems. The main disadvantage of this method is that it does not have cooperative properties between its variables; hence, it does not show the complete effect of the parameters in the procedure [62]. Several recent studies involving the RSM method have been successfully applied to optimise and study the degradation of various hydrocarbon pollutants using varied microorganisms [63,64,65]. In this RSM-optimised study, UCO degradation was boosted by the isolate AQ5-12 from 62%, through OFAT, to 83.04%; the isolate AQ5-13 indicated 53% degradation, through OFAT, to 87.09%. In the present study, an optimum degradation of 83.04% was achieved through RSM for the AQ5-12 isolate with 0.2 g/L ammonium sulphate and 2.0 g/L yeast extraction. Similarly, for AQ5-13, a UCO degradation of 87.09% was attained at 25 °C with a 1% UCO concentration, pH of 7.5, yeast concentration of 1.75 g/L and ammonium sulphate concentration of 0.55 g/L. These isolates can degrade oil by displaying positive results and aiding in oil bioremediation. AQ5-12 and AQ5-13 were isolated from glyphosate-contaminated sites in Malaysia using glyphosate as the phosphorus source [66]. In a previous study, the isolates simultaneously demonstrated the reduction of Mo and glyphosate degradation [23]. The optimum conditions through which Mo reduction greatly increases for isolates are temperatures of 30°C to 40 °C, pH 6.25–8 and ammonium sulphate as the nitrogen source.

5. Conclusions

In conclusion, the data obtained in this study confirmed that B. vietnamiensis AQ5-12 and Burkholderia sp. AQ5-13 isolates can effectively degrade UCO as the sole carbon source. The nutritional and physicochemical parameters influenced the performance of the UCO degradation. Optimising UCO degradation through statistical-experiment design is crucial to maintain an optimum UCO degradation for various contributing factors in bioremediation. Overall, this study compared the performances of B. vietnamiensis AQ5-12 and Burkholderia sp. AQ5-13 isolates in optimised conditions through OFAT and the central composite design (CCD) of RSM. These optimisation conditions demonstrated a higher degradation of UCO for both isolates. Thus, the potential of this bacterium to perform three functions suggests that both isolates are beneficial as bioremediation agents in sites contaminated with Mo, pesticides, and hydrocarbons.

Author Contributions

Conceptualisation, S.A.A., M.Y.S. and M.T.Y.; methodology, S.A.A. and M.T.Y.; software, M.S.A.; validation, S.A.A., M.T.Y. and M.S.A.; formal analysis, M.S.A.; investigation, M.S.A.; resources, S.A.A. and M.T.Y. data curation, M.S.A.; writing—original draft preparation, M.S.A.; writing—review and editing, S.A.A., M.Y.S. and M.T.Y.; supervision, S.A.A., M.Y.S. and M.T.Y.; project administration, S.A.A. and M.T.Y.; funding acquisition, S.A.A. and M.T.Y. All authors have read and agreed to the published version of the manuscript.

Funding

This research received no external funding.

Data Availability Statement

The data presented in this study are available on request from the corresponding author.

Acknowledgments

The authors would like to thank Universiti Putra Malaysia, Eco-Remediation Technology Laboratory and Bioremediation Biomonitoring and Ecotoxicology Laboratory for their support. The authors would additionally like to thank K.N.M Zahri and N.N Zakaria.

Conflicts of Interest

The authors declare no conflict of interest.

References

  1. Panadare, D.C.; Rathod, V.K. Applications of Waste Cooking Oil Other Than Biodiesel: A Review. IJCCE 2015, 12, 55–76. Available online: http://www.ijche.com/article_11253_54b41ee620eb7a8972ee3e37776dad5f.pdf (accessed on 19 April 2019).
  2. Williams, J.B.; Clarkson, C.; Mant, C.; Drinkwater, A.; May, E. Fat, oil and grease deposits in sewers : Characterisation of deposits and formation mechanisms. Water Res. 2012, 46, 6319–6328. [Google Scholar] [CrossRef] [PubMed]
  3. Phongjarus, N.; Suvaphat, C.; Srichai, N.; Ritchie, R.J. Photoheterotrophy of photosynthetic bacteria (Rhodopseudomonas palustris) growing on oil palm and soybean cooking oils. Environ. Technol. Innov. 2018, 10, 290–304. [Google Scholar] [CrossRef]
  4. Ren, J.B.; Fan, H.; Niu, D.; Gu, Y.; Li, C. Biodegradation of Waste Cooking Oils by Klebsiella quasivariicola IUMR-B53 and Characteristics of Its Oil-Degrading Enzyme. Waste Biomass Valori. 2021, 12, 1243–1252. [Google Scholar] [CrossRef]
  5. Luo, Q.; Liu, Z.H.; Yin, H.; Dang, Z.; Wu, P.X.; Zhu, N.W.; Lin, Z.; Liu, Y. Global review of phthalates in edible oil: An emerging and nonnegligible exposure source to human. Sci. Total Environ. 2020, 704, 135369. [Google Scholar] [CrossRef] [PubMed]
  6. Ahmad, T.; Belwal, T.; Li, L.; Ramola, S.; Aadil, R.M.; Abdullah; Xu, Y.; Zisheng, L. Utilization of wastewater from edible oil industry, turning waste into valuable products: A review. Trends Food. Sci. Technol. 2020, 99, 21–33. [Google Scholar] [CrossRef]
  7. Food and Agriculture Organisation of the United Nations. “Chapter 6 : Selected Uses of Fats and Oils in Food,” Fats and Oils in Human Nutrition. 1994. Available online: https://www.fao.org/3/v4700e/V4700E0b.htm#Chapter%206%20:%20Selected%20uses%20of%20fats%20and%20oils%20in%20food (accessed on 15 March 2019).
  8. Choe, E.; Min, D.B. Chemistry of deep-fat frying oils. J. Food Sci. 2007, 72, 77–80. [Google Scholar] [CrossRef]
  9. Mannu, A.; Garroni, S.; Ibanez Porras, J.; Mele, A. Available technologies and materials for waste cooking oil recycling. Processes 2020, 8, 366. [Google Scholar] [CrossRef] [Green Version]
  10. Hazrat, M.A.; Rasul, M.G.; Khan, M.M.K.; Ashwath, N.; Rufford, T.E. Emission characteristics of waste tallow and waste cooking oil based termary biodiesel fuels. Energy Procedia 2019, 160, 842–847. [Google Scholar] [CrossRef]
  11. Ananey-Obiri, D.; Matthews, L.; Azahrani, M.H.; Ibrahim, S.A.; Galanakis, C.M.; Tahergorabi, R. Application of protein-based edible coatings for fat uptake reduction in deep-fat fried foods with an emphasis on muscle food proteins. Trends Food Sci. Technol. 2018, 80, 167–174. [Google Scholar] [CrossRef]
  12. Joshi, R.; Sharma, R.; Kuila, A. Lipase production from Fusarium incarnatum KU377454 and its immobilization using Fe3O4 NPs for application in waste cooking oil degradation. Bioresour. Technol. Rep. 2019, 5, 134–140. [Google Scholar] [CrossRef]
  13. Zahri, K.N.M.; Zulkharnain, A.; Claudio, G.; Sabri, S.; Khalil, K.A.; Convey, P.; Ahmad, S.A. The use of response surface methodology as a statistical tool for the optimisation of waste and pure canola oil biodegradation by antarctic soil bacteria. Life 2021, 11, 456. [Google Scholar] [CrossRef]
  14. Čipinytė, V.; Grigiškis, S.; Baškys, E. Selection of fat-degrading microorganisms for the treatment of lipid-contaminated environment. Biologija 2009, 55, 84–92. [Google Scholar] [CrossRef] [Green Version]
  15. Rahman, K.S.M.; Rahman, J.T.; Lakshmanaperualsamy, P.; Banat, I. Towards efficient crude oil degradation by a mixed bacterial consortium. Bioresour. Technol. 2002, 85, 257–261. [Google Scholar] [CrossRef] [Green Version]
  16. Zahri, K.N.M.; Zulkharnain, A.; Sabri, S.; Gomez-fuentes, C.; Ahmad, S.A. Research trends of biodegradation of cooking oil in Antarctica from 2001 to 2021: A bibliometric analysis based on the scopus database. Int. J. Environ. Res. Public Health 2021, 18, 2050. [Google Scholar] [CrossRef] [PubMed]
  17. Brooksbank, A.; Latchford, J.; Mudge, S. Degradation and modification of fats, oils and grease by commercial microbial supplements degradation and modification of fats, oils and grease by commercial microbial supplements. World. J. Microbiol. Biotechnol. 2007, 23, 977–985. [Google Scholar] [CrossRef]
  18. Huang, L.; Ma, T.; Li, D.; Liang, F.; Liu, R.L.; Li, G. Optimization of nutrient component for diesel oil degradation by Rhodococcus erythropolis. Mar. Pollut. Bull. 2008, 56, 1714–1718. [Google Scholar] [CrossRef] [PubMed]
  19. Okino-Delgado, C.H.; Prado, D.Z.; do Facanali, R.; Fernandes, C.; Zambuzzi, W.F.; Fleuri, L.F. Bioremediation of cooking oil waste using lipases from wastes. PLoS ONE 2017, 12, e0186246. [Google Scholar] [CrossRef] [PubMed] [Green Version]
  20. Sadhukhan, B.; Mondal, N.K.; Chattoraj, S. Optimisation using central composite design (CCD) and the desirability function for sorption of methylene blue from aqueous solution onto Lemna major. Karbala Int. J. Mod. 2016, 2, 145–155. [Google Scholar] [CrossRef] [Green Version]
  21. Sihag, S.; Pathak, H. Biodegradation of 2T engine oil using soil microbe and gravimetric analysis. IJSER 2006, 7, 1286–1295. Available online: www.pelagiaresearchlibrary.com (accessed on 20 April 2019).
  22. Morya, R.; Salvachúa, D.; Thakur, I.S. Burkholderia: An Untapped but Promising Bacterial Genus for the, Conversion of Aromatic Compounds. Trends Biotechnol. 2020, 38, 963–975. [Google Scholar] [CrossRef] [PubMed]
  23. Manogaran, M.; Ahmad, S.A.; Yasid, N.A.; Yakasai, H.M.; Shukor, M.Y.S. Characterisation of the simultaneous molybdenum reduction and glyphosate degradation by Burkholderia vietnamiensis AQ5—12 and Burkholderia sp. AQ5—13. 3 Biotech 2018, 8, 117. [Google Scholar] [CrossRef] [PubMed]
  24. Nagarajan, J.; Nawawi, N.M.; Ibrahim, A.L. Rhodococcus UKMP-5M, an endogenous lipase producing actinomycete from Peninsular Malaysia. Biologia 2014, 69, 123–132. [Google Scholar] [CrossRef]
  25. Patowary, K.; Patowary, R.; Kalita, M.C.; Deka, S. Characterization of biosurfactant produced during degradation of hydrocarbons using crude oil as sole source of carbon. Front. Microbiol. 2017, 8, 279. [Google Scholar] [CrossRef] [Green Version]
  26. Bashir, M.J.K.; Aziz, H.A.; Aziz, S.Q.; Amr, S.A. An overview of wastewater treatment processes optimization using response surface methodology (RSM). In Proceedings of the 4th International Engineering Conference (IEC4), Gaza, Palestine, 15–16 October 2012; Available online: https://www.researchgate.net/profile/Shuokr-Qarani-Aziz/publication/234840337_An_Overview_of_Wastewater_Treatment_Processes_Optimization_Using_Response_Surface_Methodology_RSM/links/61280bfd2b40ec7d8bc8477c/An-Overview-of-Wastewater-Treatment-Processes-Optimization-Using-Response-Surface-Methodology-RSM.pdf (accessed on 26 September 2019).
  27. Roslee, A.F.A.; Gomez-Fuentes, C.; Zakaria, N.N.; Shaharuddin, N.A.; Zulkharnain, A.; Khalil, K.A.; Convey, P.; Ahmad, S.A. Growth optimisation and kinetic profiling of diesel biodegradation by a cold-adapted microbial consortium isolated from trinity peninsula, antarctica. Biology 2021, 10, 493. [Google Scholar] [CrossRef]
  28. Sanusu, S.N.A.; Halmi, M.I.E.; Abdullah, S.R.S.; Hassan, H.A.; Hamzah, F.M.; Idris, M. Comparative process optimization of pilot-scale total petroleum hydrocarbon (TPH) degradation by Paspalum scrobiculatum L. Hack using response surface methodology (RSM) and artificial neural networks (ANNs). Ecol. Eng. 2016, 97, 524–534. [Google Scholar] [CrossRef]
  29. Tong, S.; Chen, N.; Wang, H.; Liu, H.; Tao, C.; Feng, C.; Zhang, B.; Hao, C.; Pu, J.; Zhao, J. Bioresource Technology Optimization of C/N and current density in a heterotrophic/biofilm-electrode autotrophic denitrification reactor (HAD-BER). Bioresour. Technol. 2014, 171, 389–395. [Google Scholar] [CrossRef]
  30. Kanmani, P.; Karthik, S.; Aravind, J.; Kumaresan, K. The use of response surface methodology as a statistical tool for media optimization in lipase production from the dairy rffluent isolate Fusarium Solani. Int. Sch. Res. Not. 2013, 2013, 528708. [Google Scholar] [CrossRef] [Green Version]
  31. Reddy, L.V.A.; Wee, Y.; Yun, J.; Ryu, H. Optimization of alkaline protease production by batch culture of Bacillus sp. RKY3 through Plackett—Burman and response surface methodological approaches. Bioresour. Technol. 2008, 99, 2242–2249. [Google Scholar] [CrossRef]
  32. Manogaran, M.; Shukor, M.Y.; Yasid, N.A.; Ahmad, S.A. Optimisation of culture composition for glyphosate degradation by Burkholderia vietnamiensis strain AQ5-12. 3 Biotech 2008, 8, 108. [Google Scholar] [CrossRef]
  33. Karigar, C.; Rao, S. Role of microbial enzymes in the bioremediation of pollutants : A review. Enzym. Res. 2011, 1, 805187. [Google Scholar] [CrossRef] [PubMed] [Green Version]
  34. Chandra, P.; Singh, R.; Arora, P.K. Microbial lipases and their industrial applications : A comprehensive review. Microb. Cell. Fact. 2020, 19, 169. [Google Scholar] [CrossRef]
  35. Lam, M.K.; Lee, K.T.; Mohamed, A.R. Homogeneous, heterogeneous and enzymatic catalysis for transesteri fi cation of high free fatty acid oil (waste cooking oil) to biodiesel : A review. Biotechno. Adv. 2020, 28, 500–518. [Google Scholar] [CrossRef] [PubMed]
  36. Ławniczak, Ł.; Wo, M.; Heipieper, H.J. Microbial degradation of hydrocarbons—basic principles for bioremediation : A review. Molecules 2020, 25, 856. [Google Scholar] [CrossRef] [PubMed] [Green Version]
  37. Kataria, J.; Mohapatra, S.K.; Kundu, K. Biodiesel production from waste cooking oil using heterogeneous catalysts and its operational characteristics on variable compression ratio CI engine. J. Energy Inst. 2019, 92, 275–287. [Google Scholar] [CrossRef]
  38. Saha, S.; Jeon, B.H.; Kurade, M.B.; Chatterjee, P.K.; Chang, S.W.; Markkandan, K.; Salama, E.S.; Govindwar, S.P.; Roh, H.S. Microbial acclimatization to lipidic-waste facilitates the efficacy of acidogenic fermentation. Chem. Eng. J. 2019, 358, 188–196. [Google Scholar] [CrossRef]
  39. Moxley, E.; Puerta-Fernández, E.; Gómez, E.J.; Gonzalez, J.M. Influence of Abiotic Factors Temperature and Water Content on Bacterial 2-Chlorophenol Biodegradation in Soils. Front. Environ. Sci. 2019, 7, 1–5. [Google Scholar] [CrossRef] [Green Version]
  40. Bhumibhamon, O.; Koprasertsak, A.; Funthong, S. Biotreatment of High Fat and Oil Wastewater by Lipase Producing Microorganisms. Kasetsart 2002, 36, 261–267. [Google Scholar]
  41. Mannu, A.; Ferro, M.; Di Pietro, M.E.; Mele, A. Innovative applications of waste cooking oil as raw material. Sci. Prog. 2019, 102, 153–160. [Google Scholar] [CrossRef]
  42. Rikmawati, N.A.; Mangunwardoyo, W.; Hanies, A. The use of single and mixed cultures of bacillus cereus InaCC B284 and Pseudomonas aeruginosa InaCC B290 to degrade used-cooking oil measurement of bacterial growth. In Proceedings of the 8th Annual Basic Science International Conference, Malang, Indonesia, 6–7 March 2018; pp. 1–5. [Google Scholar]
  43. Bharti, V.; Gupta, B.; Kaur, J. Novel bacterial strains Pseudomonas sp. And Bacillus sp. isolated from petroleum oil contaminated soils for degradation of flourene and phenanthrene. Pollution 2019, 5, 657–669. [Google Scholar] [CrossRef]
  44. Tanaka, D.; Takashima, M.; Mizuta, A.; Tanaka, S.; Sakatoku, A.; Nishikawa, A.; Osawa, T.; Noguchi, M.; Aizawa, S.-I.; Nakamura, S. Acinetobacter sp. Ud-4 Efficiently Degrades Both Edible and Mineral Oils : Isolation and Characterization. Curr. Microbiol. 2010, 60, 203–209. [Google Scholar] [CrossRef] [PubMed]
  45. Matsumiya, Y.; Wakita, D.; Kimura, A.; Sanpa, S.; Kubo, M. Isolation and characterization of a lipid-degrading bacterium and its application to lipid-containing wastewater treatment. J. Biosci. Bioeng. 2007, 103, 325–330. [Google Scholar] [CrossRef] [PubMed]
  46. Ibrahim, M.; Makky, E.; Azmi, N.; Ismail, J. Optimisation parameter for Mycobacteria confluentis biodegradation of PAHs. Matec Web Conf. 2018, 150, 06035. [Google Scholar] [CrossRef]
  47. Galaction, A.; Ca, D.; Rotaru, R. Kinetic studies on biodegradation of lipids from olive oil mill wastewaters with free and immobilised Bacillus sp. Sci. Study Res. Chem. Chem. Eng. 2012, 13, 49–62. [Google Scholar]
  48. Serikovna, S.Z.; Serikovich, K.S.; Sakenovna, A.S.; Murzakhmetovich, S.; Khamitovich, A.K. Screening of lipid degrading microorganism for wastewater treatment. Malays. J. Microbiol. 2013, 9, 219–226. [Google Scholar] [CrossRef] [Green Version]
  49. Mobarak-Qamsari, E.; Kasra-Kermanshahi, R.; Moosavi-nejad, Z. Isolation and identification of a novel, lipase-producing bacterium, Pseudomnas aeruginosa KM110. Iran. J. Microbiol. 2011, 3, 92–98. [Google Scholar]
  50. Adetunji, A.I. Production strategies and biotechnological relevance of microbial lipases : A review. Braz. J. Microbiol. 2021, 52, 1257–1269. [Google Scholar] [CrossRef]
  51. Leahy, J.G.; Colwell, R.R. Microbial degradation of hydrocarbons in the environment. Microbiol. Rev. 1990, 54, 305–315. [Google Scholar] [CrossRef]
  52. Kamble, P.; Raut, A.; Gandhi, M. Isolation and characterization of vegetable oil degrading bacteria. J. Pure. Appl. Microbiol. 2011, 5, 887–990. [Google Scholar]
  53. Shon, H.K.; Tian, D.; Kwon, D.-Y.; Jin, C.; Lee, T.; Chung, W.J. Degradation of Fat, Oil, and Grease (FOGs) by Lipase-Producing Bacterium Pseudomonas sp. Strain D2D3. J. Microbiol. Biotechnol. 2002, 12, 583–591. [Google Scholar]
  54. Ganapathy, B.; Yahya, A.; Ibrahim, N. Bioremediation of palm oil mill effluent (POME) using indigenous Meyerozyma guilliermondii. Environ. Sci. Pollut. Res. 2012, 26, 11113–11125. [Google Scholar] [CrossRef] [PubMed]
  55. Ibrahim, S.; Zahri, K.N.M.; Convey, P.; Khalil, K.A.; Gomez-Fuentes, C.; Zulkarnain, A.; Alias, S.A.; González-Rocha, G.; Ahmad, S.A. Optimisation of biodegradation conditions for waste canola oil by cold-adapted Rhodococcus sp. AQ5-07 from Antarctica. Electron. J. Biotechnol. 2020, 48, 1–12. [Google Scholar] [CrossRef]
  56. Ajoku, G.A.; Oduola, M.K. Kinetic model of pH effect on bioremediation of crude petroleum kinetic model of pH effect on bioremediation of crude petroleum contaminated soil. 1. model development. Am. J. Chem. Eng. 2013, 1, 6–10. [Google Scholar] [CrossRef] [Green Version]
  57. Danikuu, F.M.; Sowley, E.N.K. Biodegradation of shea nut cake by indigenous soil bacteria. J. Medical. Biomedical. Sci. 2014, 3, 9–15. [Google Scholar] [CrossRef]
  58. Maliji, D.; Olama, Z.; Holail, H. Environmental studies on the microbial degradation of oil hydrocarbons and its application in Lebanese oil polluted coastal and marine ecosystem. Int. J. Curr. Microbiol. Appl. Sci. 2013, 2, 1–18. [Google Scholar]
  59. Farag, S.; Soliman, N.A.; Abdel-fattah, Y.R. Statistical optimization of crude oil bio-degradation by a local marine bacterium isolate Pseudomonas sp. sp48. J. Genet. Biotechnol. 2018, 16, 409–420. [Google Scholar] [CrossRef]
  60. Ramadan, M.A.; El-tayeb, O.M.; Alexander, M. Inoculum size as a factor limiting success of inoculation for biodegradation. Appl. Environ. Microbiol. 1990, 56, 1392–1396. [Google Scholar] [CrossRef] [Green Version]
  61. Koutsoumanis, K.P.; Sofos, J.N. Effect of inoculum size on the combined temperature, pH and aw limits for growth of Listeria monocytogenes. Int. J. Food Microbiol. 2005, 104, 83–91. [Google Scholar] [CrossRef]
  62. Patel, G.B.; Shah, K.R.; Shindhal, T.; Rakholiya, P.; Varjani, S. Process parameter studies by central composite design of response surface methodology for lipase activity of newly obtained Actinomycete. Environ. Technol. Innov. 2021, 23, 101724. [Google Scholar] [CrossRef]
  63. Abdulrasheed, M.; Zulkharnain, A.; Zakaria, N.N.; Ahmad Roslee, A.F.; Khalil, K.A.; Napis, S.; Convey, P.; Gomez-Fuentes, C.; Ahmad, S.A. Response surface methodology optimization and kinetics of diesel degradation by a cold-adapted antarctic bacterium, Arthrobacter sp. strain AQ5-05. Sustainability 2020, 12, 6966. [Google Scholar] [CrossRef]
  64. Roslee, A.F.A.; Zakaria, N.N.; Convey, P.; Zulkharnain, A.; Lee, G.L.Y.; Gomez-Fuentes, C.; Ahmad, S.A. Statistical optimisation of growth conditions and diesel degradation by the Antarctic bacterium, Rhodococcus sp. strain AQ5-07. Extremophiles 2020, 24, 277–291. [Google Scholar] [CrossRef] [PubMed]
  65. Zakaria, N.N.; Gomez-fuentes, C.; Khalil, K.A.; Convey, P.; Fareez, A.; Roslee, A.; Zulkharnain, A.; Sabri, S.; Shaharuddin, N.A.; Leyla, C.; et al. Statistical Optimisation of Diesel Biodegradation at Low Temperatures by an Antarctic Marine Bacterial Consortium Isolated from Non-Contaminated Seawater. Microorganisms 2021, 9, 121. [Google Scholar] [CrossRef] [PubMed]
  66. Manogaran, M.; Yunus, M.; Nur, S.; Yasid, A. Isolation and characterisation of glyphosate-degrading bacteria isolated from local soils in Malaysia. Rend. Lincei 2017, 28, 471–479. [Google Scholar] [CrossRef]
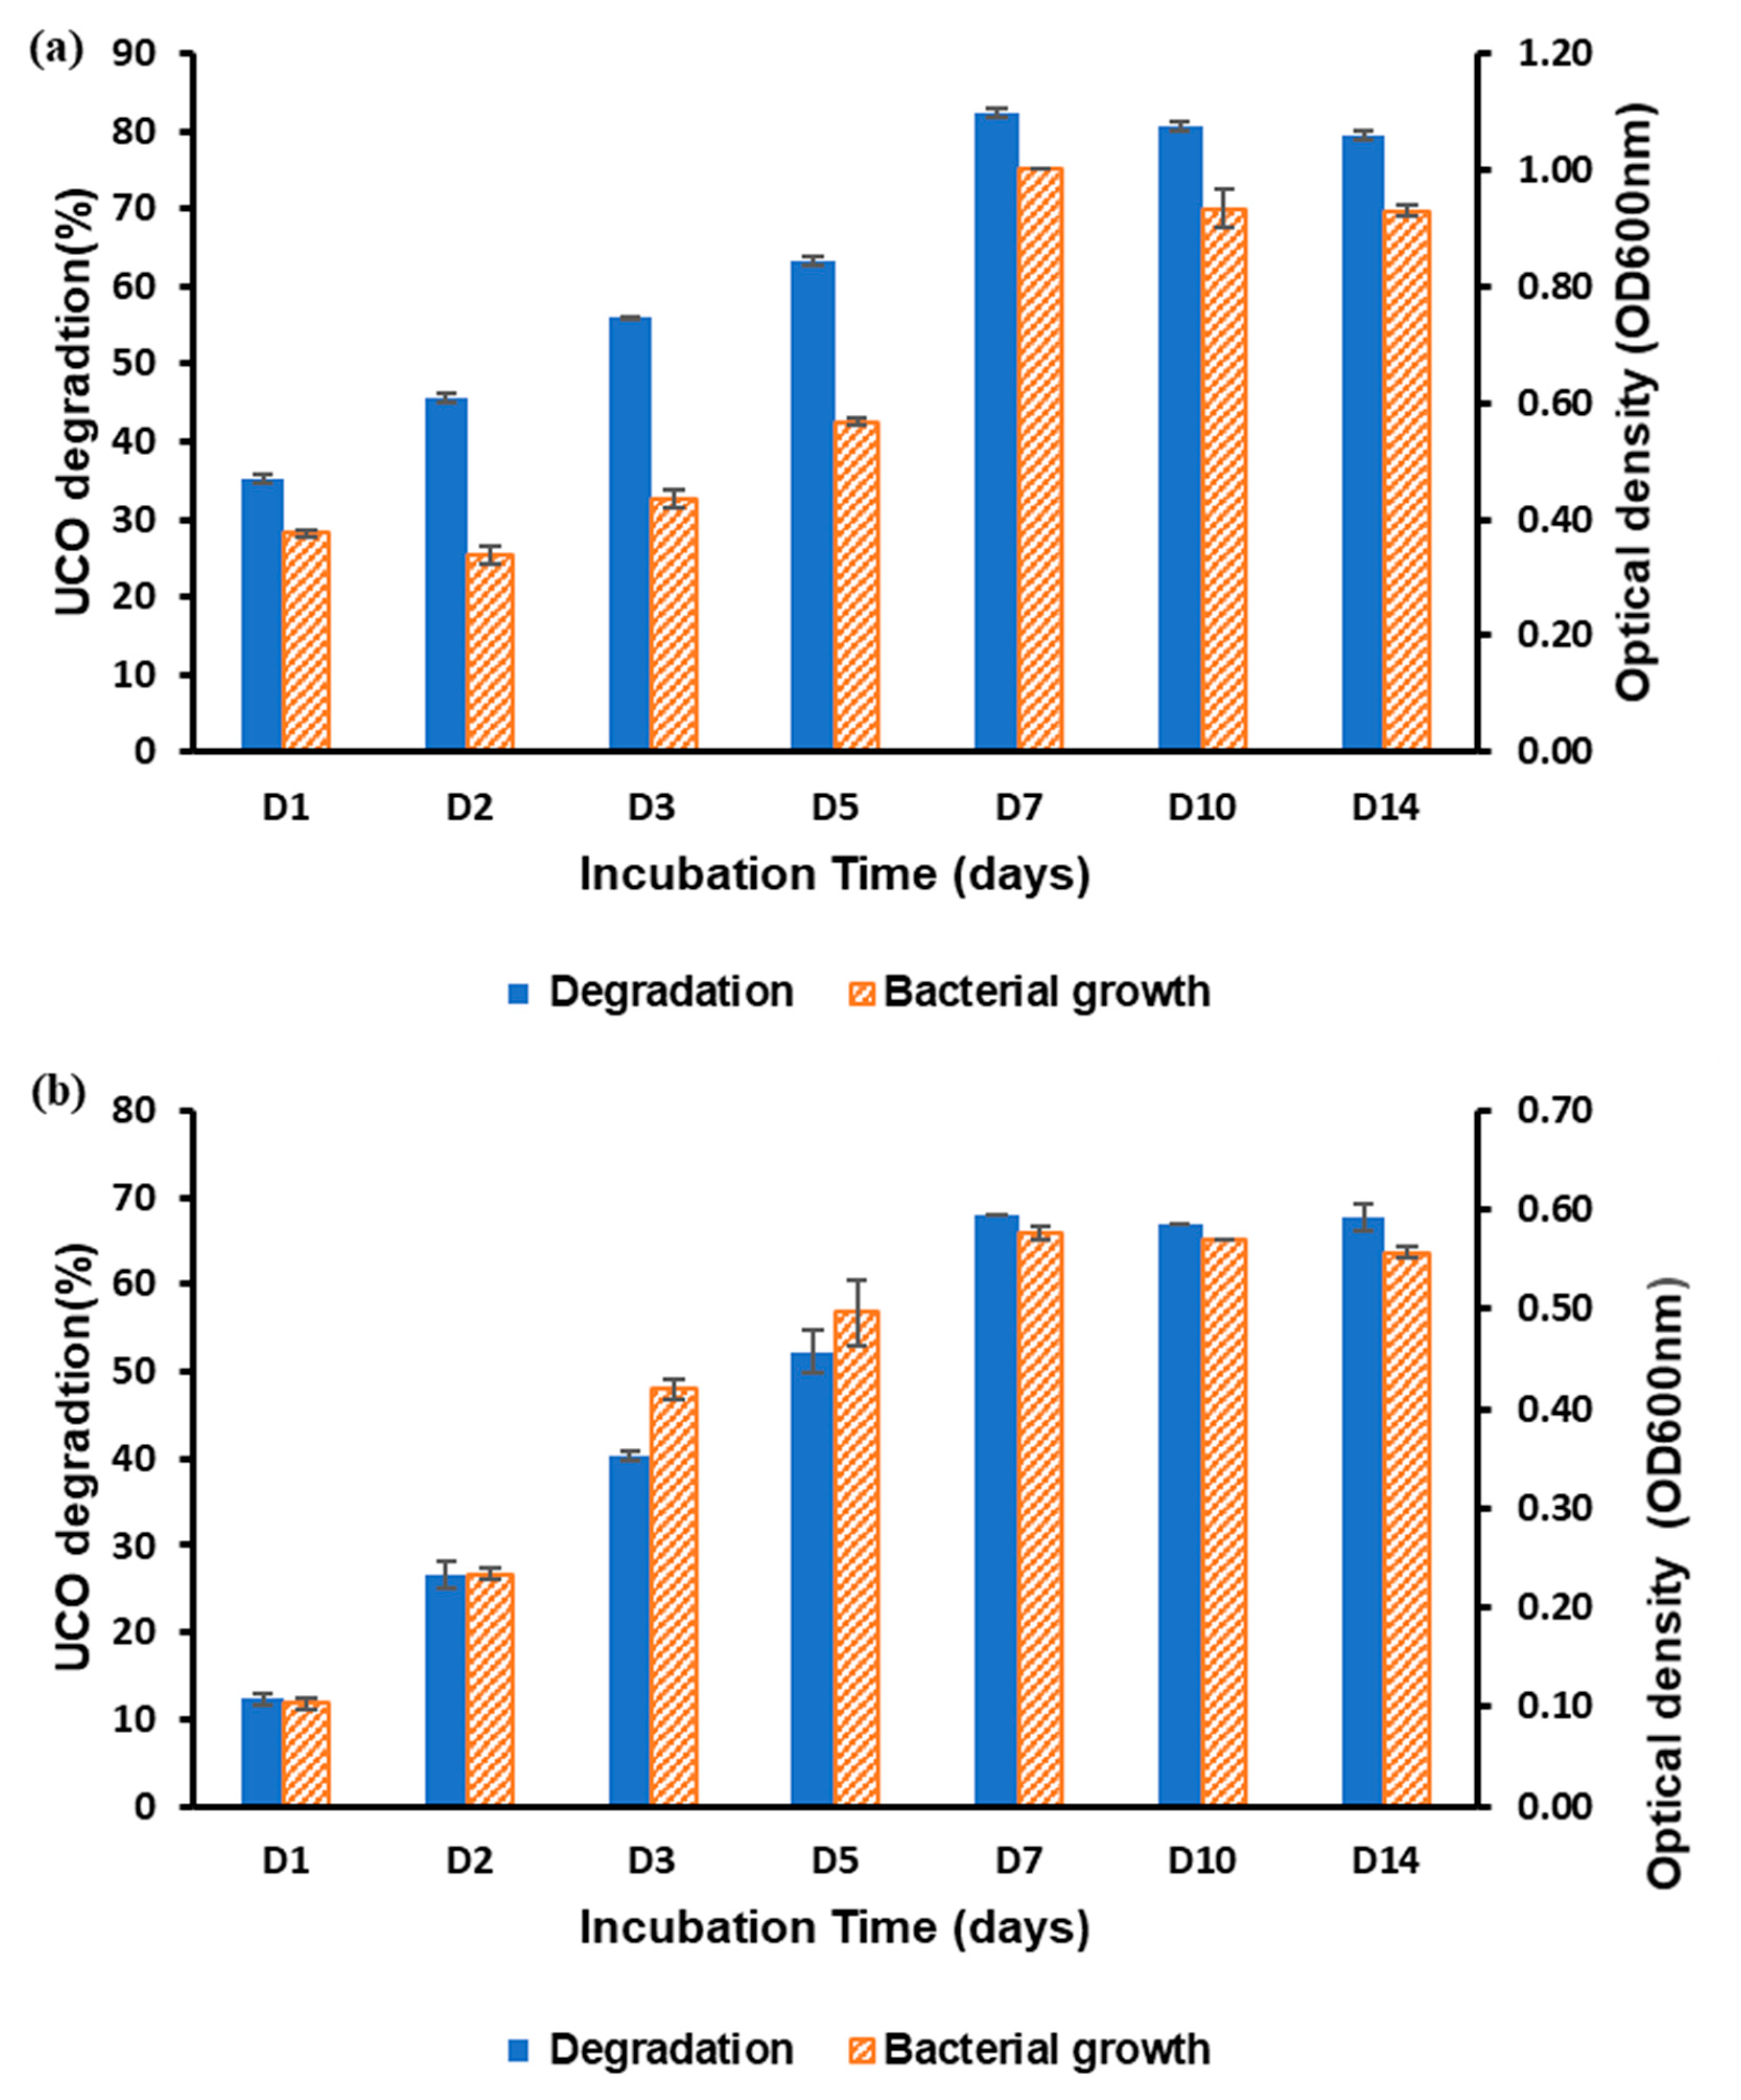
Figure 1. The percentage of bacterial growth and UCO degradation for 14 days of incubation for (a) B. vietnamiensis AQ5-12 and (b) Burkholderia sp. AQ5-13. The bacterium was cultured in MSM medium supplemented with 1% UCO containing 0.1 g/L yeast extract, 1.0 g/L (NH4)2SO4, pH 7, and incubated in an orbital shaker at 150 rpm and 25 °C. Error bars represent the mean ± standard deviation for the triplicates.
Processes 10 02178 g001
Figure 2. The effects of temperature on bacterial growth and UCO degradation for (a) B. vietnamiensis AQ5-12 and (b) Burkholderia sp. AQ5-13. The bacterium was cultured in MSM medium supplemented with 1% UCO containing 0.1 g/L yeast extract, 1.0 g/L (NH4)2SO4, pH 7, and incubated in an orbital shaker at 150 rpm. Samples were analysed after 7 d of incubation. Error bars represent the mean ± standard deviation for the triplicates.
Processes 10 02178 g002
Figure 3. The effect of agitation speed on bacterial growth and UCO degradation for (a) B. vietnamiensis AQ5-12 and (b) Burkholderia sp. AQ5-13. The bacterium was cultured in MSM medium supplemented with 1% UCO containing 0.1 g/L yeast extract, 1.0 g/L (NH4)2SO4, pH 7, and incubated at 35 °C. Samples were analysed after 7 d of incubation. Error bars represent the mean ± standard deviation for the triplicates.
Processes 10 02178 g003
Figure 4. The effects of substrate-oil concentration on bacterial growth and UCO degradation for (a) B. vietnamiensis AQ5-12 (b) and Burkholderia sp. AQ5-13. The bacterium was cultured in MSM medium containing 0.1 g/L yeast extract, 1.0 g/L (NH4)2SO4, pH 7, incubated in an orbital shaker at 150 rpm (for AQ5-12) and 250 rpm (for AQ5-13) at 35 °C. Samples were analysed after 7 d of incubation. Error bars represent the mean ± standard deviation for the triplicates.
Processes 10 02178 g004
Figure 5. The effects of various nitrogen sources on bacterial growth and UCO degradation for (a) B. vietnamiensis AQ5-12 and (b) Burkholderia sp. AQ5-13. The bacterium was cultured in MSM medium supplemented with 3% UCO containing 0.1 g/L yeast extract, 1.0 g/L nitrogen source, pH 7, incubated in an orbital shaker at 150 rpm (for AQ5-12) and 250 rpm (for AQ5-13) at 35 °C. Samples were analysed after 7 d of incubation. Error bars represent the mean ± standard deviation for the triplicates.
Processes 10 02178 g005
Figure 6. The effects of pH on bacterial growth and UCO degradation for (a) B. vietnamiensis AQ5-12 and (b) Burkholderia sp. AQ5-13. The bacterium was cultured in MSM medium supplemented with 3% UCO containing 00.1 g/L yeast extract, 1.0 g/L (NH4)2SO4, incubated in an orbital shaker at 150 rpm (for AQ5-12) and 250 rpm (for AQ5-13) at 35 °C. Samples were analysed after 7 d of incubation. Error bars represent the mean ± standard deviation for the triplicates.
Processes 10 02178 g006
Figure 7. The effects of yeast extract concentration (g/L) on bacterial growth and UCO degradation for (a) B. vietnamiensis AQ5-12 and (b) Burkholderia sp. AQ5-13. The bacterium was cultured in MSM medium supplemented with 3% UCO containing 1.0 g/L (NH4)2SO4, pH 6.8, incubated in an orbital shaker at 150 rpm (for AQ5-12) and 250 rpm (for AQ5-13) at 35 °C. Samples were analysed after 7 d of incubation. Error bars represent the mean ± standard deviation for the triplicates.
Processes 10 02178 g007
Figure 8. The effects of inoculum size on bacterial growth and UCO degradation for (a) B. vietnamiensis AQ5-12 (b) Burkholderia sp. AQ5-13. The bacterium was cultured in MSM medium supplemented with 3% UCO containing 0.4 g/L yeast extract, 1.0 g/L (NH4)2SO4, pH 6.8, incubated in an orbital shaker at 150 rpm (for AQ5-12) and 250 rpm (for AQ5-13) at 35 °C. Samples were analysed after 7 d of incubation. Error bars represent the mean ± standard deviation for the triplicates.
Processes 10 02178 g008
Figure 9. Similarity plot between predicted and actual values of UCO degradation for (a) B. vietnamiensis AQ5-12 and (b) Burkholderia sp. AQ5-13.
Processes 10 02178 g009
Figure 10. Three-dimensional response-surface plot showing interaction effect between significant factors. Degradation by isolate B. vietnamiensis AQ5-12 showing variable interaction of (a) temperature and yeast concentration, (b) ammonium sulphate and temperature and (c) ammonium sulphate and yeast concentration.
Processes 10 02178 g010
Figure 11. Three-dimensional response-surface plot showing interaction effect between significant parameters. Degradation by isolate Burkholderia sp. AQ5-13 shows the interaction of (a) temperature and oil concentration and (b) yeast concentration and temperature.
Processes 10 02178 g011
Table 1. The ranges and levels of independent variables for response-surface methodological experiment.
ParameterUnitExperimental Values
Low (−1)Centre (0)High (+1)
pH-6.007.008.00
Oil%(v/v)1.002.003.00
TemperatureC25.030.035.0
Yeast extractg/L0.501.753.00
Ammonium sulphateg/L0.100.551.00
Table 2. Analysis of variance (ANOVA) for UCO degradation from PBD for B. vietnamiensis AQ5.
SourceSum of SquaresDFMean SquareF ValueProb > F
Model2483.1610248.32578.790.0323Significant
A22.20122.2051.740.0879
B6.6316.6315.460.1585
C124.881124.88291.080.0373
D489.751489.751141.550.0188
E159.621159.62372.050.0330
AC17.27117.2740.260.0995
AE80.27180.54187.740.0464
BE4.7714.7711.110.1855
CD 286.151286.15666.970.0246
CE4.7114.7110.970.1867
Residual0.4310.43
Cor Total2483.5911
R20.9998 Pred R2N/A
Adj R20.9981 Adeq Precision62.712
Note: A= pH; B = UCO concentration (%); C = temperature (°C); D = yeast extract (g/L); and E = nitrogen source, (NH4)2SO4 (g/L).
Table 3. Analysis of variance (ANOVA) for degradation from PBD for Burkholderia sp. AQ5-13.
SourceSum of SquaresDFMean SquareF ValueProb > F
Model1438.5210143.85533.740.0055Significant
A -9.6319.681339.670.0174
B -92.95192.9512,865.200.0056
C -12.92112.921788.090.0151
D –23.41123.413240.300.0112
E –92.75192.7512,837.620.0056
AB1.1111.11153.950.0512
BC77.13177.1310,676.000.0062
BD22.82122.823159.160.0113
BE6.2716.27867.270.0216
CE107.591107.5914,891.320.0052
Residual7.225 × 10−0.3310.33
Cor Total1438.5311
R21.0000 Pred R2N/A
Adj R20.9999 Adeq Precision440.273
Note: A = pH; B = UCO concentration (%); C = temperature (°C); D = yeast extract (g/L); and E = nitrogen source, (NH4)2SO4 (g/L).
Table 6. Validation of predicted response-surface model.
Name of IsolatesDegradation (%)p-ValueEfficiency (%)
Expected ValueActual Value
B. vietnamiensis AQ5-1283.585.20.06898.0
Burkholderia sp. AQ5-1389.190.10.06598.89
Publisher’s Note: MDPI stays neutral with regard to jurisdictional claims in published maps and institutional affiliations.