Article

Effect of Surface Modification by Oxygen-Enriched Chemicals on the Surface Properties of Pine Bark Biochars

1
Department of Biological and Agricultural Engineering, North Carolina State University, 3100 Faucette Drive, Raleigh, NC 27695, USA
2
Department of Biological Sciences, North Carolina State University, 112 Derieux Place, Raleigh, NC 27695, USA
*
Authors to whom correspondence should be addressed.
Processes 2022, 10(10), 2136; https://doi.org/10.3390/pr10102136
Submission received: 8 October 2022 / Revised: 15 October 2022 / Accepted: 17 October 2022 / Published: 20 October 2022

Abstract

:
Sustainable waste utilization techniques are needed to combat the environmental and economic challenges faced worldwide due to the rising population. Biochars, due to their unique surface properties, offer opportunities to modify their surface to prepare application-specific materials. The aim of this research is to study the effects of biochar surface modification by oxidizing chemicals on biochar properties. Pine bark biochar was modified with sulfuric acid, nitric acid, hydrogen peroxide, ozone, and ammonium persulfate. The resulting biochars’ pH, pH at the point of zero charges, and concentration of acidic and basic sites were determined using laboratory experimentation. Instrumental techniques, such as infrared and X-ray photoelectron spectroscopy, were also obtained for all biochar samples. X-ray photoelectron spectra showed that oxygen content increased to 44.5%, 42.2%, 33.8%, 30.5%, and 14.6% from 13.4% for sulfuric acid, ozone, nitric acid, hydrogen peroxide, and ammonium persulfate, respectively. The pH at the point of zero charges was negatively correlated with the difference in concentration of acidic and basic sites in biochar samples, as well as the summation of peak components representing C=O double bonds and carboxylic groups. The results suggest that designer biochars can be prepared by understanding the interaction of oxygenated chemicals with biochar surfaces.

1. Introduction

In the rapidly changing world, population growth is a constant factor. It has been estimated to increase to 9 billion and 11 billion by 2050 and 2100, respectively [1]. With the growing population, the secure, sustainable, and safe availability of water, food, energy, and industrial raw materials has and will continue to be a challenge. Thus, the need for a transition to a sustainably-focused economy and society becomes increasingly important [2]. This is a reason that many governments, business organizations, and educational institutions are opting for a bioeconomy. According to the German Bioeconomy Council, “Bioeconomy is the production and utilization of biological resources—including knowledge—to provide products, processes, and services in all sectors within the framework of a sustainable economy [3].” Thus bioeconomic principles explore and exploit bioresources to formulate bioproducts of economic value [4].
Biochar, made from the pyrolysis of forestry and agricultural residues, is considered to be a great opportunity to advance the bioeconomy [4]. Biochar’s source material is often discarded biomas, and as it is formed, itlocks in residual carbon from this biomass into its porous solid structure, and thus prevents that the carbon from returning to the atmosphere in the form of carbon dioxide [5]. Moreover, biochar can be utilized in different environmental applications such as wastewater treatment [6,7], energy storage [8,9], biofuel production [10,11], gas scrubbing [12,13], soil amendments [14,15], cattle feed [16,17], catalytic degradation of pollutants [18,19], and making cementitious materials [20,21]. Biochar’s potential as a carbon-negative technology made from waste which simultaneously contributes economic benefits makes it pertinent to achieving sustainable development goals. Hence, biochar has attracted the attention of scientists worldwide, as evidenced by an overwhelming number of research articles published that elucidate novel approaches to biochar preparation, modification, utilization, and insights into biochar structure.
Biochar without modifications, known as pristine biochar, exhibits poor properties for environmental applications, such as reduced porosity and surface area, and surface functional groups [22]. Therefore, biochar needs to undergo modification, and depending on the chemicals and methods used, a wide range of designer biochars have been prepared for different environmental applications. Oxygen atoms are common on pristine biochar surfaces, which come from the biomass feedstock [22]. Duan et al. [23] reported that oxygen contents and their speciation should be carefully optimized as oxygen functionalities can influence the catalytic ability in carbonaceous materials. Oxygen-containing groups, such as carboxyl, carbonyl, hydroxyl, and phenolic, can help bind metal ions [24]. Oxygen functional groups have also been reported to be effective in the photodegradation of antibiotic drugs, such as, enrofloxacin [25]. Oxygen functional groups also enhanced supercapacitor activity in water hyacinth hydrochar [8]. Thus, intentional oxygen modification of biochar has been studied with a number of oxidizing agents, such as potassium hydroxide, nitric acid, sulfuric acid, potassium permanganate, air, and ozone [24,26].
From a material design perspective, it is important to perform comparative studies which can form a baseline for determining the suitable oxidizing agent targeting specific properties in biochar. In our recent publication, we modified pine bark biochars with different nitrogen-containing chemicals and studied their effect on biochars’ physicochemical properties [27]. It was clear that the resultant biochar’s properties are greatly influenced by these modifying chemicals. In this research, we studied the effects of five different oxidizing agents, namely sulfuric acid, nitric acid, ozone, hydrogen peroxide, and ammonium persulfate, on the surface properties of biochar. Pine bark-derived pristine biochar was saturated with oxidizing agents. The modified biochars were characterized using various instrumental and wet lab techniques to compare the biochar properties after modification.

2. Materials and Methods

Pine bark nuggets (6.65 ± 2.5 cm in length) were procured locally from Oldcastle Lawn and Garden Inc., GA. The nuggets were washed with deionized (DI) water, dried in a mechanical oven (Lindberg/Blue M MO1490SA-1) at 105 °C for 72 h, and stored. All the analytical grade chemicals were used to prepare and characterize the samples. Sulfuric acid (97.3% w/w, CAS: 7664-93-9), Nitric acid (69.0%, CAS: 7697-37-2), Hydrogen peroxide (31.4%, CAS: 7722-84-1), and Ammonium persulfate (CAS: 7727-54-0), Potassium hydroxide (CAS: 1310-58-3), Sodium hydroxide (CAS: 1310-73-2), Potassium nitrate (CAS: 7757-79-1), and Hydrochloric acid (25% v/v, CAS: 7732-18-5) were purchased from Fisher Chemical. Ozone was produced with the help of an ozone generator.

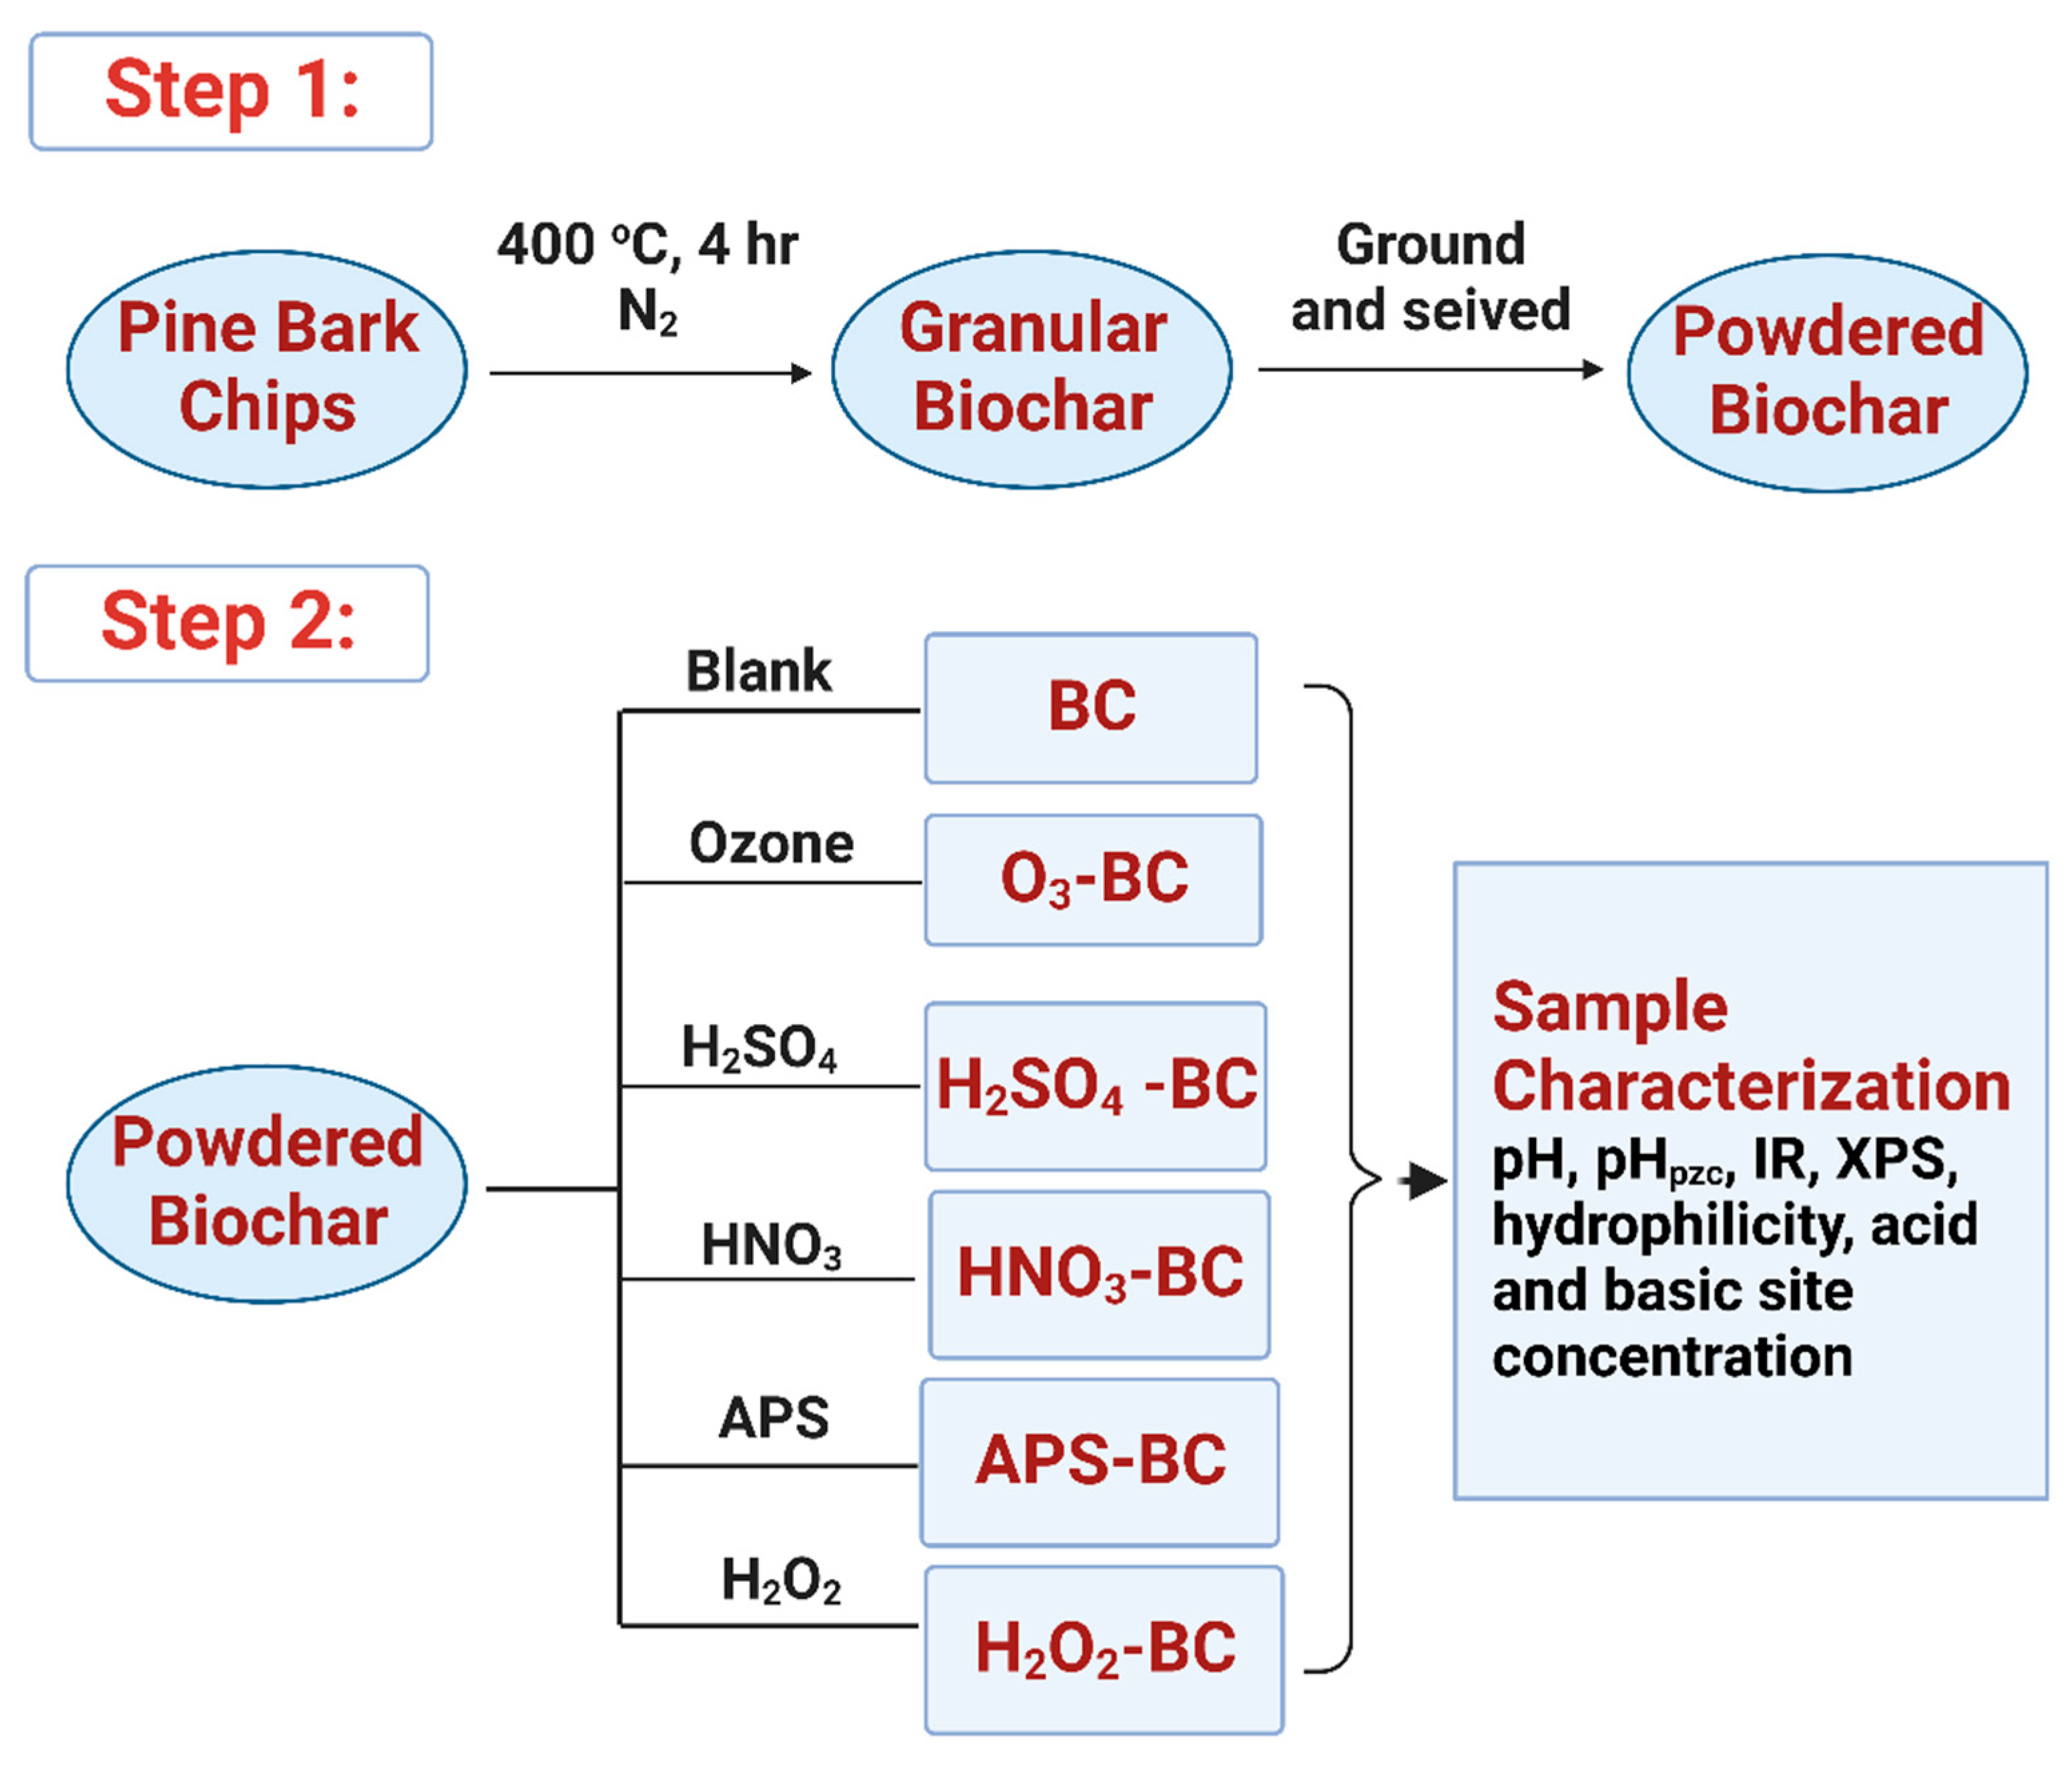
2.1. Sample Preparation

Pristine biochar was prepared by pyrolyzing the washed and dried pine bark nuggets in a Sentry 2.0 microprocessor box furnace at a heating rate of 10 °C/min under N2 flow of 5 L/min up to 400 °C and maintained for 4 h. The obtained sample was allowed to cool at room temperature and then ground and sieved to a particle size below 200 mesh. The powdered samples were stored in a sealed glass container and labeled BC. Subsequently, the modified samples were prepared from BC.
To prepare the modified biochar samples, BC samples were treated with several oxygen precursors. Figure 1 shows a schematic of the different processing steps involved in sample preparation. For oxidation with ozone, 11 g/m3 ozone (produced in a corona discharge ozone generator) (OL80, Yanco Industries, Burton, BC, Canada) was flown through a glass column packed with biochar. To ensure a uniform reaction, the column was flipped after 1.5 h. For liquid-phase oxidation, the biochar samples were reacted (wet impregnation) with 50% hydrogen peroxide, 18.25 M sulfuric acid, 15.8 M nitric acid, and 2 M ammonium persulfate (in 1 M sulfuric acid) for 3 h. Subsequently, the liquid oxidized biochars were washed several times under flowing water for 30 min. The washed samples were dried in an oven (Lindberg/Blue M MO1490SA-1) at 105 °C for 48 h to obtain oxygen-doped biochars and labeled as O3-BC, H2SO4-BC, HNO3-BC, APS-BC, and H2O2-BC depending on the oxygen treatment and stored for subsequent surface characterization studies.

2.2. Sample Characterization

2.2.1. Biochar pH

The pH values of the biochar samples were determined by equilibrating 0.4 g of biochar samples in 20 mL of DI water at 150 rpm for 24 h and then measuring the filtrate’s pH (Model: AB150; Manufactured by Fisher Scientific, Waltham MA, USA) [28].

2.2.2. Point of Zero Charges (pHpzc) in Biochar Samples

Biochar samples’ pHpzc was determined by mixing 0.2 g of samples with 40 mL 0.1 N potassium nitrate solution at 150 rpm for 24 h in a pH range of 2–14. The pH was adjusted by adding either 0.1 N nitric acid or potassium hydroxide solution. The samples were then filtered, and the pH of the filtrate was recorded. The final pH of the filtrates was plotted against their initial pH. The intersection point of the curve with the 45° straight line where pHinitial = pHfinalwas recorded as the pHpzc of the biochar samples [29].

2.2.3. Hydrophilicity of Biochar Samples

The hydrophilicity/hydrophobicity of the biochar samples was determined using the molarity of the ethanol droplet (MED) test, which is described in detail elsewhere [30]. Briefly, the MED test uses varied quantities of ethanol to change the liquid’s surface tension. It is also referred to as the “percentage of ethanol” or “critical surface tension” test. This test quantifies biochar wettability by measuring the lowest ethanol concentration that permits a drop to penetrate within 3–5 s. It effectively determines how strongly a water drop is repelled and this property is best related to the degree of hydrophobicity. This approach is qualitative in nature. The hydrophobicity is correlated to the ethanol concentration in Table 1. A higher value of the MED index is related to a higher degree of hydrophobicity. Thus, an index value of 0 is extremely hydrophilic, and seven is extremely hydrophobic. The surface tension of an ethanol solution decreases with the increasing concentration of ethanol solution. Thus, a droplet with lower surface tension (respectively, a higher concentration of an ethanol solution) will infiltrate into the porous solid material faster than a solution with high surface tension.

2.2.4. Concentration of Acidic and Basic Sites in Biochar

The concentration of acidic and basic sites on biochar surfaces was determined according to the procedure described elsewhere [31]. Briefly, to determine the acidic site concentration, 0.2 g biochar samples were added to 25 mL of 0.02 M sodium hydroxide (NaOH) solution and stirred at 150 rpm for 48 h at room temperature. Then the solution was filtered, and the filtrate was titrated with 0.02 M hydrochloric acid (HCl) solution. The concentration of acidic sites was calculated by subtracting the moles of NaOH after titration from the initially present NaOH moles and dividing by the material mass. Similarly, the concentration of basic sites was determined by adding 0.2 g of biochar samples in 25 mL 0.02 M HCl and titrating the resulting filtrate with 0.02 M NaOH solution. pH (Model: AB150; Manufactured by Fisher Scientific, Waltham, MA, USA) was used to monitor the progress of the titration. All the values were measured in replicate.

2.2.5. Infrared (IR) Spectrum Analysis

A Bruker Platinum ATR spectrometer was used to obtain the IR spectrum for analyzing the surface functional groups in the biochar samples. Origin (2021b) software was used to construct and subtract the baselines of the obtained spectra.

2.2.6. X-ray Photoelectron Spectroscopy (XPS) Analysis

Biochar samples’ surface atomic composition was analyzed in a SPECS XPS system with a PHOIBOS 150 analyzer using Mg Kα radiation under a pressure of about 3 × 10⁻¹⁰ mbar. XPS Peak software (Version 4.1) was used to deconvolute the XPS spectra.

3. Results

3.1. pH Values of Biochar

The pH values of the pristine and modified biochars are shown in Table 2. BC had a pH of 6.4, whereas the modified samples had pH of 1.88, 1.99, 2.43, 2.59, and 2.63 for H2SO4-BC, O3-BC, HNO3-BC, H2O2-BC, and APS-BC, respectively, showing that the pH of the biochars decreased after oxygen treatment.

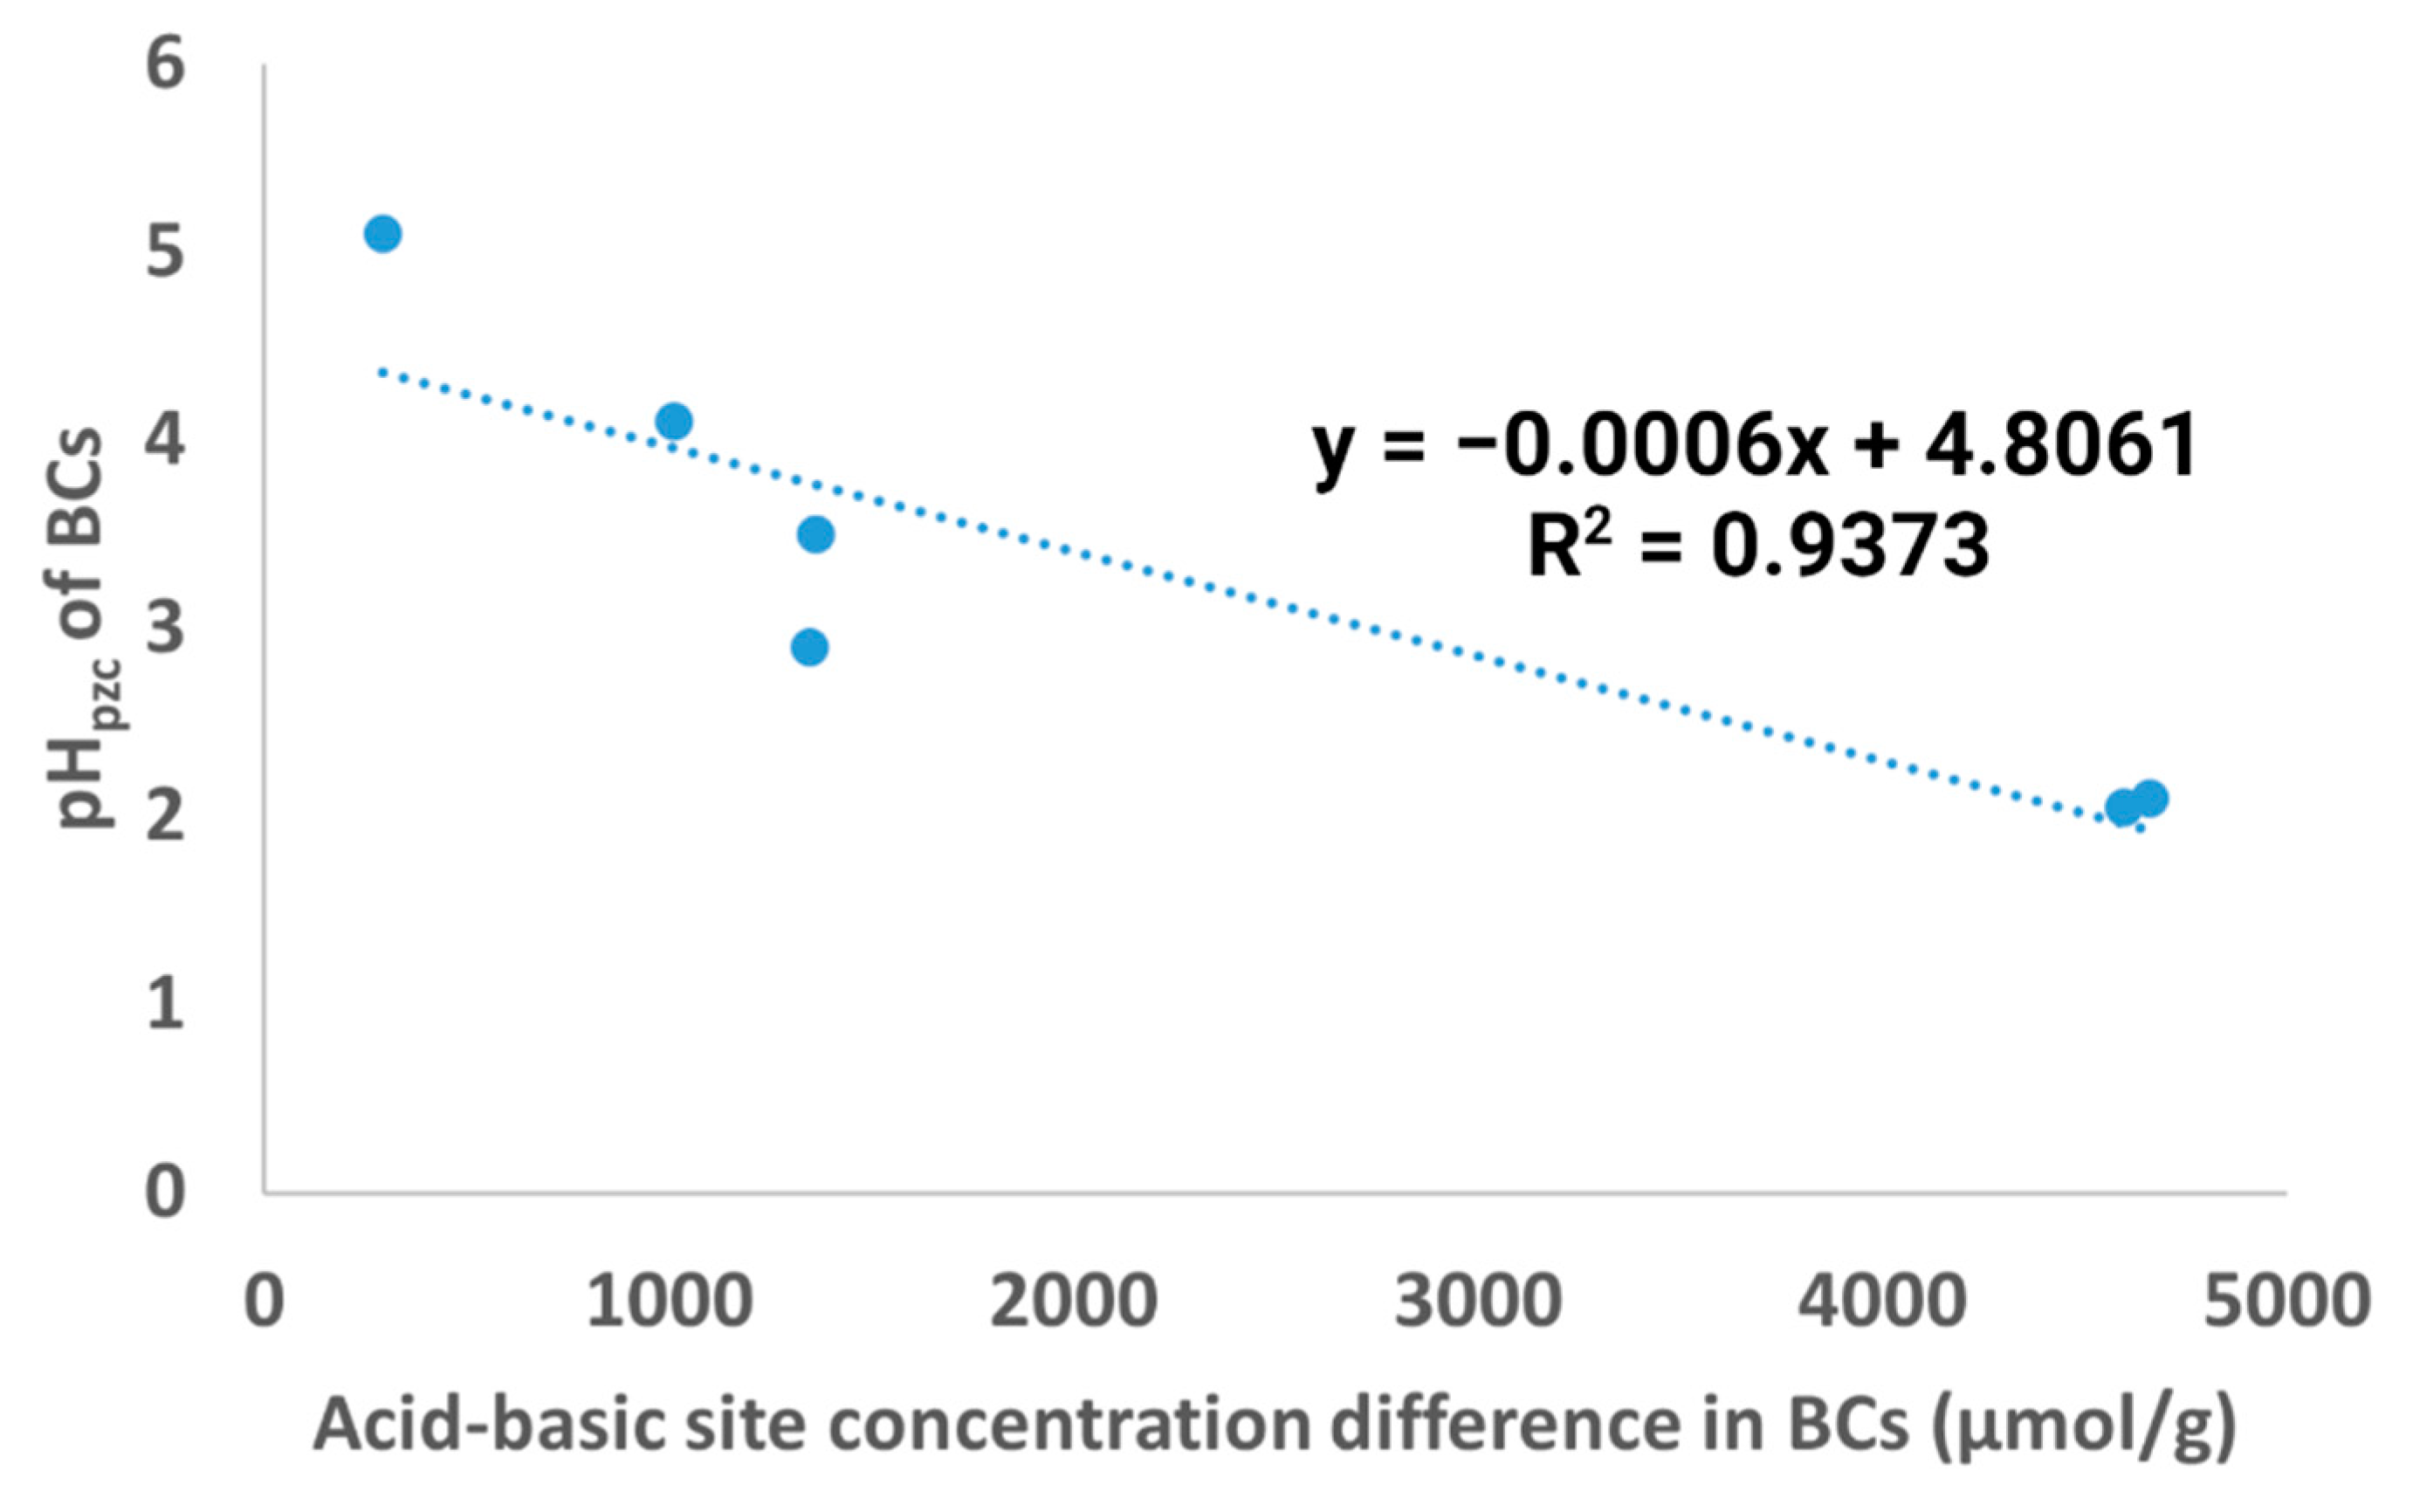
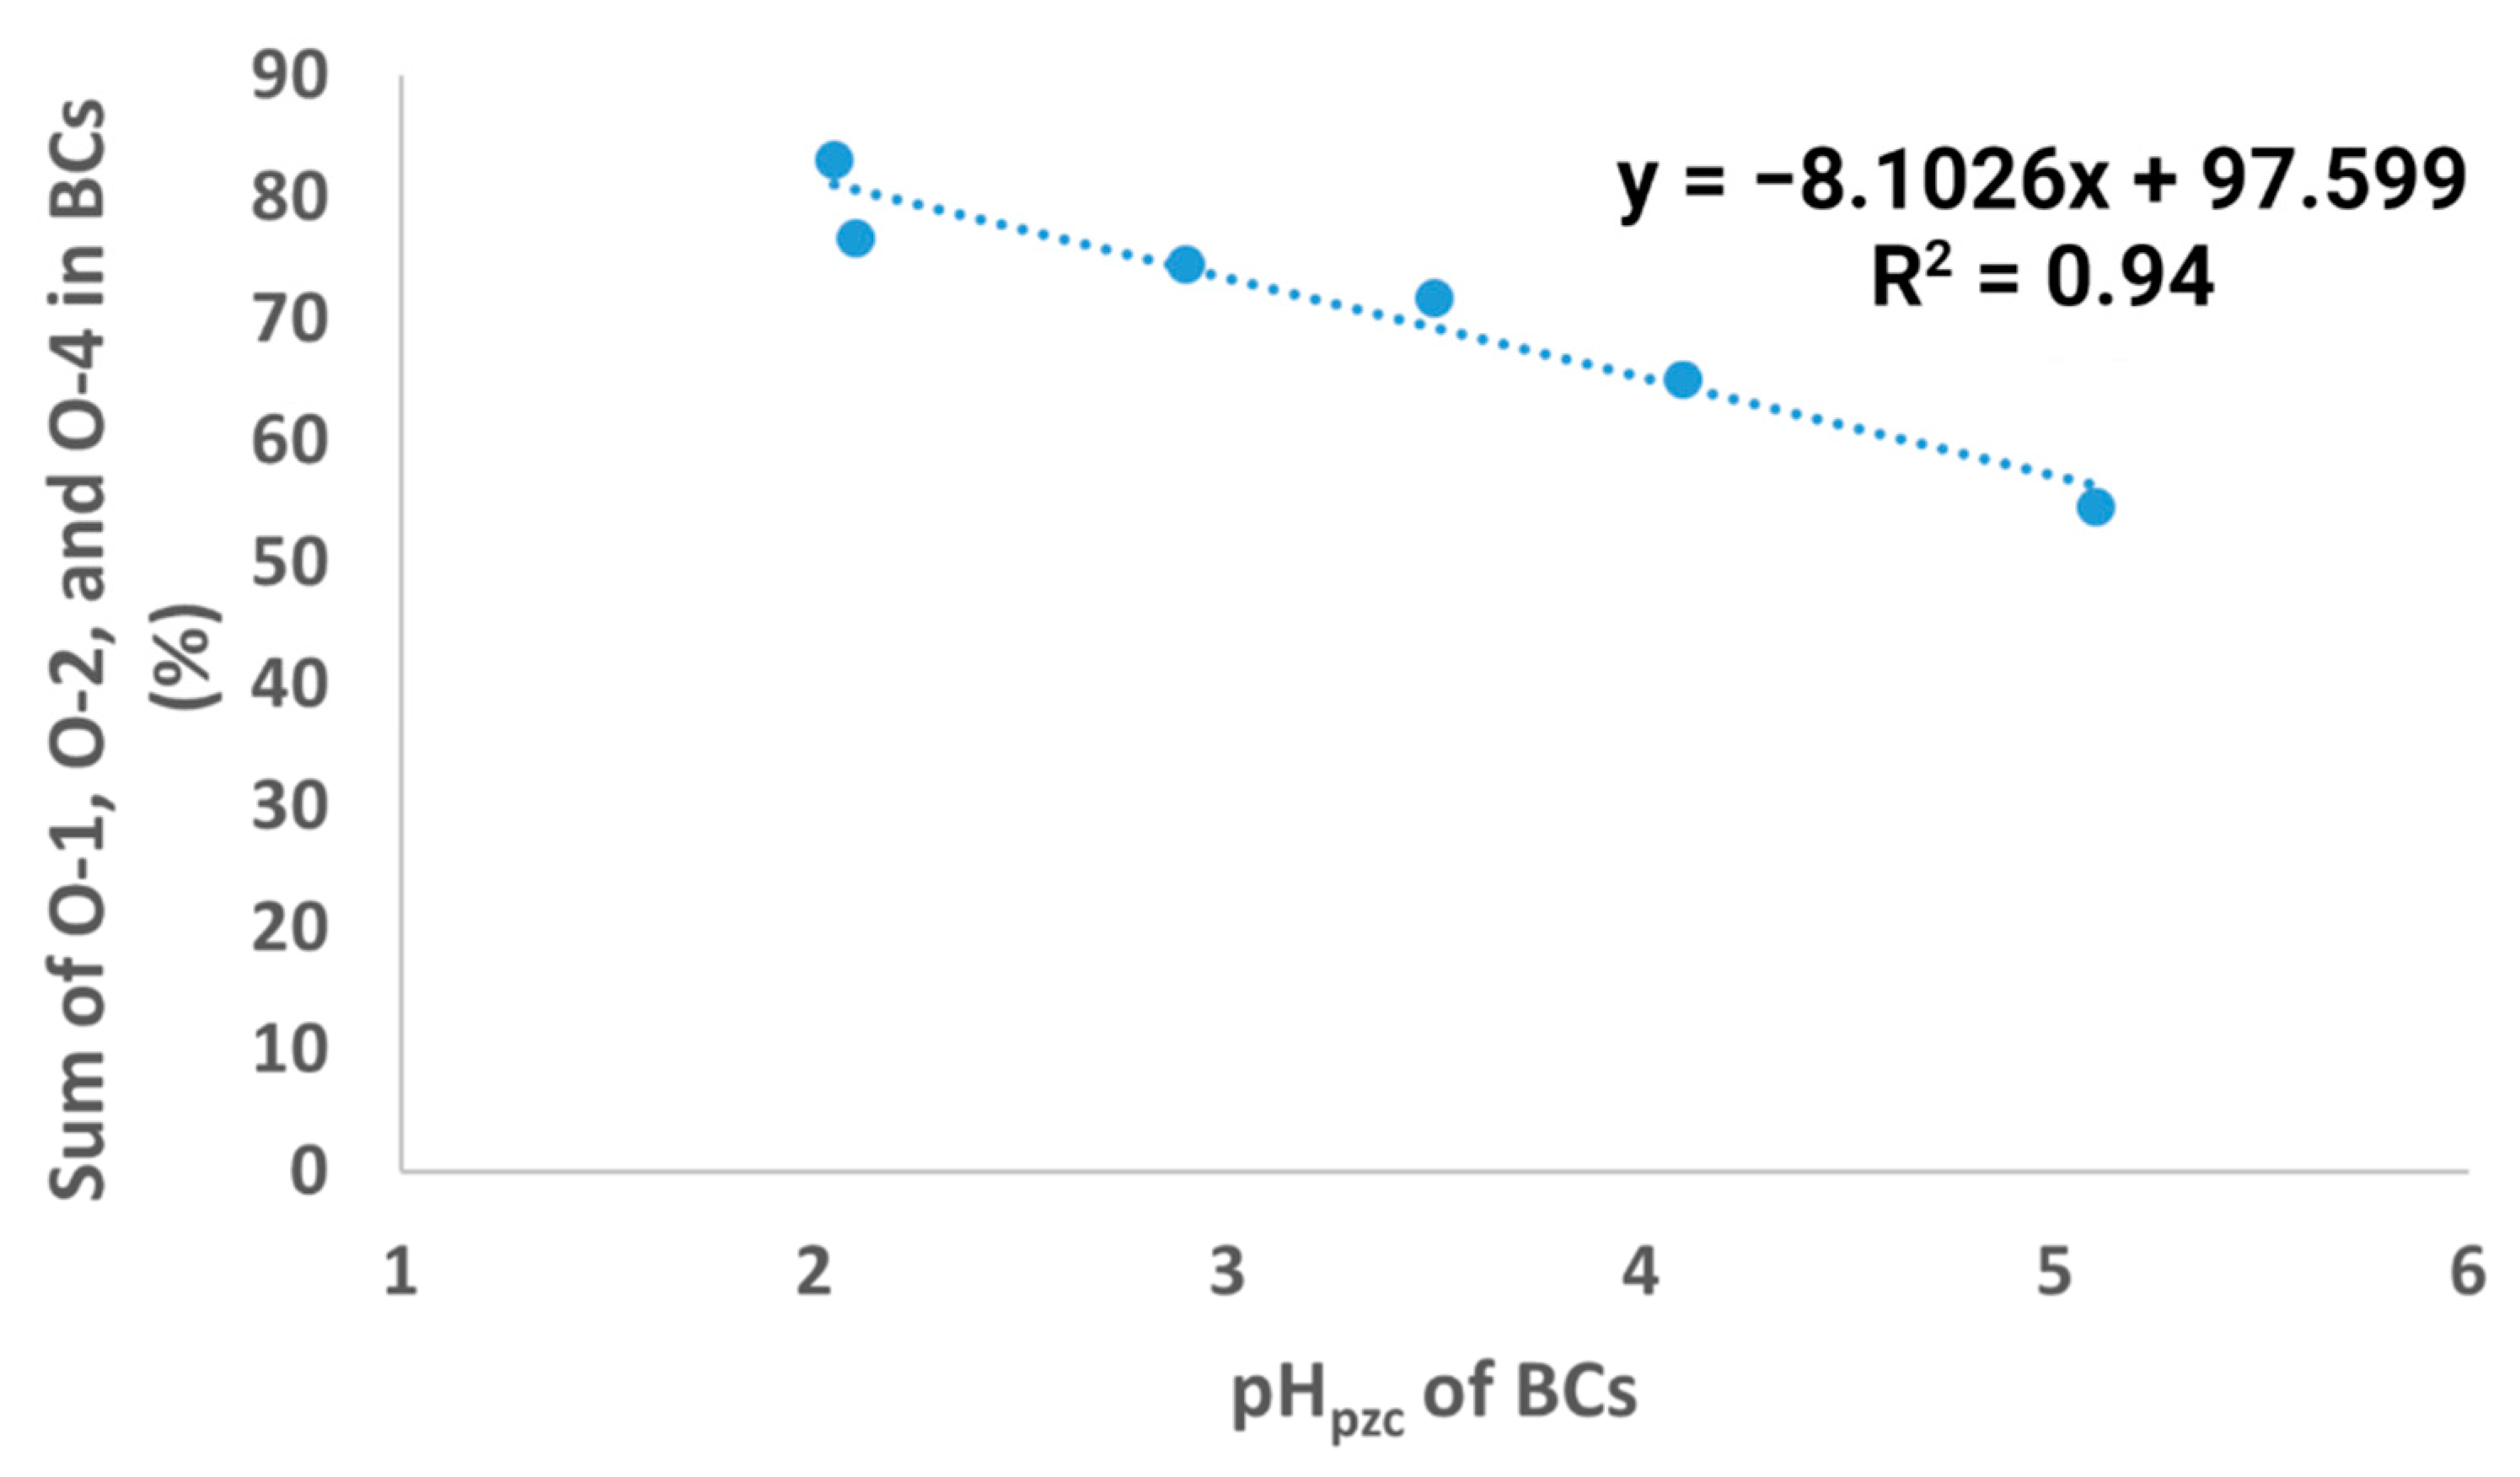
3.2. pHpzc of Biochar

Table 2 lists the pHpzc of all the biochar samples. As seen, BC had a pHpzc of 5.1 whereas H2SO4-BC had 2.3, O3-BC had 3.9, HNO3-BC had 2.05, H2O2-BC had 2.08, and APS-BC had 4.1, suggesting a decrement in the pHpzc of the modified biochar samples.

3.3. Hydrophobicity Index of Biochar

The hydrophobicity index values of biochars are shown in Table 2. Pristine biochar, BC, had a hydrophobicity index of 2, whereas the modified samples had a hydrophobicity index of 0, 0–1, 1–2, 3, and 6 for H2SO4-BC, O3-BC, HNO3-BC, H2O2-BC, and APS-BC, respectively.

3.4. Concentration of Acidic and Basic Sites in Biochar

The concentration of acidic and basic sites on biochar samples is shown in Table 3. The acidic site concentration increased in modified samples from 917.84 µmol/g in BC. H2SO4-BC had 4969.90 µmol/g, O3-BC had 1646.27 µmol/g, HNO3-BC had 4946.04 µmol/g, H2O2-BC had 1800.70 µmol/g, and APS-BC had 1442.41 µmol/g acidic sites. On the other hand, the concentration of basic sites was decreased in modified biochars from 625 µmol/g in BC. H2SO4-BC had 307.37 µmol/g, O3-BC had 297.51 µmol/g, HNO3-BC had 350.98 µmol/g, H2O2-BC had 437.76 µmol/g, and APS-BC had 428.57 µmol/g basic sites.

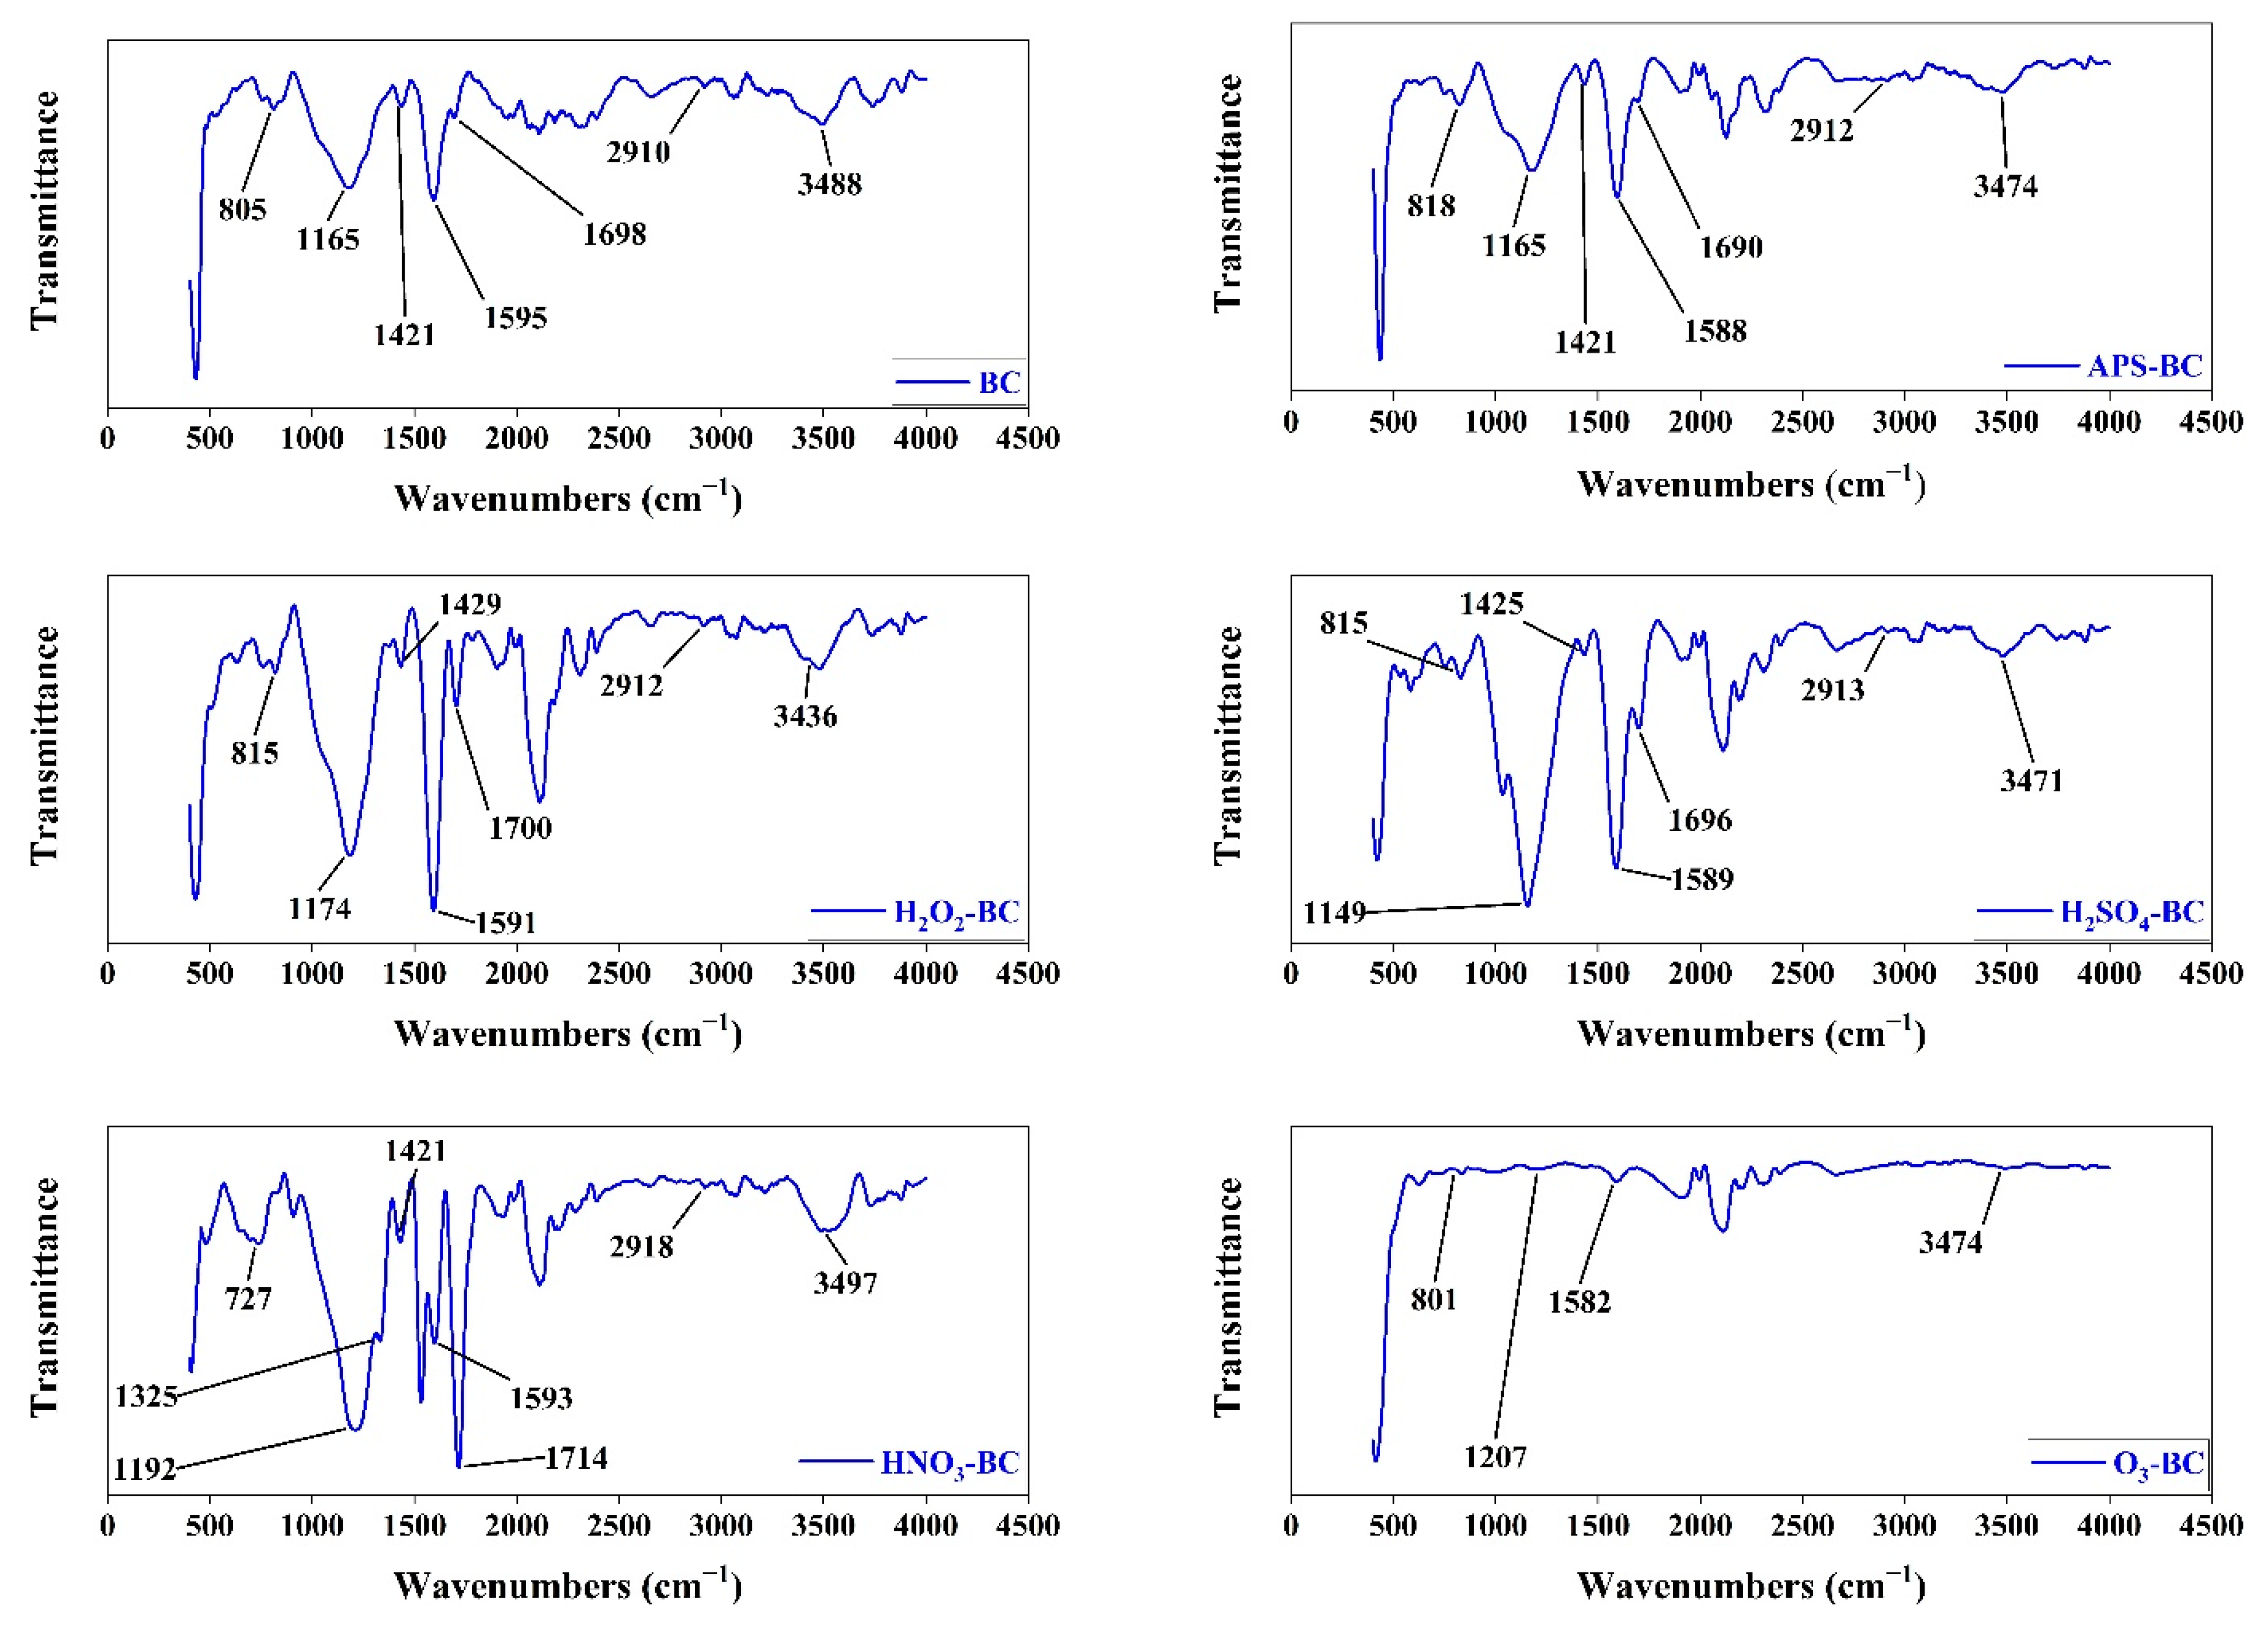
3.5. Infrared Spectra of Biochar

Figure 2 shows the IR spectra (400–4000 cm−1) of all the prepared biochar samples, including BC. Different characteristic IR peaks were observed in the samples. The peaks near 2900 cm−1 and 1415 cm−1 corresponded to the C-H stretching and C=C bonds, respectively [27]. The broad peak near 3400 cm−1 was attributed to the O-H stretching vibrations. The peak range of 650–850 cm−1 suggests the aromatic structures in biochar. The broad signal in the range 1015–1315 cm−1 suggests multiple functional groups such as epoxy, hydroxyl, and carboxyl having C-N, C-C, and C-O bonds. The peaks observed near 1576 cm−1 were attributed to the C=O functional groups present in carboxylic or lactonic structures, whereas peaks near 1700 cm−1 indicated C=O stretching vibrations [32]. A peak at 1325 cm−1 is observed only for HNO3-BC, attributed to the nitro (NO2) group vibrations [33].

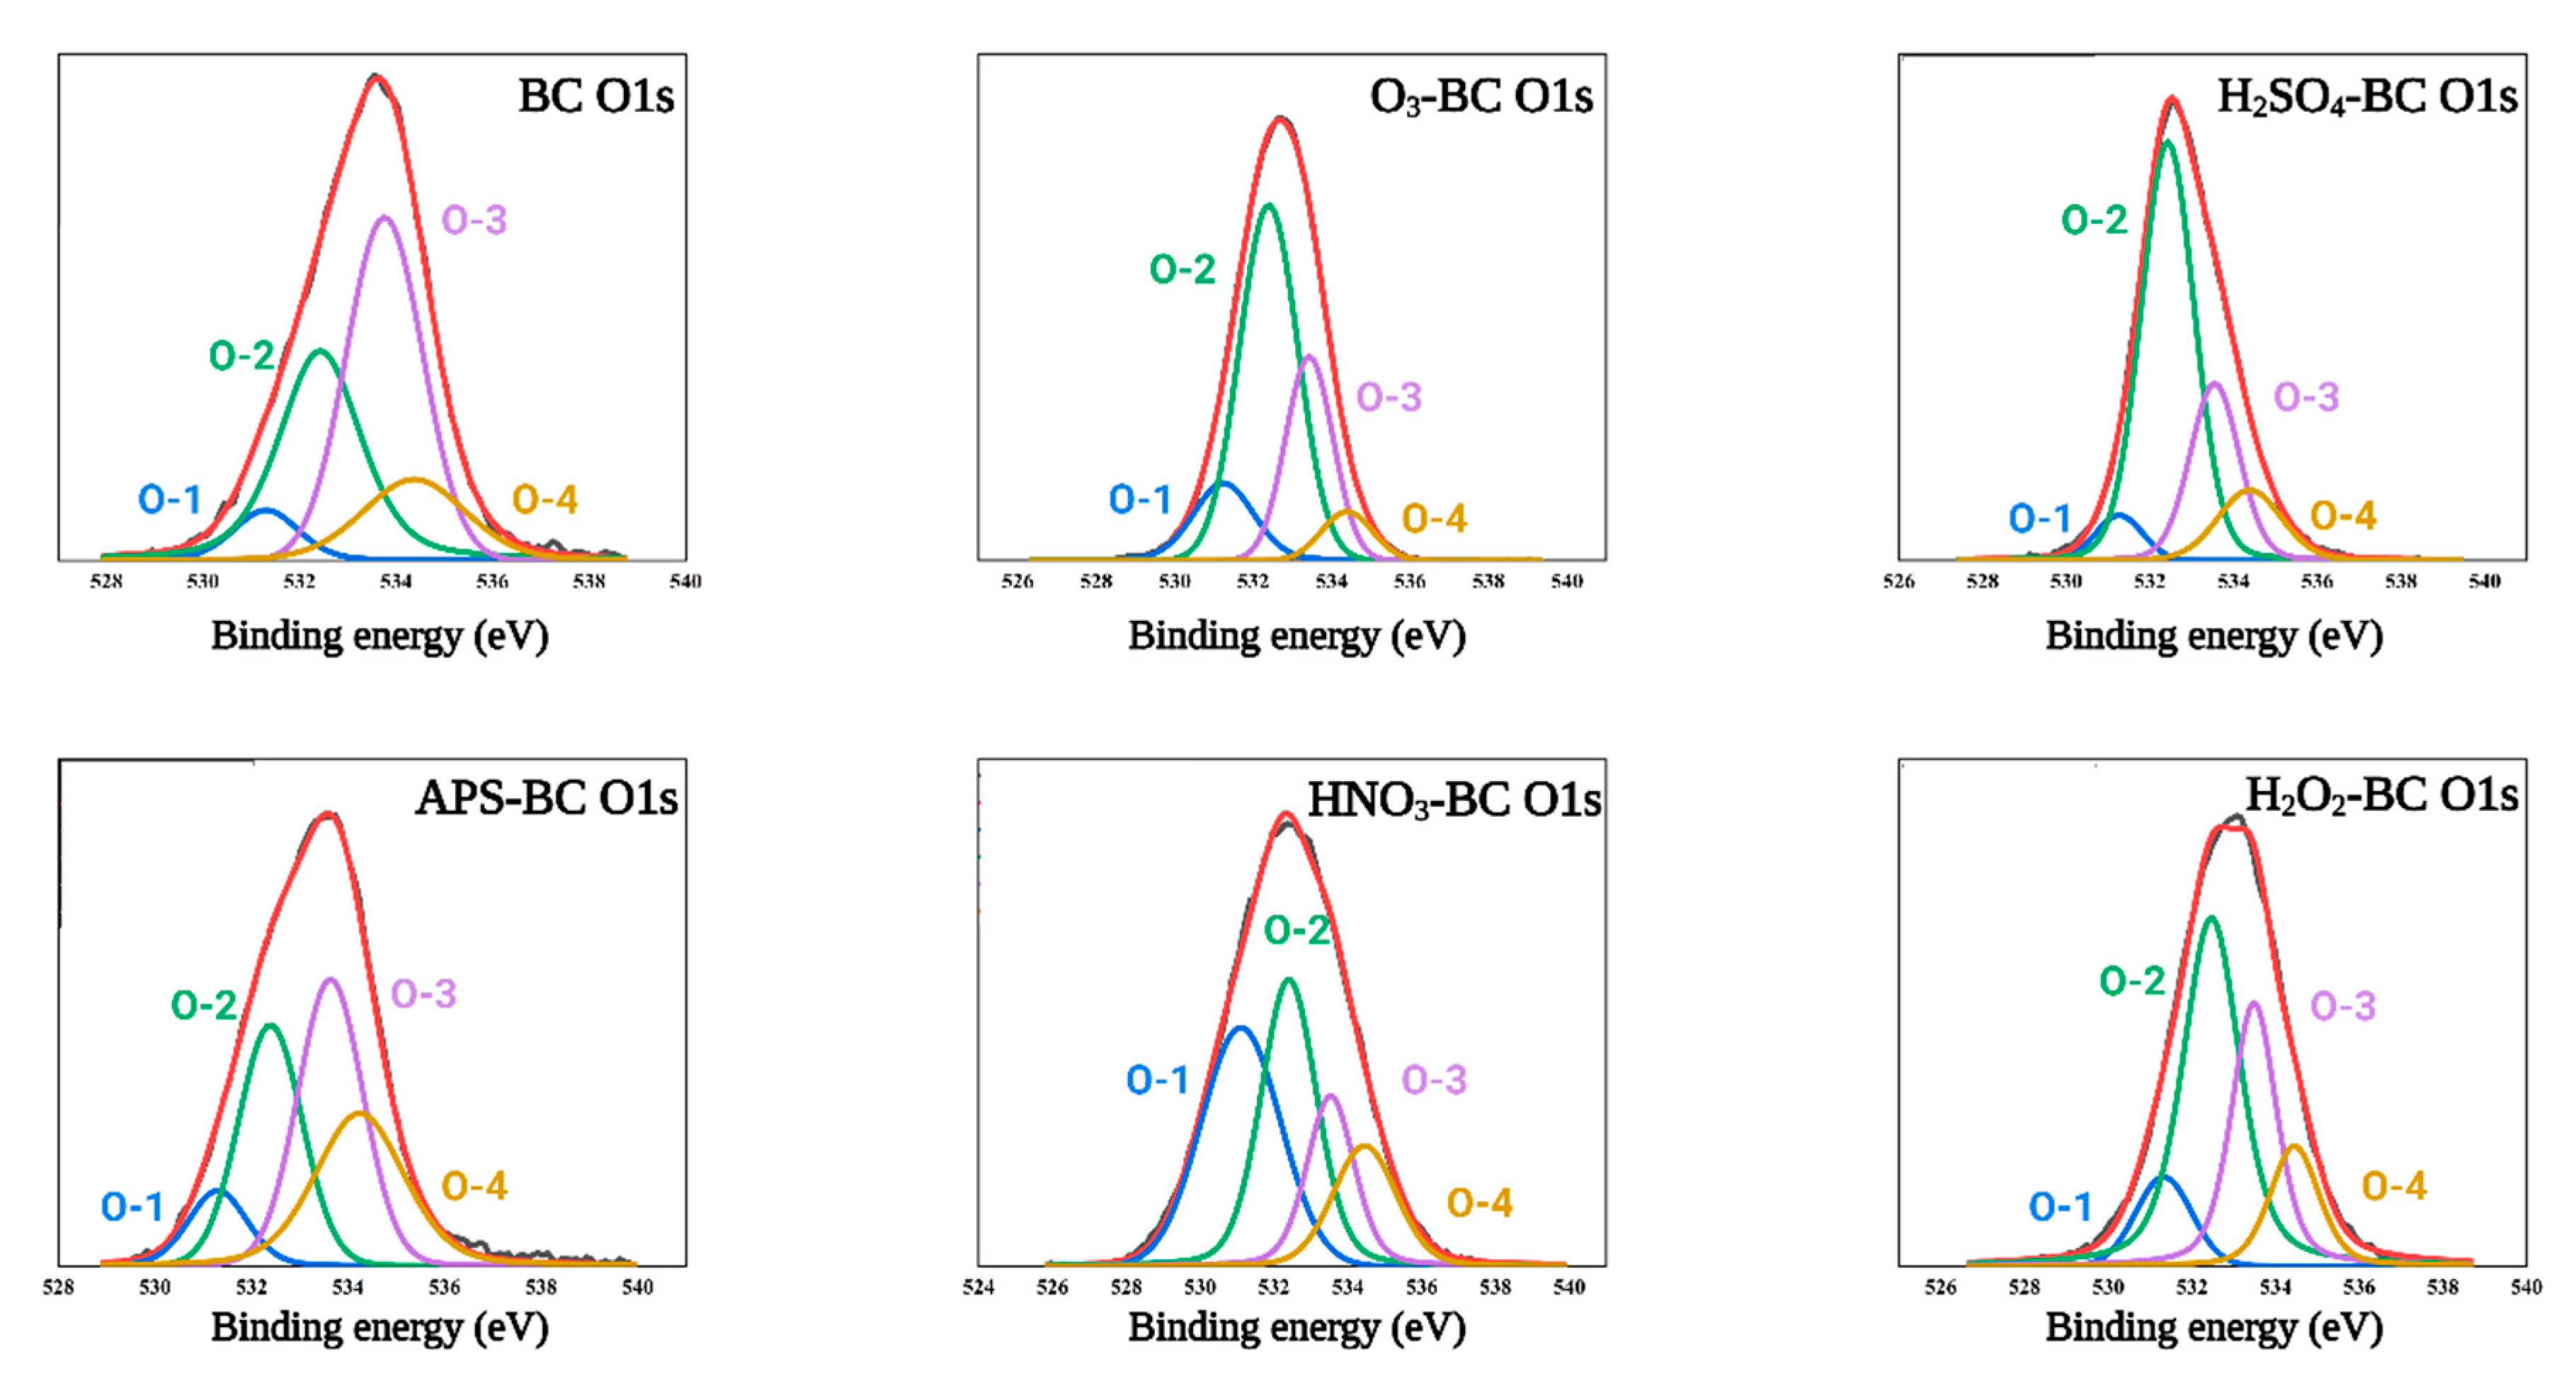
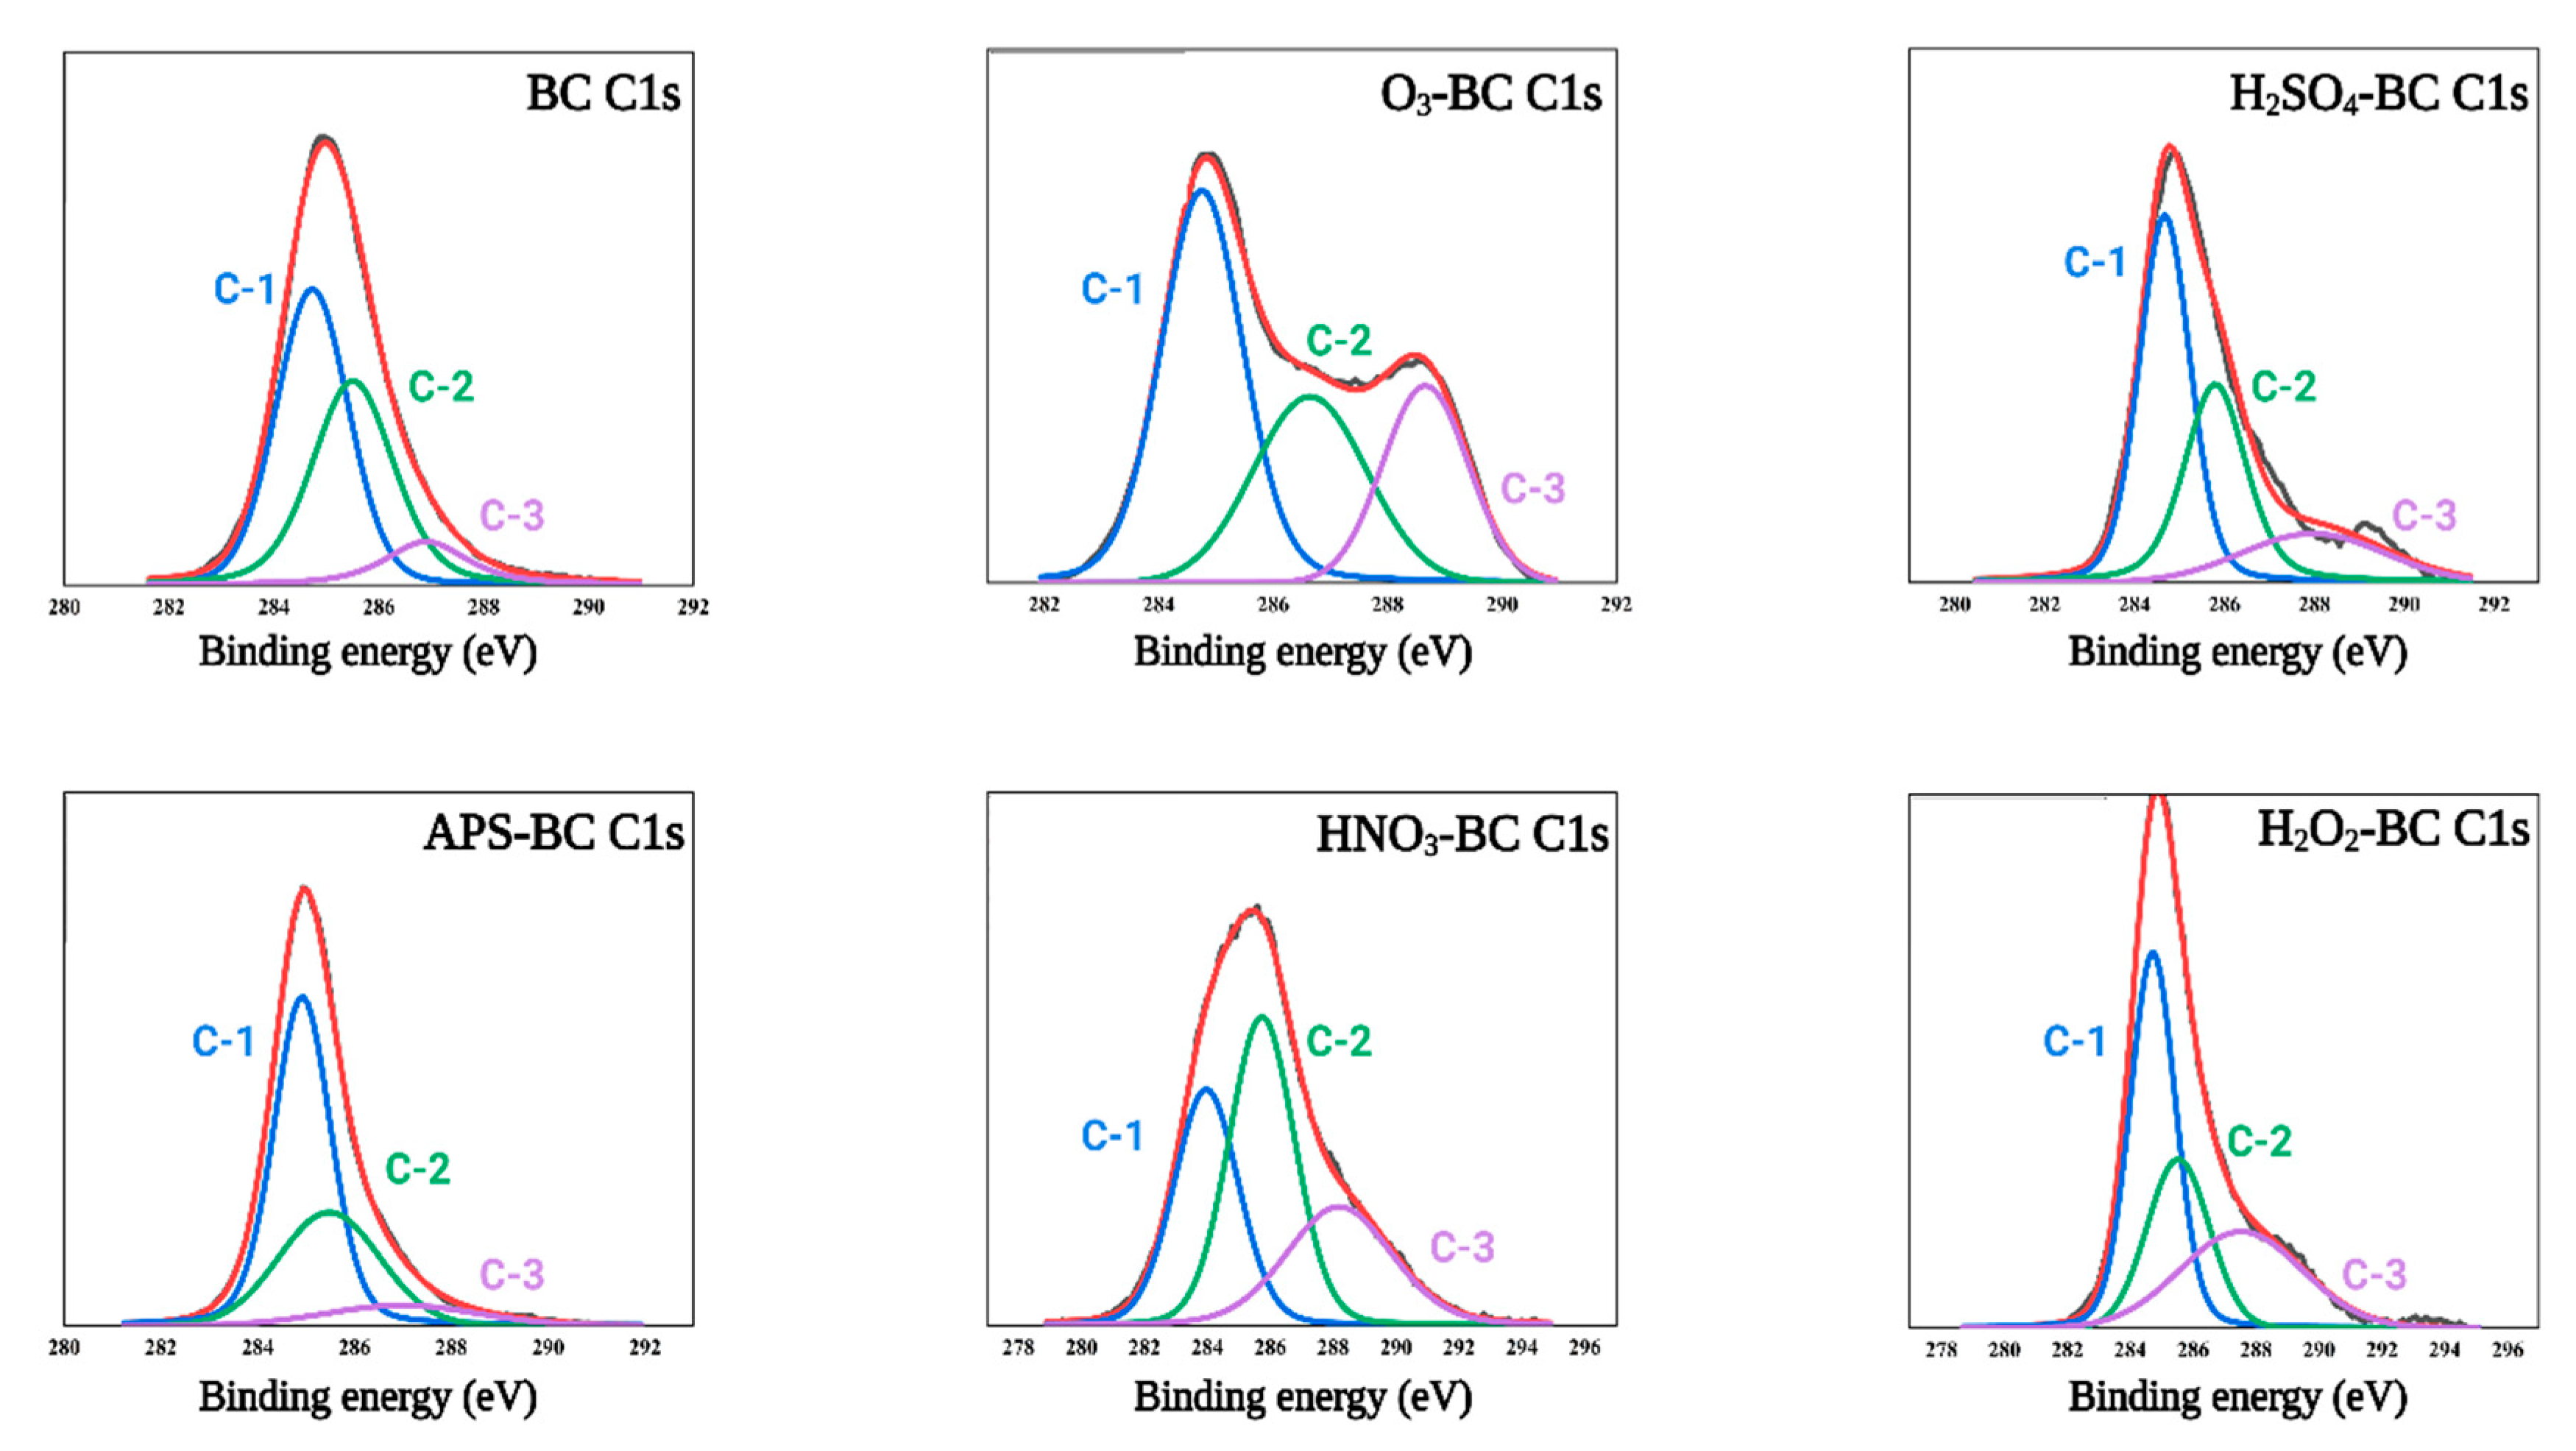
3.6. XPS Spectra of Biochar

Table 4 shows the relative content of carbon and oxygen as atomic percentages in the biochar samples. Besides carbon and oxygen, H2SO4-BC and HNO3-BC exhibited sulfur and nitrogen peaks, respectively (shown in the supplementary information; Figures S1 and S2). As expected, the relative composition of carbon decreased in the modified samples due to an increment in oxygen percentage, inferring that the oxygen-modification strategy was effective. H2SO4-BC and O3-BC had the highest percentages of surface oxygen, whereas APS-BC showed a very insignificant change in overall composition compared to BC. All the C1s and O1s peaks were further deconvoluted to gain information on the chemical bond structure of these atoms.
As shown in Figure 3, three peaks (C-1, C-2, and C-3) were obtained after deconvoluting the C1s peaks where C-1 (284.7–284.8 eV) denotes sp2 hybridized carbon, C-2 (285.5–286.2 eV) denotes C-O bonds, and C-3 (287–288.2 eV) denotes C=O bonds [32,34]. The relative contents of these peaks are shown in Table 5. Except for APS-BC, the relative contents of the C-3 peak were increased in the modified biochars indicating the formation of C=O double bonds upon oxygen modification.
Figure 4 shows the deconvolution of O1s spectra for the biochar samples. The O1s spectra were fitted to four component peaks (O-1, O-2, O-3, and O-4), where O-1 (531.2–531.3 eV) represents carbonyl and quinone type oxygen bonds, O-2 (532.4–532.5 eV) represents oxygen in esters, and anhydrides, O-3 (533.6–533.8 eV) represents ether-type oxygen in esters and anhydrides, and O-4 (534.3–534.8 eV) represents carboxylic groups [35]. The relative contents of various O1s components are shown in Table 6.

4. Discussion

4.1. pH Values of Biochar

Biochar pH is an essential property for its utility in different environmental, agricultural, and biological applications. Acidic biochars can be used as an amendment in high pH soils [4]. Moreover, the biochar pH can influence the contaminant removal in aqueous solutions by altering the solution pH. In the present work, the pH values of the modified biochar samples decreased (Table 2), showing an acidic character. Similar results were obtained by Chen et al. [36], where the authors report decrement in the pH value of microalgae biochar upon treatment with H2SO4 and H2O2, although the values are different, which may be attributed to the inherent difference in the precursor biomass characteristics as well as biochar preparation techniques. However, the nitrogen modification studied in our previous research resulted in an increase of pH in all modified biochar samples [27], indicating that precursor chemicals can greatly influence biochar properties which can be exploited to prepare application-specific designer biochars. The increased acidic character of the modified biochars can be attributed to the acidic nature of the modifying chemicals used in this study.

4.2. pHpzc of Biochar

The pH at the point of zero charges (pHpzc) is a crucial biochar property for wastewater treatment applications. The pHpzc is obtained when at a particular pH, the surface charges of functional groups cancel out, and the biochar’s surface is neutralized. The surface of the biochar becomes negatively charged when the surrounding solution pH is higher than the biochar’s pHpzc, which favors the adsorption of cationic pollutants. Similarly, when biochar’s pHpzc is greater than the surrounding solution pH, the surface becomes positively charged and favors the adsorption of anionic pollutants [32]. Thus, the pHpzc of the oxygen-modified samples infers that these samples would be suitable for cationic pollutant adsorption at neutral pH. Pap et al. [37] prepared plum and apricot based H2SO4-modified biochars and found that the removal of chromium and lead enhanced at pH > 6.0. The pHpzc was 5.02 and 4.56 for plum and apricot biochar, respectively.

4.3. Hydrophobicity Index of Biochar

Hydrophilicity/hydrophobicity influences biochar’s pollutant adsorption capacity as well as leaching characteristics. The hydrophilic functional groups can contact better in the aqueous solution with the pollutant. On the other hand, it has been reported that biochars with higher hydrophilic surfaces leach a higher amount of organic nutrients than those with a higher concentration of hydrophobic surfaces [38]. It is observed that APS modification resulted in the most hydrophobic biochar sample, and H2SO4-BC possessed the most hydrophilic character among all tested biochars.

4.4. Concentration of Acidic and Basic Sites in Biochar

It is observed that the acidic sites increased in the modified biochar samples (Table 3). This is consistent with the decreasing pH of the modified biochars. With the increase in acidic sites, the basic sites decreased in the modified biochars. It was also observed that the difference in concentration of acidic and basic sites on biochar was negatively correlated with the pHpzc of the biochar samples (Figure 5). In this study, as the precursors used were of acidic character, the pHpzc decreased with increasing differences between acidic and basic site concentrations. However, if the concentration of basic sites was more than the acidic sites, this correlation might be positive. However, this hypothesis needs to be verified in the laboratory.

4.5. Infrared Spectra of Biochar

The infrared spectroscopic technique is used for structural analysis and identification of surface functional groups present in a sample [39]. Although their relative position and intensity after modification differed from BC (Figure 2), which infers alteration in biochar structure due to its modification with different oxidizing chemicals. The lower intensity of C-H peaks (2900 cm−1) in modified samples than BC suggests possible reactions between C-H groups and oxidizing chemicals. The increased relative intensity of the peaks near 1576 cm−1, suggesting C=O functional groups after biochar modification with oxidizing chemicals, especially H2SO4, HNO3, and H2O2, infers an increment in the acidic functional groups in these samples. This increment agrees with the results from the acidic site concentration of the biochar samples. Although the modified samples’ IR spectra showed various functional groups, the spectra of O3-BC did not reflect so. Some soft peaks were observed in the spectra for O3-BC. However, the XPS results showed that the oxygen concentration increased in biochar after O3 modification. It might be due to the strong oxidizing character of ozone which etched the biochar surface and caused the chemical bonds in the surface functional groups to dissociate. The other possibility might be due to the non-homogeneous ozone modification in the process, and the representative sample for IR could not capture the changes in the biochar.

4.6. XPS Spectra of Biochar

High-resolution XPS analyses were performed to obtain a surface atomic composition. Shirley-type background and Gaussian-Lorentzian peaks were used to fit the obtained spectra. Both O-1 and O-2 peaks denote C=O bonds. As evident from Table 6, the relative contents of either of these two peaks have increased significantly after oxygen modification, except for APS-BC. This is consistent with the XPS results of C1s deconvolution. Among the increased C=O double bonds, HNO3-BC had the highest percentage of carbonyl and quinine groups, whereas H2SO4-BC had the highest relative content of esters and anhydride groups. Additionally, the overall content of C=O (double) bonds was higher in H2SO4-BC. O-3 peaks, which represent C-O single bonds, showed a decrease in the modified biochar samples, which is consistent with the decrement in C-2% in Table 5. O3-BC had the lowest relative content of the carboxylic group of all other samples, probably because the all-oxygen character of ozone displaced hydrogen from pristine biochar. On the other hand, APS-BC favored the formation of carboxyl-type oxygen. Similar observations were made by Langley et al. [26]. It was also observed that the pHpzc of biochar samples was negatively correlated with the summation of O-1, O-2, and O-4 percentages in biochar (Figure 6). All these three peaks denote double bonds, which indicates that the pHpzc of biochar samples might be influenced by the presence of C=O double bonds on the biochar’s surface.

5. Conclusions

In this study, we compared the surface chemical properties of pine bark biochars modified with five different oxygen-enriching chemicals, namely, sulfuric acid, ozone, nitric acid, hydrogen peroxide, and ammonium persulfate. The results show that H2SO4-BC had the highest concentration of C=O bonds compared to all other tested samples. H2SO4-BC also had the highest percentage of esters and anhydrides, whereas HNO3-BC had the highest percentage of carbonyl and quinone-type oxygen atoms. Moreover, the pHpzc of biochar samples was negatively correlated to both the difference between the acidic and basic sites concentration on the biochar’s surface and the summation of O-1, O-2, and O-4 peaks. These results suggest that the structure of oxygen-enriched chemicals has a significant effect on the biochar properties. Furthermore, the oxygen functional groups on the biochar can influence different biochar properties, such as pHpzc, acidic, and basic sites’ concentration on biochar. Essentially, this study provides insight into the preparation strategy of application-specific carbon materials with oxygen-enriched chemicals and forestry wastes. Future studies should endeavor on studying the applications of biochars thus prepared with a focus on determining the biochar structure-activity relationship.

Supplementary Materials

The following supporting information can be downloaded at: https://www.mdpi.com/article/10.3390/pr10102136/s1, Figure S1: Raw XPS scan of H2SO4-BC; Figure S2: Raw XPS scan of HNO3-BC.

Author Contributions

Conceptualization: N.K. and P.K.; methodology: N.K.; investigation: N.K.; data collection: N.K., V.A. and B.V.; resources: P.K. and S.G.H.; writing—original draft preparation: N.K.; writing—review and editing: N.K., P.K., S.G.H., V.A. and B.V.; supervision: P.K. and S.G.H.; funding acquisition: P.K. and S.G.H. All authors have read and agreed to the published version of the manuscript.

Funding

This research was supported in part by USDA-NIFA-SAS (grant # 562724-02651), the William White Fund of the NC Agriculture Foundation, and NC State University College of Agriculture and Life Sciences.

Data Availability Statement

Not applicable.

Acknowledgments

The authors thank Fred Stevie for his help with biochar surface characterization. The characterization was performed in part at the Analytical Instrumentation Facility (AIF) at North Carolina State University, which is supported by the State of North Carolina and the National Science Foundation (award number ECCS-1542015). The AIF is a member of the North Carolina Research Triangle Nanotechnology Network (RTNN), a site in the National Nanotechnology Coordinated Infrastructure (NNCI).

Conflicts of Interest

The authors declare no conflict of interest.

References

  1. Koop, S.H.A.; Van Leeuwen, C.J. The challenges of water, waste and climate change in cities. Environ. Dev. Sustain. 2017, 19, 385–418. [Google Scholar] [CrossRef] [Green Version]
  2. von Braun, J. Bioeconomy—The global trend and its implications for sustainability and food security. Glob. Food Secur. 2018, 19, 81–83. [Google Scholar] [CrossRef]
  3. Fund, C.; El-Chichakli, B.; Patermann, C.; Dieckhoff, P. Bioeconomy Policy (Part II). Synopsis of National Strategies around World; German Bioeconomy Council: Berlin, Germany, 2018. [Google Scholar]
  4. Oni, B.A.; Oziegbe, O.; Olawole, O.O. Significance of biochar application to the environment and economy. Ann. Agric. Sci. 2019, 64, 222–236. [Google Scholar] [CrossRef]
  5. Wan, Z.; Sun, Y.; Tsang, D.C.W.; Khan, E.; Yip, A.C.K.; Ng, Y.H.; Rinklebe, J.; Ok, Y.S. Customised fabrication of nitrogen-doped biochar for environmental and energy applications. Chem. Eng. J. 2020, 401, 126136. [Google Scholar] [CrossRef]
  6. Enaime, G.; Baçaoui, A.; Yaacoubi, A.; Lübken, M. Biochar for Wastewater Treatment—Conversion Technologies and Applications. Appl. Sci. 2020, 10, 3492. [Google Scholar] [CrossRef]
  7. Kasera, N.; Kolar, P.; Hall, S.G. Nitrogen-doped biochars as adsorbents for mitigation of heavy metals and organics from water: A review. Biochar 2022, 4, 17. [Google Scholar] [CrossRef]
  8. Tang, D.; Lu, L.; Luo, Z.; Yang, B.; Ke, J.; Lei, W.; Zhen, H.; Zhuang, Y.; Sun, J.; Chen, K.; et al. Heteroatom-Doped Hierarchically Porous Biochar for Supercapacitor Application and Phenol Pollutant Remediation. Nanomaterials 2022, 12, 2586. [Google Scholar] [CrossRef]
  9. Cheng, B.-H.; Zeng, R.J.; Jiang, H. Recent developments of post-modification of biochar for electrochemical energy storage. Bioresour. Technol. 2017, 246, 224–233. [Google Scholar] [CrossRef]
  10. Cheng, F.; Li, X. Preparation and Application of Biochar-Based Catalysts for Biofuel Production. Catalysts 2018, 8, 346. [Google Scholar] [CrossRef] [Green Version]
  11. Sun, X.; Atiyeh, H.K.; Li, M.; Chen, Y. Biochar facilitated bioprocessing and biorefinery for productions of biofuel and chemicals: A review. Bioresour. Technol. 2020, 295, 122252. [Google Scholar] [CrossRef]
  12. Shafawi, A.N.; Mohamed, A.R.; Lahijani, P.; Mohammadi, M. Recent advances in developing engineered biochar for CO2 capture: An insight into the biochar modification approaches. J. Environ. Chem. Eng. 2021, 9, 106869. [Google Scholar] [CrossRef]
  13. Choudhury, A.; Lansing, S. Adsorption of hydrogen sulfide in biogas using a novel iron-impregnated biochar scrubbing system. J. Environ. Chem. Eng. 2021, 9, 104837. [Google Scholar] [CrossRef]
  14. Kamali, M.; Sweygers, N.; Al-Salem, S.; Appels, L.; Aminabhavi, T.M.; Dewil, R. Biochar for soil applications-sustainability aspects, challenges and future prospects. Chem. Eng. J. 2022, 428, 131189. [Google Scholar] [CrossRef]
  15. Wu, W.; Yang, M.; Feng, Q.; McGrouther, K.; Wang, H.; Lu, H.; Chen, Y. Chemical characterization of rice straw-derived biochar for soil amendment. Biomass Bioenergy 2012, 47, 268–276. [Google Scholar] [CrossRef]
  16. Graves, C.; Kolar, P.; Shah, S.; Grimes, J.; Sharara, M. Can Biochar Improve the Sustainability of Animal Production? Appl. Sci. 2022, 12, 5042. [Google Scholar] [CrossRef]
  17. Joseph, S.; Pow, D.; Dawson, K.; Mitchell, D.R.G.; Rawal, A.; Hook, J.; Taherymoosavi, S.; Van Zwieten, L.; Rust, J.; Donne, S.; et al. Feeding Biochar to Cows: An Innovative Solution for Improving Soil Fertility and Farm Productivity. Pedosphere 2015, 25, 666–679. [Google Scholar] [CrossRef]
  18. Ouyang, D.; Chen, Y.; Yan, J.; Qian, L.; Han, L.; Chen, M. Activation mechanism of peroxymonosulfate by biochar for catalytic degradation of 1,4-dioxane: Important role of biochar defect structures. Chem. Eng. J. 2019, 370, 614–624. [Google Scholar] [CrossRef]
  19. Hu, Y.; Chen, D.; Zhang, R.; Ding, Y.; Ren, Z.; Fu, M.; Cao, X.; Zeng, G. Singlet oxygen-dominated activation of peroxymonosulfate by passion fruit shell derived biochar for catalytic degradation of tetracycline through a non-radical oxidation pathway. J. Hazard. Mater. 2021, 419, 126495. [Google Scholar] [CrossRef]
  20. Wang, L.; Chen, L.; Tsang, D.C.W.; Guo, B.; Yang, J.; Shen, Z.; Hou, D.; Ok, Y.S.; Poon, C.S. Biochar as green additives in cement-based composites with carbon dioxide curing. J. Clean. Prod. 2020, 258, 120678. [Google Scholar] [CrossRef]
  21. Qin, Y.; Pang, X.; Tan, K.; Bao, T. Evaluation of pervious concrete performance with pulverized biochar as cement replacement. Cem. Concr. Compos. 2021, 119, 104022. [Google Scholar] [CrossRef]
  22. Liu, W.-J.; Jiang, H.; Yu, H.-Q. Development of Biochar-Based Functional Materials: Toward a Sustainable Platform Carbon Material. Chem. Rev. 2015, 115, 12251–12285. [Google Scholar] [CrossRef] [PubMed]
  23. Duan, X.; Sun, H.; Kang, J.; Wang, Y.; Indrawirawan, S.; Wang, S. Insights into Heterogeneous Catalysis of Persulfate Activation on Dimensional-Structured Nanocarbons. ACS Catal. 2015, 5, 4629–4636. [Google Scholar] [CrossRef]
  24. Uchimiya, M.; Chang, S.C.; Klasson, K.T. Screening biochars for heavy metal retention in soil: Role of oxygen functional groups. J. Hazard. Mater. 2011, 190, 432–441. [Google Scholar] [CrossRef] [PubMed]
  25. Xiao, Y.; Lyu, H.; Tang, J.; Wang, K.; Sun, H. Effects of ball milling on the photochemistry of biochar: Enrofloxacin degradation and possible mechanisms. Chem. Eng. J. 2020, 384, 123311. [Google Scholar] [CrossRef]
  26. Langley, L.A.; Fairbrother, D.H. Effect of wet chemical treatments on the distribution of surface oxides on carbonaceous materials. Carbon N.Y. 2007, 45, 47–54. [Google Scholar] [CrossRef]
  27. Kasera, N.; Hall, S.; Kolar, P. Effect of surface modification by nitrogen-containing chemicals on morphology and surface characteristics of N-doped pine bark biochars. J. Environ. Chem. Eng. 2021, 9, 105161. [Google Scholar] [CrossRef]
  28. Augoustides, V.; Kasera, N.; Kolar, P. Chemical characterization data of raw Loblolly pine bark nuggets. Chem. Data Collect. 2021, 33, 100727. [Google Scholar] [CrossRef]
  29. Zhu, Y.; Kolar, P. Adsorptive removal of p-cresol using coconut shell-activated char. J. Environ. Chem. Eng. 2014, 2, 2050–2058. [Google Scholar] [CrossRef]
  30. Usevičiūtė, L.; Baltrėnaitė, E. Methods for Determining Lignocellulosic Biochar Wettability. Waste Biomass Valorization 2020, 11, 4457–4468. [Google Scholar] [CrossRef]
  31. Gomes, H.T.; Miranda, S.M.; Sampaio, M.J.; Silva, A.M.T.; Faria, J.L. Activated carbons treated with sulphuric acid: Catalysts for catalytic wet peroxide oxidation. Catal. Today 2010, 151, 153–158. [Google Scholar] [CrossRef]
  32. Yin, W.; Zhang, W.; Zhao, C.; Xu, J. Evaluation of Removal Efficiency of Ni(II) and 2,4-DCP Using in Situ Nitrogen-Doped Biochar Modified with Aquatic Animal Waste. ACS Omega 2019, 4, 19366–19374. [Google Scholar] [CrossRef] [PubMed] [Green Version]
  33. He, X.; Hong, Z.-N.; Shi, R.-Y.; Cui, J.-Q.; Lai, H.-W.; Lu, H.-L.; Xu, R.-K. The effects of H2O2- and HNO3/H2SO4-modified biochars on the resistance of acid paddy soil to acidification. Environ. Pollut. 2022, 293, 118588. [Google Scholar] [CrossRef] [PubMed]
  34. Gao, Y.; Xu, S.; Yue, Q.; Ortaboy, S.; Gao, B.; Sun, Y. Synthesis and characterization of heteroatom-enriched biochar from keratin-based and algous-based wastes. Adv. Powder Technol. 2016, 27, 1280–1286. [Google Scholar] [CrossRef]
  35. Chen, W.; Fang, Y.; Li, K.; Chen, Z.; Xia, M.; Gong, M.; Chen, Y.; Yang, H.; Tu, X.; Chen, H. Bamboo wastes catalytic pyrolysis with N-doped biochar catalyst for phenols products. Appl. Energy 2020, 260, 114242. [Google Scholar] [CrossRef]
  36. Chen, H.; Han, X.; Liu, Y. Gaseous Hydrogen Sulfide Removal Using Macroalgae Biochars Modified Synergistically by H2SO4/H2O2. Chem. Eng. Technol. 2021, 44, 698–709. [Google Scholar] [CrossRef]
  37. Pap, S.; Bezanovic, V.; Radonic, J.; Babic, A.; Saric, S.; Adamovic, D.; Turk Sekulic, M. Synthesis of highly-efficient functionalized biochars from fruit industry waste biomass for the removal of chromium and lead. J. Mol. Liq. 2018, 268, 315–325. [Google Scholar] [CrossRef]
  38. Hong, N.; Cheng, Q.; Goonetilleke, A.; Bandala, E.R.; Liu, A. Assessing the effect of surface hydrophobicity/hydrophilicity on pollutant leaching potential of biochar in water treatment. J. Ind. Eng. Chem. 2020, 89, 222–232. [Google Scholar] [CrossRef]
  39. Amin, F.R.; Huang, Y.; He, Y.; Zhang, R.; Liu, G.; Chen, C. Biochar applications and modern techniques for characterization. Clean Technol. Environ. Policy 2016, 18, 1457–1473. [Google Scholar] [CrossRef]
Figure 1. Schematic diagram showing the preparation and characterization techniques of biochar samples.
Processes 10 02136 g001
Figure 2. IR Spectra of BC, APS-BC, H2O2-BC, H2SO4-BC, HNO3-BC, O3-BC.
Processes 10 02136 g002
Figure 3. Deconvolution of C1s spectra for all the biochar samples. C-1: sp2 hybridized carbon; C-2: C-O bonds; C-3: C=O bonds.
Processes 10 02136 g003
Figure 4. Deconvolution of O1s spectra for all the biochar samples. O-1: carbonyl and quinone; O-2: esters and anhydrides; O-3: ether-type oxygen in esters and anhydrides; and O-4: carboxylic oxygen.
Processes 10 02136 g004
Figure 5. Correlation between the difference in acidic-basic site concentration and pHpzc of biochar samples.
Processes 10 02136 g005
Figure 6. Correlation between the summation of O-1%, O-2%, O-4%, and pHpzc of biochar samples.
Processes 10 02136 g006
Table 1. Correlation of ethanol% with hydrophobicity index in MED test.
Ethanol PercentIndex of Hydrophobicity
00—Very hydrophilic
31—Hydrophilic
52—Slightly hydrophilic
113—Slightly hydrophobic
134—Moderate hydrophobic
185—Strongly hydrophobic
246—Very strongly hydrophobic
367—Extremely Hydrophobic
Table 2. The pH, pHpzc, and hydrophilicity of biochar samples.
SamplespHpHpzcHydrophobicity Index
BC6.45.12
H2SO4-BC1.882.30
O3-BC1.993.90–1
HNO3-BC2.432.051–2
H2O2-BC2.592.083
APS-BC2.634.16
Table 3. Concentration of acidic and basic sites in biochar samples.
SamplesAcidic Sites (µmol/g)Basic Sites (µmol/g)Difference (µmol/g)
BC917.84625.08292.76
H2SO4-BC4969.90307.374662.53
O3-BC1646.27297.511348.76
HNO3-BC4946.04350.984595.06
H2O2-BC1800.70437.761362.94
APS-BC1442.41428.571013.84
Table 4. Atomic composition of pristine and oxygen-enriched biochar samples.
SamplesC1s%O1s%
BC86.813.4
H2SO4-BC44.544.5
O3-BC57.842.2
HNO3-BC60.433.8
H2O2-BC69.530.5
APS-BC85.414.6
Table 5. Relative contents of C1s peaks in biochar samples obtained by XPS spectra.
SamplesC-1%C-2%C-3%
BC50.840.329.58
H2SO4-BC49.1634.2016.62
O3-BC47.9228.9323.14
HNO3-BC31.7341.6426.61
H2O2-BC45.1625.8428.98
APS-BC58.9632.388.64
C-1: sp2 hybridized carbon, C-2: C–O bonds, C-3: C=O bonds.
Table 6. Relative contents of O1s peaks in biochar samples obtained by XPS spectra.
SamplesO-1%O-2%O-3%O-4%
BC6.1633.2045.3715.25
H2SO4-BC5.3459.2023.3612.08
O3-BC13.2354.7225.476.56
HNO3-BC35.2432.5716.9015.26
H2O2-BC10.1747.9128.2213.67
APS-BC8.7728.4434.9727.80
O-1: carbonyl and quinone, O-2: esters, and anhydrides, O-3: C=O ether-type oxygen in esters, and anhydrides, O-4: carboxylic groups.
Publisher’s Note: MDPI stays neutral with regard to jurisdictional claims in published maps and institutional affiliations.

