Abstract
The calculation equations of pressure drop and solid flow rate are given in an intermittent countercurrent moving bed with multiple optimized structures. The flow fields are investigated by experimental methods under different conditions, e.g., ratio of position of the gas distributor to the bed width (rp = 0.5~1.5), gas superficial velocity (ug = 0~0.1591 m/s), solid outlet diameter (Do = 5~25 mm) and cone angle (α = 0~60°). It is found that when rp ≥ 1.0, the flow field in the bed is little affected by rp. Flow patterns are divided into three modes: continuous discharging, intermittent discharging (synchronous, asynchronous) and particle bridging. During continuous discharging, the calculation formula of the solid flow rate, which is closely related to Do and gas–solid slip velocity vslip, is established by referring to the modified De Jong and Beverloo formulas, and its error ≤ ±12.5%. The pressure drop of the total bed consists of the pressure drops of the granular bed and the solid outlets, which are affected by Do, vslip and α; it is built by referring to the Ergun formula, and its error ≤ ±17.0%. As the solid flow rate and pressure drop influence each other through vslip, an iterative algorithm is proposed to enhance the computation accuracy.
1. Introduction
In a gas–solid countercurrent moving bed, the gas and solid flow reversely. Generally, the gas completes the reaction or filtration after contact; the solid, i.e., catalyst or filter medium, loses its activity gradually and flows downward due to gravity in the form of a particle layer [1]. Therefore, a countercurrent moving bed has the advantages of high gas capacity, high solid holdup and low solid back mixing. It has been widely used in many processes, e.g., catalytic reforming, gasoline desulfurization, ethylene polymerization, granular coal combustion and high-temperature dust removal [2,3].
The solid flow rate and pressure drop are two major parameters in the countercurrent moving bed and have a close correlation to the gas/solid residence times and the bed efficiency [4,5,6]. Nowadays, many improvement methods are employed to enhance the bed efficiency, e.g., adding multiple solid outlets, gas distributors, cone structures and internal components. Multiple solid outlets can improve the uniformity of the solid velocity and residence time distribution. However, under a certain solid flow rate, the size of each solid outlet becomes small when multiple ports are used. Particle bridges appear more easily [7,8,9]. A gas distributor distributes the gas evenly throughout the whole section before contacting the gas and solid [10]. By introducing a cone structure, the particle accumulation dead zone is reduced [11]. However, the flow field is mainly studied in the silos with cone structure rather than the countercurrent moving bed. In the moving bed, the influence of the gas phase on the flow field should be considered and is different from that in the silos. An internal component can improve the uniformity of the solid velocity distribution [12,13,14]. It is prone to wear and hard to maintain, which is not discussed here. However, the coupled influences of these improvements on the solid flow rate and pressure drop remain unclear and still need further studies.
The solid flow rate and pressure drop are also affected by the solid flow patterns in the intermittent countercurrent moving bed, such as continuous discharging and bridging, which directly affect the gas–solid flow field. For instance, when a bridge occurs, the particles form a force chain near the solid outlets, which stops the particles from moving. Moreover, previous studies [15,16,17,18] have shown that continuous discharging occurs under large solid outlet sizes and small gas flow rates. The solid flow rate is affected by the solid outlet structure and gas flow rate. It remains almost unchanged with the particle height when it is high enough. However, the solid flow patterns in a bed with multiple solid outlets are rarely discussed. In addition, the pressure drop of the bed consists of the pressure drops of the granular bed and solid outlets. However, the pressure drop equations neglect the cone angle, which influences the calculation accuracy. The pressure drop may change in beds with gas distributors and multiple solid outlets. Meanwhile, considering that both the solid flow rate and the pressure drop have a close correlation to the gas–solid slip velocity, these two parameters cannot be determined by one equation accurately, and an iterative algorithm is needed here.
Considering that the particle height changes in the intermittent type, the flow laws in the intermittent bed are also applicable to the continuous bed. Thus, in this paper, a set of intermittent countercurrent moving beds with two solid outlets is set up. The gas and solid flow fields are studied by experimental and theoretical methods under different conditions, e.g., the ratio of the bin position of the gas distributor to the bed width, gas superficial velocity, solid outlet diameter and cone angle. The calculation formulas of both the solid flow rate and pressure drop are established and are anticipated to provide a reference for the operation and structural optimization of a countercurrent moving bed.
2. Experimental Setup
2.1. Experimental Device
As shown in Figure 1, particles are first accumulated in the top bin. Before the experiment, the butterfly valve is opened, the particles enter the moving bed from the top bin, and the initial particle height is reached. During the experiment, particles flow out of the bed through the solid outlets due to gravity without the addition of particles.
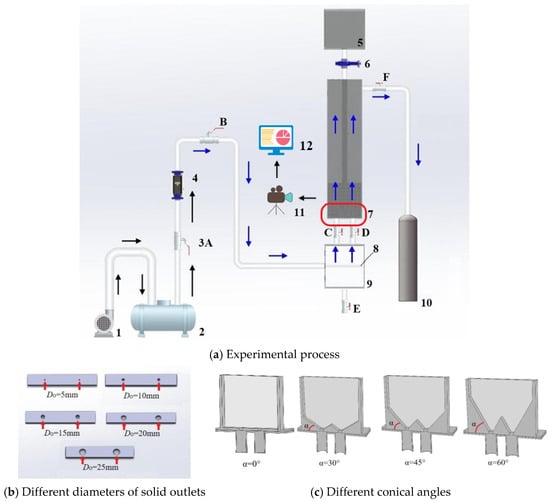
Figure 1.
Schematic diagram of experimental process and device. ((b,c) correspond to the zone marked in red in (a), where the bed has a width equal to 240 mm). 1—blower; 2—buffer tank; 3—ball valves (A, B, C, D, E, F); 4—rotameter; 5—top silo; 6—butterfly valve; 7—moving bed; 8—gas distributor; 9—bottom silo; 10—bag filter; 11—camera.
The gas, which is provided by the blower, enters the bottom bin after passing through the buffer tank and the rotameter. After flowing upward through the moving bed, the gas is discharged into the atmosphere through the bag filter. In this study, the ball valves A, B, C, D and F are opened, and the ball valve E and butterfly valve 6 are closed. At this time, the flow directions of gas and particles are opposite.
The bed is surrounded by plexiglass panels, forming an internal space with a height of 0.8 m, width of 0.24 m and thickness of 0.04 m. Two solid outlets are set at the bottom of the bed, whose horizontal positions are x/L = 1/4 and 3/4. x represents the horizontal position and L represents the width of the moving bed. To ensure the similarity of the solid flow rate in the two solid outlets, the minimum allowable position of the gas distributor should be first investigated in the bed.
The height of the bottom silo is 500 mm, which is larger than 1.5 times the bed width. The gas distributor is a tube with many circular openings on one side. The inner diameters of the tube and openings are 11 mm and 7 mm, respectively. The length of the tube equals the bed width. The gas is injected laterally, as shown in Figure 1a.
2.2. Materials
The gas is air at room temperature and atmospheric pressure. The solid is compacted spherical inert alumina particles with an average diameter of 1.28 mm. The particle size distribution is shown in Figure 2. The bulk density is 1330 kg/m3, the bed voidage is 0.44, the particle circularity is nearly equal to 1.0, the repose angle of particles is 26.7° and the friction angle with the plexiglass is 23°.
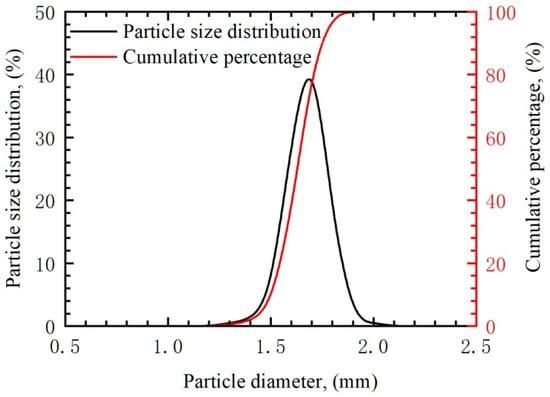
Figure 2.
Particle size distribution and cumulative percentage.
In this paper, the effects of different conditions, e.g., the ratio of the position of the gas distributor to the bed width (rp = 0.5~1.5), gas superficial velocity (ug = 0~0.1591 m/s), solid outlet diameter (Do = 5~25 mm) and cone angle (α = 0~60°), on the gas–solid flow field are mainly investigated.
The gas velocity at the atmospheric conditions is needed. However, considering that the actual temperature and pressure vary with time, the actual gas velocity is different from the gas velocity at atmospheric conditions. In this paper, the actual gas velocity is calculated by Equation (1) according to the gas velocity at the atmospheric conditions, actual temperature and pressure. In particular, Equation (1) is derived from the ideal gas equation, pV = nRT. In particular, ug is the superficial gas velocity, which can be calculated by Equation (1). Qg is the conversion value at room temperature and atmospheric pressure, which can be calculated by Equation (1) according to the real gas flow rate Q. In addition, to ensure the accuracy of the experimental data, three repeated tests were carried out.
2.3. Apparatus and Methods
The gas flow field is evaluated by the gas flow rate and pressure. The gas volume is adjusted by a glass rotameter with a range of 0.25~6 m3/h, and its time variation is recorded by a camera. The pressure is measured by a CGYL-300B micro differential pressure transmitter with a range of 0~5 kPa, and the error was within ±25%. The signal of 4~20 mA, produced by the acquisition box, is changed to the pressure value in the computer. The time variation of pressure is also recorded.
In the bed, 9 pressure measuring points are arranged. As shown in Figure 3, seven measuring points (y/H = −0.5, −0.25, −0.025, 0.025, 0.08, 0.25 and 0.5) are set at the horizontal position of x/L = 0.25, and four measuring points are set above and below the solid outlets (x/L = 0.25 and 0.75, y/H = −0.025 and 0.025), which have two overlapping measuring points. y is the axial height and H is the height of the moving bed.
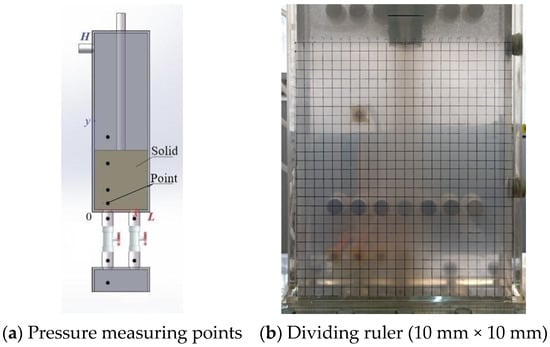
Figure 3.
Schematic diagram of measuring positions (nine measuring points (x/L = 0.25, y/H = −0.5, −0.25, −0.025, 0.025, 0.08, 0.25 and 0.5; x/L = 0.75, y/H = −0.025 and 0.025)).
The solid flow field is mainly evaluated by the solid flow pattern and solid flow rate. The solid flow pattern is represented by the gas–solid flow phenomena recorded by the camera. Within a certain time interval, with the help of the 10 mm×10 mm dividing ruler shown in Figure 3b, the volume change of particles can be obtained by GetData Graph Digitizer software. The solid flow rate can be computed accordingly.
3. Results and Discussion
To improve the uniformity of the solid velocity distribution in the bed with two solid outlets, the left and right areas should be symmetrical in the bed. Except for the symmetrical structure of the two areas, the gas flow rate should be the same in each solid outlet.
Therefore, a gas distributor is added to the bottom bin. Besides the optimal sizes, the position of the gas distributor should be determined. Afterward, the influences of gas superficial velocity ug, diameter of solid outlets Do and cone angle α on the flow field are investigated successively. For better analysis, the reference operating conditions ug = 0, Do =15 mm and α = 0° are taken.
Considering the stability and uniformity of the gas flow, the opening ratio of the gas distributor was calculated according to the stability method of the pressure drop, which is calculated by Equation (2). The pressure drop of the distribution plate Δpa is taken as 10% of the bed pressure drop. Through calculation, the opening ratio of the gas distributor ranges from 1.2% to 1.8%, and 1.6% is selected in this paper [19].
The position of the gas distributor may also affect the flow field. The ratio of the position of the gas distributor to the bed width rp is introduced; it denotes the ratio of the distance between the gas distributor and solid outlets to the bed width. Under a large rp, spaces are wasted due to the high height of the bottom bin. Under a small rp, the gas may have a great impact on the wall, and a violent vortex is produced in the bottom bin. In this paper, the flow fields under different ratios rp = 0.5, 1.0 and 1.5 are studied.
As shown in Figure 4, compared to the ratios of the position of the gas distributor to the bed width of rp = 1.0 and 1.5, the pressure drop value is large and the variation rate is relatively small when rp = 0.5. This is because when the distance between the gas distributor and the solid outlets becomes small, the particles are likely to be prevented from falling downward by the impact of the high-speed gas from the gas distributor or the violent vortex in the bin. Thus, the solid flow rate and pressure drop become higher when rp = 0.5 than when rp = 1.0 and 1.5. The gas flow fields are almost the same when rp = 1.0 and 1.5.
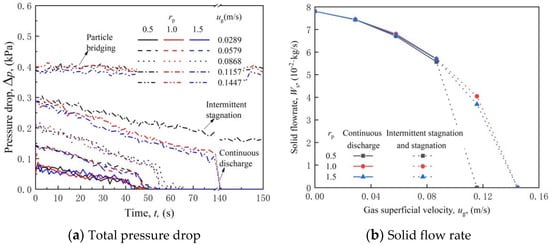
Figure 4.
Time variations of total pressure drop and solid flow rate under different ratio of position of gas distributor to bed width rp and gas superficial velocity ug conditions (D0 = 15 mm, α = 0°).
With increasing gas superficial velocity ug, the upward force by the gas phase on the particles increases. Under a small or large ug, there is little difference between the solid flow fields under different rp values. However, when the particle is at the turning point of continuous discharging and stagnation, the solid flow field under rp = 0.5 is different from that under rp = 1.0 and 1.5. This is because the particles have difficulty moving downward due to the impact of the high-speed gas or the violent vortex in the bottom bin. Figure 4 shows the solid flow rate under different ug and rp values. In particular, the solid flow rate is taken as the average value during the continuous discharging stage, as it has been proven to be almost unchanged during this stage [20].
In conclusion, when rp = 1.0, the gas and solid flow fields are approximately the same as those when rp = 1.5 in this paper. Thus, rp = 1.0 is chosen in the following study.
3.1. Flow Pattern under Different Conditions
The gas and solid flow fields are influenced by many conditions. For instance, the gas superficial velocity ug has a direct effect on the flow fields in a countercurrent moving bed [21,22]. The range ug =0~0.1591 m/s is chosen here. The diameter of the solid outlets Do has a great effect on the flow field. To avoid particle bridging, Do is generally greater than 1~3 times the particle diameter [23,24]. To ensure a sufficient solid residence time, Do should not be too large. Thus, the solid outlet diameter Do values of 5, 10, 15, 20 and 25 mm were selected for the study. To avoid the existence of a particle dead zone, a cone structure is set at the bottom of the bed. In this paper, the flow fields under different cone angles α =0°, 30°, 45° and 60° are investigated.
With an increase in ug or decrease in Do, the flow pattern can be divided into three modes in a moving bed: continuous discharging, intermittent discharging and particle bridging, which can be seen in Figure 5. The time variations of both the pressure drop and solid flow rate are different in each mode. In addition, the particle flow pattern changes little with cone angle α, which is shown in Figure 6. With the passage of time, the shape of the surface of the granular bed changes from “-” to “V” and “W” at different cone angles. However, when α grows, the size of the particle dead zone decreases until it disappears. During the discharging process, the size of the particle dead zone is small when α =30°, while it becomes zero when α = 45° and 60°. At the end of discharging, there are residual particles when α = 0°, while there are no residual particles when α =30~60°. This shows that the introduction of a cone structure can indeed reduce the size of the particle dead zone. The cone angle α = 45° is recommended here.
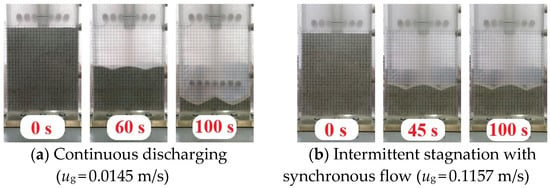
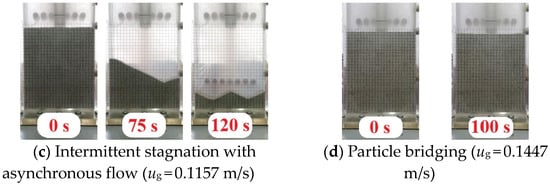
Figure 5.
Different flow patterns under different gas superficial velocities (Do = 15 mm, α = 0°).
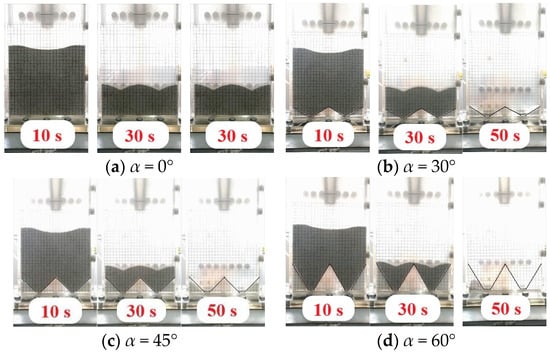
Figure 6.
Particle flow pattern under different cone angles.
3.1.1. Continuous Discharging
When the gas superficial velocity ug is low or the diameter of the solid outlets is large, the pressure drop presents a slow, approximately linear decrease with time and then suddenly reduces to zero; with increasing ug or decreasing Do, the time variation of pressure drop change decreases. This is because, under a small ug or large Do, the particle height decreases as the particles continue to fall downward. The solid flow rate is almost stable when the particle height reaches a certain value [25]. However, when the particle height is extremely low, the solid flow pattern transitions from a full to a non-full tube flow state gradually in discharging tubes near the solid outlets. The pressure drops of the granular bed and solid outlets decrease suddenly.
3.1.2. Intermittent Discharging
Under a certain diameter of the solid outlets Do, when the gas superficial velocity ug reaches a certain value, the pressure drop presents an approximately linear decrease with time at first (Figure 4) and then remains almost unchanged with time. The solid flow rate remained almost stable at first and then stagnated. By observing the numerical change of the rotameter, it is found that the gas flow rate or ug changes little when full tube flow appears due to the high pressure drop of the solid outlets. The pressure drop of the bed is still greater than zero.
As the particle height decreases, the inter-particle force remains almost unchanged and then decreases [21,26]. For the particles, the combined forces of gravity, wall–particle friction and inter-particle friction decrease. When these forces equal the pressure caused by the gas, the particles stop flowing downward. In the experiment, the particles present continuous discharging at first and then intermittent discharging or stagnation. In the bed with two solid outlets, there are two stagnation phenomena, as shown in Figure 5b,c.
i. The particle flow state changes synchronously in the two solid outlets. The occurrence of this phenomenon indicates that the gas distributor indirectly gives a uniform gas velocity distribution.
ii. The particle flow state changes asynchronously in the two solid outlets. The particle heights are different in the two solid outlets initially (i.e., the height of the particle level on the left side is higher than that on the right side, or the height of the particle level on the right side is higher than that on the left side) but become the same eventually. This is because the discreteness and discontinuity characteristics of particles make it difficult for them to remain completely the same in the two solid outlets.
However, when the particle heights are different, the gas is likely to flow through the solid outlet, which has a lower particle height due to its small gas resistance. In this solid outlet, both the solid flow rate and the particle height decrease, and their reductions are less than those in the other solid outlet. This makes the particle heights become the same in the two solid outlets when stagnation occurs, which also denotes that the gas distributor indirectly gives a uniform gas velocity distribution.
3.1.3. Particle Bridging
When the gas superficial velocity ug is high or the diameter of the solid outlets Do is low, the pressure drop hardly changes with time, and particles cannot fall downward (Figure 4 and Figure 5d). This is because the pressure caused by the gas is so high that it balances with the combined forces of gravity, wall–particle friction and inter-particle friction. The particles remain stagnant, which makes the flow fields almost unchanged with time. In addition, the critical gas superficial velocity is found to be affected by the particle accumulation degree and device vibration. For example, when the solid outlet diameter is 5 mm, 10 mm and 15 mm, the minimum apparent gas velocity required for particle bridging is 0 m/s, 0.0868 m/s and 0.1157 m/s, respectively. When the solid outlet diameter is 20 mm and 25 mm, the gas velocity required for particle bridging is more than 0.1591 m/s.
Obviously, continuous discharging is the optimal flow state in the countercurrent moving bed. Subsequently, the gas–solid flow characteristics, especially the solid flow rate and pressure drop, are investigated under different conditions during continuous discharging.
3.2. Solid Flow Rate under Different Conditions
3.2.1. Variation Law of Solid Flow Rate
Figure 7 shows that the solid flow rate is affected by both the gas superficial velocity ug and the diameter of solid outlets D0. Under a small ug and large D0, the particles fall downward easily. The solid flow rate increases obviously.
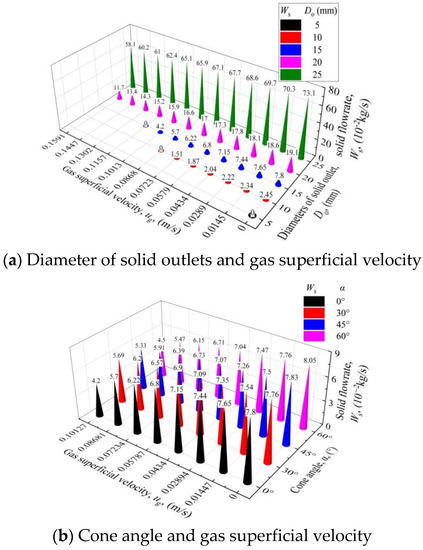
Figure 7.
Solid flow rates under different conditions: diameter of solid outlets, cone angle and gas superficial velocity.
With the passage of time, the solid flow rate remains almost stable at first and then decreases to zero, as shown in Figure 7a. These two stages correspond to the time variation of the pressure drop. For the particles, the pressure caused by the gas is always less than the combined forces of gravity, wall–particle friction and inter-particle friction. The particles fall continuously.
In a countercurrent moving bed, when the gas superficial velocity increases, the solid flow rate is basically unchanged at first and is then reduced, as shown in Figure 7. According to the Ergun Equation (3) [27], when the gas superficial velocity is small, the gas–solid slip velocity vsl is small, and the local pressure gradient near the solid outlet is almost unchanged. With the solid flow rate formula given by Equation (4) [25], the solid flow rate varies little. In contrast, when the gas superficial velocity is large, the solid flow rate decreases greatly.
Under different D0 values, the solid flow rate can be computed by the Beverloo formula in Equation (4) when ug = 0 [28]. This equation considers that the solid flow rate is proportional to the 2.5 power of D0. In addition, with increasing ug or decreasing D0, the solid flow rate drops suddenly under certain operating conditions. This sudden drop in the flow rate occurs because the particles present discreteness and discontinuity characteristics, which are different from common fluid flow.
With an increase in the cone angle α, the initial particle accumulation amounts in the moving bed decrease. The gas flow cross-section becomes narrow, which increases the pressure drop. When α grows, the solid flow rate decreases slightly due to the increase in pressure drop. Meanwhile, the higher the gas superficial velocity is, the larger the gas–solid slip velocity is and the more obvious the change in the solid flow rate is, as shown in Figure 7.
3.2.2. Calculation Formula of Solid Flow Rate
According to the above analysis, during the continuous discharge stage, the solid flow rate is greatly affected by the gas superficial velocity ug and diameter of solid outlet Do. It has little relationship with the cone angle.
During the continuous discharging flow pattern, both the solid flow rate and the pressure drop near the solid outlets vary little with time. Thus, the condition corresponding to the initial time is used here.
When ug = 0, the constants Co and k in the Berverloo Equation (4) [28] are fitted by experimental data to be 0.6065 and 2.3208, respectively, which are in the recommended ranges, i.e., Co = 1~3 and k = 1~3 [25].
When ug > 0, the solid flow rate can be calculated by Equation (5), which considers the pressure drop of the solid outlets, similar to the modified De Jong formula [29]. The constant Cd is then fitted by experimental data and determined to be −0.1619. The relative error of the solid flow rate between the experimental and calculation results is less than ±12.5%, which is shown in Figure 8.
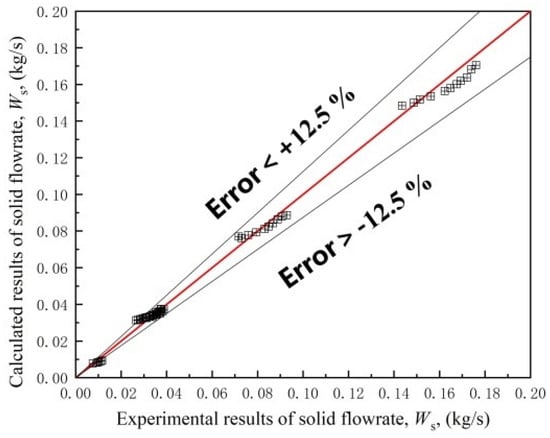
Figure 8.
Comparison of experimental and theoretical solid flow rates.
3.3. Pressure Drop under Different Conditions
Particle bridging always occurs when the diameter of the solid outlet Do = 5 mm in this study. Thus, the gas flow field is analyzed only when Do = 10, 15, 20 and 25 mm. Meanwhile, the time variation of the gas flow field is mainly affected by the change in the particle height, which can be reflected by the solid flow rate. Ignoring the influence of discharging time, only the initial time of t = 0 is discussed here.
3.3.1. Pressure Axial Distribution
The discharging process can be divided into three stages: initial, middle and late discharging stages. In the initial discharging stage, the surface of the granular bed was flat and had the shape of “-”. In the middle discharging stage, the center of the granular bed exhibited depression with the shape of a “V”. In the late discharging stage, two depressions appeared on the surface of the granular bed near the solid outlets, and the bed had the shape of a “W”.
Figure 9 shows that the pressure drops of both the bottom bin and discharge tubes are relatively small, with axial position y/H < 0. The pressure drop of the bed was mainly produced by gas flowing through the solid outlets and granular bed. In particular, the pressure drop of the solid outlets, i.e., the pressure difference between y/H = −0.025 and 0.025, decreases slightly at first and then increases when ug grows. This is because the pressure drop is also related to the gas–solid slip velocity (Figure 10). In the countercurrent moving bed, the gas–solid slip velocity in the particle bed and solid outlets is the sum of the gas and particle velocities, which can be computed by Equations (6) and (7).
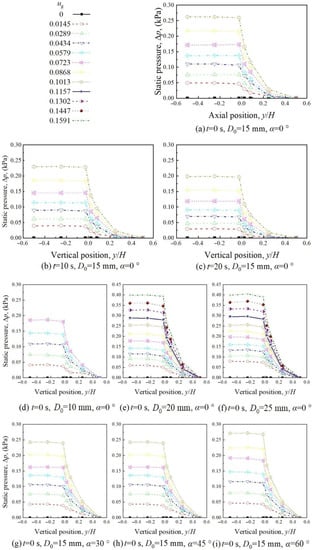
Figure 9.
Pressure axial distribution under different conditions: diameter of solid outlets, cone angle and gas superficial velocity.
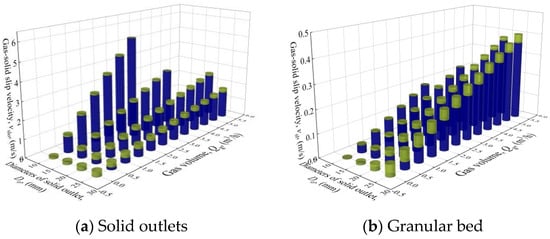
Figure 10.
Gas–solid slip velocity under different conditions.
With increasing ug, the pressure decreases slightly at first and then increases everywhere in the bed. This is because the total pressure drop of the bed has a close relationship to the gas–solid slip velocity, which first decreases and then increases when ug grows (Figure 10). Meanwhile, the pressure decreases with time due to the reduction in the particle height. In addition, for the gas flowing upward through the granular bed in the countercurrent moving bed, the pressure decreases with the axial position y/H. Meanwhile, during the continuous discharging state, both the gas and solid flow rates remain almost unchanged, which makes the gas–solid slip velocity change little with time. Thus, the pressure drop of the solid outlets changes little with time. Similarly, the pressure drop of the granular bed also decreases slightly at first and then increases when ug grows due to the variation of the gas–solid slip velocity. However, it decreases with time due to the reduction in the particle height. Under high ug, the time variation of the pressure drop of the granular bed is relatively small. This is because the decrease in the particle height becomes slow as the particles have difficulty falling downward under high ug. During the discharging process, when the particle height y/H ≥ 0.25, the pressure is approximately linear with the axial position when y/H = 0.025~0.25. When y/H < 0.25, the pressure change rate with an axial position of y/H = 0.025~0.08 is significantly higher than that of y/H = 0.08~0.25.
With increasing Do, in the composition of the total pressure drop of the bed, the proportion of the pressure drop of the granular bed increases while the pressure drop of the solid outlets decreases. This is because the real gas velocity is almost the same in the granular bed but decreases in the solid outlets. Meanwhile, the real solid velocity has a greater increase in the granular bed than in the solid outlets. As the sum of the real gas and solid velocities, the gas–solid slip velocity, which has a positive correlation with the pressure drop, has a greater increase in the granular bed than in the solid outlets.
When α grows, the pressure tends to increase slightly below the axial position of the cone structure, which is caused by the slight increase in the gas–solid slip velocity due to the decrease in the gas flow cross-section. The pressure changes little above the axial position of the cone structure, which is caused by the small variation in the gas–solid slip velocity. This can also be used to explain why the pressure in the granular bed is little affected by α.
3.3.2. Variation Law of Pressure Drop
Figure 11 shows that during the continuous discharging state, the total pressure drop of the bed presents an approximately linear decrease with time firstly and then abruptly decreases until it reaches zero. The inter-particle force stays almost unchanged at first and then decreases when the particle height decreases [30,31,32]. Thus, with a high particle height at the beginning, the solid flow rate stays unvaried. The time variation of the total pressure drop is relatively stable. With a low particle height afterward, the decrease in the inter-particle force occurs, as does the transition flow from full to non-full tube flow in the discharging tubes. This reduces the pressure drop abruptly. Without particles in the discharge tube, the total pressure drop of the bed becomes approximately zero considering the large cross-sectional area of gas. Meanwhile, when the gas superficial velocity ug increases, the pressure drop increases while its time variation decreases. This is mainly due to that the higher ug is, the harder the particle falls downward, and the slower the particle height decreases. A smaller change in the pressure drop is observed. Along with the large gas–solid slip velocity, both the pressure drop and particle height have large values under a large ug.

Figure 11.
Time variation of total pressure drop under under different conditions: diameter of solid outlets, cone angle and gas superficial velocity.
As shown in Figure 11, under a small gas superficial velocity ug, the pressure drop tends to increase slightly rather than decrease when the diameter of the solid outlet Do grows at the initial time. The reason is that the pressure drop is mainly composed of the pressure difference between the solid outlets and granular bed, which has a positive correlation to the gas–solid slip velocity rather than the gas superficial velocity. When Do grows, the solid flow rate increases. At the same ug, the gas–solid slip velocity grows in the granular bed. In solid outlets, the real gas velocity decreases while the real solid velocity increases, which makes the gas–solid slip velocity grow under a small ug. At the same ug, the solid flow rate grows with an increase in Do. This increases the time variations of both particle height and pressure drop.
Figure 11 indicates that the discharging time, i.e., the time for the pressure to change to nearly zero, changes little with cone angle α. This is because, on the one hand, the slight decrease in the solid flow rate will prolong the discharging time. However, the influence is rather limited. On the other hand, the initial particle accumulation amounts decrease by approximately compared to those in the bed with α = 0°. This will shorten the discharging time slightly. When α grows, the total pressure drop of the bed tends to increase slightly. This is because the gas–solid slip velocity, the sum of gas and particle velocities, increases with the reduction in the gas flow cross-sectional area. The total pressure drop of the bed increases based on the Ergun Equation (3). However, as there is little gas flowing through the original particle dead zone when α = 0°, the increase in the pressure drop is rather limited. When the gas superficial velocity increases, the change becomes more obvious. During the non-full tube flow state in the discharge tubes, the variation in the pressure drop increases abruptly. The time variation of the pressure drop increases when α grows. This is because with a large α, the pressure drop changes little at the beginning of the non-full tube flow, while the discharging time of the non-full tube flow decreases due to the small particle accumulation amounts.
3.3.3. Calculation Formula of Pressure Drop
From the above analysis, it is known that the total pressure drop of the bed is mainly composed of the pressure drops of the solid outlet and granular bed, which have a close correlation to the local gas–solid slip velocity.
The pressure drop of the granular bed is generally calculated by the Ergun equation. However, considering some uncertain factors, e.g., large bed voidage caused by the near-wall effect, particle roundness and manufacturing error of the bed, the coefficient C1 is added before the solid outlet section area, as in Equation (8). Based on the experimental data, i.e., the pressure difference between y/H = 0.025 and 0.5 (t = 0 s), C1 is determined to be 1.1567. The relative error between experimental and calculated values is less than ±17.0%, as shown in Figure 12b.
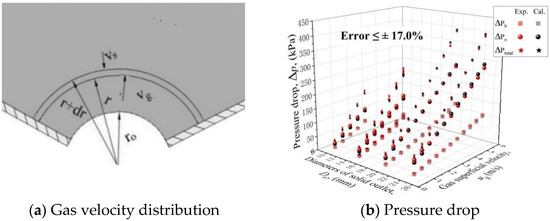
Figure 12.
Gas velocity distribution near the solid outlets in the bed with cone structure and the comparison of experimental and theoretical pressure drop results.
The pressure drop of the solid outlet is the sum of frictional and local resistances, i.e., Δpo = Δpo1 + Δpo2. The frictional resistance is caused by the gas flowing through the particles, which can also be calculated by the derived Ergun equation. Similar to what is shown in Figure 12a, the gas presents a hemispherical symmetrical distribution above the solid outlet. According to [33,34], the frictional resistance equals the radial pressure change, which is obtained by the calculus of the Ergun equation from the radius of r0 to infinity. The frictional resistance becomes the first term in Equation (9). The local resistance is caused by the variant of the gas flow cross-section [35,36]. In Equations (10) and (11), the effect of the cone angle is taken into the derived Ergun equation. Compared to Equation (9), Equation (12) takes into account the influence of the cone angle. The area of the gas flow cross-section changes under different cone angles, which causes the limits of the integral to be different. The pressure drop of the solid outlet can be calculated by Equation (12). Considering some uncertain factors, e.g., large bed voidage caused by the near-wall effect, particle roundness, manufacturing error of the bed and derivation error, the coefficients C3, C4, C5 and ζ are introduced. According to experimental data, i.e., the pressure difference between y/H = −0.025 and 0.025, C3, C4, C5 and ζ are determined to be 0.0296, 8 × 10⁻³, −0.201 and −8.798 respectively. The total pressure drop of the bed can then be calculated by Equation (13). The theoretical values are calculated by Equation (13) and compared to the experimentally measured pressure drop.
3.4. Iterative Algorithm of Solid Flow Rate and Pressure Drop
As shown in the Figure 13, the solid flow rate and the pressure drop in the countercurrent intermittent moving bed can be calculated by iterative algorithm. First, the initial solid flow rate can be obtained when the gas superficial velocity equals zero according to Equation (5). Next, the pressure drops of the bed, solid outlet and granular bed can be computed by Equations (9)–(13). The solid flow rate can be renewed by the pressure drop of the solid outlet according to Equation (5). After repeated iterative calculation, the solid flow rate and pressure drop in the moving bed can be determined.
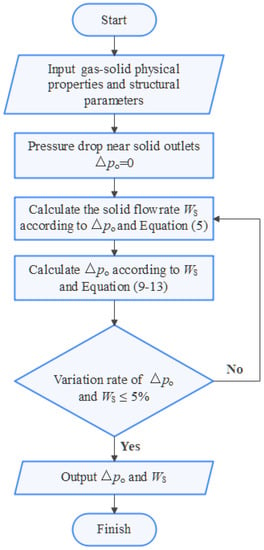
Figure 13.
Illustration of iterative algorithm.
In practical applications, the gas residence time tg ≈ Ahε/Qg is a function of the gas flow rate, particle height, particle properties and bed structure. The solid residence time ts ≈ Aρsh (1 − ε)/Ws is a function of the solid flow rate, particle height, particle properties and bed structure. In addition, energy consumption is the focus of practical applications, and it has a close correlation with the pressure drop of the bed. Therefore, the residence time and pressure drop can be predicted more easily according to solid flow rate and pressure drop, which is anticipated to provide a reference for the operation and structural optimization of countercurrent moving beds.
4. Conclusions
In an intermittent countercurrent moving bed with multiple solid outlets, a gas distributor and a cone structure, the gas–solid flow characteristics were first investigated by experimental methods under different conditions, e.g., ratio of the position of the gas distributor to the bed width, gas superficial velocity, solid outlet diameter and cone angle. The calculation equations for pressure drop and solid flow rate were then obtained.
(1) The opening ratio of the gas distributor was calculated by the stability pressure drop method. Considering both the gas–solid flow fields and the volume of the bottom bin, the ratio of the position of the gas distributor to the bed width rp was determined to be 1.0 in this paper.
(2) Three flow patterns appeared in the bed successively with increasing gas superficial velocity or decreasing diameter of solid outlets: continuous discharging, discontinuous discharging and particle bridging. In particular, discontinuous discharging consists of synchronous and asynchronous modes in the bed with two solid outlets. Through analysis, the solid flow rate and pressure drop of the bed were determined to influence each other by the gas–solid slip velocity. The transition of the flow pattern has little correlation to cone structure, which can decrease the areas of the solid dead zone.
(3) During the continuous discharging state, the solid flow rate stays almost constant at first and then decreases. Moreover, the solid flow rate grows with the increase in the diameter of solid outlets or the decrease in the gas superficial velocity. It changes little with the cone angle. The solid flow rate formula was proposed by referring to the modified De Jong and Beverloo formulas, and its calculation error was within ±12.5%. According to the pressure axial distribution, the pressure drop of the bed consists of the pressure drops of the granular bed and the solid outlets. The pressure drop has a positive correlation with the gas–solid slip velocity but not the gas superficial velocity or diameter of solid outlets. The calculation formulas of the pressure drop of the total bed, the granular bed and solid outlets were proposed by referring to the Ergun formula, and the error was within ±17.0%.
(4) An iterative algorithm was given by repeated iterative calculation of the solid flow rate and pressure drop. Thus, in a bed with combined improvements of multiple solid outlets, a gas distributor and a cone structure, both solid flow rate and pressure drop can be determined, which is anticipated to provide a reference for the operation and structural optimization of countercurrent moving beds.
Author Contributions
Conceptualization, R.W. and D.W.; methodology, Q.W.; software, Q.W.; validation, Q.W., R.W. and M.T.; investigation, B.H.; resources, Z.Z.; data curation, Z.Z.; writing—original draft preparation, Q.W.; writing—review and editing, S.Z.; visualization, Q.W.; supervision, R.W.; project administration, R.W.; funding acquisition, R.W. All authors have read and agreed to the published version of the manuscript.
Funding
This research was funded by [State Key Laboratory of Heavy Oil Processing] grant number [No. SKLOP201903002].
Acknowledgments
This work was supported by the Natural Science Foundation of Hebei Province (B2021202022), China Postdoctoral Science Foundation (2020M670614) and Natural Science Foundation of Hebei Province (B2021202002).
Conflicts of Interest
The authors declare no conflict of interest.
Nomenclature
| A | Cross-sectional area of granular bed, m2 |
| A0 | Cross-sectional area of solid outlet, m2 |
| C0C1C3C4C5Cd | Coefficients, − |
| C2 | Inertial resistance coefficient, kg/m4 |
| Ca | Velocity coefficient, − |
| Do | Diameter of solid outlets, m |
| dp | Average particle diameter, mm |
| g | Gravity acceleration, m/s2 |
| h | Height of moving bed, m |
| k | Coefficient, − |
| p | Pressure, Pa |
| p0 | Atmospheric pressure, Pa |
| Δp | Total pressure drop of bed, Pa |
| Δpa | Pressure drop of gas distributor, Pa |
| Δpb | Pressure drop of granular bed, Pa |
| Δpo | Pressure drop of solid outlets, Pa |
| Δpo1 | Gas resistance of solid outlets, Pa |
| Δpo2 | Local resistance of solid outlets, Pa |
| Q | Real gas flow rate, m3/h |
| Qg | Gas volume flow, m3/h |
| r | Radial distance, m |
| r0 | Radius of solid outlets, m |
| rp | Ratio of position of gas distributor to bed width, − |
| S | Surface area of spherical crown, m2 |
| t | Time, s |
| ts | Solid residence time, s |
| tg | Gas residence time, s |
| T | Real temperature, °C |
| T0 | Room temperature, °C |
| v | Fluidization velocity, m/s |
| vk | Velocity in the gas distributor, m/s |
| vgvs | Gas and solid velocity in granular bed, m/s |
| vsl | Gas–solid slip velocity in granular bed, m/s |
| vgovso | Gas and solid radial velocity in solid outlets, m/s |
| vslo | Gas–solid slip velocity in solid outlets, m/s |
| vgrvsr | Gas and solid radial velocity near solid outlets, m/s |
| vslr | Gas–solid slip velocity near solid outlets, m/s |
| Ws | Solid flow rate, kg/s |
| Wso | Solid flow rate when ug = 0, kg/s |
| α | Cone angle, ° |
| 1/α′ | Viscous resistance coefficient, (Pa·s)/m2 |
| ε | Bed voidage, − |
| ρb | Bulk density of particles, kg/m3 |
| ρs | Gas density, kg/m3 |
| μ | Gas viscosity, Pa·s |
| μg | Gas superficial velocity, m/s |
| φ | Opening ratio of gas distributor, % |
References
- Khashayar, S.; Shahab, G.; Reza, Z. A review on gravity flow of free-flowing granular solids in silos-basics and practical aspects. Chem. Eng. Sci. 2018, 192, 1011–1035. [Google Scholar]
- Chaiwang, P.; Chitcharoenyoo, H.; Piumsomboon, P.; Chalermsinsuwan, B. Effect of a pulsating flow on hydrodynamics and fluid catalytic cracking chemical reaction in a circulating fluidized bed riser. Particuology 2022, 67, 47–56. [Google Scholar] [CrossRef]
- Wang, R.; Wang, D.; Fan, Y.; Lu, C. Influence of the pressure drop and the air lock on the solid flux in a cross-flow moving bed. Particuology 2021, 55, 166–178. [Google Scholar] [CrossRef]
- Zhou, Q.; Zhang, X.; Wang, Y.; Qu, S.-J.; Zhang, Y.; Bai, X.-Y.; Pei, X.-F. Pyrolysis behavior of coal in a moving bed with baffled internals under different residence times. J. Fuel Chem. Technol. 2021, 49, 703–711. [Google Scholar] [CrossRef]
- Schulz, D.; Schwindt, N.; Schmidt, E.; Kruggel-Emden, H. Modelling of dust emissions induced by flow over stockpiles and through packed beds. Particuology 2021, 59, 55–63. [Google Scholar] [CrossRef]
- Tian, T.; Su, J.; Zhan, J.; Geng, S.; Xu, G.; Liu, X. Discrete and continuum modeling of granular flow in silo discharge. Particuology 2018, 36, 127–138. [Google Scholar] [CrossRef]
- Wan, J.; Wang, F.; Yang, G.; Zhang, S.; Wang, M.; Lin, P.; Yang, L. The influence of orifice shape on the flow rate: A DEM and experimental research in 3D hopper granular flows. Powder Technol. 2018, 335, 147–155. [Google Scholar] [CrossRef]
- Xiao, X.; Su, J.; Xu, G.; Cui, L.; Liu, X. Discrete modeling of discharge dynamics of granular material in moving bed: Effect of outlet setting. J. Chem. Ind. Eng. 2016, 67, 1710–1718. [Google Scholar]
- Zhang, X.; Zhang, S.; Yang, G.; Lin, P.; Tian, Y.; Wan, J.F.; Yang, L. Investigation of flow rate in a quasi-2D hopper with two symmetric outlets. Phys. Lett. A 2016, 380, 1301–1305. [Google Scholar] [CrossRef]
- Bakhurji, A.; Bi, X.; Grace, J.R. Hydrodynamics and solids mixing in fluidized beds with inclined-hole distributors. Particuology 2019, 43, 19–28. [Google Scholar] [CrossRef]
- Zhong, J.; Lv, H.; Cao, G.P.; Liu, H. The gravity discharge characteristics of fine particles from conical and flat-bottomed hoppers. Chem. Ind. Eng. Prog. 2017, 36, 3940–3946. [Google Scholar]
- Volpato, S.; Artoni, R.; Santomaso, A.C. Numerical study on the behavior of funnel flow silos with and without inserts through a continuum hydrodynamic approach. Chem. Eng. Res. Des. 2014, 92, 256–263. [Google Scholar] [CrossRef]
- Hsiau, S.S.; Smid, J.; Chyou, Y.P.; Liu, T.C.; Huang, T.C.; Hsu, C.J. Impact of flow-corrective insert on flow patterns in two-dimensional moving bed. Chem. Eng. Process. 2013, 73, 7–15. [Google Scholar] [CrossRef]
- Liu, Q.; Su, J.L.; Zhan, J.H.; Xu, G.W.; Liu, X.X. Discrete Modeling of Effect of Insert on Discharge Dynamics of Granular Material in Moving Bed. Chin. J. Process Eng. 2017, 17, 1163–1169. [Google Scholar]
- Nie, Z.; Qi, Q.; Wang, X.; Zhu, Y. DEM investigation of strain behaviour and force chain evolution of gravel–sand mixtures subjected to cyclic loading. Particuology 2022, 68, 13–28. [Google Scholar] [CrossRef]
- Dianyu, E.; Zhou, P.; Guo, S.; Zeng, J.; Cui, J.; Jiang, Y.; Lu, Y.; Jiang, Z.; Li, Z.; Kuang, S. Particle shape effect on hydrodynamics and heat transfer in spouted bed: A CFD–DEM study. Particuology 2022, 69, 10–21. [Google Scholar]
- Artoni, R.; Santomaso, A.; Canu, P. Simulation of dense granular flows: Dynamics of wall stress in silos. Chem. Eng. Sci. 2009, 64, 4040–4050. [Google Scholar] [CrossRef]
- Zheng, Y.; Liu, J.; Xiao, Y.G.; Xin, C.X. Experiment and Research of Flow Properties of Active Coke Particles in Rectangular Flowing Bed. Process Equip. Pip. 2005, 6, 17–19. [Google Scholar]
- Liang, X.S.; Xiao, Y.; Wu, L.Q.; Yang, Y.S.; Mei, Y. Study on the Calculation of Perforated Rate of Fluidized Bed Reactor. Yunnan Chem. Technol. 2006, 33, 30–32. [Google Scholar]
- Li, Z.Y.; Zhou, Y.H.; You, H.X. Discharge flow of silo. Chem. Equip. Technol. 1999, 6, 39–43. [Google Scholar]
- Cannavacciuolo, A.; Barletta, D.; Donsì, G.; Ferrari, G.; Poletto, M. Arch-Free flow in aerated silo discharge of cohesive powders. Powder Technol. 2009, 191, 272–279. [Google Scholar] [CrossRef]
- Donsi, G.; Ferrari, G.; Poletto, M.; Russo, P. Gas pressure measurements inside an aerated hopper. Chem. Eng. Res. Des. 2004, 82, 72–84. [Google Scholar] [CrossRef]
- Li, H.Z. Mechanics of arching in a moving-bed standpipe with interstitial gas flow. Chem. Metall. 1993, 4, 327–337. [Google Scholar] [CrossRef]
- Thomas, C.; Durian, D.J. Geometry dependence of the clogging transition in tilted hoppers. Phys. Rev. E 2013, 87, 052201. [Google Scholar] [CrossRef] [PubMed]
- Jia, Q.F.; Wang, R.J.; Zhao, B.; Wan, Q.S.; Wang, D.W.; Zhang, S.F. Influence of entrained gas on characteristics of Geldart D particles in batchwise discharge process. Chem. Ind. Eng. Prog. 2020, 39, 4391–4400. [Google Scholar]
- Leung, L.S.; Jones, P.J.; Knowlton, T.M. An analysis of moving-bed flow of solids down standpipes and side valves. Powder Technol. 1978, 19, 7–15. [Google Scholar] [CrossRef]
- Ergun, S. Fluid flow through packed columns. Chem. Eng. Prog. 1952, 48, 89–94. [Google Scholar]
- Beverloo, W.A.; Leniger, H.A.; Van De Velde, J. The flow of granular solids through orifices. Chem. Eng. Sci. 1961, 15, 260–269. [Google Scholar] [CrossRef]
- De Jong, J.; Hoelen, Q. Cocurrent gas and particle flow during pneumatic discharge from a bunker through an orifice. Powder Technol. 1975, 12, 201–208. [Google Scholar] [CrossRef]
- Qiu, L.; Sang, D.; Feng, Y.; Zhang, X. Experimental study on particle flow characteristics of three-dimensional moving bed. Powder Technol. 2020, 374, 399–408. [Google Scholar] [CrossRef]
- Paterson, W.R.; Berresford, E.L.; Moppett, D.L.; Scott, D.M.; Simmons, V.K.; Thorpe, R.B. Gas flow maldistribution in moving beds of monosized particles. Chem. Eng. Sci. 2000, 55, 3515–3527. [Google Scholar] [CrossRef]
- Yang, C.; Xu, X.; Yang, S.J.; Liu, X.C.; Li, X.Q. Experimental research of voidage in granular moving bed. China Powder Sci. Technol. 2017, 23, 22–26. [Google Scholar]
- Brown, R.L.; Richards, J.C. Exploratory study of the flow of granules through apertures. Trans. Inst. Chem. Eng. 1959, 37, 108–109. [Google Scholar]
- De Jong, J. Vertical air-controlled particle flow from a bunker through circular orifices. Powder Technol. 1969, 3, 279–286. [Google Scholar] [CrossRef]
- Massimilla, L.; Betta, V.; Rocca, C.D. A study of streams of solids flowing from solid-gas fluidized beds. AIChE J. 1961, 7, 502–508. [Google Scholar] [CrossRef]
- Liu, D.X.; Liu, J.; Wei, S.; Liu, L. Study on Local Pressure Loss of Oil-Water Two-Phase Flow Through Micro Throat in Microchannels. J. Eng. Therm. 2019, 40, 1835–1839. [Google Scholar]
Publisher’s Note: MDPI stays neutral with regard to jurisdictional claims in published maps and institutional affiliations. |
© 2022 by the authors. Licensee MDPI, Basel, Switzerland. This article is an open access article distributed under the terms and conditions of the Creative Commons Attribution (CC BY) license (https://creativecommons.org/licenses/by/4.0/).