Article

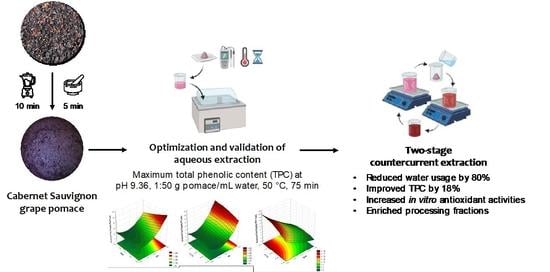
Revitalizing Unfermented Cabernet Sauvignon Pomace Using an Eco-Friendly, Two-Stage Countercurrent Process: Role of pH on the Extractability of Bioactive Phenolics

by
Sophia Pinton
1,
Fernanda Furlan Goncalves Dias
1,
Larry A. Lerno
2,
Daniela Barile
1,3 and
Juliana Maria Leite Nobrega de Moura Bell
1,4,*
1
Department of Food Science and Technology, University of California, One Shields Avenue, Davis, CA 95616, USA
2
Food Safety and Measurement Facility, University of California, Davis, CA 95616, USA
3
Foods for Health Institute, University of California, One Shields Avenue, Davis, CA 95616, USA
4
Department of Biological and Agricultural Engineering, University of California, One Shields Avenue, Davis, CA 95616, USA
*
Author to whom correspondence should be addressed.
Processes 2022, 10(10), 2093; https://doi.org/10.3390/pr10102093
Submission received: 5 September 2022 / Revised: 28 September 2022 / Accepted: 28 September 2022 / Published: 16 October 2022

Abstract

:
As the major byproduct of the winemaking industry, grape pomace remains an untapped source of valuable bioactive phenolic compounds. This study elucidated the optimal aqueous extraction parameters for maximizing phenolic extractability, while avoiding the use of harsh conventional solvents and limiting water usage, from Cabernet Sauvignon grape pomace in which the red grape was processed for white wine. In the single-stage aqueous extraction process (AEP), the concurrent impact of pH (2.64–9.36), solids-to-liquid ratio (SLR, g pomace/mL water) (1:50–1:5), and temperature (41.6–58.4 °C) on the total phenolic content (TPC) of Cabernet Sauvignon pomace was evaluated alongside a kinetic study (15–90 min). Optimal single-stage extraction conditions (pH 9.36, 1:50 SLR, 50 °C, 75 min) guided the development of a two-stage countercurrent extraction process (pH 9.36, 1:10 SLR, 50 °C, 75 min) to further reduce water consumption without compromising overall extractability. The countercurrent process reduced fresh water usage by 80%, increased the TPC of the extracts by 18%, and improved the in vitro antioxidant activities (ABTS and ORAC) of the extracts. Untargeted metabolomics enabled the identification of a diverse pool of phenolics, especially flavonol glycosides, associated with grape pomace, while further phenolic quantitation detected improvements in the release of commonly bound phenolics such as ferulic acid, p-coumaric acid, syringic acid, and protocatechuic acid in alkaline extracts compared to the ethanolic extract. This investigation provides an efficient, eco-friendly extraction strategy suitable for applications in functional food, beverage, nutraceutical, and cosmetic industries.

Graphical Abstract

1. Introduction

The state of California is a major global producer of wine grapes and their derived products. In 2020, California crushed over 3.5 million tons of grapes with red wine varieties accounting for over half of the total crush [1]. Cabernet Sauvignon grapes accounted for 14.1% of the total grape crush and 27.4% of red wine varieties alone [1]. In addition to traditional red and white wines, other styles such as rosé and sparkling wines such as “blanc de noir” (white wines made from red grapes) diversify wine grape applications [2]. However, the overall winemaking process generates tremendous sources of agricultural residues: leaves and stems remain after grape harvesting and destemming; seeds, skins, and pulp (collectively termed grape pomace or grape marc) remain after pressing; and lees, a sediment of yeast cells, remains after fermentation [3,4,5].
It is estimated that the grape pomace fraction represents approximately 20–30% of the total mass of pressed grapes [6], which corresponds to 60% of the total winery solid waste [4]. While grape pomace can be diverted towards processing for animal feed, compost, fertilizer, distilled spirits, or grape seed oil, the associated drawbacks of these alternatives—such as poor animal digestibility and low nutritional value, environmental toxicity, and processing costs—limit the effectiveness of these applications [6,7]. A wide variety of valuable components constitute grape pomace such as dietary fiber, unsaturated fatty acids, proteins, carbohydrates, minerals, organic acids, enzymes, and phenolics [3], evidencing the low biodegradability of grape pomace in the environment. However, of particular interest to food, beverage, pharmaceutical, nutraceutical, and cosmetic industries are the phenolic compounds due to their associated antioxidant, anti-inflammatory, antimicrobial, prebiotic, and anti-carcinogenic properties [8,9,10]. Therefore, the underutilization of wine grape pomace continues to provide opportunities for the development of novel valorization strategies that support economic feasibility and environmental sustainability.
The development of sustainable and effective phenolic extraction methods requires knowledge about the structure, form (i.e., free, esterified, or bound), and location of the compounds in the matrix. Grape pomace phenolics can be chemically bound to grape cell wall carbohydrates and proteins or physically entrapped within the cellular matrix and other cellular organelles [11], requiring cleavage of the phenolic-protein or phenolic-polysaccharide complexes formed by hydrogen bonding and hydrophobic interactions. Traditionally, grape pomace bioactive compounds are extracted by multi-step solid–liquid extraction processes using flammable or hazardous solvents such as ethanol, methanol, acetone, hexane, ethyl acetate, or combinations of these solvents with water and/or organic acids [12,13,14,15]. Acid and alkaline hydrolysis have also been used individually and sequentially to target the ester, ether, and glycosidic linkages between polyphenols and cell matrices [16,17,18,19,20,21]. While the use of traditional solvents typically results in substantial polyphenol extraction yields, the long extraction times, high extraction temperatures, and subsequent removal of these solvents, as required for applications in food and drug products, can be costly and laborious. With global authorities urgently prompting industries to adopt sustainable practices, integrate upcycling processes, and reduce losses along the supply chain, it is crucial to explore greener extraction methods for utilizing agricultural wastes. Examples of green techniques used to extract valuable compounds from winemaking byproducts include aqueous and enzyme-assisted extraction, microwave-assisted extraction, ultrasound-assisted extraction, pulsed electric field extraction, pressurized hot water/subcritical water extraction, supercritical fluid extraction, and the use of green solvents such as ionic liquids and deep eutectic solvents [22,23,24].
The aqueous extraction process (AEP) is a simple, eco-friendly strategy using a ubiquitous solvent in a process that fractionates plant materials into protein-, oil-, and fiber-rich fractions using water as the only solvent [25,26,27]. Like conventional solvent extraction, AEP is frequently preceded by mechanical pretreatments such as milling, grinding, and blending to increase the surfa0ce area-to-volume ratio and improve the diffusion of compounds into the water [28]. Although AEP avoids the use of hazardous solvents, the use of dilute aqueous slurries in single-stage extractions (e.g., 1:50–1:200 g sample/mL solvent) demands additional energy-intensive and expensive concentration steps such as freeze-drying or spray drying to recover the target compounds from the solution. To mitigate the high water consumption required to achieve desirable extraction yields in single-stage extractions, the multi-stage countercurrent extraction process, which involves extracting fresh sample with a saturated aqueous solution from a previous extraction and near-depleted solids with fresh water in a subsequent extraction, has been successfully employed to reduce water usage and further increase extractability in plant material such as soybeans and green coffee [29,30].
Since aqueous extraction conditions inevitably affect polyphenolic yields and characteristics, the interactive effects of key extraction parameters (e.g., slurry pH, solids-to-liquid ratio, temperature, and time) should be further explored to enhance the recovery of grape pomace phenolics with desired structure-function attributes. Multiple studies have explored green extraction techniques for recovering phenolics from Cabernet Sauvignon pomace resulting from a traditional red wine fermentation [12,31,32,33], but few have evaluated pure water as the only solvent. Additionally, specific winemaking methods for special products, like in the production of white wines made from red grapes, can also impart effects on phenolic profiles and antioxidant activities of the grape pomace extracts by providing a unique composition of tannins, anthocyanins, sugars, proteins, and minerals. Studies evaluating the aqueous extraction of phenolics from Cabernet Sauvignon pomace collected prior to fermentation have not yet been thoroughly reported.
Therefore, this study was designed to assess the simultaneous impact of key processing parameters on the extractability of grape pomace phenolics using a single-stage AEP and multi-stage AEP to reduce water usage while minimizing losses. It was hypothesized that optimized extraction conditions of the single-stage AEP could be used as the basis for the development of a multi-stage countercurrent extraction process resulting in a higher concentration gradient to drive molecular diffusion of phenolics to the extraction medium. To accomplish this goal, the present work: (i) evaluated the simultaneous effect of pH, solids-to-liquid ratio, temperature, and time on the extractability of total phenolics from unfermented Cabernet Sauvignon grape pomace (i.e., red grape pomace collected prior to fermentation for the production of white wine) using single-stage AEP; (ii) developed a two-stage countercurrent extraction system to reduce water consumption while maintaining aqueous extraction efficiency; and (iii) measured the impact of extraction conditions and processes (single- and multi-stage) on phenolic composition, phenolic concentration, and in vitro antioxidant properties of the grape pomace extracts for future food and health applications.

2. Materials and Methods

2.1. Chemicals and Reagents

Folin–Ciocalteu phenol reagent, Trolox®, K2O8S2 (potassium persulfate), 2,2’-Azobis(2-methylpropionamidine) dihydrochloride (AAPH radical), 2,2’-Azino-bis(3-ethylbenzothiazoline-6-sulfonic acid) diammonium salt (ABTS radical), D(+)-glucose, sulfuric acid, phenol, fluorescein, gallic acid, protocatechuic acid, (+)-catechin, syringic acid, (-)-epicatechin, (-)-epicatechin gallate, (-)-epigallocatechin gallate, naringenin-7-O-glucoside, cinnamic acid, (±)- naringenin, protocatechuic acid, quercetin-3-O-galactoside, quercetin-3-O-rutinoside, quercetin-3-O-glucoside, quercetin-3-O-glucuronide, quercetin-3-O-rhamnoside, isorhamnetin-3-O-glucoside, quercetin, and isorhamnetin were acquired from Sigma-Aldrich (Saint Louis, MO, USA). (-)-Epicatechin gallate and malvidin-3-O-glucoside chloride were acquired from Extrasynthese (Genay, France). Anhydrous sodium carbonate was purchased from VWR Chemicals, BDH® (Solon, OH, USA), and anhydrous gallic acid was purchased from Chem-Impex International (Wood Dale, IL, USA). The phosphate buffer solution was obtained from bioWORLD (Dublin, OH, USA). Ethanol (95% v/v) was obtained from Decon Labs (King of Prussia, PA, USA).

2.2. Raw Material

Cabernet Sauvignon grape pomace (Vitis vinifera L. cv. Cabernet Sauvignon) was generously provided by the UC Davis Teaching and Research Winery (Davis, CA, USA; approximate latitude: 38.532, longitude: −121.753). The grapes were harvested from the UC Davis campus vineyard (John C. Gist Jr. student rotation block) in October 2019 and stored frozen at −16 °C until January 2020 when production of a white Cabernet Sauvignon wine began. The grapes were thawed, crushed, destemmed, and pressed (Bucher Xplus 22, Bucher Vaslin North America, Santa Rosa, CA, USA) up to 1.6 psi to avoid excessive color extraction. The juice was subsequently racked and fermented for white wine production and the remaining material—a mix of skins, seeds, pulp, and stems—was stored at −20 °C until July 2020. Then, aliquots of the frozen sample were gathered, and any residual grape stem debris that remained from the destemming process was manually separated from the seeds, skins, and pulp. The seeds, skins, and pulp (“pomace”) were homogenized to conform to likely industrial processing conditions. The pomace was blended for 10 min in a Vitamix 5200 blender (Vitamix, Cleveland, OH, USA) in batches of approximately four cups at a time then frozen in bulk at −20 °C until further use. Before extraction, aliquots of the bulk frozen pomace were defrosted for 20 min at room temperature and then ground to a paste using a mortar and pestle for approximately 5 min until fully homogenized. The grape pomace material was used fresh, without a drying step as a pre-treatment, to reduce overall energy consumption, enable industrial scale-up, and prevent potential degradation of phenolics through additional heating. Due to the short period of time that grape pomace can remain fresh, it was necessary to involve periodic freezing of samples for storage. The impact of freeze–thaw cycles on grape pomace has been evaluated by Tomaz et al. [34] with a preference for microwave thawing to retain polyphenols within the grape cells. However, the total phenolic content in fresh Cabernet Sauvignon berries similarly reflected that of the berries thawed at 25 °C for 1.5 h [34], thus supporting the gentle 20 min thaw outlined above.
The proximate composition of the g”ape ’omace was determined using standard methods. Total solids content was determined using AOAC Method 925.09 [35], total ash by AOCS Method Ba 5a-49 [36], and total lipids by AOAC Method 922.06 [37]. Total protein content was determined using the Dumas combustion method (Vario MAX cube, Elementar Analysensysteme GmbH, Langenselbold, Germany) with a nitrogen conversion factor of 6.25. Overall, the grape pomace contained 57.80 ± 0.09% moisture, 2.86 ± 0.07% protein, 1.87 ± 0.02% ash, 1.03 ± 0.09% lipids, and 36.4% carbohydrates (measured by difference).

2.3. Initial Evaluation of the Effects of the Extraction pH on the Aqueous Extraction Process (AEP) of Grape Pomace

To aid in the selection of extraction parameters studied in the AEP optimization experiments, the effect of slurry pH on total phenolic content was initially evaluated in a univariate study with pH values varying from pH 2–8. Grape pomace samples were dispersed in deionized water and the slurry pH was adjusted to 2, 4, 6, and 8 with dropwise additions of 0.5 M HCl or 0.5–1.0 M NaOH. The solids-to-liquid ratio (SLR) was maintained at 1:10 g pomace/mL water. Triplicate extractions were performed at each pH condition in a 50 °C water bath for 90 min with constant stirring at 185 rpm on a magnetic stir plate (Cimarec™ I Telesystem Multipoint Stirrers, Thermo Scientific, Waltham, MA, USA). After extraction, the solids were separated by centrifugation at 4000 rpm for 10 min at 22 °C followed by filtration (Whatman Grade 1 filter papers, Sigma-Aldrich, Saint Louis, MO, USA). Extracts were stored frozen at −20 °C until further analysis.

2.4. Effect of Conventional Solvent Extraction on TPC

Solid–liquid extractions were performed to determine the effect of conventional hydroethanolic solvent extraction on the total phenolic content of the grape pomace extracts. Several solvent ratios were prepared by mixing 95% (v/v) ethanol in deionized water at 0, 20, 40, 60, 80, and 100% ethanol concentrations (v/v). The pH of pure deionized water and 95% ethanol were 4.87 and 5.45, respectively, while the pH of the hydroethanolic slurries (20–80% ethanol, v/v) were 3.85, 4.28, 4.77, and 5.68, respectively. No adjustments were made to the slurry pH during the conventional solvent extraction process. Extractions were performed in triplicate as described for the AEP (Section 2.3) (1:10 SLR at 50 °C with 175 rpm agitation for 90 min), and after centrifugation and filtration, the extracts were stored frozen at −20 °C until further analysis. To better compare the effectiveness of the conventional solvent extraction with the AEP, triplicate hydroethanolic extractions were also performed as described above at the optimum extraction conditions identified in the single-stage AEP (1:10 SLR, 50 °C, 75 min) using the selected 60% ethanol.

2.5. Understanding the Simultaneous Effect of Extraction Parameters in the Single-Stage AEP of Grape Pomace

The results of the preliminary pH screening in the AEP (Section 2.3) and the methods of previous literature [38] guided the selection of the broader pH range explored in the AEP optimization design. The concurrent effects of pH (2.64, 4.00, 6.00, 8.00, and 9.36), SLR (1:50.0, 1:17.7, 1:9.1, 1:6.1, and 1:5.0), and temperature (41.6, 45.0, 50.0, 55.0, and 58.4 °C) (Supplementary Materials—Table S1) on total phenolic content of single-stage AEP grape pomace extracts were evaluated by a central composite rotatable design totaling 17 experimental conditions (23, with three repetitions in the central points and six axial points).
A kinetic study was performed for each extraction condition to determine the role of reaction time on phenolic extractability. The grape pomace slurries (grape pomace in 10 mL water) were collected at 15, 30, 45, 60, 75, and 90 min and immediately placed in an ice bath until centrifugation. The total phenolic content was measured at each time point to develop corresponding reaction curves.
Extractions were performed by dispersing 0.20–2.00 ± 0.005 g grape pomace sample in 10 mL nanopure water to achieve the SLR determined by the experimental design (Supplementary Materials—Table S1) (Figure 1). Slurry pH and reaction temperature were also adjusted according to the experimental design. After extraction, the slurry was centrifuged to separate the grape pomace extract and stored as described in the above sections.

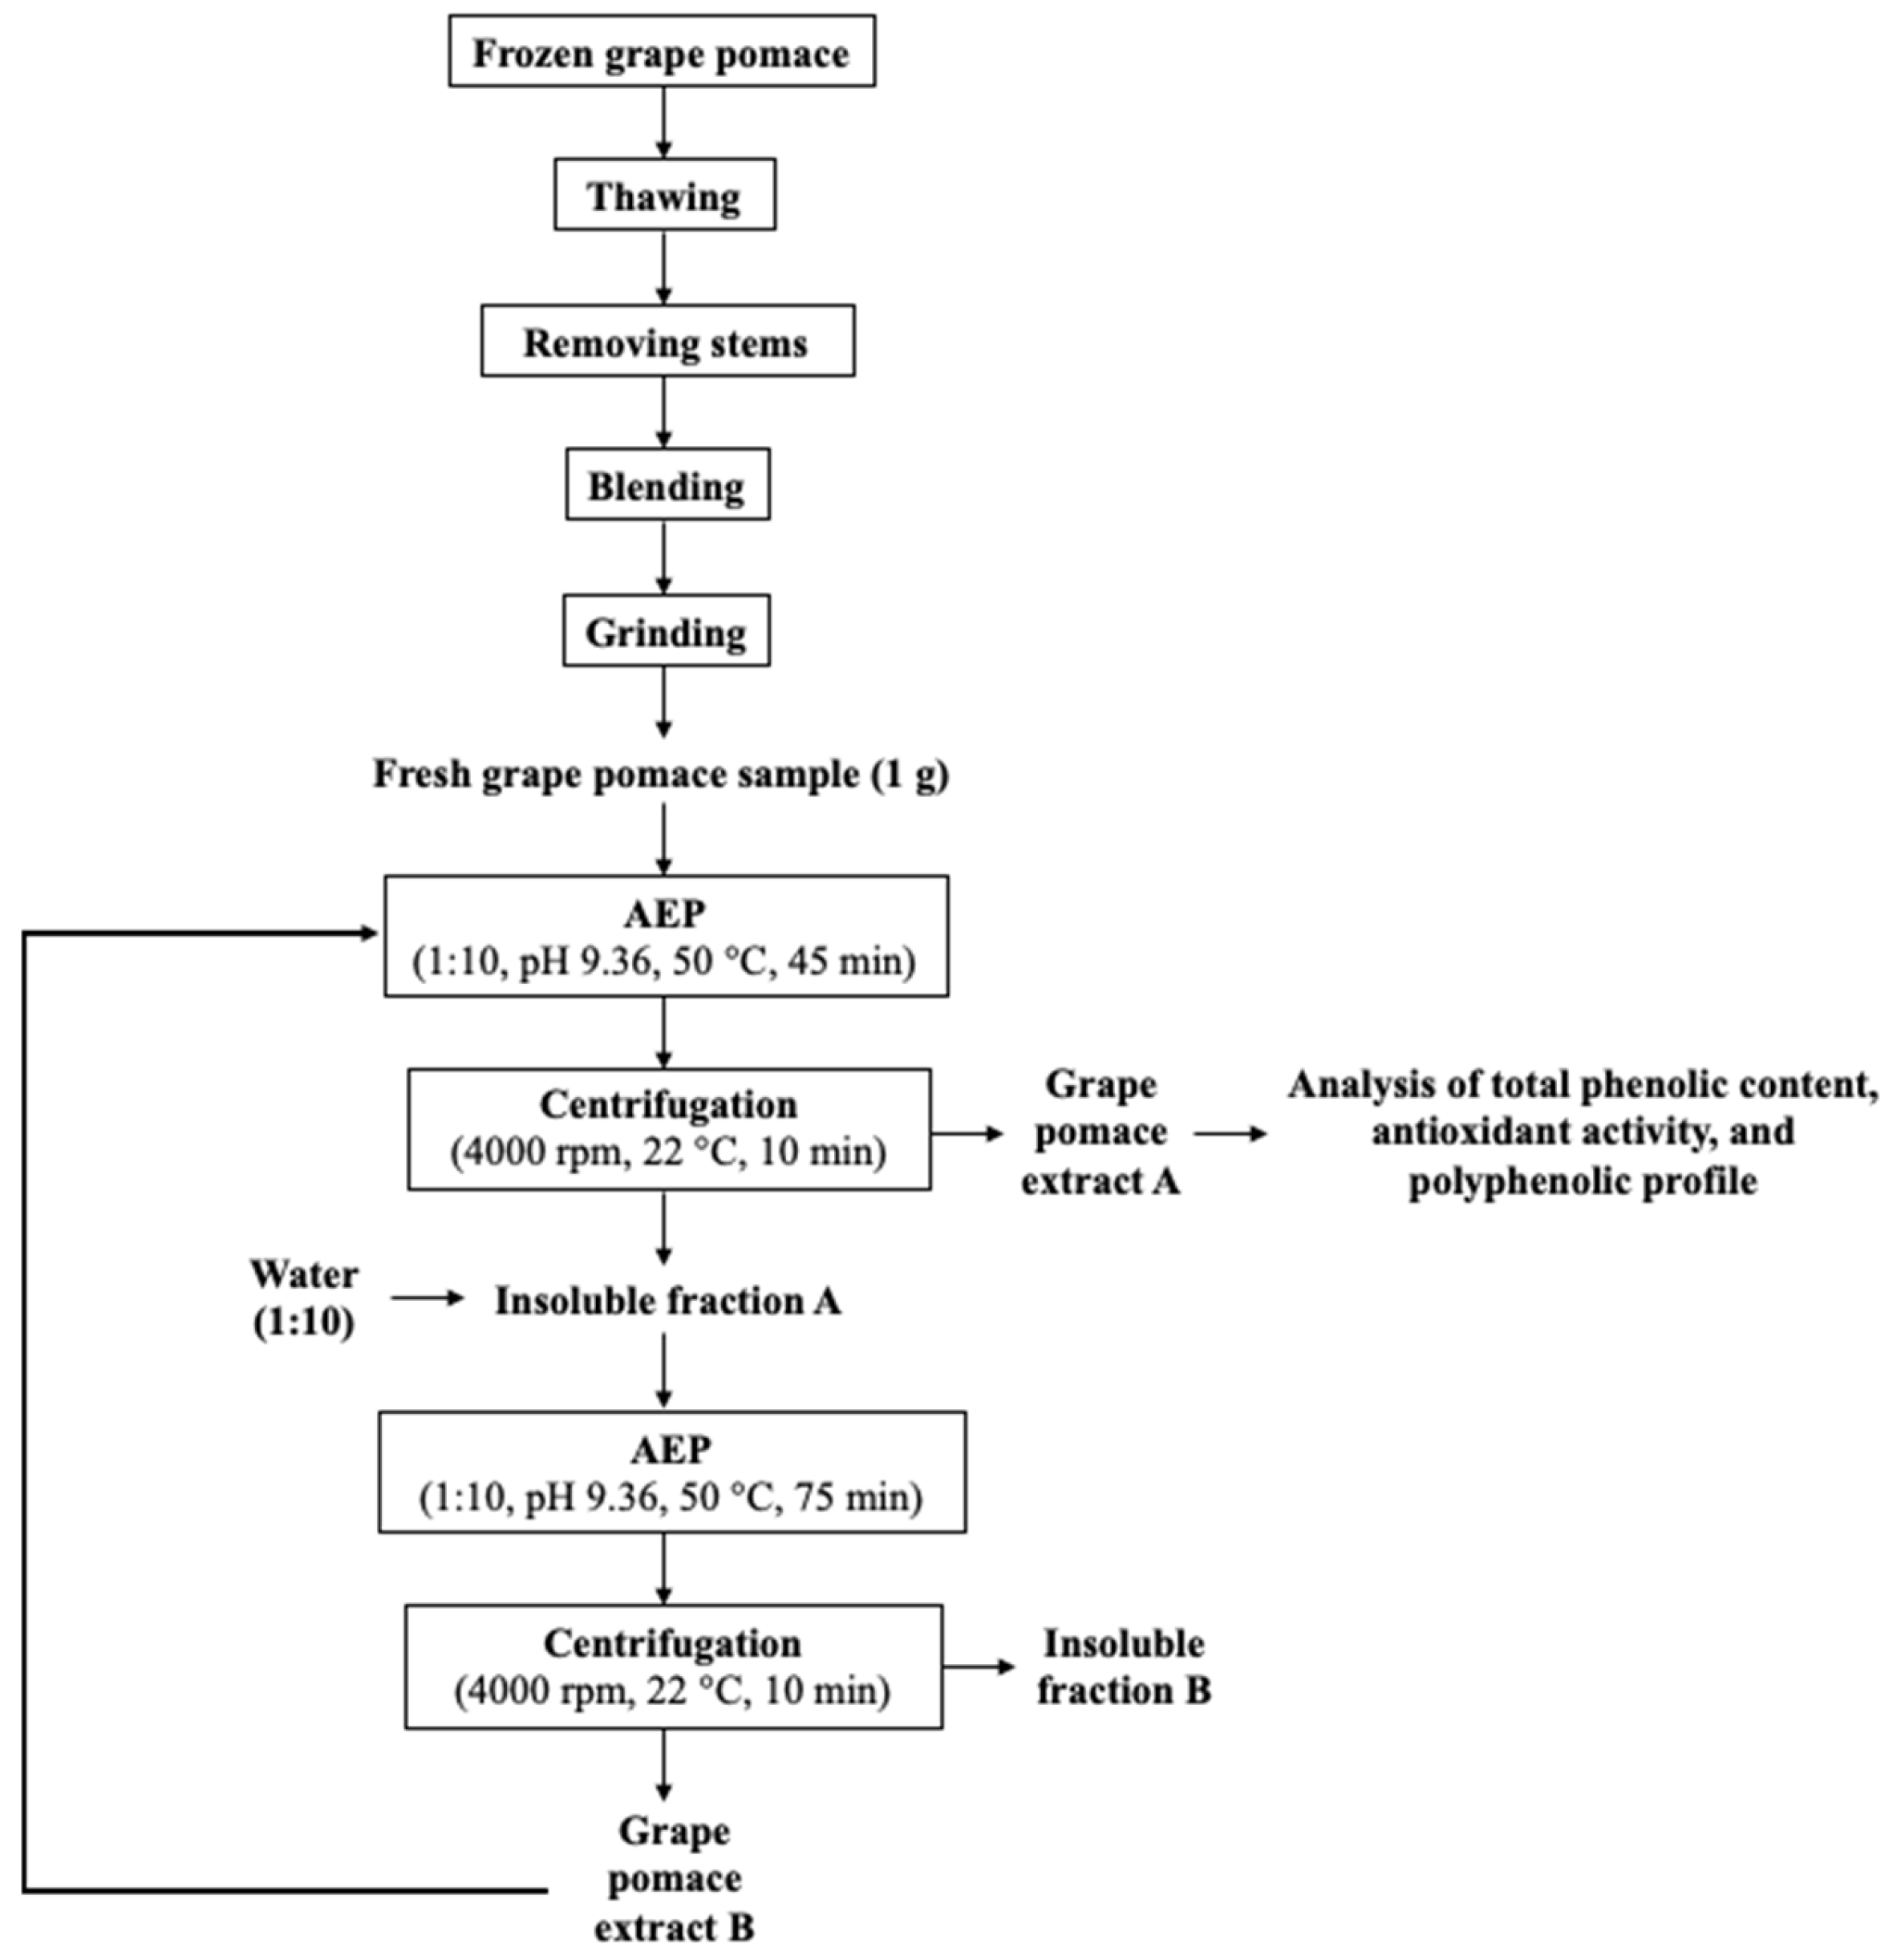
2.6. Two-Stage Countercurrent AEP of Grape Pomace

To circumvent one of the main challenges of aqueous extraction processes, which is the use of large volumes of water to drive extraction, a two-stage countercurrent extraction process was developed for grape pomace to achieve high extraction yields with reduced water consumption (Figure 2). In this approach, a saturated phenolic extract resulting from a previous extraction was mixed with the addition of fresh grape pomace, while in the second extraction, fresh water was used to slurry the nearly depleted solids (insoluble fraction) produced from the first extraction. Based on the optimum extraction conditions identified for phenolic extraction using the single-stage AEP (pH 9.36, 1:50 SLR, 50 °C, 75 min) and the expected improvement in extractability when using higher SLR in the countercurrent approach, an intermediate SLR (1:10) and a shorter extraction time (45 min) were selected for the first extraction of the countercurrent process.
Each two-stage AEP trial was composed of three two-stage sequential extractions to enable adequate recycling of the extracts coming from the previous extraction. The entire countercurrent process was completed in a single day to prevent freeze–thaw cycles of the grape pomace material. Briefly, 1 g of freshly ground grape pomace was dispersed in water to achieve a 1:10 SLR, and the slurry pH was adjusted to 9.36. The first extraction was performed at 50 °C under constant stirring at 300 rpm for 45 min. The slurry was then centrifuged at 4000 rpm for 10 min at 22 °C to separate the solids (insoluble fraction A) from the extract (Figure 2). Subsequently, the insoluble fraction A was then dispersed into fresh water to achieve a 1:10 SLR in the second extraction (pH 9.36, 50 °C, 75 min). After extraction, the slurry was centrifuged to obtain extract B, which was then recycled as the solvent for the next extraction with fresh grape pomace. This two-step extraction was repeated two more times to complete one two-stage countercurrent trial. AEP trials were replicated three times and only samples collected from the last extraction of each AEP trial were analyzed (extract A).

2.7. Chemical Analysis of Extracts

2.7.1. Total Phenolic Content (TPC)

The total phenolic content of the extracts was determined according to the Folin-Ciocalteu spectrophotometric method as described by Singleton et al. [39]. An aliquot of 25 µL of the grape pomace extracts (diluted 1:10, v/v, or 1:25, v/v, in nanopure water) and 125 µL of Folin-Ciocalteu:water solution (1:10, v/v, in nanopure water) were transferred to a clear 96-well microplate. The mixture was agitated at 300 rpm for 5 min at 37 °C. Next, 100 µL of a 7.5% (w/v) anhydrous sodium carbonate in water solution was added and the mixture was agitated (300 rpm, 30 min, 37 °C) then kept at rest for 90 min in the dark at 37 °C. The absorbance was read at 760 nm using a microplate reader (SpectraMax iD5, Molecular Devices, San Jose, CA) and results were calculated using a standard curve of anhydrous gallic acid (R2 = 0.999) with known concentrations of 5–95 μg/mL. Results were expressed as mg of gallic acid equivalent (GAE)/g dry grape pomace extract. Dry weights were calculated based on the moisture content resulting from vacuum oven drying (AOAC Method 925.09) and are presented for ease of data comparison to the literature. For the preliminary tests, duplicate measurements of each triplicate extract were performed (n = 6). For the optimization and kinetics experiments, triplicate measurements of each triplicate sample were performed (n = 9).

2.7.2. ABTS and ORAC Assays for Antioxidant Capacity of the Extracts

The ABTS assay for radical cation scavenging activity was performed as described by Al-Duais et al. [40] with some modifications. The radical stock solution was produced by mixing 38.4 mg ABTS and 6.62 mg K2O8S2 (potassium persulfate) in 10 mL of deionized water. The radical solution was incubated overnight at room temperature in the dark. After incubation, the radical stock solution was diluted with 95% (v/v) ethanol to obtain an initial absorbance of 0.70 ± 0.20 at 730 nm. The analysis was performed by pipetting 20 μL of each grape extract sample (diluted 1:30, v/v, in ethanol) into a clear 96-well microplate followed by the addition of 200 μL of fresh diluted ABTS•+ solution. A 20 µL sample of ethanol with 200 µL ABTS•+ solution was used as the control. The mixtures were agitated at 300 rpm for 6 min, then the microplate was read at 730 nm using a spectrophotometer (SpectraMax iD5; Molecular Devices, San Jose, CA, USA). A calibration curve (R2 = 0.98) using Trolox standard solutions (80–340 μM, diluted in ethanol) was used to calculate the results as µmol Trolox equivalent (TE)/g dry pomace.
The ORAC assay was performed according to the method described by Zulueta et al. [41]. Briefly, 50 µL of the control (phosphate buffer solution, pH 7.0, 75 mM), grape pomace extract (diluted 1:2000, v/v, in PBS), or standard (Trolox, 20 µM, diluted in PBS) were added to the wells of a black 96-well microplate. A sample of 50 µL of fluorescein (78 nM, diluted in PBS) was added, and the plate was agitated at 300 rpm for 15 min at 37 °C followed by the addition of 25 µL of 221 mM AAPH radical solution. The plate was read using a microplate reader (SpectraMax iD5; Molecular Devices, San Jose, CA, USA) at 37 °C, and set at an excitation wavelength of 485 nm and an emission wavelength of 535 nm. The fluorescence measurements were read every 5 min for 1 h. The results were calculated using the following equation and were converted to µmol Trolox equivalent (TE)/g dried pomace:
µ M   Trolox = C Trolox AUC sample AUC blank     DF AUC Trolox AUC blank ,
where CTrolox represents the concentration of the standard (20 µM), DF is the sample dilution factor (2000) and AUC represents the areas below the fluorescence decay curve of the sample, blank, or Trolox standard.

2.7.3. Untargeted Phenolic Profiling of the Grape Pomace Extracts

Identification of grape pomace extract phenolic compounds was performed by the West Coast Metabolomics Center Central Services Core (UC Davis, Davis, CA, USA, https://metabolomics.ucdavis.edu/core-services/assays-and-services (accessed on 4 September 2022)) using the Q Exactive HF-X Hybrid Quadrupole-Orbitrap mass spectrometer (Thermo Scientific, Waltham, MA, USA). Phenolic identification and data processing were performed as described by Fiehn et al. [42]. A series of internal standards were added to the samples: caffeine-d9, 12-[[(cyclohexylamino)carbonyl]amino]-dodecanoic acid (CUDA), daidzein-d4, genistein-d4, trans-cinnamic acid-d5, and hippuric acid-d5. A concentration of 0.5 µg/mL of hippuric acid-d5 was used with all other standards concentrated at 1 µg/mL in the resuspension mix. Samples were resuspended to 100 µL, and 0.5 µL was injected for ESI positive mode while 5 µL was used for ESI negative mode (Supplementary Materials—Table S6). The reported peak heights were determined by dividing each metabolite peak height by the sum of all peak heights for all identified metabolites for each sample.

2.7.4. Phenolic Quantification by RP-HPLC-DAD

Phenolic compounds were extracted from freeze-dried grape pomace extracts according to the method described by Konar et al. [43] with some modifications. Freeze-dried samples (10 mg) were mixed with 1 mL of a 50:50 methanol (MeOH):water + 0.1% HCl mixture. The mixture was vortexed and sonicated in an ultrasound bath for 2 h at room temperature to extract the phenolic compounds. Subsequently, the samples were centrifuged at 15,000× g for 5 min and 600 µL of the supernatant were then filtered through a 0.45-µm membrane filter prior to injection into the HPLC system.
The samples were analyzed by reversed-phase high-performance liquid chromatography (RP-HPLC) using an Agilent 1260 Infinity equipped with an Agilent Zorbax SB-C18 (4.6 × 150 mm, 3.5 µm) column (Agilent Technologies, Santa Clara, CA, USA) at 35 °C, an autosampler with temperature control at 8 °C, and a diode array detector (DAD). Two mobile phases were used: mobile phase A composed of MilliQ water with 1.5% o-phosphoric acid (v/v) and mobile phase B composed of 80% acetonitrile and 20% mobile phase A. The following gradient program was used: 10–31% B (0–73 min) and 62% B (73–75 min). Mobile phase B was held at 62% (75–80 min) and decreased to 10% (82–90 min). The mobile phase flow was maintained at 1 mL/min and the injection volume was 20 µL.
The eluted compounds were monitored and identified by spectral and retention time comparisons to authentic standards at four different wavelengths: 280 nm (gallic acid, protocatechuic acid, (+)-catechin, syringic acid, (-)-epicatechin, (-)-epicatechin gallate, (-)-epigallocatechin gallate, naringenin-7-O-glucoside, (±)-naringenin, and polymeric phenols), 320 nm (chlorogenic acid, caffeic acid, p-coumaric acid, ferulic acid), 360 nm (quercetin-3-O-rutinoside, quercetin-3-O-glucoside, quercetin-3-O-glucuronide, isorhamnetin-3-O-glucoside, quercetin, isorhamnetin, and kaempferol), and 520 nm (malvidin-3-O-glucoside and polymeric pigments).
External calibration curves (0.1–200 mg/L) were prepared using authentic standards of gallic acid, (+)-catechin, (-)-epigallocatechin gallate, (-)-epicatechin gallate, chlorogenic acid, caffeic acid, ferulic acid, p-coumaric acid, quercetin, quercetin-3-O-rutinoside, quercetin-3-O-glucoside, (±)-naringenin, naringenin-7-O-glucoside, isorhamnetin, isorhamnetin-3-O-glucoside, kaempferol, and malvidin-3-O-glucoside. These compounds were quantified as themselves, while syringic acid and protocatechuic acid were quantified as gallic acid equivalents; epicatechin and polymeric phenols as (+)-catechin equivalents; coutaric acid as p-coumaric acid equivalents; quercetin-3-O-galactoside and quercetin-3-O-glucuronide as quercetin-3-O-glucoside equivalents; and anthocyanins and polymeric pigments as malvidin-3-O-glucoside equivalents. Data analysis was performed using Agilent® CDS ChemStation software version D.04 (Agilent Technologies, Santa Clara, CA, USA). Chromatograms of the phenolic standards, two-stage countercurrent AEP, and conventional solvent extraction are included in Supplementary Materials—Figures S1–S3.

2.8. Statistical Analysis

All extractions and biological assays were performed in at least triplicate with the results expressed as the mean ± standard deviation (SD) of the replicates. Analysis of variance (ANOVA) followed by Tukey HSD test was performed to determine significant differences among experiments at p < 0.05 using the Astatsa (2016, Navendu Vasavada) online program. For the CCRD optimization experiments, the R2 and F-value for regression model significance were generated using the Protimiza Experimental Design® Software (http://experimentaldesign.protimiza.com.br). Statistica® (Version 13.3, TIBCO Software Inc., Palo Alto, CA, USA) was used to generate the response surface plotand to determine ANOVA significance testing at p < 0.05. JMP® (Trial 16.1.0, serial number T-TYPQDH0JJC, SAS Institute Inc., Cary, NC, USA) was also used for ANOVA significance testing at p < 0.05.

3. Results and Discussion

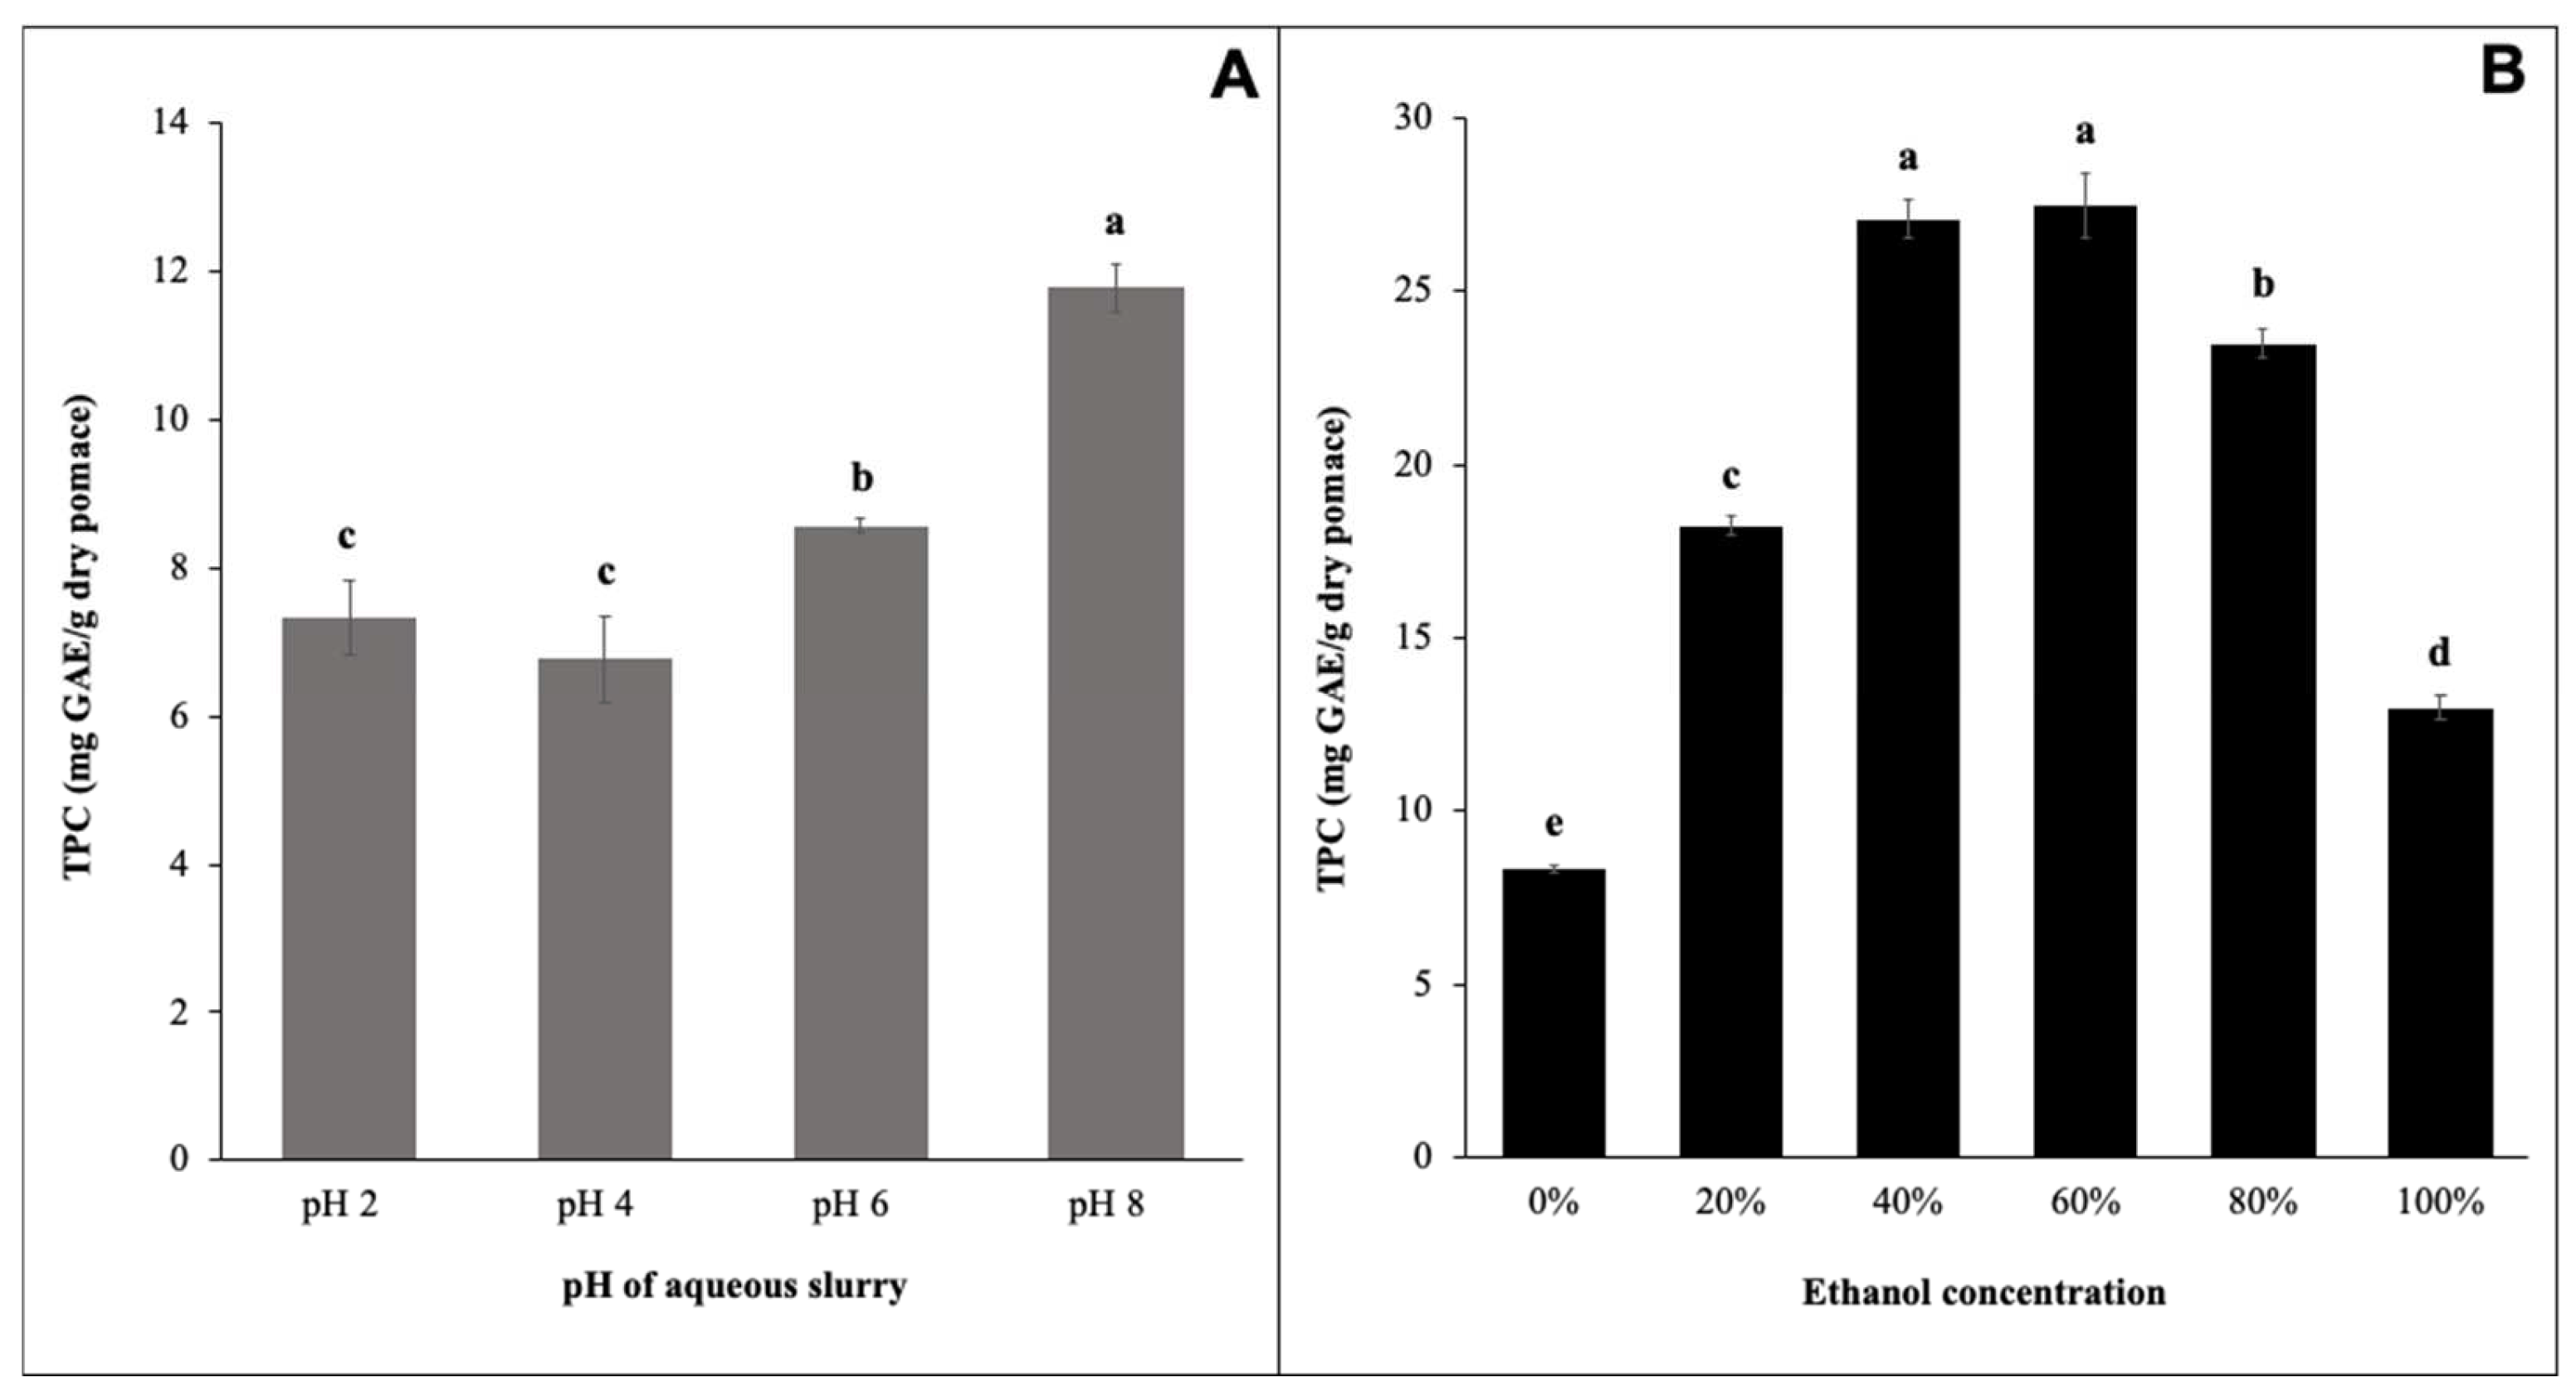
3.1. Effect of Extraction pH on TPC of AEP Grape pomace Extracts

The effect of aqueous solvent pH on phenolic extractability has been minimally explored with varying results depending on the type of solvent used. The effect of slurry pH in the AEP was evaluated using a 1:10 SLR at 50 °C for 90 min. Overall, TPC of the extracts significantly increased as the extraction pH increased from 2 to 8 (Figure 3A). The maximum TPC of 11.77 ± 0.33 mg GAE/g dry pomace was achieved at pH 8 (Figure 3A) with no significant difference (p > 0.05) between the TPC of extracts obtained at pH 2 (7.33 ± 0.49 mg GAE/g dry pomace) and pH 4 (6.77 ± 0.59 mg GAE/g dry pomace). However, both acidic extraction conditions resulted in extracts with significantly lower TPC than the ones obtained at pH 6 (8.57 ± 0.09 mg GAE/g dry pomace) and pH 8 (11.77 ± 0.33 mg GAE/g dry pomace). These results suggest that aqueous extraction at alkaline pH has a significant role in improving the phenolic extractability from grape pomace.
Our results are in agreement with the literature in which Librán et al. [44] evaluated the effects of a range of extraction pH (2, 5.33, 8.66, and 12) and hydroethanolic concentrations (0, 25, 50, 75, and 100% ethanol, v/v) on the extraction of polyphenols from Tempranillo grape pomace at 25 °C and incubation time of 2 h. At 0% ethanol, a five-fold increase in TPC was observed when the pH of the extracting media (i.e., water) was adjusted from pH 2 (4.58 mg GAE/g dry sample) to pH 12 (28.06 mg GAE/g dry sample). However, at higher ethanol concentrations (50, 75, and 100%), alkaline conditions generated significantly (p < 0.01) lower TPC compared with acidic conditions. It is possible that the use of alkaline pH at high hydroethanolic concentrations may degrade phenolic acids due to the low solubility of the carboxylic acid groups in their anionic forms [45].
The phenolic extraction mechanism under alkaline conditions is believed to target the release of bound phenolics from the plant cell wall by cleaving ester and ether linkages to polysaccharides, fibers, lignin, and proteins [46]. On the other hand, acid hydrolysis targets glycosidic linkages to phenolics but typically leaves ester linkages intact [18,21,46]. Because of the key role of pH in enhancing TPC in the AEP, the simultaneous effect of a wider pH range, SLR, and temperature was further evaluated for the single-stage AEP.

3.2. Effect of Ethanol Concentration on TPC of Conventional Solvent Extracts

Hydroethanolic solvents (0, 20, 40, 60, 80, and 100% ethanol in water) were evaluated in parallel for their effect on the TPC of grape pomace to better understand the yields and trends of conventional solvent extraction compared to AEP. The use of mono-component solvents produced the lowest phenolic yields (Figure 3B) while increasing the ethanol concentrations from 0 to 60%, with no additional change to the slurry pH, resulted in increasing TPC of the grape pomace extracts (8.31 ± 0.11 to 27.48 ± 0.96 mg GAE/g dry pomace). There was no significant difference in TPC between 40 and 60% ethanol (Figure 3B). It is likely that increasing the ethanol concentrations up to 60%, under acidic conditions (pH < 5) due to the slight acidity of ethanol, promoted phenolic extraction by enhancing solvent permeability and solubility of the grape skin and seed phenolics in the presence of heat (50 °C). Compared to the AEP at pH 8, which resulted in an extract TPC of 11.77 ± 0.33 mg GAE/g dry pomace, the use of 60% ethanol (v/v) at acidic pH conditions increased the TPC of the extract to 27.48 ± 0.96 mg GAE/g dry pomace. However, at ethanolic concentrations beyond 60%, the TPC of the extracts declined with the decrease in solvent polarity to 12.98 ± 0.32 mg GAE/g dry pomace at 100% ethanol (v/v).
A hydroethanolic mixture of 60% ethanol (v/v) was therefore selected as the representative conventional solvent for this study, which reflects findings in the literature that report improvements in phenolic extraction at hydroethanolic mixtures at or above 50% ethanol. In a previous study, a maximum TPC of 28 mg GAE/g dried Muscadine seed powder was achieved when using 50, 60, or 70% ethanol (1:10 SLR, 30 min, ambient temperature) [47].

3.3. Simultaneous Effect of Extraction Parameters on TPC of Single-Stage AEP

The results of the preliminary aqueous extraction exploring the effect of slurry pH helped guide the selection of the pH range for the CCRD optimization study, while the SLR and temperature parameters were determined by a review of the literature. The CCRD evaluated the effects of extraction pH, solids-to-liquid ratio, and temperature while the kinetic study evaluated the role of the extraction time on phenolic extractability (Figure 4). Overall, the TPC, as calculated by the Folin-Ciocalteu spectrophotometric method, of the AEP extracts ranged from 5.10 ± 0.03 (Experiment #12 at 15 min) to 36.76 ± 0.55 mg GAE/g dry pomace (Experiment #10 at 90 min) (Figure 4).
Regardless of the extraction time from 15 to 90 min, three experimental conditions yielded high total phenolic contents: Experiment #10 (28.64–36.76 mg GAE/g dry pomace, pH 9.36, 1:9.1 SLR, 50 °C), Experiment #6 (25.47–32.09 mg GAE/g dry pomace, pH 8.00, 1:17.7 SLR, 55 °C), and Experiment #2 (21.51–23.27 mg GAE/g dry pomace, pH 8.00, 1:17.7 SLR, 45 °C) (Supplementary Materials—Table S2). Similarities between these experiments highlight the role of alkaline conditions in phenolic extraction, and as a result, may suggest that the use of alkaline pH can compensate for changes in the other processing conditions such as lower temperatures. In another study evaluating grape marc phenolic extraction kinetics using 50% ethanol, the equilibrium concentration was achieved after 60 min of extraction at 40 °C, 45 min at 50 °C, and 30 min at 60 °C using a 1:50 SLR [48]. These results suggest that lower temperatures required longer extraction times to reach equilibrium, yet the results of the present study suggest that the pH parameter may play a stronger role than extraction time and temperature in increasing phenolic yields. Analysis of the extraction kinetics in Figure 4 and the TPC in Supplementary Materials—Table S2 shows a general upward trend in the TPC of grape pomace extracts up to 75 min with a limited change in phenolic extractability at 90 min. Therefore, it was concluded that the magnitude of any TPC increase from 75 to 90 min was too small to warrant the additional 15 min of extraction time. Based on these results, 75 min was selected as the extraction time at which to develop the regression model and response surface plot.
The regression model at 75 min [TPC (mg GAE/g dry pomace) = 10.72 + 7.26x1 + 4.33x12 −3.41x2 + 0.95x3 − 1.73x1x2] was reparametrized to include only variables significant at p < 0.05 (Figure 5). The regression model [Fcalculated (94.3) > Ftabulated (3.2)] and F-test [Fcalculated (53.1) > Ftabulated (19.4)] were both statistically significant at p < 0.05 (Supplementary Materials—Table S3). The lack of fit in the model can be explained by the small variation in the replicates (central points), which causes a very low pure error. The regression model was able to explain 98% of the variation between the predicted and experimental TPC at 75 min, and experimental yields were similar to the predicted yields. The TPC from all CCRD experiments at 75 min was compared with the predicted values using the regression model (Supplementary Materials—Table S4). At extraction conditions resulting in higher phenolic yields, a low percent error (below |9%|) was observed, which supports the high predictability of the model within the range evaluated.
The total phenolic content of the grape pomace extracts was largely influenced by pH, specifically at more alkaline pH, as observed by the magnitude and positive value of the coefficient (7.26x1) (regression coefficients shown in Table 1). The substantial impact of alkaline pH on TPC is also reflected by the quadratic term (4.33x12). Previous literature exploring the use of alkaline hydrolysis for the extraction of grape pomace phenolics is scarce, although there are reports of using alkaline conditions paired with solvent purification to improve phenolic extraction from other agricultural byproducts such as apple pomace and cranberry pomace [17,49]. Alkaline conditions have been shown to release bound phenolics by cleaving linkages between plant cell wall carbohydrates and structural proteins, which creates a more porous cell structure that aids in the solubilization of phenolics into the surrounding solvent [50]. Despite the benefits of using alkaline conditions to release bound phenolics, the time of extraction reported in previous studies is lengthy, which hinders the feasibility of this technique at the industrial scale. For this reason, the selected AEP extraction time of 75 min is advantageous compared to previous literature that recommends exposure of grape pomace to 0.01 M NaOH for 24 h at room temperature [51]. In addition, although some polyphenols have shown degradation at elevated pH conditions due to oxidation [52], it is apparent that the benefits of alkaline hydrolysis at optimal conditions can compensate for potential losses in phenolic yields.
Since grape pomace phenolics are heat-sensitive compounds that are vulnerable to oxidative degradation during extended extraction periods, the effect of extraction temperature was also explored. The role of extraction temperature seemed to be outweighed by the influence of pH and solids-to-liquid ratio based on the results from the regression analysis of the data. Its small coefficient (0.95x3) suggests a weaker influence of extraction temperature on TPC within the range evaluated. Higher temperatures are responsible for enhancing mass transfer, cell wall permeability, and solubility of target compounds, thus reducing solvent viscosity and in turn shortening extraction times [45]. However, the extraction yields of certain polyphenols and their biological properties can begin to decline at mild temperatures around 60 °C [53]. Even extraction pre-treatments such as drying have reduced total extractable polyphenols in grape pomace at temperatures of 100 and 140 °C [54]. On the other hand, temperatures that are too low can hinder mass transfer, require lengthy extraction timelines, and increase the decomposition of polyphenols by oxidation [55]. Therefore, the selection of 50 °C is consistent with previous studies that support moderate heat applications for phenolic extraction.
Finally, our results support the use of low SLRs (reduced solids, more water), as evidenced by the moderately large and negative coefficient of x2 (−3.41), to improve phenolic extractability. The beneficial effect of reduced SLR on phenolic extraction has been attributed to the accelerated mass transfer caused by the large concentration gradient between solvent and solute [45]. The results of the present study show that the grape pomace slurries that were more concentrated (i.e., 1:5 g pomace/mL water) produced extracts with lower phenolic content in part due to a lower concentration gradient and slower diffusion of solutes to the solvent. The selection of the 1:50 SLR as the optimal condition agrees with previous literature [12]. Importantly, the interaction of both pH and SLR was significant at p < 0.05, which reinforces the positive influence of both dilute solutions and alkaline pH on TPC. The response surface plot (Figure 5) illustrates that a wide temperature range (e.g., 40–60 °C) is favorable for improving phenolic yields as long as the pH of the solution is strongly alkaline (pH > 9.0) and the SLR is small (SLR < 0.03, diluted solution). According to the regression model, the best conditions were identified as pH 9.36, 1:50 SLR, 50 °C, and 75 min (Figure 5). To validate the adequacy of the predictive model, the optimal single-stage AEP condition (pH 9.36, 1:50, 50 °C, 75 min) was validated in triplicate. Experimental validation yielded a TPC of 42.9 ± 2.22 mg GAE/g dry pomace, which was similar to the TPC predicted by the regression model (45.8 mg GAE/g dry pomace).
In comparison to the maximum TPC from the CCRD (36.76 ± 0.55 mg GAE/g dry pomace at pH 9.36, 1:9.1 SLR, 50 °C, and 90 min), the optimized extraction condition improved yields and reduced extraction time by approximately 17%. However, under optimum conditions, a more dilute solution was required to achieve high TPC with respect to the initial condition, requiring over a five-fold increase in the volume of water used. For this reason, a two-stage countercurrent extraction process was performed to determine the efficacy of reducing water consumption without diminishing the phenolic yields.

3.4. Selecting the SLR for the Development of the Multistage Countercurrent AEP

Because increasing SLR led to reduced phenolic extraction in the single-stage AEP, the predictive model generated for the single-stage AEP was used to determine a theoretical TPC of extracts at additional SLRs within the range evaluated in the experimental design. Extraction pH (9.36, coded variable = 1.68) and temperature (50 °C, coded variable = 0) were kept fixed, while the SLR varied.
As observed in Table 1, the theoretical phenolic extraction decreases from 45.8 to 24.6 mg GAE/g dry pomace when the SLR increases from 1:50 to 1:5. Based on the predicted TPC of the nine theoretical scenarios, a SLR of 1:10 was selected for the two-stage countercurrent extraction process. The predicted TPC of a single-stage AEP using a 1:10 SLR was 36.4 mg GAE/g dry pomace, which offers an 80% reduction in water compared to the 1:50 SLR used in the optimized extraction condition while still maintaining impressive phenolic yields. It was predicted that the use of the lowest SLR, 1:5 g pomace/mL water, would generate a highly viscous slurry that could impede the diffusion of compounds into the solvent due to solvent saturation. Therefore, a 1:10 SLR was used in the development of the two-stage countercurrent extraction to determine whether this reduction in water usage would impact phenolic yields.

3.5. Two-Stage Countercurrent Extraction of Phenolics from Grape Pomace

For the two-stage countercurrent AEP, extractions were performed at pH 9.36, 1:10 SLR, 50 °C, and 45 min in the first extraction followed by 75 min in the second extraction. The total phenolic content of the extracts from the two-stage countercurrent AEP are shown in Table 2 in comparison to the single-stage AEP and a conventional solvent control. The TPC of the two-stage countercurrent AEP (50.5 ± 1.16 mg GAE/g dry pomace) was significantly greater (p < 0.05) than the yield from the optimized single-stage AEP (42.9 ± 2.22 mg GAE/g dry pomace) but significantly lower than the TPC of the extract from conventional solvent extraction (62.5 ± 1.27 mg GAE/g dry pomace). Overall, the two-stage countercurrent AEP resulted in an 18% increase in TPC of the extracts, compared to the single-stage AEP, while simultaneously reducing water consumption by 80%.
In the countercurrent process, the nearly depleted insoluble fiber-rich fraction from the first extraction was re-extracted with fresh water, which increased the concentration gradient of the system and favored mass transfer and overall phenolic extractability even at a higher SLR. This strategy enriches the final extract with a concentrated solution of bioactive compounds while also reducing the volume of fresh water needed to propel diffusion.

3.6. Antioxidant Activity of Single-Stage and Two-Stage Countercurrent AEP Grape Pomace Extracts

The in vitro antioxidant activities of the grape pomace extracts were explored to provide insight into their potential radical scavenging applications in food, pharmaceutical, or cosmetic applications. As shown in Table 2, grape pomace extracts with higher TPC also showed higher antioxidant activities by both ABTS and ORAC radical scavenging methods. Both antioxidant assays were evaluated in this study to provide a more representative characterization of the antioxidant activity of the grape pomace extracts since their mechanisms of action are different. The ABTS method is a spectrophotometric assay that measures the single-electron transfer (SET) from the polyphenolic compounds in the grape pomace extract to the ABTS free radical [56]. The ORAC method is a fluorometric assay that utilizes a hydrogen atom transfer (HAT) reaction to terminate free radical propagation. The ORAC method is also considered more biologically relevant than the ABTS method since it measures the decomposition of peroxyl radicals similar to those generated from protein and lipid oxidation [56]
The extract from the two-stage countercurrent process was over three times more powerful at inhibiting the ABTS radical compared to the single-stage AEP extract and exhibited a similar magnitude compared to the conventional solvent extract. A similar trend was observed with the ORAC method, where a 70% increase in antioxidant potential was observed when moving from the single-stage AEP to the countercurrent AEP, although the conventional solvent extract presented a significantly higher antioxidant potential.
The positive correlation between TPC and antioxidant activity by ABTS and ORAC methods has been well reported for grape and other fruit extracts [57,58,59], and our data agree with the magnitude of the antioxidant potential reported using both ABTS and ORAC methods. Ky and Teissedre [57] compared the antioxidant activity of red grape skin and seed extracts from aqueous and 70% ethanol extractions performed at 1:3.5 SLR, 50 °C, and 60 min. The antioxidant activity of the aqueous skin and seed extracts ranged from 668 to 2433 µmol Trolox/g dry weight using the ABTS method and from 1034 to 2231 µmol Trolox/g dry weight using the ORAC method. Ethanol extractions showed higher antioxidant capacities, similar to the present study, with an ABTS range of 1923–3601 µmol Trolox/g dry weight and an ORAC range of 1239–2614 µmol Trolox/g dry weight.
Despite these similarities, direct comparisons between analyses are complicated, since the TPC and antioxidant activity of grape pomace extracts can differ due to grape cultivar, climate, soil type, winery scale, drying and storage conditions, type of pomace material tested (individual or mixed components: skins, seeds, stems, pulp), and extraction conditions used. Winemaking methods can also affect grape pomace composition, and subsequently, the phenolic profile and biological activity of the extracts. For example, the Cabernet Sauvignon pomace used in this study was collected prior to fermentation, so high residual sugars were expected, which influences the concentrations and forms of the insoluble-bound phenolics and their activities. In addition, the grapes were pressed at low pressure (1.6 psi), which contributes not only to residual moisture in the grape skins, but also to residual color (i.e., anthocyanins), which are strongly correlated to both in vivo and in vitro antioxidant capacity [60,61].

3.7. Phenolic Composition of Cabernet Sauvignon Grape Pomace Extracts

An untargeted metabolomics approach was used to screen for phenolic compounds in the single-stage AEP, two-stage countercurrent AEP, and hydroethanolic extracts of the unfermented Cabernet Sauvignon pomace. The untargeted method allowed for a broader screening and identification of a more diversified pool of phenolics associated with unfermented Cabernet Sauvignon grape pomace. Overall, the hydroethanolic extracts from conventional solvent extraction presented the most diverse phenolic profile with 33 identified and annotated compounds followed by the extracts from the two-stage countercurrent AEP (18 identified and annotated compounds) and the single-stage AEP (15 identified and annotated compounds) (Figure 6). Single-stage and two-stage AEP extracts showed similar phenolic compositions and were mainly composed of hydroxycinnamic acids, hydroxybenzoic acids, and flavonols. There were fewer identifications of these classes in the hydroethanolic extract, which was richer in anthocyanins and flavanols (Figure 6). Further improvements in aqueous extraction methods are warranted to target the recovery of anthocyanins and flavanols, which can improve the antioxidant activities of grape pomace extracts and provide various human health benefits [62].
In the single-stage AEP extracts, the compounds with the highest relative contents were isomers of trans-melilotoside followed by gentisic acid 5-O-glucoside, isorhamnetin 3-galactoside, and myricitrin (Supplementary Materials—Table S5). These compounds were also the major constituents of the extracts from two-stage countercurrent extraction (Figure 6). Melilotoside is a precursor of coumarin and is stored as a glucoside of trans-2-coumaric acid in plant vacuoles [63]. In wine grapes, melilotoside can undergo innate enzymatic or photochemical isomerization to form coumaric acid and coumarin [64]. As secondary plant metabolites, coumarins have exhibited antibacterial, antifungal, anti-inflammatory, and antioxidant activities [65]. Gentisic acid, which is associated with anticholinesterase activity [66], is one of the most prominent hydroxybenzoic acids in wine grapes, and an increase in its relative content in the extracts from the two-stage countercurrent process is likely due to the enrichment of the extracting media driving further diffusion. Isorhamnetin 3-galactoside, a derivative of quercetin, was more abundant in the countercurrent sample compared to the samples from single-stage AEP or conventional solvent extraction. The presence of these flavonols in red wine grapes has been further explored by Castillo- Muñoz et al. [67] and Marchante et al. [68]. Myricitrin is a rhamnose glycoside of myricetin that has been associated with the biosynthesis of anthocyanins in grapes [69].
Unique to the two-stage countercurrent process compared to the single-stage AEP were the identification and annotation of p-coumaric acid, vanillic acid glucoside, and astilbin (Supplementary Materials—Table S5), which increased the presence of hydroxycinnamic and hydroxybenzoic acids in the countercurrent sample (Figure 6). Astilbin has been identified and quantified in Cabernet Sauvignon wine by [70]. The two-stage countercurrent process may have enhanced the structural degradation of the grape matrix and aided phenolic release by improving the solubilization of these additional compounds.
Naringenin 7-O-glucoside, also known as prunin, was identified in the hydroethanolic extract (Supplementary Materials—Table S5). Naringenin is a major citrus flavanone displaying antioxidant and anti-inflammatory properties [71]. It has been identified in Chardonnay white wines by Rocchetti et al. [72] in a comprehensive study using untargeted metabolomics, and it was also reported in commercial dried Cabernet pomace [73] and in Sercial and Tinta Negra grape skins [74]. Epicatechins, catechins, and procyanidins were also identified exclusively in the hydroethanolic extracts (Supplementary Materials—Table S5). The identification of catechin isomers in the hydroethanolic extract may be due to the higher stability and better dissolution of these flavanols in ethanol compared to water due to the lower polarity and dielectric constant of ethanol [75]. While epicatechin gallate and catechin are more prominent in the grape skins, the procyanidin dimers and trimers are prevalent in grape seeds. The high relative content of procyanidin B2 in the hydroethanolic extract reflects previous results by Shi et al. [76], where increasing ethanolic concentrations to 50% (v/v) improved extraction of procyanidin dimers from grape seed meal.
Other notable changes in phenolic composition across extraction treatments include the identification of malvidin 3,5-diglucoside in only the hydroethanolic extract, which may be due to better stability of anthocyanins at less alkaline conditions (Supplementary Materials—Table S5). Salviaflaside, a phenolic acid glycoside that is most notably recognized in Prunella vulgaris, was also identified in the grape pomace sample extracted with ethanol (Supplementary Materials—Table S5). This compound has not yet been widely reported in Cabernet Sauvignon grape pomace.
Trans-piceid, a glucoside of resveratrol, was found in all three treatments. Trans-piceid has been identified in red and white wines and can be converted to resveratrol via glucosidase activity in the intestine [77,78], which highlights the role of human digestion in transforming polyphenols into different functional forms, or by yeast enzymes during winemaking [79]. Secoisolariciresinol, the lignan commonly found in flaxseeds, was also identified in all three grape pomace extracts with an increase in its relative content in the countercurrent method. The presence of secoisolariciresinol in wine has also been reported by Dadáková et al. [80]. The liberation of this lignan from the grape cell matrix in the present study is likely due to alkaline hydrolysis, which has been widely used to release secoisolariciresinol from flaxseed complexes by cleaving ester linkages [81].
Overall, the use of untargeted profiling allowed for the discovery of compounds present in the unfermented Cabernet Sauvignon pomace that may have been otherwise overlooked by only using targeted approaches driven by a few select standard compounds. Notably, the use of red wine grape pomace sourced from a white winemaking process presents a unique scenario that enabled the detection of red wine abundant compounds (e.g., anthocyanins) alongside phenolic glycosides that were not yet exposed to hydrolytic yeast enzymes such as β-glucosidases that are involved in traditional red wine fermentation processes [82]. The findings of this study support the valorization of red wine grape pomace for applications where diverse biological activity and functionality are desired, such as exploiting the antidiabetic properties of the phenolic-polysaccharide conjugates [51].

3.8. Quantification of Phenolics in Cabernet Sauvignon Grape Pomace Extracts

To supplement the findings from the untargeted metabolomics analysis, phenolic compounds from the grape pomace extracts were quantified by RP-HPLC-DAD (Supplementary Materials—Figures S1–S3). Following a similar pattern to the data from the TPC assay and the compound identifications via untargeted metabolomics, phenolic quantification by HPLC showed that the extract resulting from the two-stage countercurrent extraction (4559.14 µg/g freeze-dried pomace) contained a significantly (p < 0.05) higher concentration of total phenolics than the extract from the single-stage aqueous extraction (3926.71 µg/g dry pomace) (Table 3). Overall, 12 compounds were detected in the hydroethanolic extract followed by 11 compounds in the countercurrent extract and 10 compounds in the single-stage AEP extract. In the single-stage AEP and two-stage countercurrent extracts, polymeric phenols were detected in the highest concentrations (2698.75 and 3277.18 µg/g dry pomace, respectively), while malvidin-3-glucoside and polymeric pigments were detected in the highest concentrations (2287.45 and 2134.69 µg/g dry pomace) in the ethanolic extract. Using RP-HPLC-DAD, epicatechin, malvidin-3-glucoside, and epicatechin gallate were detected only in the grape pomace extract from the conventional extraction. These findings are consistent with the understanding that anthocyanins are more stable in more acidic ethanolic solvents [38], although the alkaline extracts in the present study maintained their antioxidant activity.
While the conventional solvent extract yielded the highest phenolic concentrations overall, the aqueous extracts contained 10–20 µg/g of ferulic acid and p-coumaric acid, while these compounds were not detected in the hydroethanolic extract. The alkaline extracts also contained significantly higher concentrations of two other bound phenolics, protocatechuic acid (21.94–23.73 µg/g) and syringic acid (332.08–414.2 µg/g), compared to the ethanolic extract (11.57 and 14.34 µg/g, respectively). Furthermore, significant (p < 0.05) increases in (+)-catechin, p-coumaric acid, ferulic acid, quercetin-3-O-glucuronide, naringenin-7-O-glucoside, and polymeric phenols were observed in the two-stage countercurrent extract compared to the single-stage aqueous alkaline extract. The production of the enriched extract using the two-stage countercurrent method can be attributed to the higher concentration gradient that is established during the dynamic circulation of fresh material and water. This phenomenon is in agreement with the findings from Triyastuti and Anwar [83] in the three-stage countercurrent extraction at 70 °C of anthocyanins (2815.43 mg/L) and quercetin (59.25 mg/L) from purple roselle calyxes.
It is evident that exposure to alkaline hydrolysis aids in the release of these bound phenolics from a fiber- and protein- rich plant matrix. Continued translational research on the health benefits of plant raw material rich in bound phenolics and fiber is necessary, like the study reported by Jiang et al. [84] since bound phenolics can be overlooked in bioactive analyses due to their resistant nature in conventional solvents.

4. Conclusions

An environmentally friendly, two-stage countercurrent method for extracting phenolics from red wine grape pomace resulting from a white wine production was successfully designed using alkaline conditions while reducing overall water consumption by 80%. The countercurrent extraction process enabled the extraction of bound phenolic acids, flavonols, flavones, and polymeric phenols from the grape cell matrix with unique identifications that have not yet been widely associated with red wine grape skins and seeds. Until this study, there existed limited evidence of the effect of alkaline hydrolysis on enhancing phenolic release from unfermented Cabernet Sauvignon grape pomace. Additionally, this report highlights the role of untargeted metabolomics in elucidating the phenolic profile of the red wine grape pomace resulting from a white winemaking process with further quantitation to support absolute abundancies. Overall, this study serves as a proof-of-concept for the use of a multi-stage countercurrent extraction process at alkaline conditions to produce valuable, environmentally benign, and antioxidant-rich extracts from underexplored winemaking waste streams. The benefits of alkaline conditions and the recirculation of processing streams in the countercurrent process were explicitly emphasized in this study, but the mechanism of phenolic release from the grape cell matrix should be further studied to develop a deeper understanding of alkali-based extractions, the stability of the extracts under long-term storage, and the in vivo efficacy of food, beverage, or supplement products incorporating these extracts as bioactive ingredients. Future work should also evaluate the economic feasibility of large-scale countercurrent designs at alkaline conditions to valorize winemaking byproducts and other agri-food waste streams for a variety of industrial applications.

Supplementary Materials

The following supporting information can be downloaded at: https://www.mdpi.com/article/10.3390/pr10102093/s1, Table S1: Variables and levels of the central composite rotatable design (CCRD) for the optimization of total phenolic content from wine grape pomace extracts; Table S2: Experimental variable levels and TPC responses of aqueous extractions from single-stage AEP optimization experiments; Table S3: ANOVA results of the regression model predicting TPC of single-stage AEP grape pomace extracts; Table S4: Predicted and experimental total phenolic content of optimization experiments at 75 min of extraction time; Table S5: Relative abundance of phenolics in grape pomace extracts using an untargeted metabolomics approach; Table S6: Method parameters for untargeted phenolic profiling; Figure S1: HPLC-DAD chromatograms of phenolic standards; Figure S2: HPLC-DAD chromatograms of two-stage countercurrent AEP; Figure S3: HPLC-DAD chromatograms of conventional solvent extraction.

Author Contributions

Conceptualization, J.M.L.N.d.M.B.; methodology, S.P., F.F.G.D., L.A.L.; software, S.P., F.F.G.D.; validation, S.P., F.F.G.D.; investigation, S.P., F.F.G.D., L.A.L.; resources, J.M.L.N.d.M.B.; data curation, S.P., F.F.G.D., J.M.L.N.d.M.B.; writing—S.P. and F.F.G.D.; writing—review and editing, S.P., F.F.G.D., J.M.L.N.d.M.B., and D.B.; supervision, J.M.L.N.d.M.B.; project administration, J.M.L.N.d.M.B.; funding acquisition, J.M.L.N.d.M.B. and D.B. All authors have read and agreed to the published version of the manuscript.

Funding

This research was funded by the USDA National Institute of Food and Agriculture, Hatch/Multi State project [1023517] and CA-D-FST-2187-H.

Data Availability Statement

All data generated or analyzed in this study are included in this manuscript.

Acknowledgments

Thank you to Leticia Chacon Rodriguez, Head Winemaker and Winery Manager at UC Davis Department of Viticulture and Enology, for her assistance in acquiring the grape pomace sample and detailing the processing history. The graphical abstract was created with BioRender.com under license agreement number MA23OHAGBD on 15 March 2022.

Conflicts of Interest

The authors declare no conflict of interest.

References

  1. California Department of Food and Agriculture. California Grape Crush Report Final 2019; 2020. In USDA National Agricultural Statistics Service. Available online: https://www.nass.usda.gov/Statistics_by_State/California/Publications/Specialty_and_Other_Releases/Grapes/Crush/Final/2020/2020_final_grape%20crush.pdf (accessed on 4 September 2022).
  2. Hidalgo, P.; Pueyo, E.; Pozo-Bayón, M.A.; Martínez-Rodríguez, A.J.; Martín-Álvarez, P.; Polo, M.C. Sensory and Analytical Study of Rosé Sparkling Wines Manufactured by Second Fermentation in the Bottle. J. Agric. Food Chem. 2004, 52, 6640–6645. [Google Scholar] [CrossRef] [PubMed]
  3. Chowdhary, P.; Gupta, A.; Gnansounou, E.; Pandey, A.; Chaturvedi, P. Current Trends and Possibilities for Exploitation of Grape Pomace as a Potential Source for Value Addition. Environ. Pollut. 2021, 278, 116796. [Google Scholar] [CrossRef] [PubMed]
  4. Oliveira, M.; Duarte, E. Integrated Approach to Winery Waste: Waste Generation and Data Consolidation. Front. Environ. Sci. Eng. 2016, 10, 168–176. [Google Scholar] [CrossRef]
  5. Pérez-Serradilla, J.A.; de Castro, M.D.L. Role of Lees in Wine Production: A Review. Food Chem. 2008, 111, 447–456. [Google Scholar] [CrossRef] [PubMed]
  6. Saura-Calixto, F. Dietary Fiber as a Carrier of Dietary Antioxidants: An Essential Physiological Function. J. Agric. Food Chem. 2011, 59, 43–49. [Google Scholar] [CrossRef] [PubMed]
  7. El Achkar, J.H.; Lendormi, T.; Salameh, D.; Louka, N.; Maroun, R.G.; Lanoisellé, J.L.; Hobaika, Z. Influence of Pretreatment Conditions on Lignocellulosic Fractions and Methane Production from Grape Pomace. Bioresour. Technol. 2018, 247, 881–889. [Google Scholar] [CrossRef]
  8. Costa, J.R.; Amorim, M.; Vilas-Boas, A.; Tonon, R.V.; Cabral, L.M.C.; Pastrana, L.; Pintado, M. Impact of in Vitro Gastrointestinal Digestion on the Chemical Composition, Bioactive Properties, and Cytotoxicity of Vitis vinifera L. Cv. Syrah Grape Pomace Extract. Food Funct. 2019, 10, 1856–1869. [Google Scholar] [CrossRef]
  9. Sinrod, A.J.G.; Li, X.; Bhattacharya, M.; Paviani, B.; Wang, S.C.; Barile, D. A Second Life for Wine Grapes: Discovering Potentially Bioactive Oligosaccharides and Phenolics in Chardonnay Marc and Its Processing Fractions. LWT 2021, 144, 111192. [Google Scholar] [CrossRef]
  10. Teixeira, A.; Baenas, N.; Dominguez-Perles, R.; Barros, A.; Rosa, E.; Moreno, D.A.; Garcia-Viguera, C. Natural Bioactive Compounds from Winery By-Products as Health Promoters: A Review. Int. J. Mol. Sci. 2014, 15, 15638–15678. [Google Scholar] [CrossRef] [Green Version]
  11. Pinelo, M.; Arnous, A.; Meyer, A.S. Upgrading of Grape Skins: Significance of Plant Cell-Wall Structural Components and Extraction Techniques for Phenol Release. Trends Food Sci. Technol. 2006, 17, 579–590. [Google Scholar] [CrossRef]
  12. Nayak, A.; Bhushan, B.; Rosales, A.; Turienzo, L.R.; Cortina, J.L. Valorisation Potential of Cabernet Grape Pomace for the Recovery of Polyphenols: Process Intensification, Optimisation and Study of Kinetics. Food Bioprod. Process. 2018, 109, 74–85. [Google Scholar] [CrossRef]
  13. Srinivas, K.; King, J.W.; Monrad, J.K.; Howard, L.R.; Zhang, D.; Martin, R.E. Pressurized Solvent Extraction of Flavonoids from Grape Pomace Utilizing Organic Acid Additives. Ital. J. Food Sci. 2011, 23, 90–105. [Google Scholar]
  14. Naczk, M.; Shahidi, F. Extraction and Analysis of Phenolics in Food. J. Chromatogr. A 2004, 1054, 95–111. [Google Scholar] [CrossRef]
  15. Kallithraka, S.; Garcia-Viguera, C.; Bridle, P.; Bakker, J. Survey of Solvents for the Extraction of Grape Seed Phenolics. Phytochem. Anal. 1995, 6, 265–267. [Google Scholar] [CrossRef]
  16. Ding, Y.; Morozova, K.; Scampicchio, M.; Ferrentino, G. Non-Extractable Polyphenols from Food by-Products: Current Knowledge on Recovery, Characterisation, and Potential Applications. Processes 2020, 8, 925. [Google Scholar] [CrossRef]
  17. Li, W.; Yang, R.; Ying, D.; Yu, J.; Sanguansri, L.; Augustin, M.A. Analysis of Polyphenols in Apple Pomace: A Comparative Study of Different Extraction and Hydrolysis Procedures. Ind. Crops Prod. 2020, 147, 112250. [Google Scholar] [CrossRef]
  18. Acosta-Estrada, B.A.; Gutiérrez-Uribe, J.A.; Serna-Saldívar, S.O. Bound Phenolics in Foods, a Review. Food Chem. 2014, 152, 46–55. [Google Scholar] [CrossRef]
  19. Arranz, S.; Saura Calixto, F. Analysis of Polyphenols in Cereals May Be Improved Performing Acidic Hydrolysis: A Study in Wheat Flour and Wheat Bran and Cereals of the Diet. J. Cereal Sci. 2010, 51, 313–318. [Google Scholar] [CrossRef]
  20. Kim, K.H.; Tsao, R.; Yang, R.; Cui, S.W. Phenolic Acid Profiles and Antioxidant Activities of Wheat Bran Extracts and the Effect of Hydrolysis Conditions. Food Chem. 2006, 95, 466–473. [Google Scholar] [CrossRef]
  21. Fazary, A.E.; Ju, Y.-H. Feruloyl Esterases as Biotechnological Tools: Current and Future Perspectives. Acta Biochim. Biophys. Sin. 2007, 39, 811–828. [Google Scholar] [CrossRef]
  22. Panić, M.; Gunjević, V.; Cravotto, G.; Radojčić Redovniković, I. Enabling Technologies for the Extraction of Grape-Pomace Anthocyanins Using Natural Deep Eutectic Solvents in up-to-Half-Litre Batches Extraction of Grape-Pomace Anthocyanins Using NADES. Food Chem. 2019, 300, 125185. [Google Scholar] [CrossRef] [PubMed]
  23. Lima, Á.S.; Soares, C.M.F.; Paltram, R.; Halbwirth, H.; Bica, K. Extraction and Consecutive Purification of Anthocyanins from Grape Pomace Using Ionic Liquid Solutions. Fluid Phase Equilibria 2017, 451, 68–78. [Google Scholar] [CrossRef]
  24. Moro, K.I.B.; Bender, A.B.B.; da Silva, L.P.; Penna, N.G. Green Extraction Methods and Microencapsulation Technologies of Phenolic Compounds From Grape Pomace: A Review. Food Bioprocess Technol. 2021, 14, 1407–1431. [Google Scholar] [CrossRef]
  25. Rosenthal, A.; Pyle, D.L.; Niranjan, K. Aqueous and Enzymatic Processes for Edible Oil Extraction. Enzym. Microb. Technol. 1996, 19, 402–420. [Google Scholar] [CrossRef]
  26. de Moura, J.M.L.N.; Campbell, K.; Mahfuz, A.; Jung, S.; Glatz, C.E.; Johnson, L. Enzyme-Assisted Aqueous Extraction of Oil and Protein from Soybeans and Cream de-Emulsification. JAOCS J. Am. Oil Chem. Soc. 2008, 85, 985–995. [Google Scholar] [CrossRef]
  27. de Moura, J.M.L.N.; Campbell, K.; de Almeida, N.M.; Glatz, C.E.; Johnson, L.A. Protein Extraction and Membrane Recovery in Enzyme-Assisted Aqueous Extraction Processing of Soybeans. J. Am. Oil Chem. Soc. 2011, 88, 877–889. [Google Scholar] [CrossRef]
  28. Zhao, S.; Baik, O.-D.; Choi, Y.J.; Kim, S.-M. Pretreatments for the Efficient Extraction of Bioactive Compounds from Plant-Based Biomaterials. Crit. Rev. Food Sci. Nutr. 2014, 54, 1283–1297. [Google Scholar] [CrossRef]
  29. de Moura, J.M.L.N.; Johnson, L.A. Two-Stage Countercurrent Enzyme-Assisted Aqueous Extraction Processing of Oil and Protein from Soybeans. J. Am. Oil Chem. Soc. 2009, 86, 283–289. [Google Scholar] [CrossRef]
  30. Souza Almeida, F.; Furlan Goncalves Dias, F.; Kawazoe Sato, A.C.; Leite Nobrega de Moura Bell, J.M. From Solvent Extraction to the Concurrent Extraction of Lipids and Proteins from Green Coffee: An Eco-Friendly Approach to Improve Process Feasibility. Food Bioprod. Process. 2021, 129, 144–156. [Google Scholar] [CrossRef]
  31. Moro, K.I.B.; Bender, A.B.B.; Ferreira, D.d.F.; Speroni, C.S.; Barin, J.S.; da Silva, L.P.; Penna, N.G. Recovery of Phenolic Compounds from Grape Pomace (Vitis vinifera L.) by Microwave Hydrodiffusion and Gravity. LWT 2021, 150, 112066. [Google Scholar] [CrossRef]
  32. Rajha, H.N.; Ziegler, W.; Louka, N.; Hobaika, Z.; Vorobiev, E.; Boechzelt, H.G.; Maroun, R.G. Effect of the Drying Process on the Intensification of Phenolic Compounds Recovery from Grape Pomace Using Accelerated Solvent Extraction. Int. J. Mol. Sci. 2014, 15, 18640–18658. [Google Scholar] [CrossRef]
  33. Darra, N.e.; Grimi, N.; Vorobiev, E.; Louka, N.; Maroun, R.; Darra, N.E.; Grimi, N.; Vorobiev, E.; Louka, N.; Maroun, R.; et al. Extraction of Polyphenols from Red Grape Pomace Assisted by Pulsed Ohmic Heating. Food Bioprocess Technol. 2013, 6, 1281–1289. [Google Scholar] [CrossRef]
  34. Tomaz, I.; Šeparović, M.; Štambuk, P.; Preiner, D.; Maletić, E.; Karoglan Kontić, J. Effect of Freezing and Different Thawing Methods on the Content of Polyphenolic Compounds of Red Grape Skins. J. Food Process. Preserv. 2018, 42, e13550. [Google Scholar] [CrossRef]
  35. AOAC Official Method 925.09-1925; Solids (Total) and Loss on Drying (Moisture); Official Methods of Analysis of AOAC International: Arlington, VA, USA, 2015.
  36. AOCS Official Method Ba 5-49; Ash in Oilseed Cake and Meals; Official Methods and Recommended Practices of the AOCS: Urbana, IL, USA, 2017.
  37. AOAC Official Method 922.06 Fat in Flour; Acid Hydrolysis Method; Official Methods of Analysis of AOAC International: Arlington, VA, USA, 2012.
  38. Amendola, D.; de Faveri, D.M.; Spigno, G. Grape Marc Phenolics: Extraction Kinetics, Quality and Stability of Extracts. J. Food Eng. 2010, 97, 384–392. [Google Scholar] [CrossRef]
  39. Singleton, V.L.; Orthofer, R.; Lamuela-Raventós, R.M. Analysis of Total Phenols and Other Oxidation Substrates and Antioxidants by Means of Folin-Ciocalteu Reagent. Methods Enzym. 1999, 299, 152–178. [Google Scholar] [CrossRef]
  40. Al-Duais, M.; Müller, L.; Böhm, V.; Jetschke, G. Antioxidant Capacity and Total Phenolics of Cyphostemma Digitatum before and after Processing: Use of Different Assays. Eur. Food Res. Technol. 2009, 228, 813–821. [Google Scholar] [CrossRef]
  41. Zulueta, A.; Esteve, M.J.; Frígola, A. ORAC and TEAC Assays Comparison to Measure the Antioxidant Capacity of Food Products. Food Chem. 2009, 114, 310–316. [Google Scholar] [CrossRef]
  42. Fiehn, O.; Wohlgemuth, G.; Scholz, M.; Kind, T.; Lee, D.Y.; Lu, Y.; Moon, S.; Nikolau, B. Quality Control for Plant Metabolomics: Reporting MSI-Compliant Studies. Plant J. 2008, 53, 691–704. [Google Scholar] [CrossRef]
  43. Konar, N.; Poyrazoĝlu, E.S.; Demir, K.; Artik, N. Determination of Conjugated and Free Isoflavones in Some Legumes by LC–MS/MS. J. Food Compos. Anal. 2012, 25, 173–178. [Google Scholar] [CrossRef]
  44. Librán, C.M.; Mayor, L.; Garcia-Castello, E.M.; Vidal-Brotons, D. Polyphenol Extraction from Grape Wastes: Solvent and PH Effect. Agric. Sci. 2013, 04, 56–62. [Google Scholar] [CrossRef] [Green Version]
  45. Oreopoulou, A.; Tsimogiannis, D.; Oreopoulou, V. Extraction of Polyphenols from Aromatic and Medicinal Plants: An Overview of the Methods and the Effect of Extraction Parameters. In Polyphenols in Plants; Elsevier: Amsterdam, The Netherlands, 2019; pp. 243–259. ISBN 9780128137680. [Google Scholar]
  46. Arranz, S.; Saura-Calixto, F.; Shaha, S.; Kroon, P.A. High Contents of Nonextractable Polyphenols in Fruits Suggest That Polyphenol Contents of Plant Foods Have Been Underestimated. J. Agric. Food Chem. 2009, 57, 7298–7303. [Google Scholar] [CrossRef] [PubMed]
  47. Yilmaz, Y.; Toledo, R.T. Oxygen Radical Absorbance Capacities of Grape/Wine Industry Byproducts and Effect of Solvent Type on Extraction of Grape Seed Polyphenols. J. Food Compos. Anal. 2006, 19, 41–48. [Google Scholar] [CrossRef]
  48. Sant’Anna, V.; Brandelli, A.; Marczak, L.D.F.; Tessaro, I.C. Kinetic Modeling of Total Polyphenol Extraction from Grape Marc and Characterization of the Extracts. Sep. Purif. Technol. 2012, 100, 82–87. [Google Scholar] [CrossRef]
  49. White, B.L.; Howard, L.R.; Prior, R.L. Release of Bound Procyanidins from Cranberry Pomace by Alkaline Hydrolysis. J. Agric. Food Chem. 2010, 58, 7572–7579. [Google Scholar] [CrossRef] [PubMed]
  50. Shahidi, F.; Yeo, J. Insoluble-Bound Phenolics in Food. Molecules 2016, 21, 1216. [Google Scholar] [CrossRef] [PubMed]
  51. Campos, F.; Peixoto, A.F.; Fernandes, P.A.R.; Coimbra, M.A.; Mateus, N.; de Freitas, V.; Fernandes, I.; Fernandes, A. The Antidiabetic Effect of Grape Pomace Polysaccharide-Polyphenol Complexes. Nutrients 2021, 13, 4495. [Google Scholar] [CrossRef] [PubMed]
  52. Friedman, M.; Jürgens, H.S. Effect of PH on the Stability of Plant Phenolic Compounds. J. Agric. Food Chem. 2000, 48, 2101–2110. [Google Scholar] [CrossRef]
  53. Liyanapathirana, C.; Shahidi, F. Optimization of Extraction of Phenolic Compounds from Wheat Using Response Surface Methodology. Food Chem. 2005, 93, 47–56. [Google Scholar] [CrossRef]
  54. Larrauri, J.A.; Rupérez, P.; Saura-Calixto, F. Effect of Drying Temperature on the Stability of Polyphenols and Antioxidant Activity of Red Grape Pomace Peels. J. Agric. Food Chem. 1997, 45, 1390–1393. [Google Scholar] [CrossRef]
  55. Spigno, G.; Tramelli, L.; de Faveri, D.M. Effects of Extraction Time, Temperature and Solvent on Concentration and Antioxidant Activity of Grape Marc Phenolics. J. Food Eng. 2007, 81, 200–208. [Google Scholar] [CrossRef]
  56. Speisky, H.; Fuentes, J.; Dorta, E.; Lopez-Alarcón, C. Polyphenols: Sources and Main Characteristics in Advances in Technologies for Producing Food-Relevant Polyphenols; CRC Press: Boca Raton, FL, USA, 2016. [Google Scholar]
  57. Ky, I.; Teissedre, P.L. Characterisation of Mediterranean Grape Pomace Seed and Skin Extracts: Polyphenolic Content and Antioxidant Activity. Molecules 2015, 20, 2190. [Google Scholar] [CrossRef]
  58. Monagas, M.; Hernandez-Ledesma, B.; Garrido, I.; Martin-Alvarez, P.J.; Gomez-Cordoves, C.; Bartolome, B.; Monagas, M.; Hernández-Ledesma, B.; Martín-Álvarez, P.J.; Gómez-Cordovés, C.; et al. Quality Assessment of Commercial Dietary Antioxidant Products from Vitis vinifera L. Grape Seeds. Nutr. Cancer 2005, 53, 244–254. [Google Scholar] [CrossRef]
  59. Dudonné, S.; Vitrac, X.; Couti, P.; Woillez, M.; de Bélis, R.; Sen, L.; des Substances Végétales, E.; Biologique, A. Comparative Study of Antioxidant Properties and Total Phenolic Content of 30 Plant Extracts of Industrial Interest Using DPPH, ABTS, FRAP, SOD, and ORAC Assays. J. Agric. Food Chem. 2019, 57, 1768–1774. [Google Scholar] [CrossRef]
  60. Lingua, M.S.; Fabani, M.P.; Wunderlin, D.A.; Baroni, M.v. In Vivo Antioxidant Activity of Grape, Pomace and Wine from Three Red Varieties Grown in Argentina: Its Relationship to Phenolic Profile. J. Funct. Foods 2015, 20, 332–345. [Google Scholar] [CrossRef]
  61. Valls, J.; Agnolet, S.; Haas, F.; Struffi, I.; Ciesa, F.; Robatscher, P.; Oberhuber, M. Valorization of Lagrein Grape Pomace as a Source of Phenolic Compounds: Analysis of the Contents of Anthocyanins, Flavanols and Antioxidant Activity. Eur. Food Res. Technol. 2017, 243, 2211–2224. [Google Scholar] [CrossRef]
  62. Monrad, J.K.; Suárez, M.; Motilva, M.J.; King, J.W.; Srinivas, K.; Howard, L.R. Extraction of Anthocyanins and Flavan-3-Ols from Red Grape Pomace Continuously by Coupling Hot Water Extraction with a Modified Expeller. Food Res. Int. 2014, 65, 77–87. [Google Scholar] [CrossRef]
  63. Liu, B.; Raeth, T.; Beuerle, T.; Beerhues, L. A Novel 4-Hydroxycoumarin Biosynthetic Pathway. Plant Mol. Biol. 2010, 72, 17–25. [Google Scholar] [CrossRef]
  64. Hroboňová, K.; Sádecká, J. Coumarins Content in Wine: Application of HPLC, Fluorescence Spectrometry, and Chemometric Approach. J. Food Sci. Technol. 2020, 57, 200–209. [Google Scholar] [CrossRef]
  65. Borges, F.; Roleira, F.; Milhazes, N.; Santana, L.; Uriarte, E. Simple Coumarins and Analogues in Medicinal Chemistry: Occurrence, Synthesis and Biological Activity. Curr. Med. Chem. 2005, 12, 887–916. [Google Scholar] [CrossRef]
  66. Stój, A.; Szwajgier, D.; Baranowska-Wójcik, E.; Domagała, D. Gentisic Acid, Salicylic Acid, Total Phenolic Content and Cholinesterase Inhibitory Activities of Red Wines Made from Various Grape Varieties. S. Afr. J. Enol. Vitic. 2019, 40. [Google Scholar] [CrossRef]
  67. Castillo-Muñoz, N.; Gómez-Alonso, S.; García-Romero, E.; Hermosín-Gutiérrez, I. Flavonol Profiles of Vitis vinifera Red Grapes and Their Single-Cultivar Wines. J. Agric. Food Chem. 2007, 55, 992–1002. [Google Scholar] [CrossRef] [PubMed]
  68. Marchante, L.; Gómez Alonso, S.; Alañón, M.E.; Pérez-Coello, M.S.; Díaz-Maroto, M.C. Natural Extracts from Fresh and Oven-Dried Winemaking by-Products as Valuable Source of Antioxidant Compounds. Food Sci. Nutr. 2018, 6, 1564–1574. [Google Scholar] [CrossRef] [PubMed] [Green Version]
  69. Niu, S.; Hao, F.; Mo, H.; Jiang, J.; Wang, H.; Liu, C.; Fan, X.; Zhang, Y. Phenol Profiles and Antioxidant Properties of White Skinned Grapes and Their Coloured Genotypes during Growth. Biotechnol. Biotechnol. Equip. 2016, 31, 58–67. [Google Scholar] [CrossRef] [Green Version]
  70. Landrault, N.; Larronde, F.; Delaunay, J.C.; Castagnino, C.; Vercauteren, J.; Merillon, J.M.; Gasc, F.; Cros, G.; Teissedre, P.L. Levels of Stilbene Oligomers and Astilbin in French Varietal Wines and in Grapes during Noble Rot Development. J. Agric. Food Chem. 2002, 50, 2046–2052. [Google Scholar] [CrossRef] [PubMed]
  71. Alam, M.A.; Subhan, N.; Rahman, M.M.; Uddin, S.J.; Reza, H.M.; Sarker, S.D. Effect of Citrus Flavonoids, Naringin and Naringenin, on Metabolic Syndrome and Their Mechanisms of Action. Adv. Nutr. 2014, 5, 404. [Google Scholar] [CrossRef] [PubMed] [Green Version]
  72. Rocchetti, G.; Gatti, M.; Bavaresco, L.; Lucini, L. Untargeted Metabolomics to Investigate the Phenolic Composition of Chardonnay Wines from Different Origins. J. Food Compos. Anal. 2018, 71, 87–93. [Google Scholar] [CrossRef]
  73. Ramirez-Lopez, L.M.; DeWitt, C.A.M. Analysis of Phenolic Compounds in Commercial Dried Grape Pomace by High-Performance Liquid Chromatography Electrospray Ionization Mass Spectrometry. Food Sci. Nutr. 2014, 2, 470. [Google Scholar] [CrossRef]
  74. Perestrelo, R.; Lu, Y.; Santos, S.A.O.; Silvestre, A.J.D.; Neto, C.P.; Câmara, J.S.; Rocha, S.M. Phenolic Profile of Sercial and Tinta Negra Vitis vinifera L. Grape Skins by HPLC–DAD–ESI-MSn: Novel Phenolic Compounds in Vitis vinifera L. Grape. Food Chem. 2012, 135, 94–104. [Google Scholar] [CrossRef] [Green Version]
  75. Cuevas-Valenzuela, J.; González-Rojas, Á.; Wisniak, J.; Apelblat, A.; Pérez-Correa, J.R. Solubility of (+)-Catechin in Water and Water-Ethanol Mixtures within the Temperature Range 277.6–331.2 K: Fundamental Data to Design Polyphenol Extraction Processes. Fluid Ph. Equilibria 2014, 382, 279–285. [Google Scholar] [CrossRef]
  76. Shi, J.; Yu, J.; Pohorly, J.; Young, J.C.; Bryan, M.; Wu, Y.; Canada, A. Optimization of the Extraction of Polyphenols from Grape Seed Meal by Aqueous Ethanol Solution. J. Food Agric. Environ. 2003, 1, 42–47. [Google Scholar]
  77. Sato, M.; Suzuki, Y.; Okuda, T.; Yokotsuka, K. Contents of Resveratrol, Piceid, and Their Isomers in Commercially Available Wines Made from Grapes Cultivated in Japan. Biosci. Biotechnol. Biochem. 1997, 61, 1800–1805. [Google Scholar] [CrossRef]
  78. Vian, M.A.; Tomao, V.; Gallet, S.; Coulomb, P.O.; Lacombe, J.M. Simple and Rapid Method for Cis- and Trans-Resveratrol and Piceid Isomers Determination in Wine by High-Performance Liquid Chromatography Using Chromolith Columns. J. Chromatogr. A 2005, 1085, 224–229. [Google Scholar] [CrossRef]
  79. Gaensly, F.; Agustini, B.C.; da Silva, G.A.; Picheth, G.; Bonfim, T.M.B. Autochthonous Yeasts with β-Glucosidase Activity Increase Resveratrol Concentration during the Alcoholic Fermentation of Vitis Labrusca Grape Must. J. Funct. Foods 2015, 19, 288–295. [Google Scholar] [CrossRef] [Green Version]
  80. Dadáková, K.; Jurasová, L.; Tomáš Kašparovský, T.; Průšová, B.; Mojmír Baroň, M.; Sochor, J. Origin of Wine Lignans. Mater. Veg. 2021, 1, 3. [Google Scholar] [CrossRef]
  81. Fuentealba, C.; Figuerola, F.; Estévez, A.M.; González-Munõz, A.; Munõz, O. Optimization of Secoisolariciresinol Diglucoside Extraction from Flaxseed (Linum usitatissimum L.) and Isolation by a Simple HPLC-UV Method. Food 2015, 13, 273–281. [Google Scholar] [CrossRef] [Green Version]
  82. Zhang, P.; Ma, W.; Meng, Y.; Zhang, Y.; Jin, G.; Fang, Z. Wine Phenolic Profile Altered by Yeast: Mechanisms and Influences. Compr. Rev. Food Sci. Food Saf. 2021, 20, 3579–3619. [Google Scholar] [CrossRef]
  83. Triyastuti, M.S.; Anwar, N. Bioactive Compounds from Purple Roselle Calyx (Hibiscus sabdariffa L.) extract using multistage countercurrent method. Media Gizi Indones. 2022, 17, 1–10. [Google Scholar] [CrossRef]
  84. Jiang, G.; Wu, Z.; Ramachandra, K.; Zhao, C.; Ameer, K. Changes in Structural and Chemical Composition of Insoluble Dietary Fibers Bound Phenolic Complexes from Grape Pomace by Alkaline Hydrolysis Treatment. Food Sci. Technol. 2022, 42. [Google Scholar] [CrossRef]
Figure 1. Process flow diagram for the single-stage AEP experiments evaluating the effect of pH (2.64–9.36), SLR (1:50.0–1:5.0), and temperature (41.6–58.4 °C) on grape pomace phenolic extraction.
Processes 10 02093 g001
Figure 2. Process flow diagram for the two-stage countercurrent AEP.
Processes 10 02093 g002
Figure 3. Effects of (A) the aqueous slurry pH on the TPC (Folin-Ciocalteu method) of AEP grape pomace extracts and (B) ethanol solvent concentration on the TPC of grape pomace extracts produced by conventional solvent extraction. All extractions were conducted using a 1:10 SLR at 50 °C for 90 min. Different letters represent significant differences in TPC (p < 0.05) across the extraction treatments. Data represent the mean ± one standard deviation of triplicates.
Processes 10 02093 g003
Figure 4. Simultaneous impact of pH (2.64–9.36), SLR (1:5.0–1:50.0), and temperature (41.6 °C–58.4 °C) on the TPC (Folin-Ciocalteu method) of grape pomace extracts from the single-stage AEP at different reaction times. Data represent the mean ± SD of triplicate extractions.
Processes 10 02093 g004
Figure 5. Response surface plot showing the effect of (A) SLR vs. pH, (B) Temperature (°C) vs. pH, and (C) Temperature (°C) vs. SLR on the TPC (Folin-Ciocalteu method) of grape pomace extracts in single-stage AEP after 75 min.
Processes 10 02093 g005
Figure 6. Phenolic composition of validated single-stage AEP, two-stage countercurrent AEP, and conventional solvent extracts as identified by untargeted metabolomics.
Processes 10 02093 g006
Table 1. Effect of increasing the slurry SLR on the predicted TPC of aqueous extracts produced by the single-stage AEP.
Validated Single-Stage
AEP Conditions
Theoretical Single-Stage AEP at Varying SLR Conditions
SLR (1:x)1:501:451:401:351:301:251:201:151:101:5
Uncoded SLR0.0200.0220.0250.0290.0330.0400.0500.0700.1000.200
Coded SLR−1.68−1.64−1.59−1.52−1.43−1.31−1.12−0.802−0.1871.68
10.7210.710.710.710.710.710.710.710.710.710.7
7.26x112.212.212.212.212.212.212.212.212.212.2
4.33x1212.312.312.312.312.312.312.312.312.312.3
−3.41x25.75.65.45.24.94.53.82.70.6−5.7
0.95x30000000000
−1.73x1x24.94.84.64.44.23.83.32.30.5−4.9
Predicted TPC45.845.645.244.844.243.542.340.336.424.6
Table 2. TPC and antioxidant activities of validated single-stage AEP, two-stage countercurrent AEP, and conventional solvent extraction.
TPC
(mg GAE/g Dry Pomace)
ABTS
(µmol TE/g Dry Pomace)
ORAC
(µmol TE/g Dry Pomace)
Predicted *Experimental **
Validated single-stage AEP
(pH 9.36, 1:50 SLR, 50 °C, 75 min)
45.8a42.9 ± 2.22 bC547 ± 44.5 B547 ± 44.5 B
Two-stage countercurrent extraction
(pH 9.36, 1:10 SLR, 50 °C, 45/75 min)
-50.5 ± 1.16 B930 ± 168.0 B930 ± 168.0 B
(Conventional solvent extraction)
60% ethanol, 1:10 SLR, 50 °C, 75 min
-62.5 ± 1.27 A3005 ± 480.1 A3005 ± 480.1 A
* Predicted TPC from the regression model. ** Experimental TPC from triplicate extractions. Different lowercase letters in the same row indicate significant (p < 0.05) differences between pre-dicted and experimental TPC of the optimized single-stage AEP. Different uppercase letters in the same column indicate significant (p < 0.05) differences in TPC or antioxidant activities between extraction methods.
Table 3. Concentration (µg/g dry pomace) of phenolic compounds by RP-HPLC-DAD.
Concentration (µg/g Dry Pomace)
CompoundValidated
Single-Stage AEP
Two-Stage
Countercurrent AEP
Conventional
Solvent Extraction
Gallic acid3.47 ± 0.82 b5.78 ± 1.72 b34.57 ± 2.66 a
Protocatechuic acid21.94 ± 1.09 a23.73 ± 0.15 a11.57 ± 1.75 b
(+)-Catechin204.21 ± 9.41 b320.13 ± 15.5 a308.1 ± 28.52 a
Syringic acid414.2 ± 14.77 a332.08 ± 21.36 b14.34 ± 3.63 c
(-)-Epicatechinnot detectednot detected233.29 ± 58.18
p-Coumaric acid15.38 ± 0.67 b18.13 ± 0.82 anot detected
Ferulic acid10.26 ± 0.67 b20.64 ± 2.37 anot detected
Malvidin-3-O-glucosidenot detectednot detected2287.45 ± 135.63
(-)-Epicatechin gallatenot detectednot detected79.06 ± 4.09
Quercetin-3-O-glucuronide23.24 ± 1.68 c37.87 ± 2.67 b142.94 ± 16.72 a
Naringenin-7-O-glucosidenot detected71.64 ± 1.6 b117.15 ± 28.73 a
Isorhamnetin-3-O-glucoside78.41 ± 6.91 a47.73 ± 7.87 b62.54 ± 10.48 a
Polymeric phenols2698.75 ± 241.59 b3277.18 ± 63.83 a2134.69 ± 45.20 c
Polymeric pigments456.85 ± 48.61 a404.24 ± 45.34 a117.22 ± 171.78 b
Total3926.71 ± 321.22 c4559.14 ± 156.23 b5542.94 ± 462.17 a
Different letters indicate statistically significant differences within the columns at p < 0.05.
Publisher’s Note: MDPI stays neutral with regard to jurisdictional claims in published maps and institutional affiliations.

