Article

Removal of Hydrogen Sulfide and Ammonia Using a Biotrickling Filter Packed with Modified Composite Filler

State Environmental Protection Key Laboratory of Food Chain Pollution Control, Beijing Technology and Business University, Beijing 100048, China
*
Authors to whom correspondence should be addressed.
Processes 2022, 10(10), 2016; https://doi.org/10.3390/pr10102016
Submission received: 23 August 2022 / Revised: 3 October 2022 / Accepted: 4 October 2022 / Published: 5 October 2022
(This article belongs to the Section Environmental and Green Processes)

Abstract

:
The purpose of this study was to evaluate the performance of laboratory-scale biotrickling filters (BTFs) packed with composite filler and pine bark filler under different operating conditions in purifying mixed gas containing H2S and NH3. The composite filler was prepared with modified activated carbon and loaded with functional microbes, using the microbial immobilization technology combined with a nutrient sustained-release composite filler. The results showed that the composite filler could better adapt to low empty bed retention time (EBRT) and high inlet concentration than the pine bark filler. When EBRT was 40 s and the inlet load was 41 g/m3·h, the NH3 removal efficiency of the composite filler was kept above 80%, and when the inlet load was 61.5 g/m3·h, it could be stabilized at about 60%. When EBRT exceeds 34 s, the H2S removal efficiency of the two BTFs was maintained at 100%. Yet, when EBRT was 34 s, the H2S removal efficiency of the bark filler BTF dropped to <80%. The microbial diversity and richness of the bark filler BTF were significantly higher than those of the composite filler BTF, which had higher community similarity under each working condition. However, the proportion of predominant bacteria in the composite filler BTF was higher than that of the bark filler BTF. As the inlet load increased, the diversity of predominant bacteria of the composite filler BTF increased, which means that the predominant bacteria were less inhibited by high-concentration odorous gases. The predominant bacteria with deodorizing function in the composite filler BTF included Pseudomonas, Comamonas, and Trichococcus, which might jointly complete nitrogen’s nitrification and denitrification processes. The proportion of these three bacteria in the composite filler BTF was higher than in the bark filler BTF.

1. Introduction

Kitchen waste is highly perishable and characterized by high moisture content, salt content, and organic components [1,2]. During the decomposition process, it produces odorous gases containing nitrogen and sulfur compounds, which pollute the environment and threaten human health [3,4]. Biodegradation has been frequently applied in treating sulfur- and nitrogen-containing waste gases, especially low- and medium-concentration odorous gases [5,6,7]. Biotrickling filters (BTFs) are one of the most efficient, simplest, and inexpensive technologies for removing odorous gases, including ammonia and hydrogen sulfide [8,9]. Zhuo et al. showed the performance of a BTF in desulfurizing biogas containing low-concentration H2S. Under laboratory conditions, the overall biodesulfurization efficiency of counter-current BTF on treating low H2S concentration was 92.27 ± 10.30% [10]. Furthermore, Huan et al. experimented with the removal of H2S and NH3 using BTFs. Plastic polyhedral spheres inoculated with activated sludge were used as fillers, reaching purification efficiencies of 98.3% and 88.6% and removal loads of 84.6 g/m3·h and 38.8 g/m3·h for H2S and NH3, respectively [7].
As the core component of the biological deodorization system, biofillers have a crucial role in the stability and deodorization efficiency of the entire system. Natural filler materials such as compost [11], coconut fiber [12], peat [13], and wood chips [14] are commonly used as filler materials as they have large surface areas, good moisture retention, high void fraction, and low bulk density. However, natural filler materials have been used less frequently in recent years due to their low durability and low long-term stability. The ideal filler should have a large specific surface area, suitable porosity, good mechanical strength, and good corrosion resistance. In addition, the filler should also have excellent moisture retention and biocompatibility, which promotes bacteria growth and, in turn, degradation of waste [15].
Modified activated carbon is often used as a biofiller carrier due to its excellent adsorption capacity and surface structure. Common modification methods include acid-base, high temperature, and metal oxide modification methods. Metal modification usually uses an equal volume impregnation method to attach metal ions and atoms to the surface of activated carbon, and replace the metal element or metal oxide through reduction. Daneshyar et al. synthesized activated carbon loaded with Cu-Zn-Ni nanoparticles by impregnation method [16]. The effects of variables such as amount of adsorbent, flow rate, temperature, pressure, and volume of gas on H2S removal were examined and the maximum removal of H2S was 94%. However, too much metal loading will block the activated carbon micropores [17].
A composite filler is prepared by mixing raw materials with different properties through mechanical mixing, artificial granulation, or substrate attachment. Such filler is widely applied because it can effectively compensate for the defects of a single filler (such as high mechanical strength, lightweight, pH buffering, nutrient sustained-release, etc.). Hassani et al. used carbon fibers to prepare activated carbon fiber filler, which has high porosity, large adsorption capacity, and easy desorption and regeneration. The adsorption capacities of the activated carbon fiber filler for benzene and toluene were 4 mmol/g and 6 mmol/g, respectively [18]. In addition, Cheng et al. prepared a composite filler with a large specific surface area and nutrient sustained-release and a pH regulation function through the emulsification-crosslinking process and microbial immobilization technology. A nutritional slow-release packing material with functional microorganisms which has a high cumulative release rate of total phosphorus and total nitrogen has an over 95% removal efficiency of gaseous n-butyl acetate [19].
At present, most research on composite fillers focuses on improving their surface properties and removing mainly a single pollutant, while there are only a few studies on composite fillers that have better microbial activity and have both nutrient sustained-release and pH regulation capabilities based on improved surface properties. In this study, a microbes-loaded modified composite filler was prepared through entrapment immobilization technology. Using polypropylene fiber, modified activated carbon, CaCO3, and inorganic nutrients as raw materials, high-efficient degrading bacteria were loaded onto the filler, obtaining a new type of microbes-loaded modified composite filler. The aim of this work was to evaluate the purification performance of the BTF filled with the composite filler using a mixed gas containing H2S and NH3 as the simulated waste gas source and compare it with the traditional filler (pine bark). In addition, simulations of the impact of a variety of working conditions (including changes in EBRT and the impact load, etc.) on the treatment effect of the device were conducted, and an analysis of the microbes in the two BTFs was carried out to provide technical support for the development and the application of the new composite filler.

2. Materials and Methods

2.1. Preparation of Modified Activated Carbon

Nutshell activated carbon of 0.250–0.425 mm (CAS: 7440-44-0) was purchased from Shanghai Macklin Biochemical Co., Ltd. (Shanghai, China). The activated carbon was soaked in deionized water for 30 min; an ultrasound of 30 min was used to remove impurities, and the material was dried at 60 °C for 24 h. Modification by acid or alkali was performed as follows: the pretreated activated carbon was put into a conical flask, into which HNO3 or NaOH-modified solutions of different concentrations were added, soaked in a water bath (70 °C) for 4 h, filtered, and then dried. Modification by high temperature was performed as follows: the pretreated activated carbon was placed in a tubular furnace, with the temperature rising to the modification temperature under the protection of nitrogen flow; activated carbon was then calcined for 8 h and then taken out for storage. Modification by metal oxide was performed as follows: the pretreated activated carbon was soaked in a metal salt solution for modification using the incipient-wetness impregnation method and oscillated for 24 h, dried, placed in a tubular furnace, and burned at 300 °C for 1 h [20].
The modification conditions, including acid concentration and alkali concentration, calcination temperature, and impregnation concentrations (mass fractions of metals) of different metal oxides, are shown in Table 1.

2.2. Gas Static Adsorption Experiment

A certain amount of the modified activated carbon was accurately weighed in a weighing dish and put it in a glass bottle. Then, the glass bottle was injected with NH3 or H2S gas and sealed. The static adsorption of the activated carbon under 25 °C constant temperature took 12 h. After completion, the sample in the weighing dish was taken out and weighed. The static adsorption saturation capacity q of the activated carbon was:
q = m 3 m 2 m 2 m 1
where q is the static adsorption saturation capacity (mg/g), m1, m2, and m3 are the mass of the weighing dish, the total mass of the weighing dish and the activated carbon before adsorption, and the total mass of the weighing dish and the activated carbon after adsorption, respectively (g).

2.3. Experimental Set up

The composite filler included 1% functional microbes, 8% inorganic salt culture solution, 32% CaCO3, 17% modified activated carbon (7% copper nitrate), 12% sodium alginate, 24% polyvinyl alcohol, and 6% polypropylene fibers using entrapment immobilization technology. The preparation steps were as follows: (1) According to the ratio, polyvinyl alcohol and sodium alginate were heated to 300 °C and dissolved. The solution was stirred evenly and then cooled to 40 °C. (2) The modified activated carbon and EM microbial agent were entrapped, the EM microbial agent was purchased from Shandong Nuojie Biotechnology Co., Ltd. (Weifang, China); (3) after extruding granulation, the granules were stored in 2% boric acid-calcium chloride saturated solution and crosslinked at 4 °C for 24 h, obtaining composite fillers; (4) taking mechanical strength as a single factor variable, the optimal proportion was achieved by adjusting the proportions of polyvinyl alcohol, sodium alginate, and polypropylene fibers. The nutrient solution consisted of 0.9 g/L K2HPO4·3H2O, 0.2 g/L KH2PO4, 1.7 g/L NaNO3, 0.9 g/L NH4Cl, 0.1 g/L MgCl2·6H2O, 0.01 g/L CaCl2·2H2O, 0.01 g/L FeCl3.
The experimental apparatus is shown in Figure 1. Two identical BTFs with an inner diameter of 131.3 mm and a height of 1200 mm were established. In each BTF, there were three layers of fillers, each layer 200 mm high and with a 50 mm distance to the next layer. The working volume of the reactor was 8.12 L. Three sampling ports were provided. The system adopts the countercurrent mode, in which the mixed gas is obtained from the gas mixing cylinder through the H2S or NH3 gas cylinder and the air pump, entering the reactor from the bottom and discharged from the top after passing through three layers of fillers. The nutrient solution was sprayed intermittently with a peristaltic pump at the top of the reactor, at the interval of every 12 h (each time lasting for 1 h) at a spray intensity of 18 L/h. Except for the startup stage, the nutrient solution (pH: 6.9–7.7) was replaced every 3 days.
Composite filler BTF 1 (BTF1) and bark filler BTF 2 (BTF 2) were set up. BTF 1 was filled with nutrient-sustained-release composite fillers loaded with EM bacterial agent, and BTF 2 was filled with pine bark fillers. The biofilm formation was initiated by applying an intermittent spray of circulating nutrient solution. The circulating bacterial solution was prepared by adding microbes to the circulating nutrient solution of the control group. The microbial biomass added to the circulating solution was the same as that used in the preparation of the fillers in the experimental group.
Three stages were set up in this experiment. Stage I mainly studied the startup of the BTFs; in stage II, the empty bed residence time (EBRT) was changed, and the maximum allowable inlet flow of the composite filler BTF was explored when the removal efficiency of H2S and NH3 were higher than 80%. In stage III, the removal capacity of BTF was verified by increasing inlet concentrations of H2S and NH3. The operating parameters of different stages are shown in Table 2.

2.4. Analytical Methods

The mechanical strength of the particle was measured using the YHKC-2A particle strength tester. The pH was measured using a pH meter. The moisture content was measured using the loss-on drying method. Dissolved sustained-release nutrients were measured by the extraction method. The measurement of total nitrogen and total phosphorus was mentioned in previous studies [21,22]. The conductivity was measured using a portable conductivity meter (Seven2Go). The conductivity change reflected the nutrient’s overall release pattern in the fillers, and the values of total nitrogen and total phosphorus were used to analyze the single-day release amount of the filler nutrients 0 g of the prepared filler was soaked in a conical flask filled with 150 mL of distilled water and mixed at 30 °C, 120 r in the shaker. The experiment was divided into two groups. A group of composite fillers was washed with distilled water every 24 h. In addition, then the distilled water was replaced. The pH, and conductivity in the distilled water after leaching was measured. The other group was washed in the same way, but the distilled water was not replaced, and its conductivity, total nitrogen, total phosphorus, and pH were measured every 24 h.
The gas detector MOT5-M-YX was used to measure the concentrations of H2S and NH3, with a range of 0–1500 mg·m−3. The measurement accuracy at a pollutant concentration of 0–1500 mg/m−3 was ±1 mg/m−3. For bacterial analysis, the filler material samples were collected on day 10, 13, 16, 19, 22, 25, 28, 31, 34, 37, 40, 43, and 46 of biofiltration. Samples were taken from each filler material layer. In addition, DNA was extracted using CTAB/SDS method. The V3–V4 region of the microbial 16S rRNA was amplified by PCR using the primers 341F: CCTAYGGGRBGCASCAG and 806R: GGAC-TACNNGGGTATCTAAT. The PCR program included an initial denaturation at 95 °C for 2 min, followed by 25 cycles at 95 °C for 30 s, 55 °C for 30 s, and 72 °C for 30 s, and a final extension at 72 °C for 5 min. PCR reactions were carried out with Phusion® High-Fidelity PCR Maser Mix (New England Biolabs, Ipswich, MA, USA) in duplicate. The amplified products were detected in 2% agarose gels and purified using GeneJET™ Gel Extraction Kit (Thermo Scientific, Waltham, MA, USA). The sequencing library was generated using Ion Plus Library Kit 48 rxns (Thermo Scientific) and sequenced on Ion S5™ XL platform and then 400 bp/600 bp single-end reads were generated. High-throughput sequencing was performed by Kaitai Mingjing Gene Technology (Beijing, China) Co., Ltd.
Removal efficiency (%) of H2S and NH3 were calculated as follows:
RE = C i n C 0 C i n × 100 %
where Cin is the inlet H2S or NH3 concentration (mg/m3) and C0 is H2S or NH3 concentration measured at a certain height of the filler material (mg/m3).
Elimination capacity (g/(m3·h)) was calculated as follows:
EC = C i n C 0 1000 V b × Q g
where Vb is the filter filler material volume (m3), and Qg is the air-flow rate (m3/h).
Empty bed retention time (s) was calculated as follows:
EBRT = V b Q g × 3600

2.5. Statistical Analysis

Statistical analysis was performed using the Microsoft Excel program. H2S and NH3 concentration measurements were repeated 3 times. A p value < 0.05 indicated statistical significance.

3. Results

3.1. Performance of Static Adsorption in the Removal of H2S and NH3

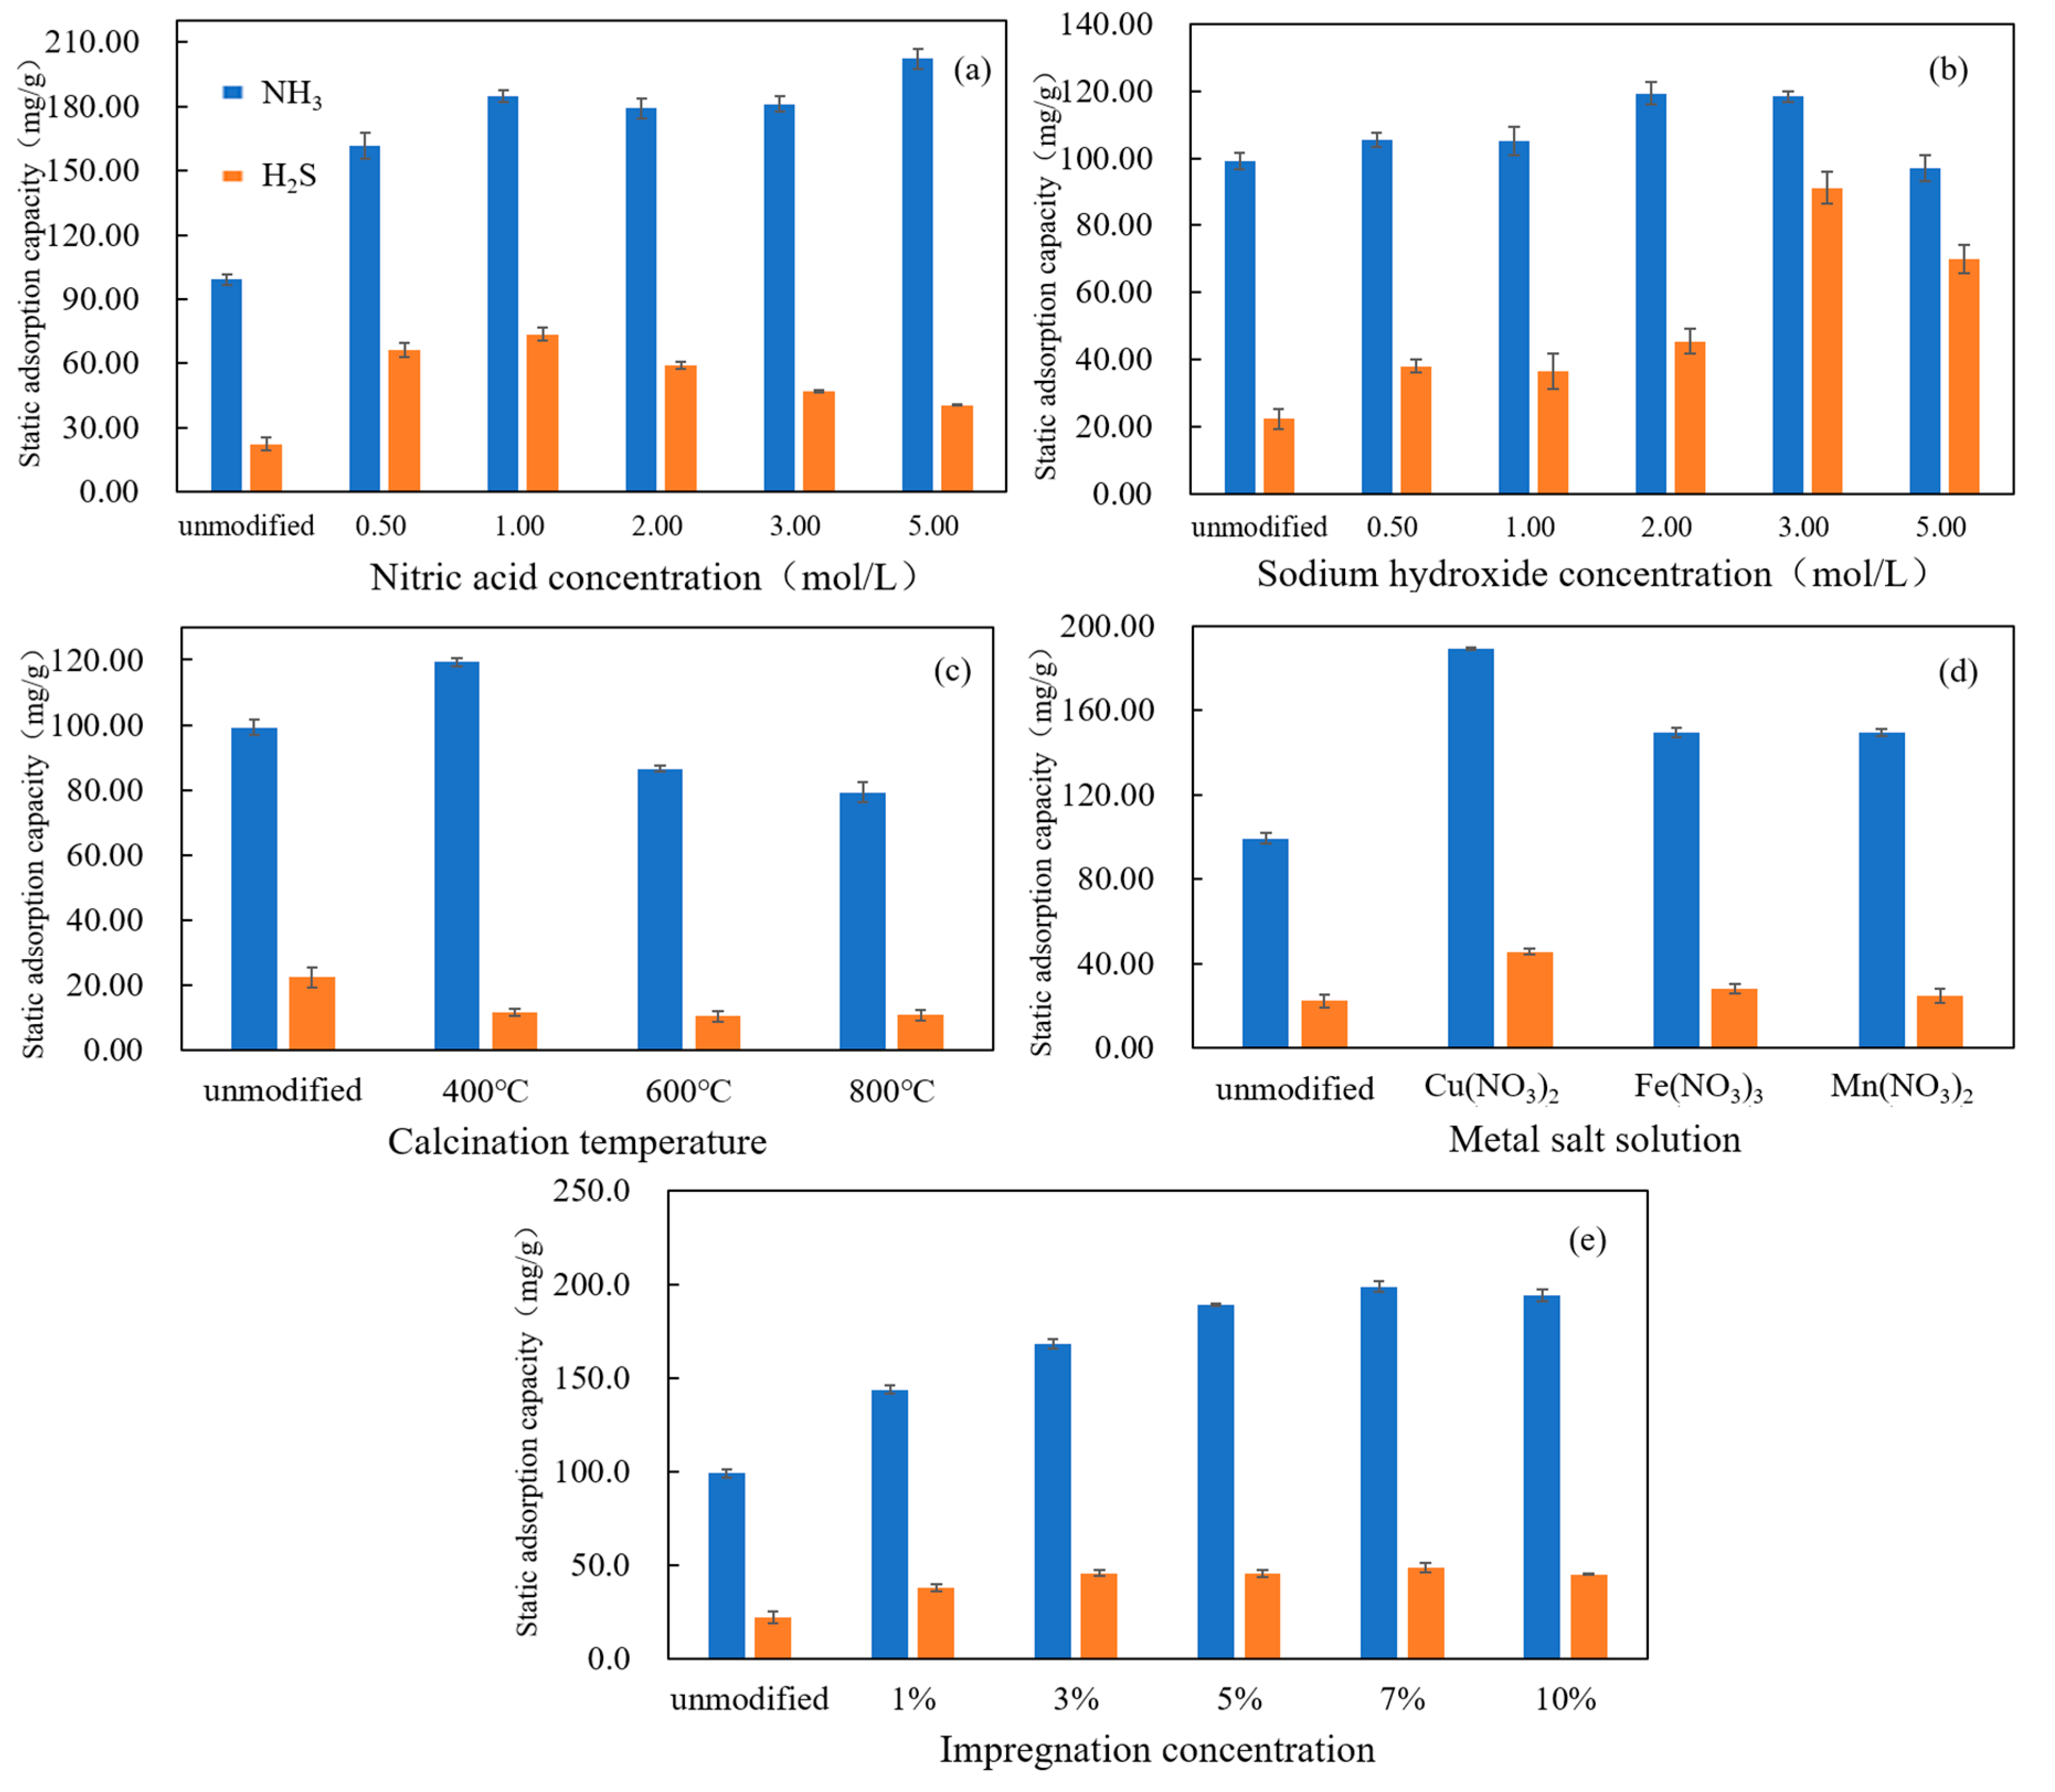
The static adsorption saturation capacity of the modified activated carbon for H2S and NH3 is shown in Figure 2. The adsorption capacities of acid-modified activated carbon for NH3 and H2S reached 202.2 mg/g and 73.5 mg/g, while the adsorption capacities of alkali-modified activated carbon for NH3 and H2S reached 119.4 mg/g and 91.2 mg/g, respectively, neither of which exceeded twice the adsorption capacity of unmodified activated carbon. The acid-modified activated carbon showed the best adsorption capacity for NH3, and the alkali-modified activated carbon the best adsorption performance for H2S, indicating that the acid-alkali modifications may have cleaned or corroded the activated carbon and changed the pore structure of the activated carbon. Previous studies showed that acid-alkali modifications could increase the specific surface area, total pore volume, and micropore volume of the activated carbon and improve the physical adsorption of the activated carbon [23]. In addition to the physical adsorption of the activated carbon itself, the activated carbon can better capture the acid-alkali groups that can neutralize each other, which may be because the acid-alkali modifications brought more acid-alkali functional groups to the surface of the activated carbon [24]. According to Figure 2c, the activated carbon calcined under high temperature did not show obvious improvement in its adsorption of NH3, and its adsorption capacity of H2S even indicated a downward tendency compared with the control group, which may be due to the changes in pore size and pore volume resulting from the high-temperature calcination. Studies indicated that as the calcination temperature increases, the pore size, specific surface area, and the pore volume of the adsorbent decrease, which is proportional to the physical adsorption of the activated carbon [25]. As shown in Figure 2d,e, modification of the activated carbon by 7% copper nitrate showed the most obvious improvement in the adsorption performance. According to previous studies, the metal element nitrate impregnated into the pores of the activated carbon decomposes into corresponding metal oxides under high temperatures. The adsorbate can chemically react with the metal oxides loaded on the activated carbon to improve the chemical adsorption performance of the activated carbon [26]. However, excess metal oxides can also block the activated carbon’s micropores and reduce the activated carbon’s physical adsorption performance [27].

3.2. Performance of Composite Fillers

The fundamental characteristics of the spherical composite fillers are shown in Table 3. The bulk density of the composite filler is 164.8 kg/m³, which is similar to that of the pine bark filler. Its mechanical strength is greater than that of pine bark filler. The pH of the filler is 6.9–7.4. The saturated moisture content and porosity are high, which benefit the adsorption of malodorous gases and the growth and biofilm formation of microbes. The composite filler has good physical and chemical properties, providing a good external environment for the growth of microbes. The filler has moderate mechanical strength, and microbes can use its nutrients during operation. The activated carbon in the filler can adsorb NH3 and H2S, which makes it easy for gases to enter the filler.
After being soaked, the filler absorbed water. Then the nutrients inside the filler gradually dissolved into the water and were lost through the micropores on the surface of the filler. As the nutrients entered the water solution, the ion concentration increased, leading to higher electrical conductivity. Therefore, the conductivity mainly reflected the overall release of nutrients in the filler. The release of nutrients such as total phosphorus and total nitrogen was completed by the slow dissolution and diffusion of nutrients in the filler and the microbial degradation. As shown in Figure 3a,b, the initial conductivity of the filler and the release rates of total phosphorus and total nitrogen were relatively high, and the conductivity gradually decreased and became stable. The release rates of total phosphorus and total nitrogen also gradually decreased with time, which may be because the nutrient source adhered to the surface of the composite filler was easily washed off by leaching water, while the nutrients inside the filler were mixed with the polypropylene fibers, modified activated carbon, and other materials, thus making it harder for the nutrients to be washed off by water [28]. The total phosphorus and nitrogen release rates reached 70% and 60%, respectively. Therefore, the composite filler in this study can maintain a high level release of nutrients for a long time to meet the basic needs of the microbes.
The pH value of the filler impacts the negative charge and the activities of various enzymes on the surface of the microbes and is one of the main factors affecting the growth and metabolism of microbes [29]. Figure 3c showed the single-day and cumulative pH of the fillers immersed in distilled water. There was no manual pH regulation except for daily regular and quantitative spraying of nutrient solution. During the 20 days of immersion, the cumulative pH changes of the fillers remained between 6.9 and 7.4; the single-day pH changes remained between 7.4 and 8.3. The pH became stable after the ninth day, which was suitable for the growth of most microbes. In contrast, fillers such as corncob [30] and polypropylene rings [31] had poor pH buffering performance, and the pH of the filler dropped from 7 to about 4.5 in a short period. If the pH were not properly regulated, the reaction system was easily acidized, causing the biological system of the BTF to collapse.

3.3. H2S and NH3 Removal Performance of the Two BTFs

The H2S and NH3 removal performance of the BTFs is shown in Figure 4. The elimination capacity (EC) and removal efficiency (RE) indicated the BTFs’ potential to eliminate pollutants under different inlet loads. In the startup stage, the inlet concentrations of H2S and NH3 were 83.6 mg/m3 and 83.6 mg/m3, respectively. Ten days after startup, the removal efficiencies of H2S and NH3 of the two BTFs exceeded 90%, meaning the startup stage was completed. When the BTFs operated stably, stage II began. With the decrease of EBRT, the H2S removal efficiency of the composite filler BTF was maintained at 100%, but when EBRT was 34 s (26–28 d), the H2S removal efficiency of the control group BTF dropped below 80%. With low EBRT conditions, the removal of H2S was better than the study by Ying et al. The removal efficiency of H2S with short EBRT was comparably lower under the same loading rate, which was also verified in BTF2 [8]. This result indicated that BTF1 has better adaptation to low EBRT in removing H2S. After entering stage II, the NH3 removal efficiency of the composite filler BTF decreased from 100% to 81.7% in a short period of time and then recovered rapidly; when EBRT was 60 s (17–19 d), the NH3 removal efficiency reached 95%, which exceeded that of the bark filler BTF (92%). In later stages, the composite filler BTF had an NH3 removal efficiency higher than the bark filler BTF and maintained stable operation. The NH3 removal efficiency of the bark filler BTF decreased with the reduction of EBRT. When EBRT was 34 s, the NH3 removal efficiency of the composite filler BTF was still >80%, while that of bark filler BTF dropped <60%. The decrease of EBRT reduced the retention time of the mixed gas containing H2S and NH3 in the BTF, causing lower mass transfer efficiency and weakening the interaction between the microbes on the fillers and the substrate [7]. As a result, the H2S and the NH3 were not completely degraded. Studies showed that weakly alkaline BTF is mostly used to remove high-concentration H2S gas, and a favorable EBRT is also the key to achieving optimum removal efficiency [32,33]. The BTF packed with composite filler showed better regulation and stability at this stage. Considering the removal efficiencies of H2S and NH3 mixed gas of the two BTFs, EBRT of 40 s was selected as the shortest allowable gas retention time; when the inlet flow was 12 L/min and the gas load was 8.2 g/m3·h, the NH3 removal efficiencies of the composite filler BTF and the bark filler BTF both exceeded 80%, and the H2S removal efficiencies were both 100%.
In stage III, the inlet concentration continuously increased, and the H2S removal efficiencies of the two BTFs were maintained at a high level, while the NH3 removal efficiencies showed a significant downward tendency, especially the bark filler BTF. The NH3 removal efficiency of the bark filler BTF was mostly below 80%, and it reached 80–90% for only 3 days. However, when the inlet concentration of NH3 was 417.94 mg/m3 (38–40 d), the removal efficiency of the composite filler BTF was still higher than 80%, indicating that the BTF packed with composite filler can better adapt to the changes in inlet concentration under low EBRT. Under the same conditions, the removal of H2S and NH3 by BTF1 was better than that of Huan et al., which was 84.65% and 89.60%, respectively [7]. Therefore, when the EBRT was 40 s and the inlet load was 41 g/m3·h, the maximum odorous gas concentrations the composite filler BTF could handle were H2S 418.2 mg/m3 and NH3 418.0 mg/m3, respectively.
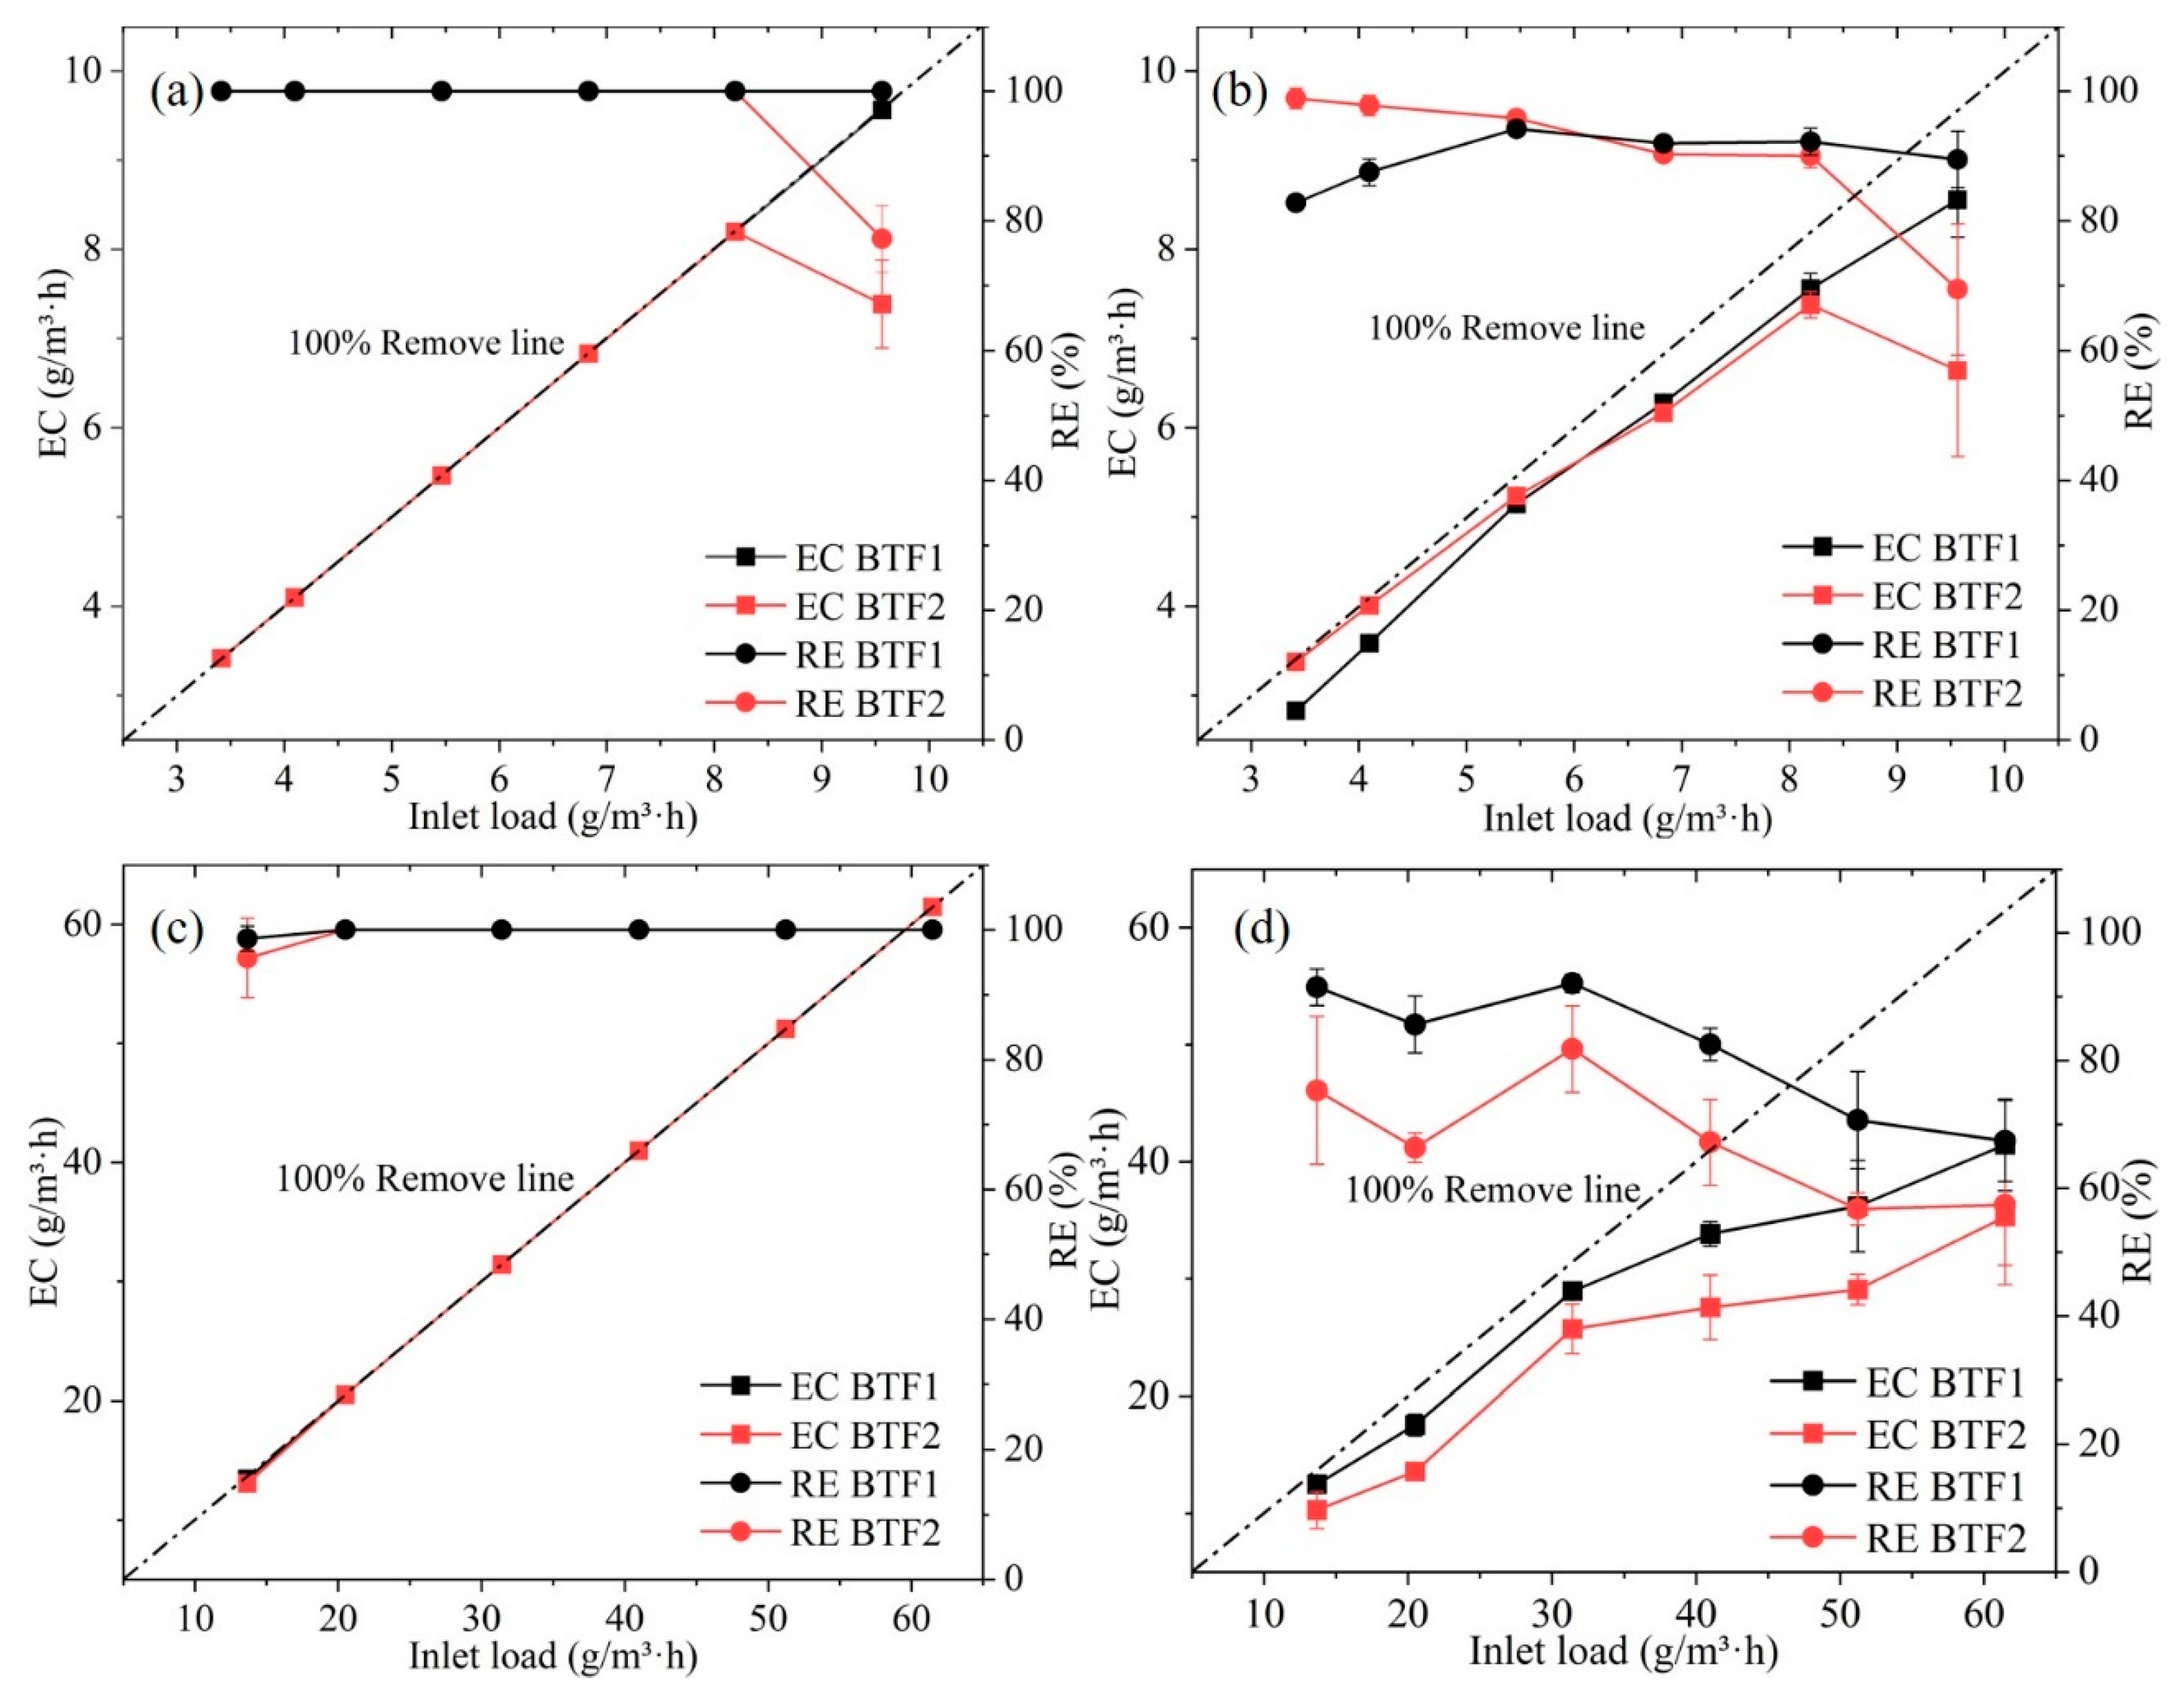
The relationships between EC and RE and the inlet load of the BTF under different EBRT conditions are shown in Figure 5. As the EBRT of the BTF in stage II decreased from 100 s to 34 s, the inlet load increased from 3.4 g/m3 h to 9.6 g/m3 h. With the increase of the inlet load, the REs and ECs of H2S of the two BTFs show a steady trend, which may be due to the slightly alkaline BTF system [34,35]. The RE of H2S of the composite filler BTF remained 100%, and the EC was not affected by the inlet load. When the inlet load increased from 8.2 g/m3·h to 9.6 g/m3·h, the RE of H2S of the bark filler BTF decreased from 100% to 77.2%, and the EC also decreased to 7.4 g/m3·h (Figure 5a). The NH3 purification capacity of the composite filler BTF showed first and increasing trend after which it was stabilized. When the inlet load was 5.5 g/m3·h, the EC was 5.2 g/m3·h, and the RE reached 94.2%. The EC of NH3 of the composite filler BTF at the maximum inlet load was 8.6 g/m3·h, and the RE was 89.4%. The NH3 purification capacity of bark filler BTF gradually decreased as the inlet load increased, and the removal efficiency decreased from 98.9% to 69.4%. At the maximum inlet load, the EC of NH3 of the bark filler BTF was only 6.4 g/m3 h, and the RE was 69.4% (Figure 5b). It was clear that the BTF packed with composite filler made in this study can better adapt to the changes in system condition caused by the shortening of EBRT than the BTF packed with bark filler.
The changes in EC, RE, and the inlet loads of the two BTFs under different inlet concentrations are shown in Figure 5c,d. As the H2S concentration increased from 139.4 mg/g to 557.6 mg/g, the inlet load gradually increased from 13.7 g/m3·h to 61.5 g/m3·h. The H2S elimination capacities of the composite filler BTF and the bark filler BTF increased dramatically. When the H2S inlet load was 20.5 g/m3·h to 61.5 g/m3·h, the removal efficiency was maintained at 100%, and the removal load was equal to the inlet load (61.5 g/m3·h). The maximum EC of H2S of the composite filler BTF was lower than Huan et al., but the RE was maintained at 100% [7]. Therefore, it can be speculated that the composite filler BTF and the bark filler BTF still had more potential to degrade H2S in the mixed gas.
As the NH3 concentration increased from 139.3 mg/g to 626.9 mg/g, the EC and RE of NH3 of the two BTFs significantly dropped with the increase of the inlet load (Figure 5d). The maximum NH3 removal efficiencies of the composite filler BTF and the bark filler BTF were 92.1% and 81.8%, and the minimum NH3 removal efficiencies were 67.4% and 56.8%, respectively. The amplitude reductions of the removal efficiency were 24.7% and 25.1%. It was discernible that the NH3 removal efficiency of the composite filler BTF was always higher than that of the bark filler BTF. When the inlet load was 31.4 g/m3·h, the RE in two BTFs was the highest relatively, and the EC of the two BTFs was at a high level at the same time, which were 28.9 g/m3·h and 25.7 g/m3·h. At the maximum inlet load (61.5 g/m3·h), the EC of NH3 of the two BTFs was 41.4 g/m3·h and 35.3 g/m3·h. The maximum EC of NH3 of the composite filler BTF was higher than Huan et al., but the RE was lower than it (88.6%) [7]. As pollutant concentration accumulated, the toxic side effects worsened, microbial activity decreased, and the RE of BTF became stable or even decreased, resulting in the decrease of removal effect, which was consistent with the results of previous studies [36]. Most of the time, the RE and EC of the BTF1 superior to those of the BTF2, indicating that the filler prepared in this experiment could better handle the impact of low EBRT and high load. Therefore, the BTF packed with the composite filler prepared had higher performance for ammonia removal, possibly because the filler’s large porosity and high moisture content played a buffering role when the conditions changed [37].

3.4. Analysis of Microbial Community Structure

The Alpha diversity index of the microbial community of the two BTFs is shown in Table 4. Each index consists of composite filler BTF/bark filler BTF, and the coverage index reflecting the sequencing depth is above 99%, indicating that the sequencing results are reliable and can authentically and accurately describe the microbial community of the sample. As shown in Table 4, after the successful startup of the BTFs, the Chao indexes continued to build up, and the overall trend went upward. The Chao index of the bark filler BTF was consistently higher than that of the composite filler BTF, which means that the overall population of species in the bark filler BTF was always larger than that of the composite filler BTF after startup. The Chao index of the bark filler BTF decreased rapidly when the inlet load was 41 g/m3·h and became lower than that of the composite filler BTF when the inlet load was 51.2 g/m3·h or 61.5 g/m3·h. The Chao index of the composite filler BTF was on the rise as the inlet load increased from 41 g/m3·h to 61.5 g/m3·h, indicating that the composite filler BTF could ensure the growth of the population of microbes even under high load.
The ACE indexes of the BTFs were similar to the Chao indexes, indicating that the malodorous gas with a high inlet load reduced the richness of the microbial community in the bark filler BTF but had less influence on the richness of the microbial community of the composite filler BTF. The Shannon index of the bark filler BTF was consistently larger than that of the composite filler BTF, and the Simpson index of the bark filler BTF was consistently smaller than that of the composite filler BTF, indicating that the diversity of the microbial community of the bark filler BTF had been higher than that of the composite filler BTF since startup. It is worth noting that when the inlet load of the BTF was 9.6 g/m3·h (28 d), the microbial community diversities of the composite filler BTF and the bark filler BTF almost reached their respective highest levels, indicating that in stage II of operation of the BTF, as the EBRT (100 s–34 s) declined, the microbial community diversities of both BTFs increased. In stage III, as the inlet concentration accumulated, the inlet load increased rapidly, leading to a significant decrease in the microbial community diversities of both BTFs at the end of the operation. According to the Chao index and the ACE index, the microbial richness, and the microbial community evenness of the bark filler BTF took a sharp fall. However, the Chao index of the composite filler BTF rose slightly, and the ACE index showed no significant downturn. This means that with the increase of the inlet load, the predominant bacteria in the composite filler BTF were still rising, it is speculated that this may be due to less inhibited by high-concentration malodorous gases [38].
Figure 6 shows the genus level relative abundances of the microbial communities of the two BTFs. The diversities of the microbial community in the two BTFs continued to increase as the operation of BTF continued. Throughout the operating phase, 31 genera of microbes were detected in the composite filler BTF, which was significantly lower than that of the bark filler BTF (64 genera). The two BTFs share 23 microbes of the same genus. The number of microbial species with relative abundance >1% in the two BTFs was 21 and 31, respectively (28 d). It is evident that the microbes continuously grew and reproduced under low inlet concentration (11–28 d), and the decrease of EBRT had little impact on the predominant microbes. Afterward, with the increase of the inlet concentration (29–46 d), the diversity of the microbial community decreased, indicating that the high-concentration pollution gases had inhibited the growth of some microbes [39].
The major predominant bacteria in the composite filler BTF included Pseudomonas, Stenotrophomonas, Comamonas, Trichococcus, Acinetobacter, and Hydrogenophaga (Figure 6a), with the average relative abundances of 25.1%, 12.4%, 4.6%, 4.5%, 4.0%, and 3.7%, respectively. The relative abundance of Pseudomonas gradually decreased with the operation of the BTF (93.7% at the end of the startup phase vs. 1.9% at the end of the operation). Stenotrophomonas mainly existed in stage II, with the highest abundance being 38.2% (22 d). Comamonas, Trichococcus, and Hydrogenophaga mainly existed in stage III, with the highest abundances being 16.0% (37 d), 16.63% (31 d), and 18.1% (34 d), respectively.
The predominant bacterial genera in the bark filler BTF were scattered. The major predominant bacterial genera included Brevundimonas, Comamonas, Enterobacteriaceae_unclassified, Comamonadaceae_unclassified, Pseudomonas, and Stenotrophomonas (Figure 6b), with relative abundances of 12.8%, 11.1%, 4.8%, 4.4%, 4.0%, and 3.99%, respectively. Among them, Brevundimonas was the first predominant bacterium, and its maximum abundance was 29.37%, which was lower than the maximum abundance of Pseudomonas (the first predominant bacterium in the composite filler BTF) of 93.7%. Comamonas, Pseudomonas, and Stenotrophomonas were also the predominant bacterial genera in the composite filler BTF, and their corresponding relative abundances in the bark filler BTF ranged from 2.7% to 32.0%, 1.0% to 15.3%, and 1.1% to 17.7%, respectively, which were all lower than the abundance values in the composite filler BTF except for Comamona. The proportion of the major predominant bacterial genera in the bark filler BTF was lower than that in the composite filler BTF, which may be caused by the higher diversity of the microbial community in the bark filler BTF [40].
Among the predominant genera, Pseudomonas might be the main participant in the de-nitrification process, and Comamonas might be a heterotrophic nitrifying bacterium. The two might have been involved in the nitrification and denitrification process of nitrogen in the BTFs together [41,42]. The highest abundances of Pseudomonas and Comamonas in the composite filler BTF were 93.7% and 16.0%, respectively, and the average abundances were 25.1% and 4.6%, respectively. The highest abundances of Pseudomonas and Comamonas in the bark filler BTF were 15.3% and 32.0%, respectively, and the average abundances were 4.0% and 11.1%, respectively. The proportion of nitrifying and denitrifying bacteria in the composite filler BTF was significantly higher than that in the bark filler BTF. Even though the composite filler BTF had lower microbial diversity and abundance, its NH3 elimination performance was better than that of the bark filler BTF. In addition, the aerobic denitrifying bacteria Trichococcus were also a predominant bacterial genus in the BTFs [43]. Their abundance in the composite filler BTF was 2.1–16.6%, but only 1.2–1.7% in the bark filler BTF. Thiobacillus existed in both BTFs but was not a predominant bacterial genus. In addition, the H2S removal efficiencies of the two BTFs were maintained at 100% in the long-term. Therefore, this study mainly explored the adsorption of the filler in H2S removal.

4. Conclusions

This study showed that the adsorption capacities of the activated carbon modified by acid or alkali for NH3 and H2S were up to 202.2 mg/g and 91.2 mg/g, both of which were at no more than twice the adsorption capacity of unmodified activated carbon. The adsorption efficiency of activated carbon calcined under high temperature for NH3 was not significantly improved, and that for H2S tended to decrease. The adsorption efficiencies of activated carbon modified by 7% copper nitrate for NH3 and H2S showed the most obvious improvements (199.1 mg/g and 49.0 mg/g, respectively, with respective increase amplitudes of 100.1% and 120%). The nutrient sustained-release composite filler loaded with microbes was prepared by microbial immobilization technology combined with modified activated carbon. The average diameter of the composite filler was Φ 10 mm; the bulk density was 164.8 kg·m−3, the porosity was 60.2%, and the pH value was 6.9–7.4. The release rate of total phosphorus and total nitrogen could reach 70%, which was favorable for the attachment and growth of microbes and the nutrient release performance.
The biofilm formation of the BTF packed with the composite filler was completed after 10 days. As the EBRT dropped from 100 s to 34 s, the composite filler BTF still maintained high removal efficiencies for NH3 and H2S under stable operation, while the removal efficiencies of BTF packed with pine bark filler decreased to 60–80%. With the increase of the inlet load, the elimination capacities of NH3 and H2S of both BTFs decreased, but the decline in the composite filler BTF was significantly lower than that in the bark filler BTF. The predominant bacterial genera in the composite filler BTF were Pseudomonas, Stenotrophomonas, and Comamonas, accounting for 25.1%, 12.4%, and 4.6%, respectively. The predominant bacterial genera in the bark filler BTF are Brevundimonas and Comamonas, accounting for 12.8% and 11.1%, respectively. As inlet load increased, the predominant bacteria in the composite filler BTF were less inhibited by the high-concentration malodorous gases than the bark filler BTF.

Author Contributions

Conceptualization, Y.W. and K.L.; methodology, Y.W. and R.C.; software, Y.W. and H.J.; validation, Y.W. and M.B.; formal analysis, Y.W. and K.L.; investigation, Y.W. and R.C.; resources, M.Z. and L.R.; data curation, M.Z. and L.R.; writing—original draft preparation, Y.W. and K.L.; writing—review and editing, Y.W., K.L. and M.Z.; visualization, Y.W. and R.C.; supervision, Y.W. and M.Z.; project administration, M.Z. and L.R.; funding acquisition, M.Z. and L.R. All authors have read and agreed to the published version of the manuscript.

Funding

This research was funded by National Key R&D Program of China [No.2019YFC1906004].

Conflicts of Interest

The authors declare no conflict of interest.

References

  1. Chai, F.; Li, P.; Li, L.; Qiu, Z.; Han, Y.; Yang, K. Dispersion, olfactory effect, and health risks of VOCs and odors in a rural domestic waste transfer station. Environ. Res. 2022, 209, 112879. [Google Scholar] [CrossRef]
  2. Yuan, J.; Li, Y.; Zhang, H.; Zhang, D.; Chadwick, D.; Li, G.; Wang, G.; Chi, M.; Yang, F. Effects of adding bulking agents on the biodrying of kitchen waste and the odor emissions produced. J. Environ. Sci. 2018, 67, 344–355. [Google Scholar] [CrossRef]
  3. Zhang, Y.; Liang, Z.; Tang, C.; Liao, W.; Yu, Y.; Li, G.; Yang, Y.; An, T. Malodorous gases production from food wastes decomposition by indigenous microorganisms. Sci. Total Environ. 2020, 717, 137175. [Google Scholar] [CrossRef]
  4. Rybarczyk, P.; Szulczyński, B.; Gębicki, J.; Hupka, J. Treatment of malodorous air in biotrickling filters: A review. Biochem. Eng. J. 2019, 141, 146–162. [Google Scholar] [CrossRef]
  5. Gao, X.; Yang, F.; Cheng, J.; Xu, Z.; Zang, B.; Li, G.; Xie, X.; Luo, W. Emission of volatile sulphur compounds during swine manure composting: Source identification, odour mitigation and assessment. Waste Manag. 2022, 153, 129–137. [Google Scholar] [CrossRef]
  6. Zheng, T.; Li, L.; Chai, F.; Wang, Y. Factors impacting the performance and microbial populations of three biofilters for co-treatment of H2S and NH3 in a domestic waste landfill site. Process Saf. Environ. Prot. 2021, 149, 410–421. [Google Scholar] [CrossRef]
  7. Huan, C.; Fang, J.; Tong, X.; Zeng, Y.; Liu, Y.; Jiang, X.; Ji, G.; Xu, L.; Lyu, Q.; Yan, Z. Simultaneous elimination of H2S and NH3 in a biotrickling filter packed with polyhedral spheres and best efficiency in compost deodorization. J. Clean. Prod. 2021, 284, 124708. [Google Scholar] [CrossRef]
  8. Ying, S.; Kong, X.; Cai, Z.; Man, Z.; Xin, Y.; Liu, D. Interactions and microbial variations in a biotrickling filter treating low concentrations of hydrogen sulfide and ammonia. Chemosphere 2020, 255, 126931. [Google Scholar] [CrossRef]
  9. Huan, C.; Lyu, Q.; Tong, X.; Li, H.; Zeng, Y.; Liu, Y.; Jiang, X.; Ji, G.; Xu, L.; Yan, Z. Analyses of deodorization performance of mixotrophic biotrickling filter reactor using different industrial and agricultural wastes as packing material. J. Hazard. Mater. 2021, 420, 126608. [Google Scholar] [CrossRef] [PubMed]
  10. Zhuo, Y.; Han, Y.; Qu, Q.; Li, J.; Zhong, C.; Peng, D. Characteristics of low H2S concentration biogas desulfurization using a biotrickling filter: Performance and modeling analysis. Bioresour. Technol. 2019, 280, 143–150. [Google Scholar] [CrossRef]
  11. Lebrero, R.; Gondim, A.; Pérez, R.; García-Encina, P.; Muñoz, R. Comparative assessment of a biofilter, a biotrickling filter and a hollow fiber membrane bioreactor for odor treatment in wastewater treatment plants. Water Res. 2014, 49, 339–350. [Google Scholar] [CrossRef]
  12. Dorado, A.; Lafuente, J.; Gabriel, D.; Gamisans, X. The role of water in the performance of biofilters: Parameterization of pressure drop and sorption capacities for common packing materials. J. Hazard. Mater. 2010, 180, 693–702. [Google Scholar] [CrossRef]
  13. Pérez, M.; Álvarez-hornos, F.; Portune, K.; Gabaldn, C. Abatement of styrene waste gas emission by biofilter and biotrickling filter: Comparison of packing materials and inoculation procedures. Appl. Microbiol. Biotechnol. 2015, 99, 19–32. [Google Scholar] [CrossRef] [Green Version]
  14. Parseh, I.; Hajizadeh, Y.; Jaafarzadeh, N.; Goudarzi, Z.; Shakerinejad, G.; Badeenezhad, A.; Mengelizadeh, N.; Fallahizadeh, S. Removal behavior of gaseous furfural using a biofilter packed with perlite, ripe compost, and oak woodchips. Process Saf. Environ. Prot. 2021, 149, 135–143. [Google Scholar] [CrossRef]
  15. Zhang, Y.; Liu, J.; Qin, Y.; Yang, Z.; Cao, J.; Xing, Y.; Li, J. Performance and microbial community evolution of toluene degradation using a fungi-based bio-trickling filter. J. Hazard. Mater. 2019, 365, 642–649. [Google Scholar] [CrossRef]
  16. Daneshyar, A.; Ghaedi, M.; Sabzehmeidani, M.; Daneshyar, A. H2S adsorption onto Cu-Zn-Ni nanoparticles loaded activated carbon and Ni-Co nanoparticles loaded gamma-Al2O3: Optimization and adsorption isotherms. J. Colloid Interface Sci. 2017, 490, 553–561. [Google Scholar] [CrossRef]
  17. Wang, Z.; Shi, M.; Li, J.; Zheng, Z. Influence of moderate pre-oxidation treatment on the physical, chemical and phosphate adsorption properties of iron-containing activated carbon. J. Environ. Sci. 2014, 26, 519–528. [Google Scholar] [CrossRef]
  18. Hassani, A.; Khataee, A. 10-Activated carbon fiber for environmental protection. In Activated Carbon Fiber and Textiles; Woodhead Publishing Series in Textiles; Woodhead Publishing: Sawston, UK, 2017; pp. 245–280. [Google Scholar]
  19. Cheng, Z.; Feng, K.; Xu, D.; Kennes, C.; Chen, J.; Chen, D.; Zhang, S.; Ye, J.; Dionysiou, D. An innovative nutritional slow-release packing material with functional microorganisms for biofiltration: Characterization and performance evaluation. J. Hazard. Mater. 2019, 366, 16–26. [Google Scholar] [CrossRef]
  20. Bakhta, S.; Sadaoui, Z.; Lassi, U.; Romar, H.; Kupila, R.; Vieillard, J. Performances of metals modified activated carbons for fluoride removal from aqueous solutions. Chem. Phys. Lett. 2020, 754, 137705. [Google Scholar] [CrossRef]
  21. Pongkua, W.; Thiravetyan, P.; Dumont, E. New tool for the determination of the nitrogen accumulation rate in the washing liquid of a biotrickling filter treating ammonia emissions. Chem. Eng. J. 2020, 397, 125399. [Google Scholar] [CrossRef]
  22. Hamisi, R.; Renman, A.; Renman, G.; Wörman, A.; Thunvik, R. Long-term phosphorus sorption and leaching in sand filters for onsite treatment systems. Sci. Total Environ. 2022, 833, 155254. [Google Scholar] [CrossRef]
  23. Shin, J.; Lee, Y.; Lee, S.; Kim, S.; Ochir, D.; Park, Y.; Kim, J.; Chon, K. Single and competitive adsorptions of micropollutants using pristine and alkali-modified biochars from spent coffee grounds. J. Hazard. Mater. 2020, 400, 123102. [Google Scholar] [CrossRef]
  24. Qu, Y.; Xu, L.; Chen, Y.; Sun, S.; Wang, Y.; Guo, L. Efficient toluene adsorption/desorption on biochar derived from in situ acid-treated sugarcane bagasse. Environ. Sci. Pollut. Res. 2021, 28, 62616–62627. [Google Scholar] [CrossRef] [PubMed]
  25. Zhan, M.; Liu, Y.; Ye, W.; Chen, T.; Jiao, W. Modification of activated carbon using urea to enhance the adsorption of dioxins. Environ. Res. 2022, 204, 112035. [Google Scholar] [CrossRef] [PubMed]
  26. Xu, J.; Gao, N.; Zhao, D.; An, N.; Li, L.; Xiao, J. Bromate reduction and reaction-enhanced perchlorate adsorption by FeCl3-impregnated granular activated carbon. Water Res. 2019, 149, 149–158. [Google Scholar] [CrossRef]
  27. Zhang, W.; He, Y.; Wang, Y.; Li, G.; Chen, J.; Zhu, Y. Comprehensive investigation on the gasification reactivity of pyrolysis residue derived from Ca-rich petrochemical sludge: Roles of microstructure characteristics and calcium evolution. Energy Convers. Manag. 2022, 253, 115150. [Google Scholar] [CrossRef]
  28. Yu, G.; Wang, G.; Wang, S.; Yang, C.; Chen, H.; Zhu, Y.; Yu, L.; Li, J.; Kazemian, H. Performance promotion and its mechanism for n-hexane removal in a lab-scale biotrickling filter with reticular polyurethane sponge under intermittent spraying mode. Process Saf. Environ. Prot. 2021, 152, 654–662. [Google Scholar] [CrossRef]
  29. Jia, T.; Zhang, L.; Zhao, Q.; Peng, Y. The effect of biofilm growth on the sulfur oxidation pathway and the synergy of microorganisms in desulfurization reactors under different pH conditions. J. Hazard. Mater. 2022, 432, 128638. [Google Scholar] [CrossRef]
  30. Hendrych, J.; Buzková, A.; Špaček, P. Innovative packing material for waste gas biofiltration. Environ. Technol. Innov. 2021, 24, 101837. [Google Scholar] [CrossRef]
  31. Wu, J.; Jiang, X.; Jin, Z.; Yang, S.; Zhang, J. The performance and microbial community in a slightly alkaline biotrickling filter for the removal of high concentration H2S from biogas. Chemosphere 2020, 249, 126127. [Google Scholar] [CrossRef]
  32. Khanongnuch, R.; Di, C.; Lakaniemi, A.; Rene, E.; Lens, P. H2S removal and microbial community composition in an anoxic biotrickling filter under autotrophic and mixotrophic conditions. J. Hazard. Mater. 2019, 367, 397–406. [Google Scholar] [CrossRef]
  33. Ben, J.; Couvert, A.; Amrane, A.; Rouxel, F.; Cloirec, P.; Dumont, E. Biofiltration of H2S in air—Experimental comparisons of original packing materials and modeling. Biochem. Eng. J. 2016, 112, 153–160. [Google Scholar]
  34. Huynh, N.; Le, T.; Tran, L. Removal of H2S in biogas using biotrickling filter: Recent development. Process Saf. Environ. 2020, 144, 297–309. [Google Scholar] [CrossRef]
  35. Xia, G.; Zhou, X.; Hu, J.; Sun, Z.; Yao, J.; Chen, D.; Wang, J. Simultaneous removal of carbon disulfide and hydrogen sulfide from viscose fibre waste gas with a biotrickling filter in pilot scale. J. Clean. Prod. 2019, 230, 21–28. [Google Scholar] [CrossRef]
  36. Yao, X.; Shi, Y.; Wang, K.; Wang, C.; He, L.; Li, C.; Yao, Z. Highly efficient degradation of hydrogen sulfide, styrene, and m-xylene in a bio-trickling filter. Sci. Total Environ. 2022, 808, 152130. [Google Scholar] [CrossRef] [PubMed]
  37. Yan, Y.; Yang, J.; Zhu, R.; Nie, Y.; Jin, B.; Li, S. Performance evaluation and microbial community analysis of the composite filler micro-embedded with Pseudomonas putida for the biodegradation of toluene. Process Biochem. 2020, 92, 10–16. [Google Scholar] [CrossRef]
  38. Bu, H.; Carvalho, G.; Huang, C.; Sharma, K.; Yuan, Z.; Song, Y.; Bond, P.; Keller, J.; Yu, M.; Jiang, G. Evaluation of continuous and intermittent trickling strategies for the removal of hydrogen sulfide in a biotrickling filter. Chemosphere 2022, 291, 132723. [Google Scholar] [CrossRef] [PubMed]
  39. Zhang, R.; Chen, C.; Xu, X.; Lee, D.; Ren, N. The interaction between Pseudomonas C27 and Thiobacillus denitrificans in the integrated autotrophic and heterotrophic denitrification process. Sci. Total Environ. 2022, 811, 152360. [Google Scholar] [CrossRef] [PubMed]
  40. Treinyte, J.; Bridziuviene, D.; Fataraite-urboniene, E.; Rainosalo, E.; Rajan, R.; Cesoniene, L.; Grazuleviciene, V. Forestry wastes filled polymer composites for agricultural use. J. Clean. Prod. 2018, 205, 388–406. [Google Scholar] [CrossRef]
  41. Wu, H.; Yin, Z.; Quan, Y.; Fang, Y.; Yin, C. Removal of methyl acrylate by ceramic-packed biotrickling filter and their response to bacterial community. Bioresour. Technol. 2016, 209, 237–245. [Google Scholar] [CrossRef]
  42. Zagorskis, A.; Januševičius, T.; Danila, V. Removal of acetone vapor from air using a biotrickling filter packed with polymeric bioballs. Processes 2022, 10, 57. [Google Scholar] [CrossRef]
  43. Wen, X.; Xu, H.; Huang, S.; Sun, C.; Tong, N.; Zhang, Y. Simultaneous removal of sulphur dioxide and nitric oxide at different oxygen concentrations in a thermophilic biotrickling filter (BTF): Evaluation of removal efficiency, intermediates interaction and characterisation of microbial communities. Bioresour. Technol. 2019, 294, 122150. [Google Scholar] [CrossRef]
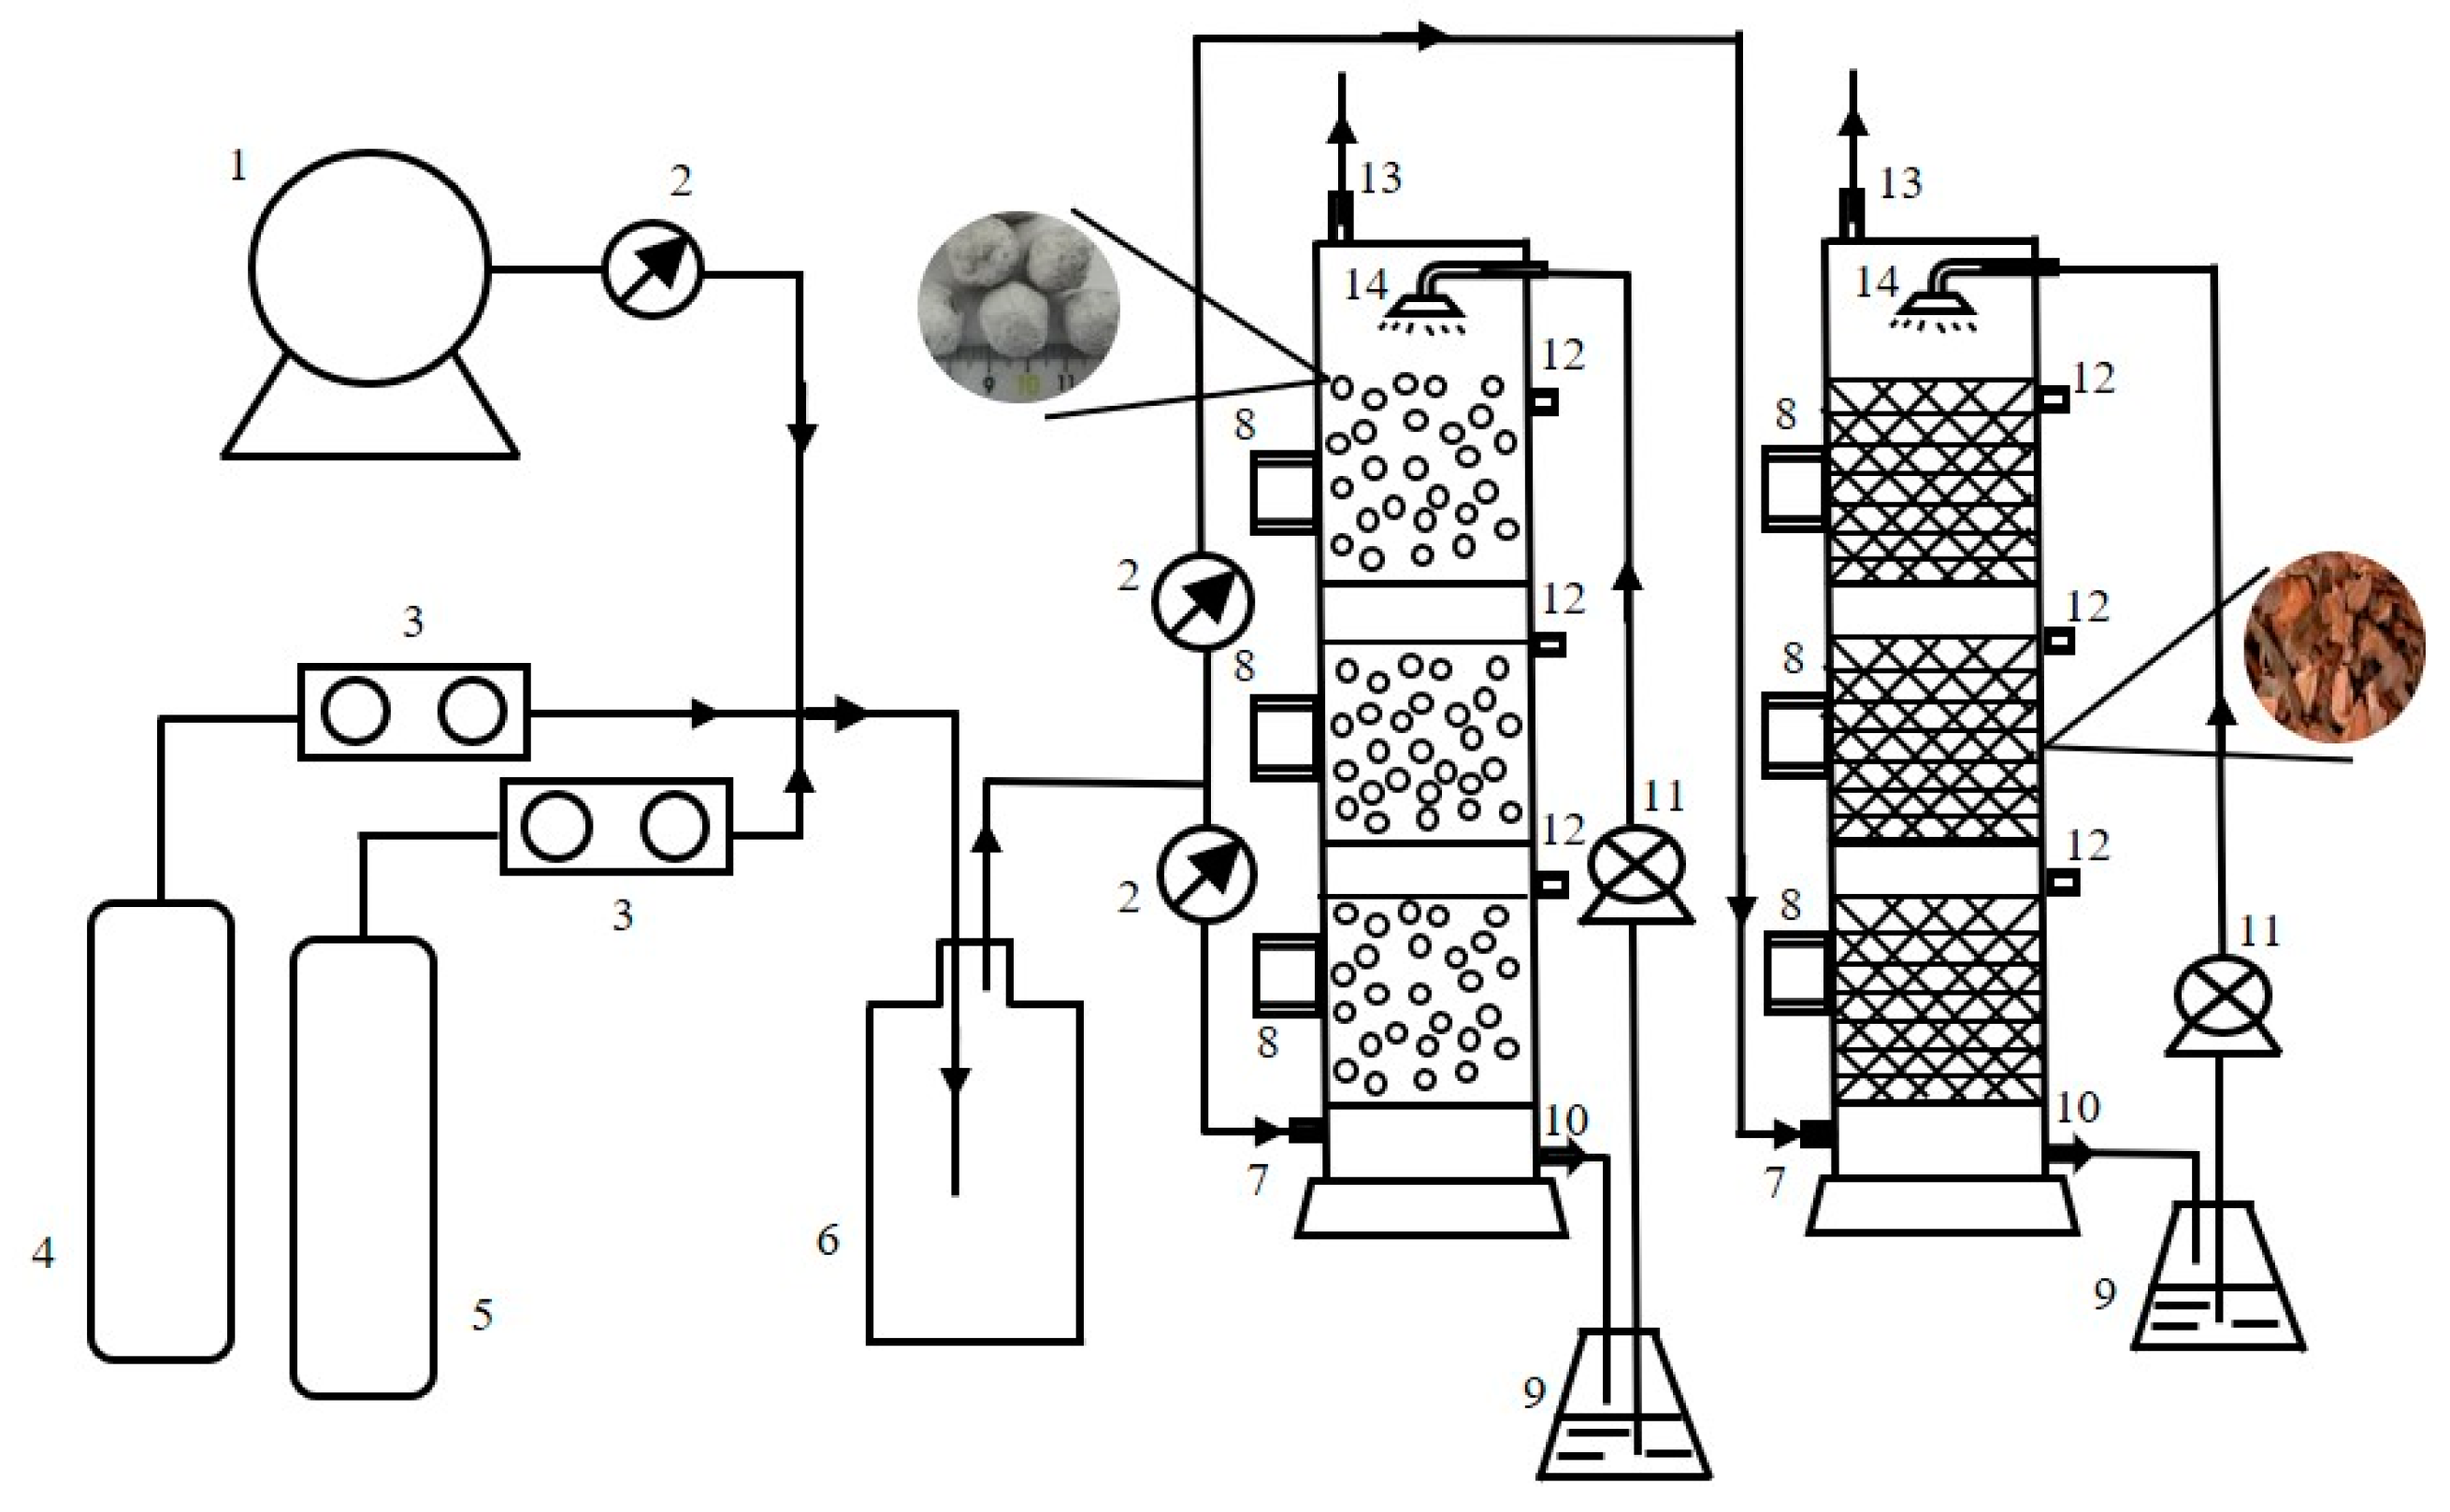
Figure 1. Schematic of biotrickling filter. (1) Air pump, (2) Rotameter, (3) Mass flowmeter, (4) H2S cylinder, (5) NH3 cylinder, (6) Gas mixing cylinder, (7) Air inlet, (8) Filler sampling port, (9) Circulating fluid, (10) Circulating fluid outlet, (11) Peristaltic pump, (12) Gas sampling port, (13) Gas outlet, (14) Sprinkler head.
Processes 10 02016 g001
Figure 2. Static adsorption of H2S and NH3 on modified activated carbon, Nitric acid concentration (a), Sodium hydroxide concentration (b), Calcination temperature (c), Metal salt solution (d), Impregnation concentration of copper nitrate (e).
Processes 10 02016 g002
Figure 3. Conductivity (a), nutrient release (b), and pH (c) of the composite fillers.
Processes 10 02016 g003
Figure 4. Removal efficiency of H2S and NH3 in BTF1 (a) and BTF2 (b) under different inlet concentration and EBRT conditions.
Processes 10 02016 g004
Figure 5. The elimination capacity of different EBRT (a,b) and inlet concentrations (c,d) for H2S (a,c) and NH3 (b,d).
Processes 10 02016 g005
Figure 6. Bacterial community composition of the BTF1 (a) and BTF2 (b) at genus level, others represent microbial species with relative abundance <1%.
Processes 10 02016 g006
Table 1. Modification conditions for activated carbon.
HNO3 (mol/L)NaOH (mol/L)Calcination Temperature (°C)Metal Salt SolutionImpregnation Concentration (wt%)
0.50.5400Cu(NO3)21
1.01.03
2.02.0600Fe(NO3)35
3.03.07
5.05.0800Mn(NO3)210
Table 2. Operating parameters of biotrickling filter.
PhasePeriod of Operation (Days)EBRT (s)Inlet Concentration (mg/m3)
H2SNH3
I1~1010083.683.6
II11~28100~3483.683.6
III29~4640139.4~627.2139.3~626.9
Table 3. Characteristics of filler.
Particle Size (mm)Bulk Density (kg/m³)True Density (kg/m³)Porosity (%)Moisture Content (%)pHMechanical Strength (N)
Composite filler15164.841460.2866.9~7.4203
bark30~5024459.956.35.7
Moisture Content: based on a dry weight.
Table 4. Statistical table of Alpha diversity indices, each index consists of composite filler BTF/bark filler BTF.
Sampling Time (Day)/Inlet Load (g/m3·h)ChaoACEShannonSimpsonCoverage
10/3.4119.5/645.6189.2/691.10.4/3.60.88/0.080.998/0.988
13/3.4388.8/720.5521.9/755.61.9/4.10.32/0.040.992/0.987
16/4.1237.3/587.0317.0/793.81.8/3.90.34/0.050.995/0.987
19/5.5328.6/782.3430.5/774.52.5/4.70.20/0.020.993/0.987
22/6.8197.3/806.9279.1/923.21.7/4.60.32/0.020.995/0.984
25/8.2546.5/801.0564.9/989.93.0/4.20.12/0.040.990/0.984
28/9.6620.2/856.0810.4/876.03.8/5.10.05/0.010.986/0.984
31/13.7632.5/980.2516.0/1097.93.3/4.80.07/0.020.991/0.981
34/20.5551.77/712.28678.81/731.363.5/4.70.08/0.020.988/0.986
37/31.4565.0/1002.0633.7/1099.23.8/4.50.05/0.030.988/0.981
40/41.0526.9/717.6651.5/641.83.7/4.30.06/0.040.989/0.987
43/51.2523.7/488.1642.2/512.72.5/3.90.29/0.050.989/0.990
46/61.5631.1/552.1588.8/543.52.8/3.90.21/0.060.989/0.989
Publisher’s Note: MDPI stays neutral with regard to jurisdictional claims in published maps and institutional affiliations.