1. Introduction
Watermelon (
Citrullus lanatus, family Cucurbitaceae) is a fruit with a high amount of water (91%) and sugar (6%). Half of a watermelon fruit—the pulp—is consumed, whereas the other half, consisting of rind and seeds (about 40–45%), is generally discarded, being considered solid waste. Nevertheless, it can be transformed into a more useful form and used in pharmaceutical, wastewater treatment, and food applications. The main regions producing watermelons in the world are Asia (79.5%), Africa (7.5%), and the Americas (6.9%). China has the largest volume of watermelon production (about 55% of total volume), reaching 60.9 M tons/year [
1], being also a major consumer of watermelon. On the other hand, Argentina produces 127,000 tons/year of watermelon mainly cultivated in San Juan Province (Cuyo region).
The watermelon rind contains natural antioxidants, proteins, minerals, and fibers [
2], helping the digestive system and producing a feeling of satiety. The raw watermelon rind is consumed in some countries as a vegetable by stir-frying, stewing, pickling [
3], and cooking with sugar to make jam [
4]. Concerning the use of dry watermelon rind as an ingredient in the formulation of baking products, several authors reported its utilization in bread [
5,
6], cakes [
7], and noodles [
8]. Waghmare et al. [
9] developed a new bulk-forming laxative from watermelon rind flour and Ho et al. [
10] used it as a natural food additive. Liu et al. [
11] reported that watermelon rind can be considered an eco-friendly and economic biosorbent for removing Pb from water and wastewater, while Petkowicz et al. [
12] and Bhattacharjee et al. [
13] cited its potential for use as an absorbent for the removal of heavy metals.
The main problem in processing watermelon rind into powder is its high water content (90–95%). Drying is the most common method used to extend the shelf life of raw fruits and vegetables with high water content, which in itself reduces the need for packaging and storage [
14]. However, in the food industry, excessive heating should be avoided because it is detrimental to food quality, provoking potentially irreversible changes in the nutritional values of the products, and underutilizes plant capacity [
15]. The watermelon rind must have a final humidity of 15% to be used as flour in several food applications.
According to the authors’ bibliographic research, there are some weaknesses in existing works about watermelon rind drying. Oberoi and Sogi [
16] studied the drying of watermelon rind in a fluidized-bed dryer (FBD) and cabinet drying chambers and their effect on the lycopene content at temperatures of 40 °C and 60 °C only. Similar investigations were reported by Ho and Dahri [
8], while Ho et al. [
10] cited the effects on physicochemical and functional properties, only at these two temperatures. In this context, it can be inferred that the drying kinetics at several temperatures (60 °C to 95 °C) of the watermelon rind has not previously been studied. The multiobjective optimization of the drying temperature and main operating variables (like pH, acidity, water-holding capacity, and oil-holding capacity, among others) has not been reported in the literature either. Such understanding of the process would allow obtaining flour with optimal functional characteristics to be employed in the food industry as an ingredient in bakery products.
The use of nontraditional flour in baking is based on the fact that it represents an interesting alternative in the field of healthy eating, since bread is part of the first level of the nutritional pyramid and one of the most consumed foods in many countries [
17]. The US Department of Agriculture (USDA) introduced in the set of recommended dietary allowances (RDAs) [
18] the “basic seven” to help people manage their food rationing. This list included bread and flour, among others.
Fabani et al. [
18] recently reported the development of an artificial neural network (ANN) model used to simulate the convective and solar convective drying process of watermelon rind pomace applied to the fabrication of nontraditional flour. This information could be used to optimize the drying process, which is involved in the quality parameters of flour, due to technofunctional properties depending on it, and these are essential to assess the baking process to obtain a final product with the highest quality. According to Bennion [
19], the pH of the flour influences the capacity of gluten to form the spongy network, and a pH lower than 3.4 will cause an alteration due to acetic and butyric microorganisms. To obtain a greater fermentative development and maximum production of CO
2 in the formed bread, it is necessary to have pH values between 5 and 6, the best being between 5.4 and 5.8. Concerning the acidity of the flour, it must not be higher than 0.25% because greater values can modify the physical, chemical, and rheological properties of the dough. Otherwise, the water-holding capacity (WHC) and the oil-holding capacity (OHC) should be as high as possible within the previously established values for the pH and acidity indicators.
In the literature, there are not many studies reporting MOO of drying processes and even fewer referring to watermelon rind. Chauhan et al. [
20] applied multicriteria decision-making to the optimization of pineapple drying. This involved the optimization of three indicators: energy consumption, nutrient retention, and drying time. Shivapour et al. [
5] reported the optimization of the formulation and processing parameters involved in bread baking by response surface methodology (RSM). Sendín et al. [
21] described and applied an efficient and robust multicriteria optimization method for the thermal sterilization of canned food. The authors emphasize that multicriteria optimization was much more realistic than the more common single-objective approach, although the complexity of the problem was increased. An example of this complexity was shown by Goñi and Salvadori [
22], who initially developed a first-principle model for beef roasting in a convective oven and then solved it using the finite element method. The optimization process included conflicting objectives, such as temperature, time, and weight loss. This last factor was directly linked to the proteins, lipids, texture, and juiciness of the final product. The mathematical model was developed, simulated, and then validated with experiments.
Another important aspect of the optimization problem is the search algorithm to be applied. Abakarov et al. [
23] proposed a modification of the random search algorithm that showed advantages over the classic formulation of the search strategy. The algorithm was also tested with the optimization of the thermal processing of canned food problem. Such problems include both maximization of quality and minimization of lethality.
Several authors have recently applied the multiattribute decision-making strategy based upon the AHP/TOPSYS principles for building-scale heating systems [
24], physical adsorption of CO
2 in carbon-capture processes [
25,
26], and other processes [
27,
28]. The difference between this partly fuzzy and the present approach is related to the different procedures in applying weighting factors to the selected process/product parameters in a higher/better or lower/better assessment.
Objectives of This Work
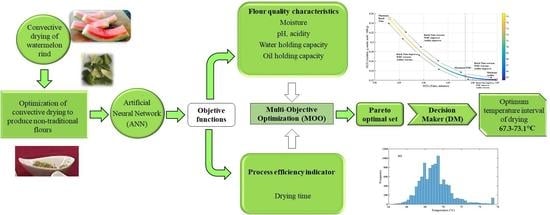
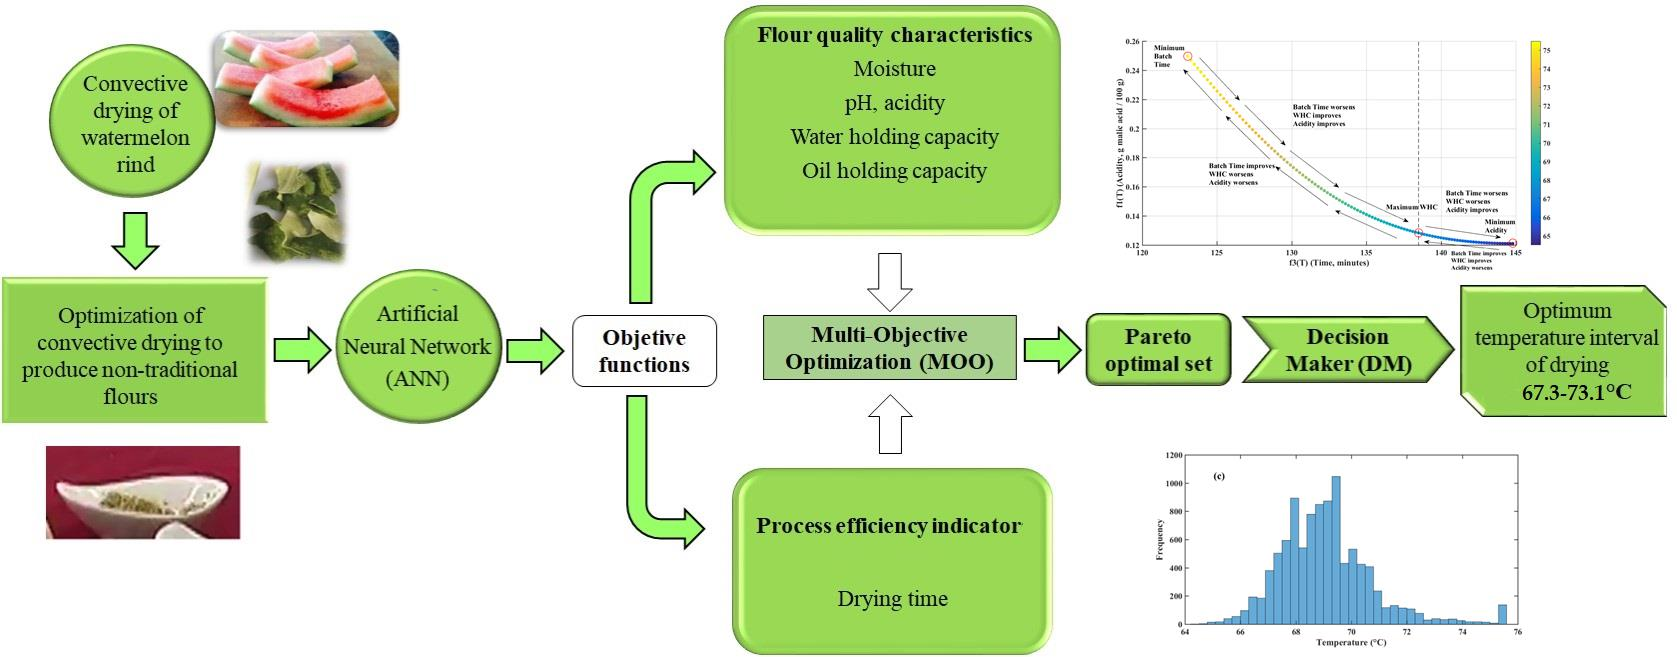
The present work’s objectives were as follows: (1) to develop a data-based model of the watermelon rind fabrication process based on experimental data (search space sampling), (2) to determine the Pareto-optimal front, which encompasses all the optimal solutions to the multiobjective optimization problem, and (3) to determine, based on literature criteria, the most appropriate temperature operating conditions within the Pareto-optimal front for obtaining the best possible watermelon rind flour.
The results obtained from previous work (drying kinetics at 70, 75, 80, 85, 90, and 95 °C) [
17] complemented with new data, and the technofunctional properties of the watermelon rind flour were used to train the ANN model.
Figure 1 shows a logic diagram of the present work.
2. Materials and Methods
2.1. Feedstock Samples
Fresh watermelon samples (Citrullus lanatus cv. “crimson sweet”) were collected in January–February 2020 from farms located in the Department of Iglesia (province of San Juan, Argentina) and stored at 20–25 °C in the dark until analysis within 2–4 days after sampling. The watermelons were washed, manually peeled and rinds were cut into cubes (1 cm3, preserving epicarp and mesocarp).
2.2. Drying of the Samples
The watermelon rind flour samples were obtained by drying fresh cubes of rind in an oven described previously by Baldan et al. [
14] at temperatures between 60 and 100 °C, with 5 °C increments for lower temperatures and 2.5 °C increments for higher temperatures. The drying equipment consisted of a stainless-steel cylinder of 50 mm ID and 1000 mm in height, which was heated by an 850 Watt electrical resistance. It is coupled to an analytical balance, a temperature controller, and a computer (
Figure 2) in order to register the time, temperature, and mass data. The airflow was set to 100 mL/min. The drying interval of 60–95 °C was chosen since below this temperature range, the drying time is too long. On the other hand, when considering temperatures higher than 95 °C, changes in the color and flavor of the rind were observed. Samples were dried until moisture content was lower than 15%, according to the Codex standard for wheat flour [
29] so as to prevent any degradation of the flour.
2.3. Preparation and Analysis of Watermelon Rind Flour
Each sample of watermelon rind was milled in a stainless-steel knife mill (TecnoDalvo, model TDMC, Argentina) until reaching a grain size of between 0.10 and 0.20 mm. The flours were stored in plastic bags at 20 °C until further use.
The moisture content of the feedstock watermelon rind and the obtained flours was determined using an infrared moisture analyzer (Radwag PMR50) with a halogen energy source at a temperature of 105 °C [
30]. The flour sample (2.0 g) was weighed into a 100 mL beaker and 40 mL of distilled water was added and stirred for 30 min. Then, the mixture was filtered and the pH was measured in the filtrate. The total titratable acidity of the flour sample was determined in the filtrate by titration with sodium hydroxide (NaOH, 0.1 N), using 5 drops of phenolphthalein indicator until the mixture turned pink. The total titratable acidity in the watermelon flour sample is reported as grams malic acid/100 g sample (acid factor used: 0.067) [
30].
The technofunctional properties of the watermelon, water-holding capacity (WHC), and oil-holding capacity (OHC) were determined as described by Garau et al. [
31] with slight modifications. For the WHC determination, ground samples of watermelon flour (±0.5 g) were hydrated in excess for 24 h in 15 mL Falcon tubes and then were centrifuged at 2000×
g for 30 min. The supernatant was eliminated and water retention was expressed as grams of water held per gram of watermelon rind flour sample on a dry weight basis (dwb; g water/g sample dwb).
The OHC analyses were performed by mixing 0.5 g of sample with sunflower oil (10 mL) in 15 mL Falcon tubes. After 24 h, tubes were centrifuged at 2000× g for 30 min, the supernatant was eliminated and oil retention was reported as grams of oil held per gram of watermelon rind flour sample on a dry weight basis (g oil/g sample dwb).
2.4. Neural Network Modeling
The goal of the drying process is to output a raw material that will later produce flour with the required quality characteristics and at the lowest possible cost. To do so, first, a data-based model of the fabrication process was developed based on experimental determinations made on the flours obtained after milling the dried rinds. One of the advantages of having a model is that the optimization process can be carried out offline, i.e., without having to try every possible temperature value in the laboratory. The most conventional form of the data-based model to implement is linear or polynomial regression. However, nowadays access to more complex data-based models is available researchers. Such is the case of neural networks (NNs), which are computational structures capable of modeling high-order polynomials with lower errors and overfit. The neural model does not require large computational resources to run, as it is very fast, even on a normal personal computer. Another advantage of the NN data-based model is that no formal (explicit) set of equations is needed to solve the optimization problem because the model is only a software structure. No validated theoretical, semitheoretical, or empirical model is needed. The training of the NN is performed with the backpropagation algorithm and all the training sets are obtained from the laboratory experiments. Examples of similar models can be found in the literature, most only applied to modeling the drying process, e.g., Topuz [
32] and Chokphoemphun and Chokphoemphun [
33], and some like Kalathingal et al. [
34] incorporating quality characteristics, such as total phenolic content (TPC) and total color difference (TCD).
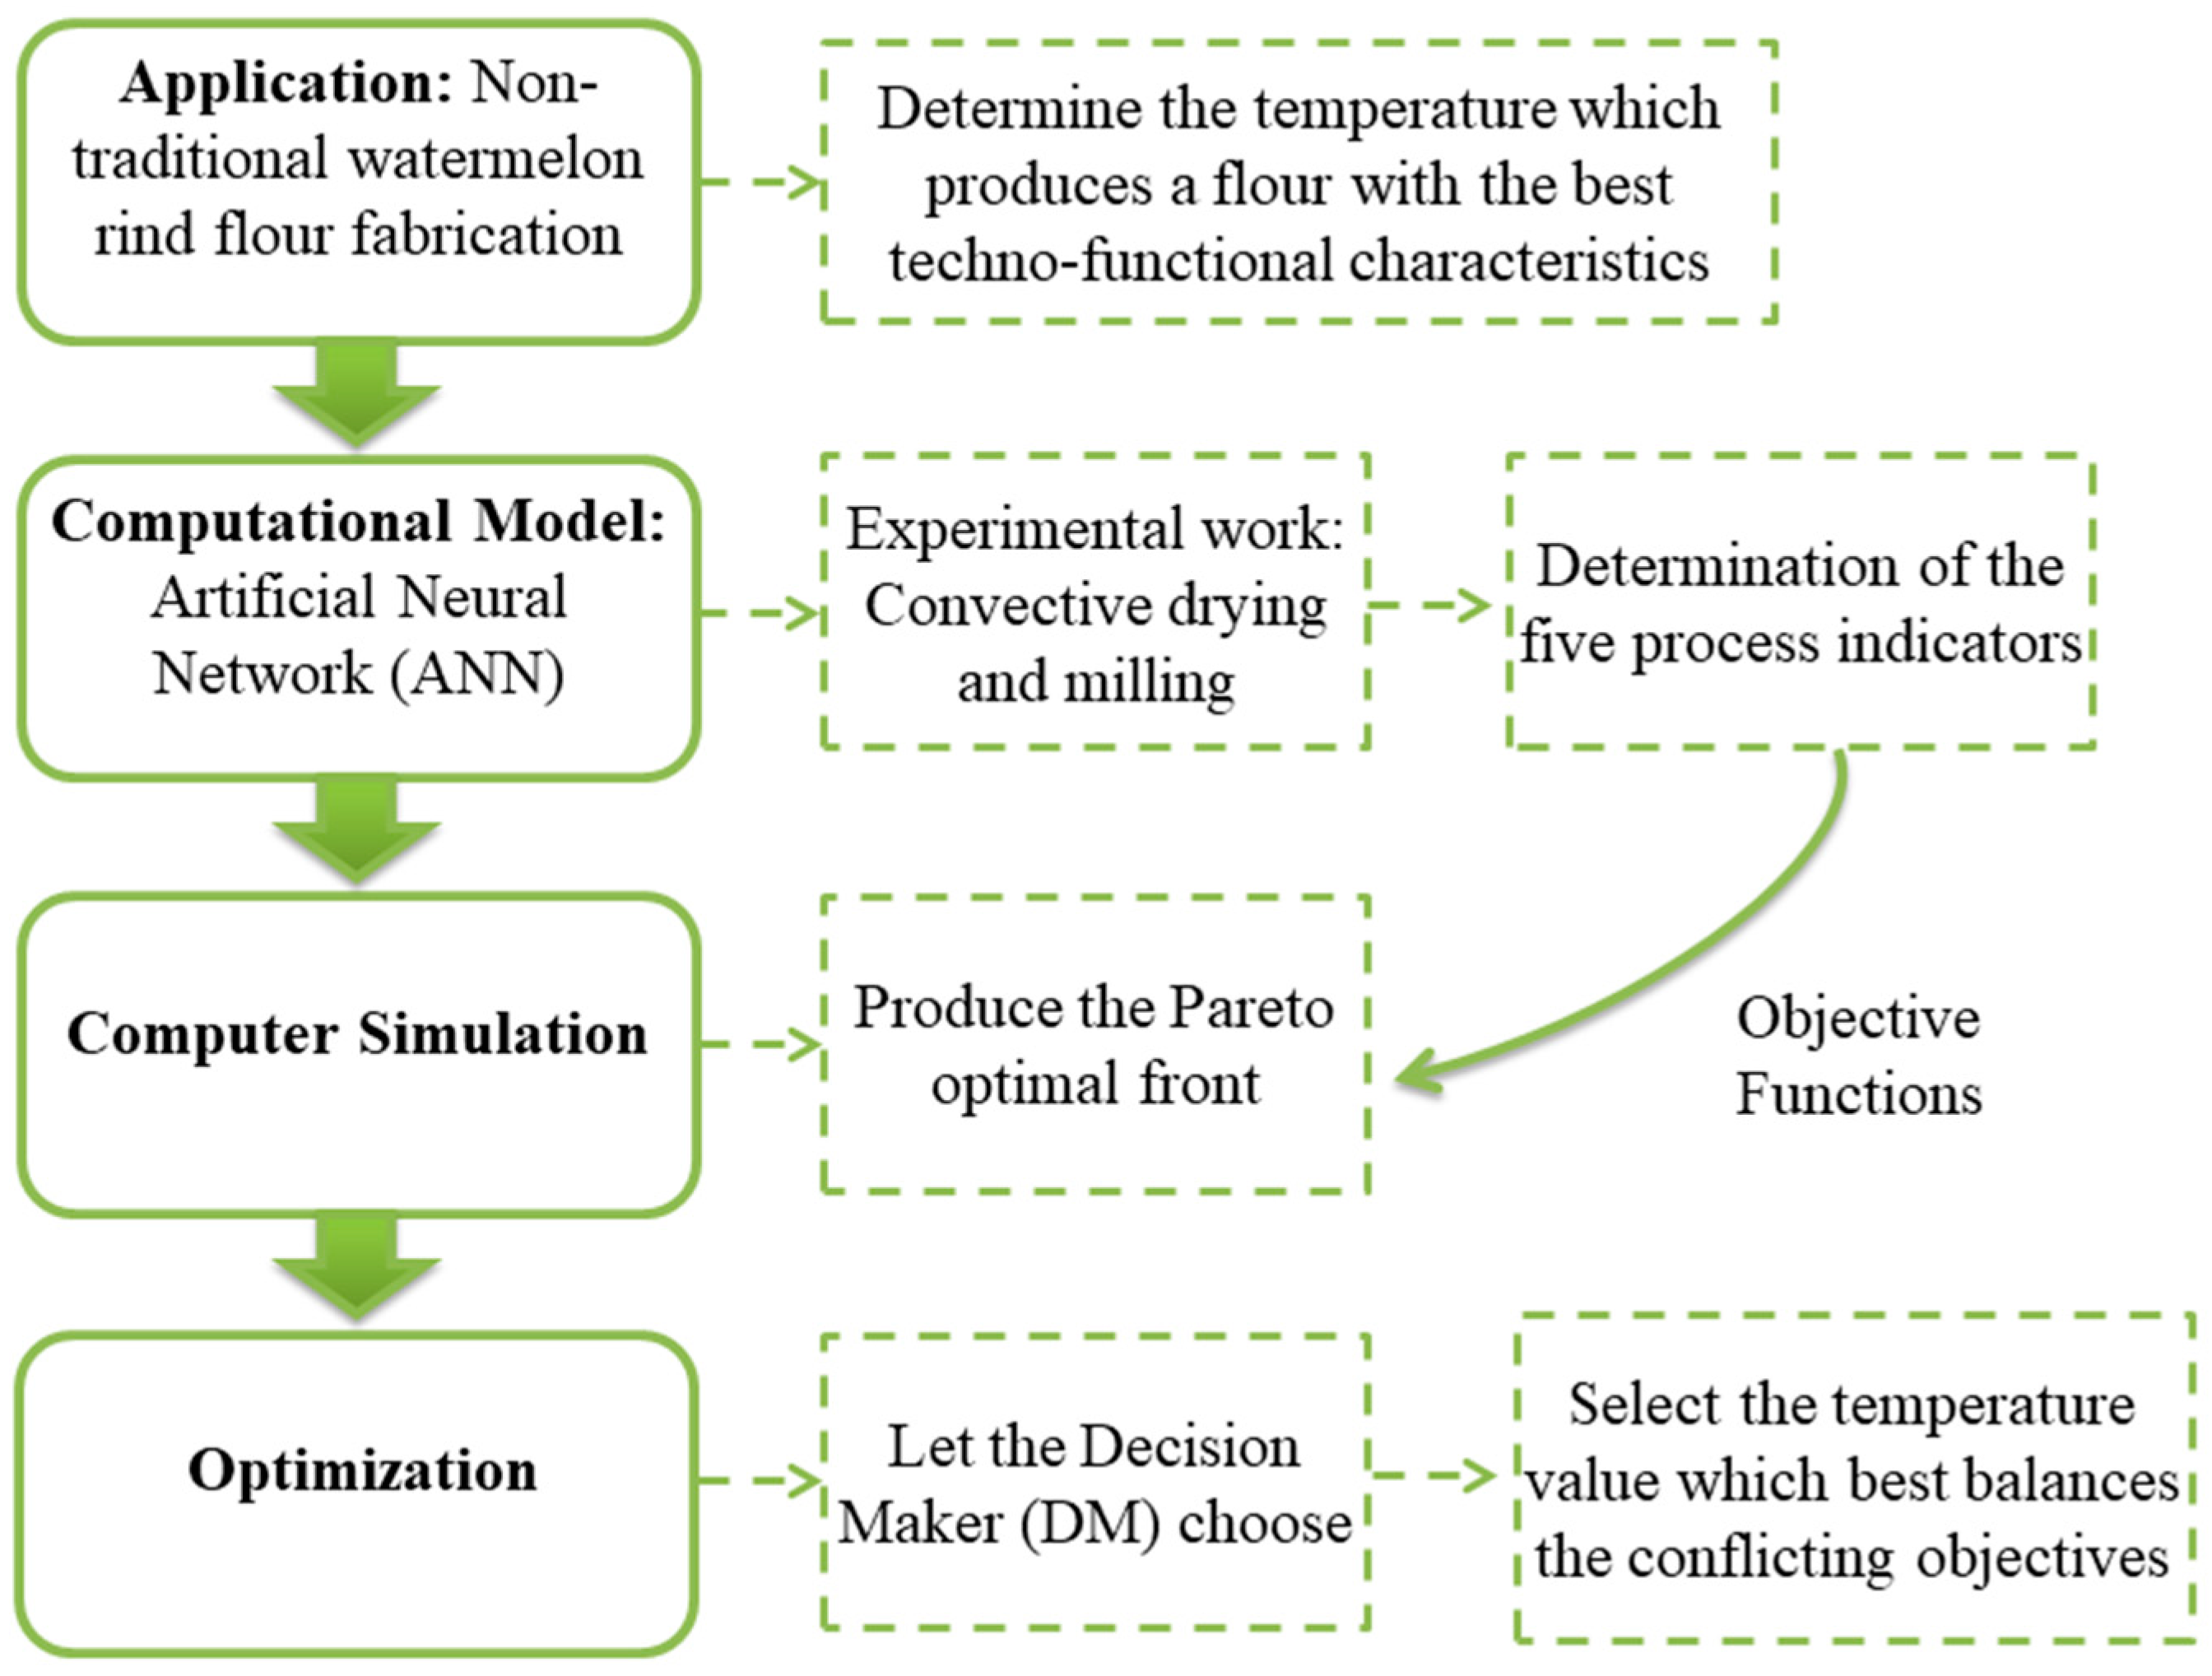
ANNs are computational structures capable of adapting to fit any type of process without having explicit knowledge of the principles that apply. That is why they are regarded as universal approximators and the multilayer perceptron in particular (Hornik et al., 1989 [
35], Pinkus et al., 1999 [
36]), that is, if given at least one hidden layer with sufficient neurons in it and a nonlinear activation function, they are capable of mapping any input–output relationship, regardless of the linear or nonlinear nature of it. As mentioned earlier, the ANN model has to have a nonlinear activation function in the hidden layer or layers. The main options available are ReLu, hyperbolic tangent, sigmoid, and others. There is no rule for choosing one. For this application in particular, the sigmoid gave the best results in terms of fitting performance, as in many other works (for instance, see [
32]). Another general guideline applied in this work was to keep the ANN model as small as possible in terms of neurons and layers. After a short trial-and-error process, adding more neurons to the hidden layer only led to overfitting the data. There was no further need to use more complex optimization.
The software utilized to design, train weights and biases, test, and implement the ANN was MATLAB
® Neural Fitting Tool. More details of the ANN are presented in
Table 1. The total number of training sets used was 13, one for each temperature experiment, and one ANN was trained for every process indicator (five models in total). One of the resulting ANN models is presented in
Figure 3.
The evaluation of the ANNs’ performance was based on two statistical indicators: the root mean squared error, RMSE (Equation (1)) and the coefficient of determination,
R2 (Equation (2)):
R2 values closer to unity are more desirable, show better fitting performance, while the RMSE should be as low as possible.
2.5. Multiobjective Optimization
Multiobjective optimization (MOO) [
37], also known as multicriteria decision-making or multicriteria optimization, is a decision-making process in which a person, called a decision-maker (DM), or group of some responsibility has to make one or several choices to achieve a certain level of process efficiency and final product quality. In modern industry, most likely situations are those of the so-called Pareto efficiency—a concept that comes from the field of economics—where, for instance, a certain indicator “A” can only be improved to the detriment of another indicator “B” of the same product and vice versa. In other words, neither indicator can be optimized (minimized or maximized) concurrently or at the same time, so they are said to be conflicting objectives. This can also be extended to any number of objectives. In these cases, a necessary compromise solution or middle point has to be determined utilizing a methodological approach together with some criteria and available information. Such is the concept of an acceptable solution, where there is no single set of independent variables (solution) that can optimize all objectives concurrently, but there is a group of solutions that can achieve various levels of optimality (compromise). Those solutions are called Pareto-optimal since they are the only acceptable ones for a MOO problem and any other solution is improvable. Additionally, those points are plotted together to form what is called the Pareto-optimal front.
Sometimes, just the minimization or maximization of a certain objective function may not be the DM’s desired goal. That is because there are problems where the decision has been made, based on information, to achieve a specific level of precision that does not necessarily require a minimization or maximization of an objective.
Another useful concept is the definition of a utopian vector. Such a vector contains all the individual global optima for each objective function and it represents the place that each one could reach if there were no conflicting objectives. The problem is that it is seldom known where those points lay precisely. The location of those points will probe valuable in the present work. Lastly, the feasible set,
S, is defined as the decision variable interval that yields a solution that is physically attainable and satisfies the problem’s constraints. So, as explained in
Section 2.2, a first approximation of the feasible set is restricted to the 60–95 °C interval.
Now, let us formulate the multiobjective optimization problem mathematically in its general form with Equations (3) and (4), where
fi(X) is an individual objective function or performance indicator and
X is a real n-dimensional vector of controlled or decision variables. The performance indicators and the controlled variables constitute the system’s output and input variables respectively.
Figure 4 shows some examples of input and output variables belonging to several different food processing systems. As seen, the system can have multiple inputs and outputs; also, it can have a single input and multiple outputs or any combination. Ideally, finding a decision variable
X that concurrently minimizes each objective function and, consequently, minimizes the global optimization function Φ
(X), would be preferable.
However, in overwhelmingly most realistic situations, it is impossible to optimize all individual objective functions at the same time. Here, the concept of an acceptable solution is applied. Consequently, to calculate the Pareto-optimal front,
P(f), an aggregating function, which transforms the multiobjective optimization problem into a single global optimization problem, is generally applied. For example, the linear weighted sum aggregating function [
38], as seen in Equations (5) and (6), where
wi is the weight corresponding to the
i-th particular objective function, can be solved using a search algorithm. Here, it is important to point out that those weights are ultimately determined by the DM.
If among the objectives there is a mixture of minimizations and maximizations, then a homogenization is required according to
max {
fi(X)} = −min {−
fi(X)}. The main drawback of the weighted sum aggregating function is that it is impossible to obtain points on nonconvex (concave) segments of the front. It is possible to obtain an incomplete front if the solution space is not entirely convex. Another drawback of the method is that changing the weight values might not yield an even distribution of the Pareto-optimal points, making it difficult for the DM to have an accurate representation of the optimal set [
39]. The consequence could be that the weight values might end up being meaningless to the DM, who will not comprehend why a certain change in the weights produces unexpected effects in the outcome. A better approach would be to use the weighted distance method [
40], also called a method of the weighted metrics (
Lp metrics) in which the idea is to minimize the distance to each objective’s utopia point, as seen in Equations (7) and (8), provided those points are known. To obtain the utopia point,
, optimization of each objective function is necessary by applying the expression in Equation (9) and/or Equation (10), depending on if the aim is to minimize or maximize.
The exponent p can adopt different values (1 ≤ p < ∞). For instance, if p = 1 the sum of the weighted distances to the utopia points is minimized, but as the p exponent is increased, the minimization of the largest errors becomes ever more important. Its relevance lies in the fact that a small value of the exponent p may not yield all the Pareto-optimal solutions if the front is not convex and, also, there may not be a p-value that provides all optimal solutions without convexity. In other words, there may be no weight value combination that will produce some of the Pareto-optimal points. One approach for selecting the p exponent is to use larger values when there are few objective functions and lower values when there are many objective functions.
In the present work, the only controlled variable of interest is the temperature due to the characteristics of the drying equipment and due to its most significant impact on the final product. At the other end, the objective functions can be divided into two groups: the flour’s quality characteristics and the process’s efficiency indicators. The first group is comprised of four indicators: acidity, pH, WHC, and OHC. Finally, the second group is formed by batch time. Five objectives in total, as shown in Equation (11), along with five weights.
Search Method for Obtaining the Pareto-Optimal Set
To find the Pareto-optimal set, different combinations of the weights are tried to identify all the temperatures belonging to the front given a certain aggregating function. The most direct and error-free method for finding all temperatures belonging to the Pareto-optimal front would be to try every possible weight value. In numerical terms that is called uninformed search, brute-force search, or manual search, where “no stone is left unturned” [
39]. However, that is, of course, very costly from a computational standpoint because the search space is vast. A more efficient way of doing this is utilizing a search heuristic like a random search in its adaptive form or not; also, a grid search could be used.
Figure 5 shows the algorithm implemented to obtain the Pareto-optimal set. It is based on the pure random search (PRS) algorithm, which is actually a family of numerical optimization algorithms that are independent of the gradient of the problem to be maximized or minimized. Hence, these search methods can be applied to undifferentiable and discontinuous problems. It is based on generating the weights (hence, it is also called the “generative method”) from a given probability distribution, for example, a normal distribution, but, in this case, a uniform distribution was used. In this way, the weight’s space is randomly sampled and the Pareto-optimal set is obtained if sufficient samples are taken. Undersampling the search space could be detected by small gaps in the Pareto set. Lastly, to make sure the Pareto-optimal front is complete, the algorithm has to be run a few times and, if all the resulting Pareto sets are equal, most likely there are no new Pareto-optimal points to be found and the front is complete. In every new run, different weights are used but the resulting front has to be the same.
In every iteration, Min {Φ
(T)} is calculated with a uniformed search, that is, in other words, every temperature value within the feasible set is tried and the global minimum is obtained for each set of randomly picked weights. This less efficient search method was used because the temperature search space is much smaller than the weight search space. For more complex problems (more inputs, larger domains, between others), a genetic algorithm or an adaptive random search would be more suitable methods [
41].
It is also important to notice that all the above calculations were performed on normalized values (min–max normalization) because the five process indicators have different units and very dissimilar orders of magnitude that can affect the overall MOO results.
Finally, since in the PRS algorithm every candidate solution (i.e., set of weights) is independent, the algorithm can be executed in parallel with a multicore/thread computer, thus greatly speeding up the search process. In the present work’s case, a mid-range laptop computer with four cores was utilized to perform the calculations. The computer has 4 physical cores, each split in 2 if required that share each core’s resources. They are commonly referred to as computational threads.
2.6. Problem-Solving Strategy
Firstly, it can be observed that there are mainly two groups of indicators that lean towards opposite sides of the temperature spectrum. On one hand, the flour’s quality indicators (acidity, pH, WHC, and OHC) are optimized with lower temperatures. On the other hand, the process batch time is minimized with higher temperatures. Lastly, a subgroup of the former is optimized with temperature values that slightly tilt toward the center of the spectrum. Consequently, there is no doubt of the difficulty to deal with or manage the number of indicators to optimize. In this context, being sure to find the complete Pareto-optimal set is a very difficult task to perform with a search algorithm because of the number of different weight combinations to try and graphically too, due to the high dimensionality. Accordingly, in the next sections, we will apply the weighted distance method to find the Pareto-optimal front, where the main idea will be to reduce the weight and temperature search space and, at the same time, reduce the multidimensional objective function space identifying redundant objectives.
2.6.1. Redundant Objectives
As mentioned above, three most important points can be identified in the temperature range: (1) at the low end the acidity is minimized; (2) at the high end the batch time is minimized, and (3) at the middle-low part WHC and OHC are maximized. A redundant objective function [
42] is defined in terms of conflict between objectives, then an objective function is redundant if it is not in conflict with any other objective function. It is important to identify redundant objective functions to reduce the number of weights the DM has to pick. In other words, this means a reduction of the search space.
An objective function is redundant if it is not in conflict with any other objective function, so it can be eliminated (
wi = 0). On the other hand, an objective function is relatively redundant if it is only in conflict with some of the remaining objective functions. For instance, as described in Gal and Leberling [
42], if two objective functions,
fx and
fy, are nonconflicting, one of them can be removed without changing the Pareto-optimal front,
P(f), but not both at the same time (Equations (12) and (13)).
Consequently, a decision was made to eliminate some objective functions that are relatively and absolutely redundant and leave only three conflicting objective functions, f1(T), f2(T), and f3(T). Because visualization of more than two or three objective functions is not a trivial matter, this also helps with the visualization of the Pareto front, since it lowers the order of the problem and allows plotting a tridimensional trajectory.
2.6.2. Final Decision Determination
There are, mainly, two methods or approaches to determining the final decision: a priori and a posteriori [
43]. In the a priori method, the decision-maker (DM) specifies hopes, preferences, and/or opinions beforehand, although he or she does not know how realistic those expectations are. On the other hand, a posteriori methods try to find the Pareto-optimal front, present it to the DM, and let him or her decide among the optimal points. In the case presented here, there is some a priori information that can reduce the search space of the variables pH and acidity (
Section 1). According to the neural network’s predictions, those two conditions reduce the search space to approximately 60–75.5 °C. Temperature cannot be increased any further because that would mean having an acidity value greater than 0.25 g malic acid/100 g. The pH values within that same temperature interval are among the desired best ones of 5.4 to 5.8. This makes the pH objective function absolutely redundant and, in consequence, it can be removed. Alternatively, those intervals can be disregarded and the entire Pareto-optimal front can be determined within the whole width of the feasible set (60–95 °C) in which case the DM will have more options. In Equation (14), the redundancy-free aggregating function is presented.
In
Table 2, a summary of the selection process applied to keep or remove a certain objective function is presented. It is worth reiterating that this elimination process is key for solving the MOO problem in a reasonable time and computing effort.
3. Results and Discussion
3.1. Watermelon Rind Flour
The Codex standard for wheat flour [
29] defines moisture content as a quality factor and its value has to be lower than 15.5%. The flours for baking mixes must have a moisture content of less than 10%, as this value improves the quality and shelf life of the mix. Consequently, the watermelon rinds were dried to a moisture content of less than 10%. Al-Sayed et al. [
6] reported a moisture content of 10.61% for watermelon rind flour.
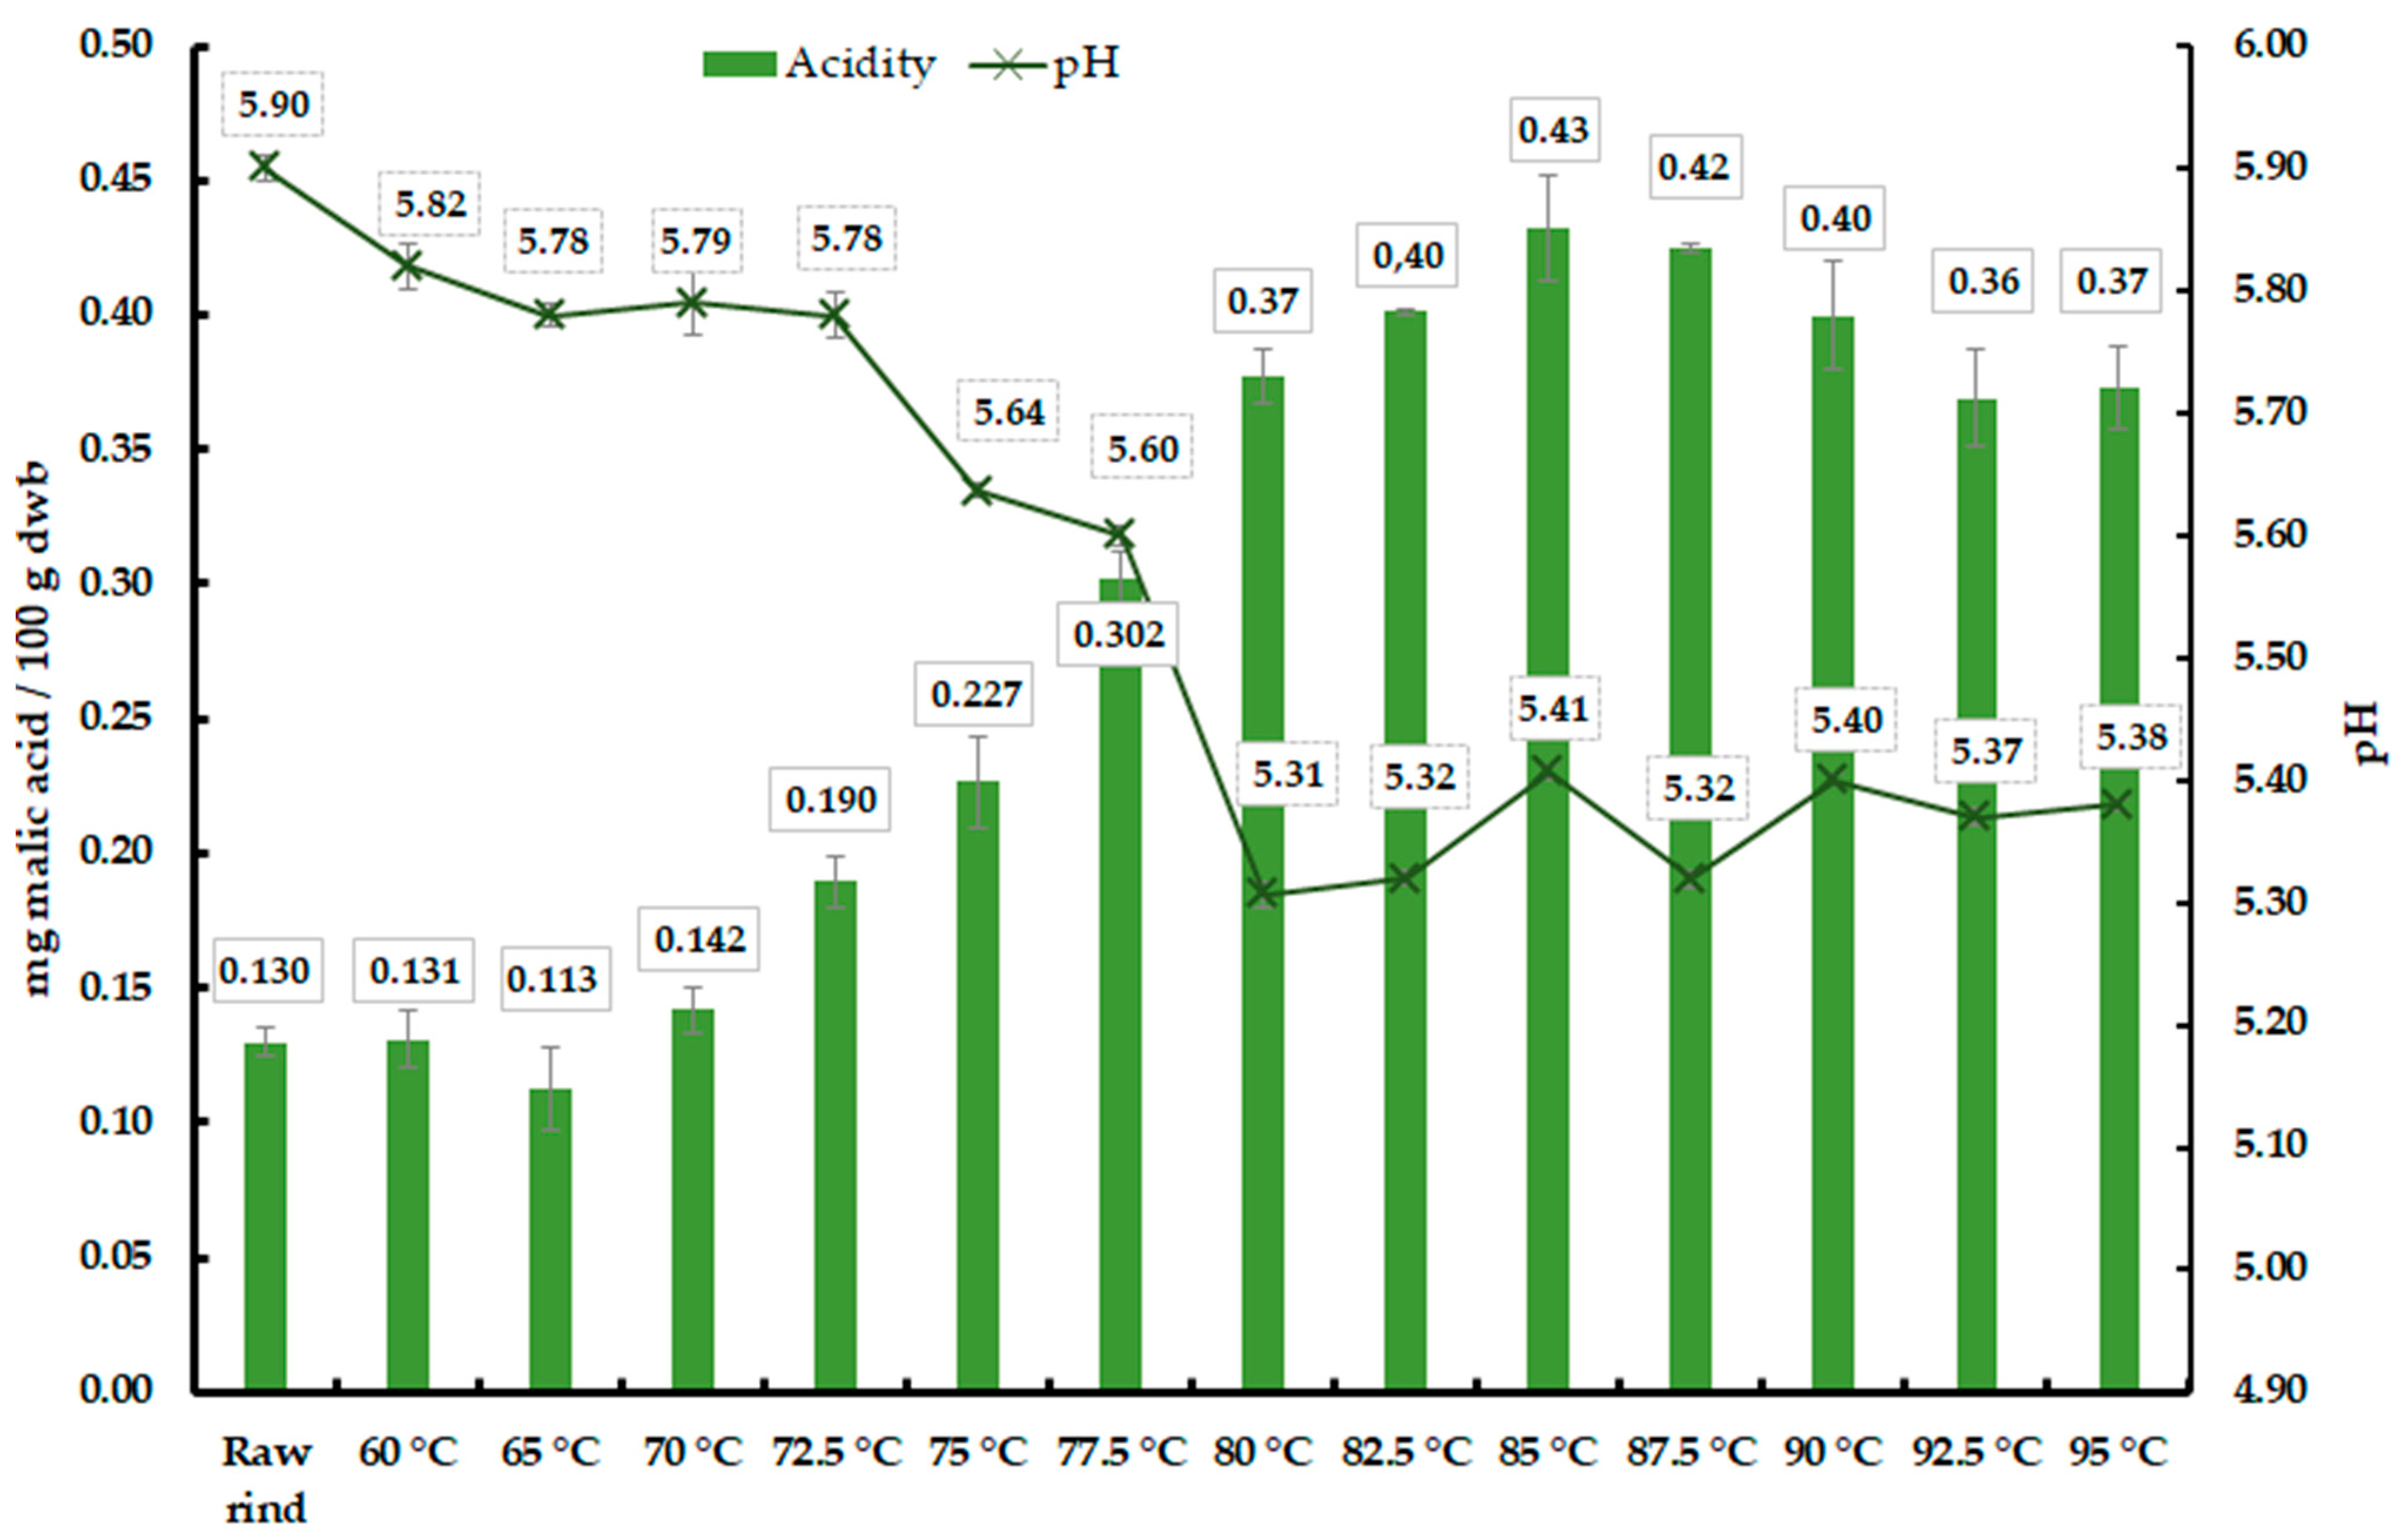
Figure 6 shows the acidity and pH values of the raw watermelon rinds and the flour obtained by drying them at the analyzed temperatures. The acidity of the rind increased after drying, showing the highest value at 85 °C. Then, a slight decrease in acidity was observed, which then increased again with the temperature rise. The pH value decreases as the drying temperature of the watermelon rind increases, showing behavior that correlates with acidity values.
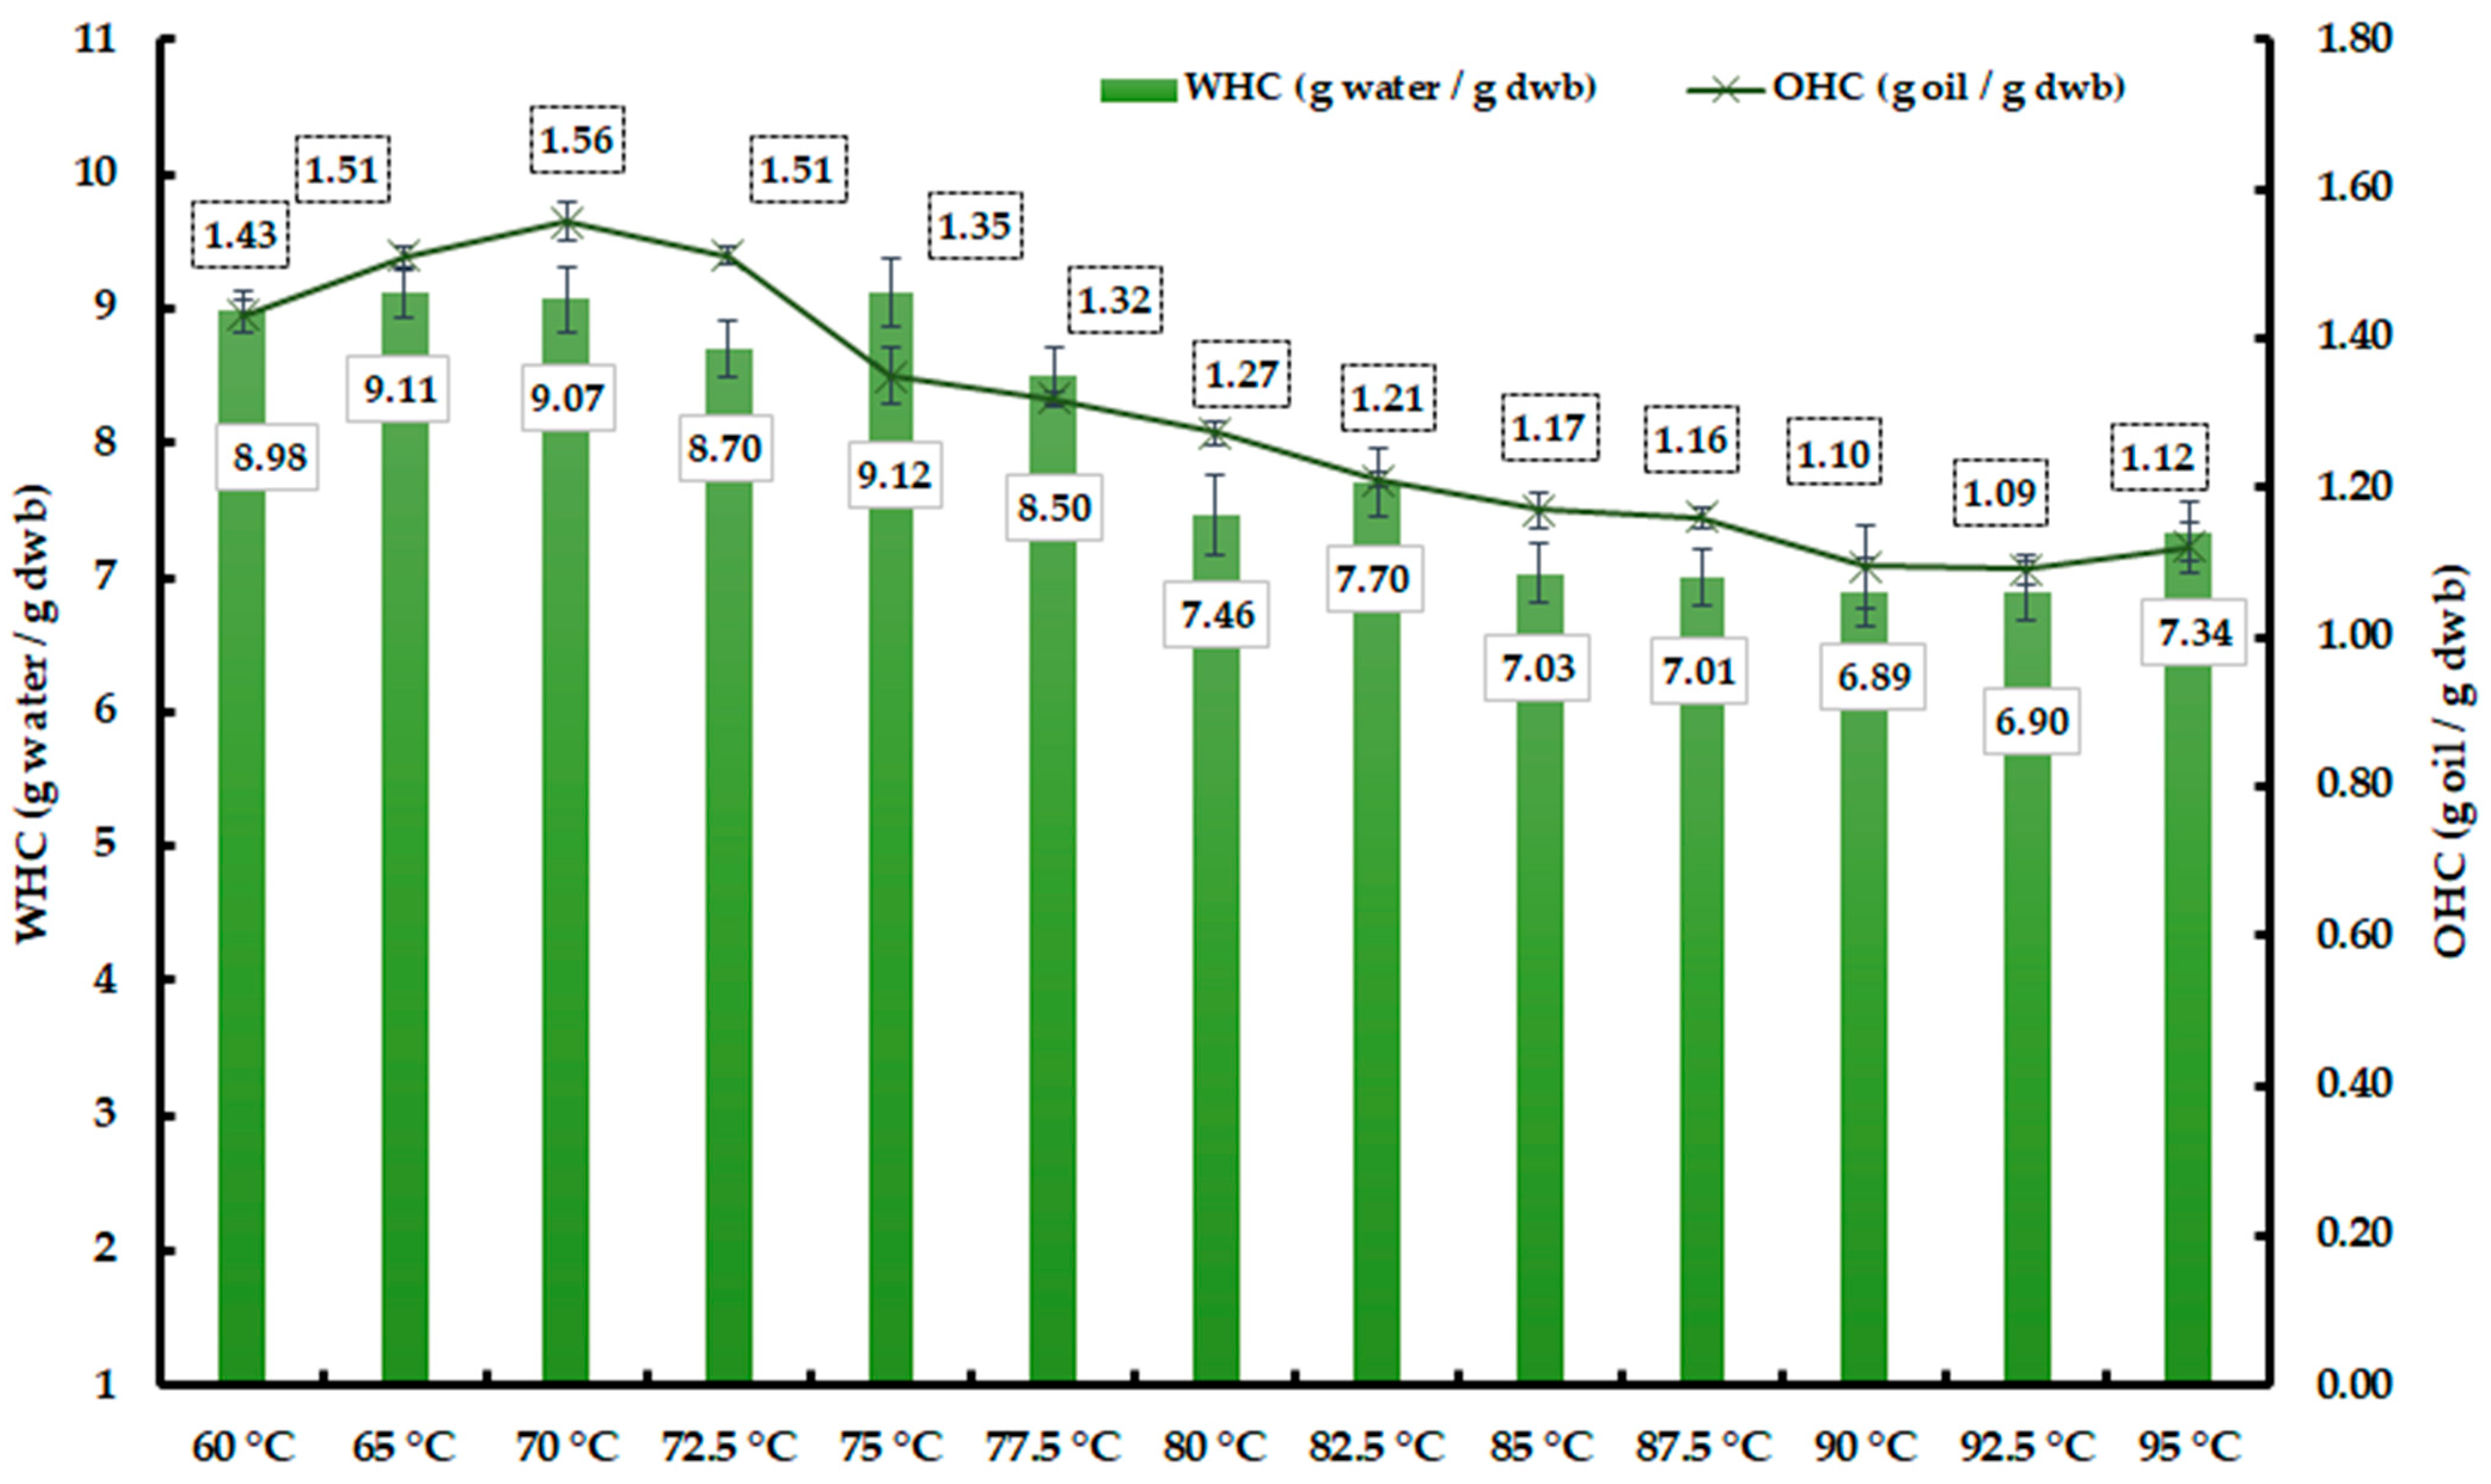
The technofunctional properties of flours obtained at different temperatures evaluated are presented in
Figure 7. The results showed that the WHC and the OHC were higher for the flour obtained at 70 and 75 °C. The values of WHC and OAC were higher than those reported by Al-Sayed et al. [
6] for watermelon rind dried at 50 °C, being 7.13 (g water/g) and 1.65 (g oil/g), respectively. These results indicate that between 70 and 75 °C watermelon rind flour holds more water and oil compared to rinds dried at 50 °C.
3.2. Neural Network Data-Based Models Training and Regression Results
The neural network’s training results are presented in
Table 3. The average R
2 was 0.988, with the lowest score of 0.973 for WHC and the highest of 0.998 for acidity. The fitting performance of the ANN was better than the performance of a comparable fourth-order polynomial (0.988 to 0.966). The average RMSE was 0.772 with a lowest score of 0.009 (best) for acidity and the highest of 3.592 (worst) for batch time.
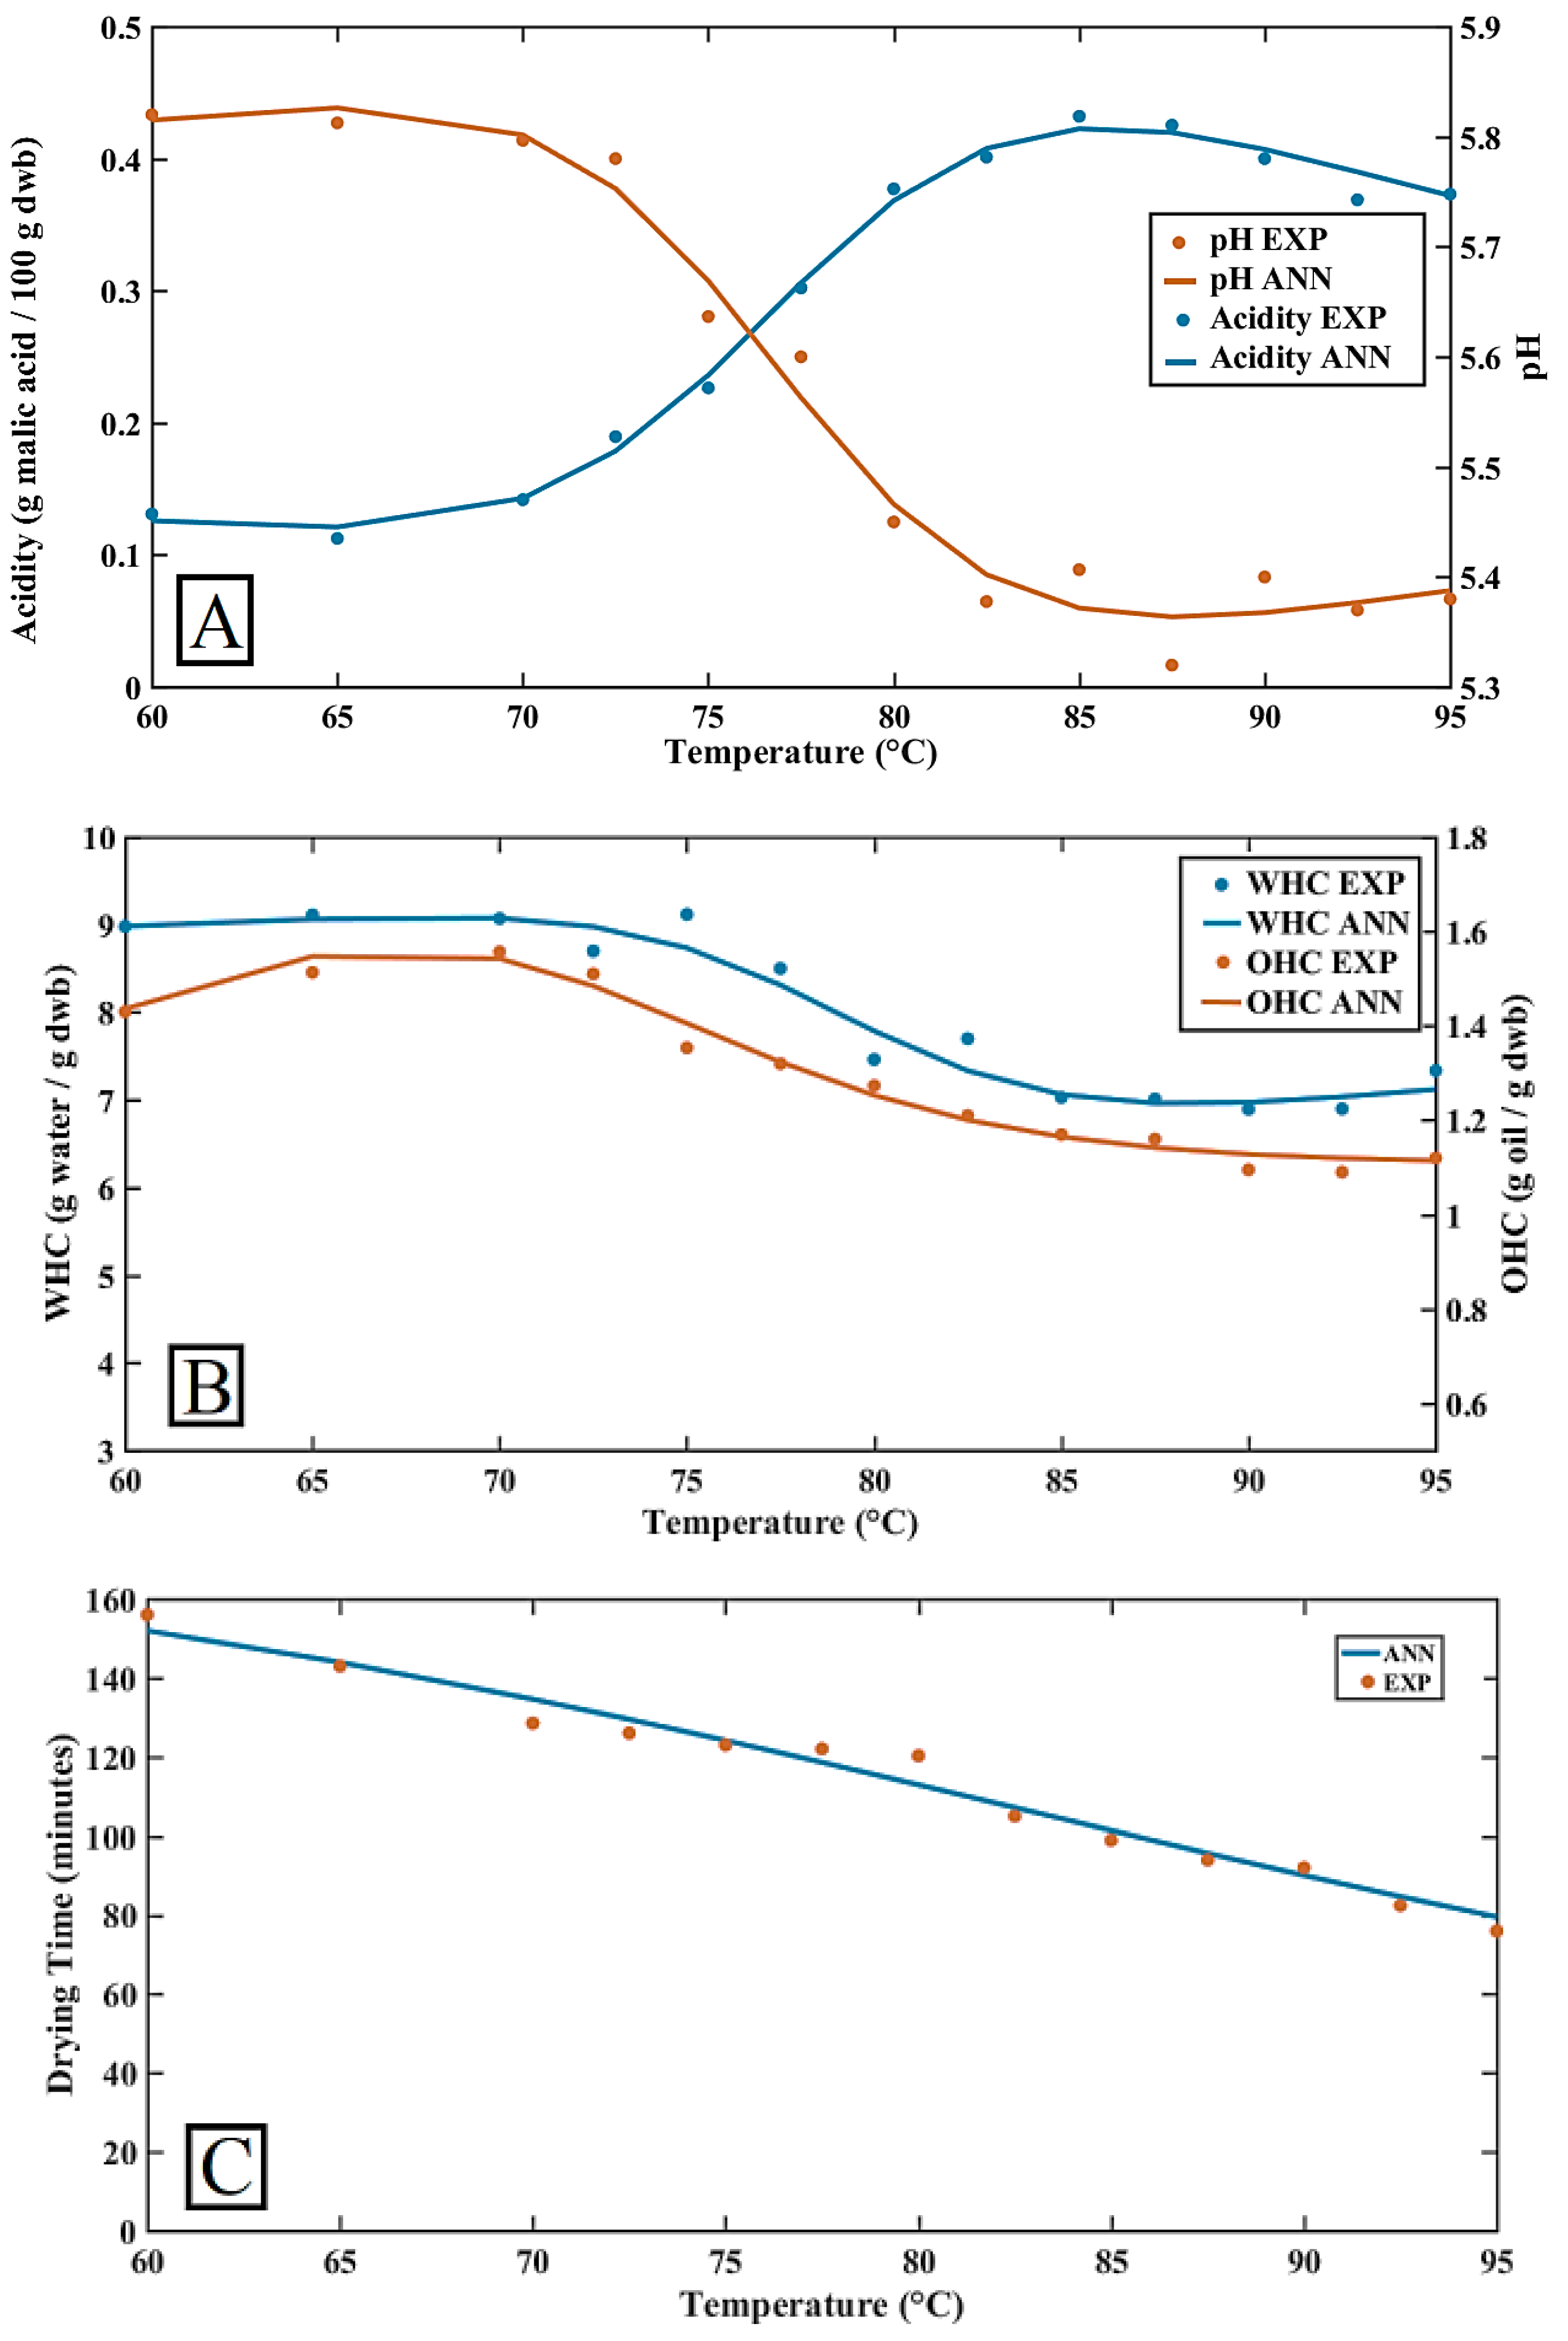
In
Figure 8, the ANN predictions are plotted together with each of the experimental results. The ANN models allowed us to perform simple minimizations and maximizations to find the individual optima of each of the objective functions and to use them to obtain the Pareto-optimal front with the weighted distance method. In
Table 4, the resulting utopia vector is shown. The necessary temperature values for each indicator to reach its utopian objective are also presented.
Analyzing these results illustrates the conflicting goals because lowering the oven temperature will improve WHC, OHC—factors that improve dough formation—also acidity will improve but, at the same time, the pH value climbs and batch time could be too long for economic feasibility. On the other hand, the temperature increase will lower the pH value and shorten the batch time. Therefore, it is of the utmost importance to find the necessary trade-offs and, in turn, this is accomplished only by providing subjective input into the process.
3.3. Optimization Results
In this section, first, the Pareto-optimal front corresponding to the selected three objective functions will be presented and, second, the data-driven model plus the random search algorithm and the defined redundancy-free aggregating function will be put together to obtain a complete and well-distributed Pareto-optimal front. In this manner, the DM will only have to choose the relevant weights according to his or her own desired outcomes. Also, a couple of problems have to be avoided for the weights to be truly meaningful: first, very similar weights cannot generate diametrically different Pareto-optimal points and, alternatively, utterly different weights cannot produce very similar Pareto-optimal points. These two goals (front completeness and weight coherence) will be tested by comparing the weight distribution versus optimal temperature of the weighted distance method and the weighted sum method.
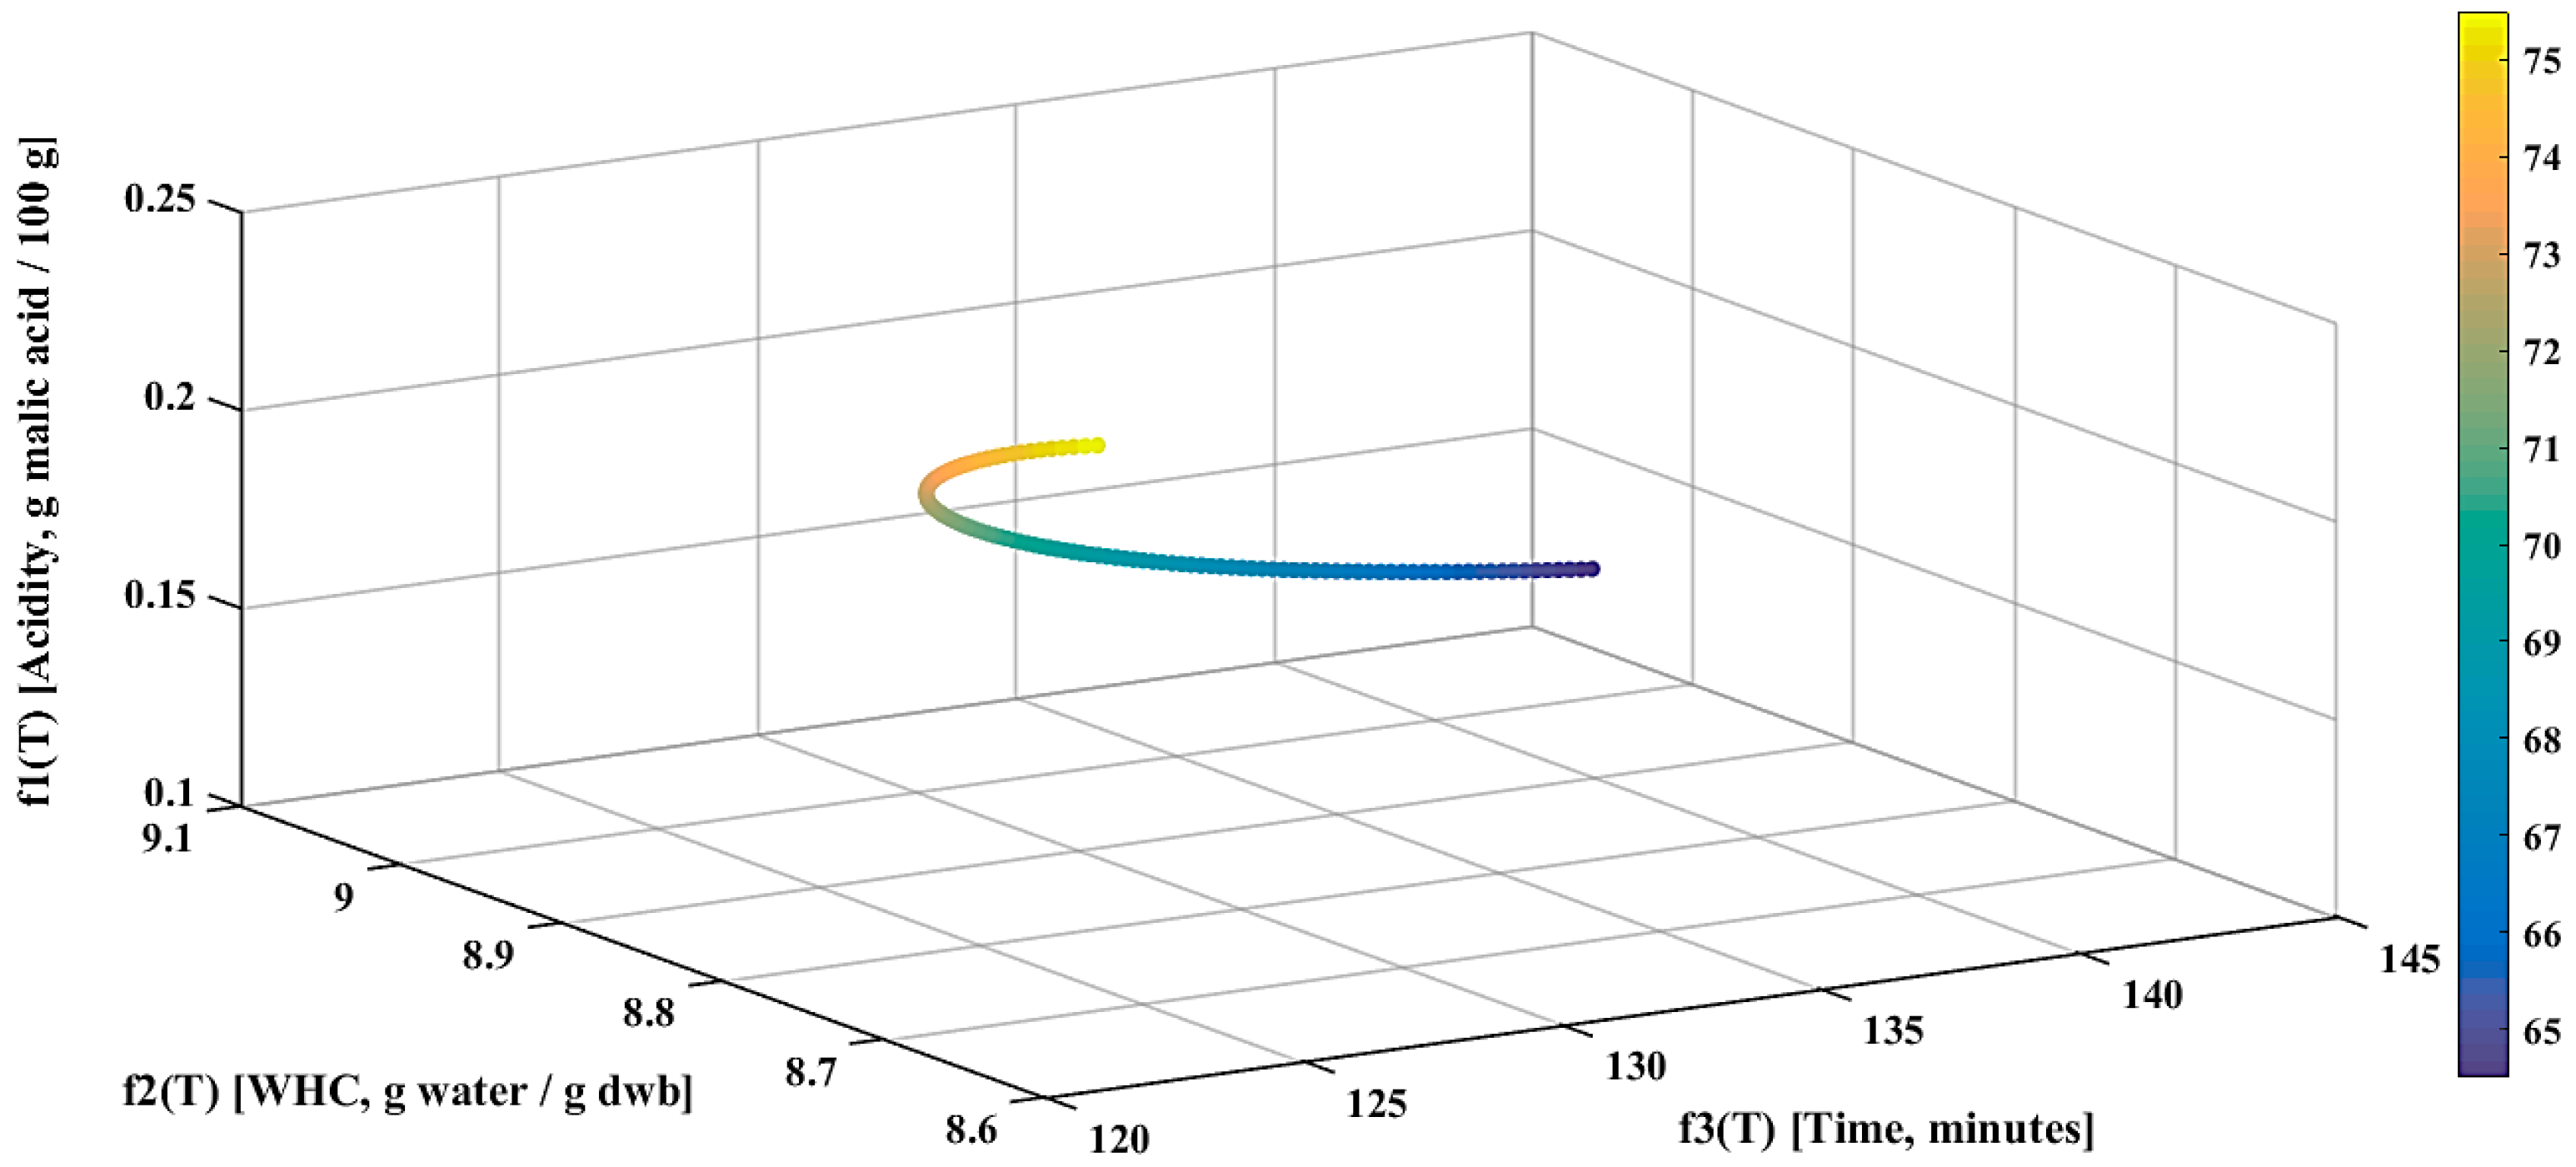
Figure 9 shows in a four-dimensional plot the Pareto-optimal front in the 64.5 to 75.5 °C interval. The three objective functions are plotted spatially and the temperature corresponding to each point is represented by a color scale. As it can be observed the front is convex. Then, a priori, the weighted sum aggregating function could be a good choice because it produces all points belonging to the front. The 60 to 64.5 °C interval is suboptimal because all objective functions will worsen if the temperature is lowered from 64.5 °C.
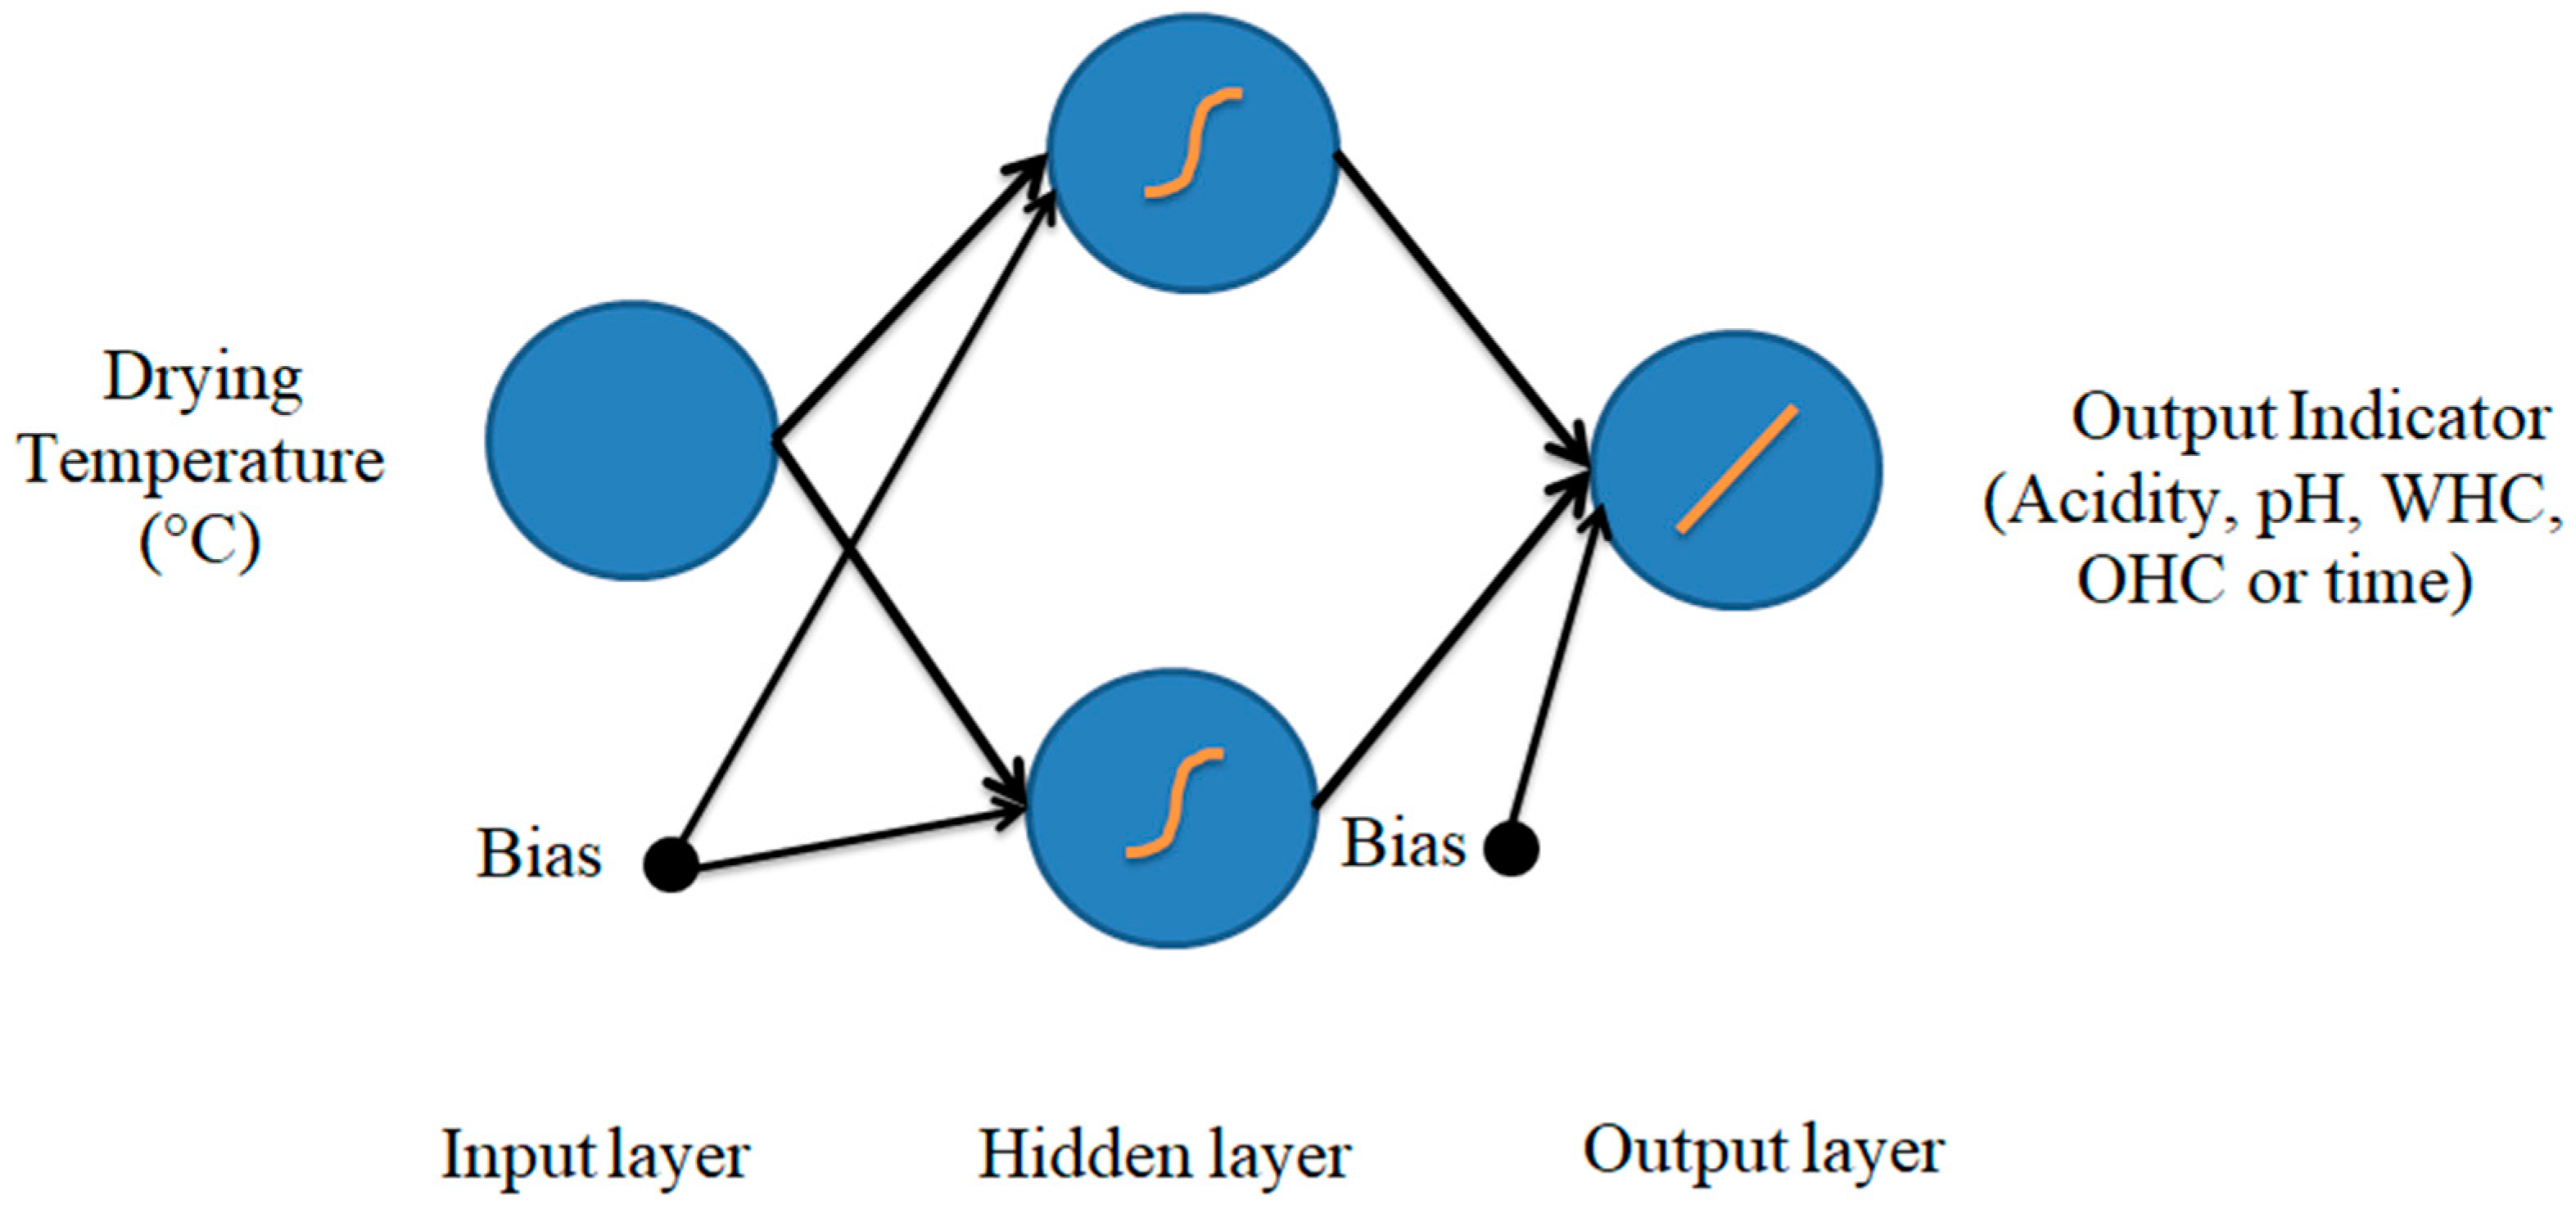
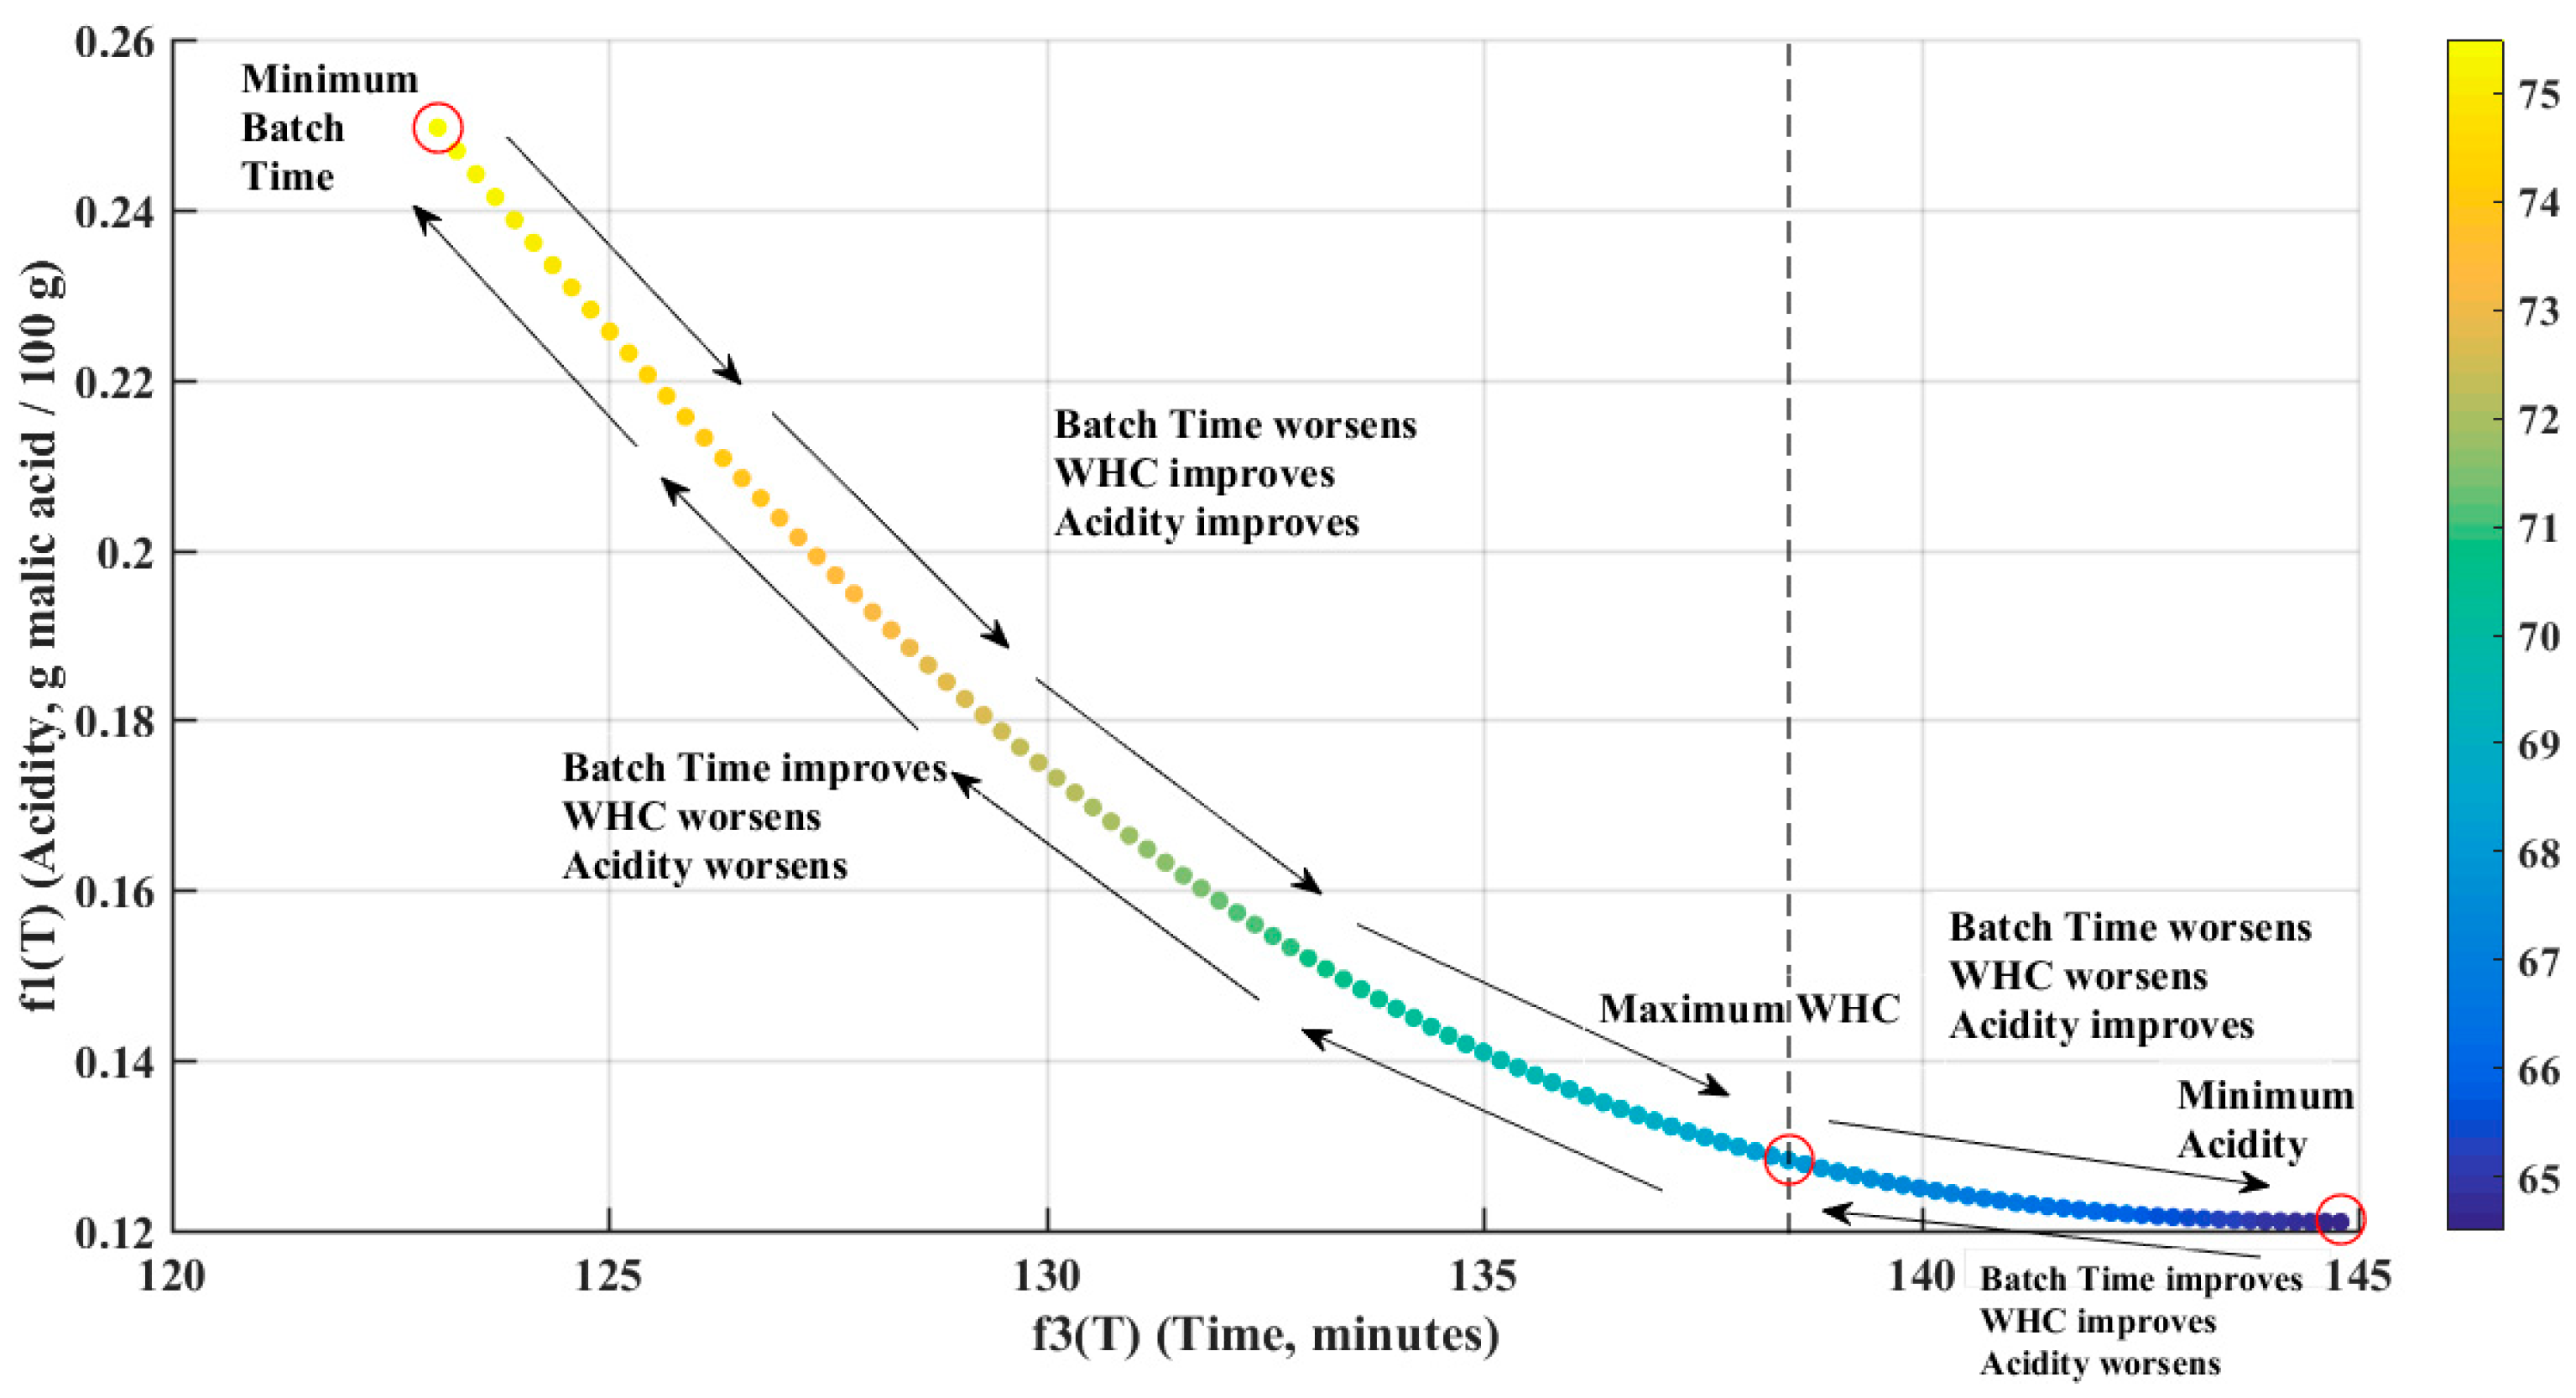
Figure 10 shows the X–Z plane for acidity and time, respectively, and temperature in the color scale. There, the evolution of every one of the indicators can be observed. All trade-offs are located along with the 64.5 to 75.5 °C interval. Increasing temperature will be to the detriment of acidity and OHC, but at the same time, batch time will improve and WHC will also improve, but only until the 68.2 °C value is reached. Beyond that point, only batch time will improve. Then, lowering the temperature will produce alternative effects.
Figure 11 shows the X–Y plane for time and WHC, respectively, and temperature in the color scale. There, the three utopia points can be seen encircled in red and the point of maximum WHC can be better appreciated.
It is worth mentioning that even though the pure adaptive search algorithm has, under certain conditions, a linear expected number of iterations, while the PRS algorithm has an exponential expected number of iterations [
44], the applied search strategy converged repeatedly with 10,000 iterations in about 25 min per run. This is mainly because the PRS algorithm is highly parallel (i.e., its iterations are independent) while the adaptive form is not and it is also due to the straightforward approach of the ANN model. Of course, one cannot always make use of these advantages and the simplest solution may not be the best one. Additionally, the before-mentioned running time also includes the uninform search method used to obtain Min {Φ
(T)} in every iteration. In more complex problems, this task can be given to a genetic algorithm (evolutionary multiobjective optimization, EMO). However, in this case, such a thing is unfeasible because we deal with a single input model, a condition that limits the crossover operator.
The numerical results of the random search process using the weighted distance aggregating function yielded a complete front for
p = 1. As expected, the same outcome is obtained with the weighted sum aggregating function, but these results only mean that there exists at least one weight vector that produces every temperature within the optimal front. Now, it remains to be seen if the weights can make sense to the DM.
Table 5 shows a simulated sweep along the weight’s space where the relative importance of each objective function is varied from 0.8 to 0.1. The resulting optimal temperatures for the weighted distance aggregating function range from 65.9 °C (
w1 = 0.8) to 75.5 °C (
w3 = 0.8) passing through 68.4 °C (
w2 = 0.8) in a very linear fashion; while with the weighted sum aggregating function the optimal temperatures are mostly 75.5 °C plus suboptimal temperatures also appear. No other temperatures can be obtained with these weight combinations. It is clear now that the DM cannot make a good decision based on the weighted sum aggregating function.
This can be explained using a graph of the plane
w1 +
w2 +
w3 = 1.
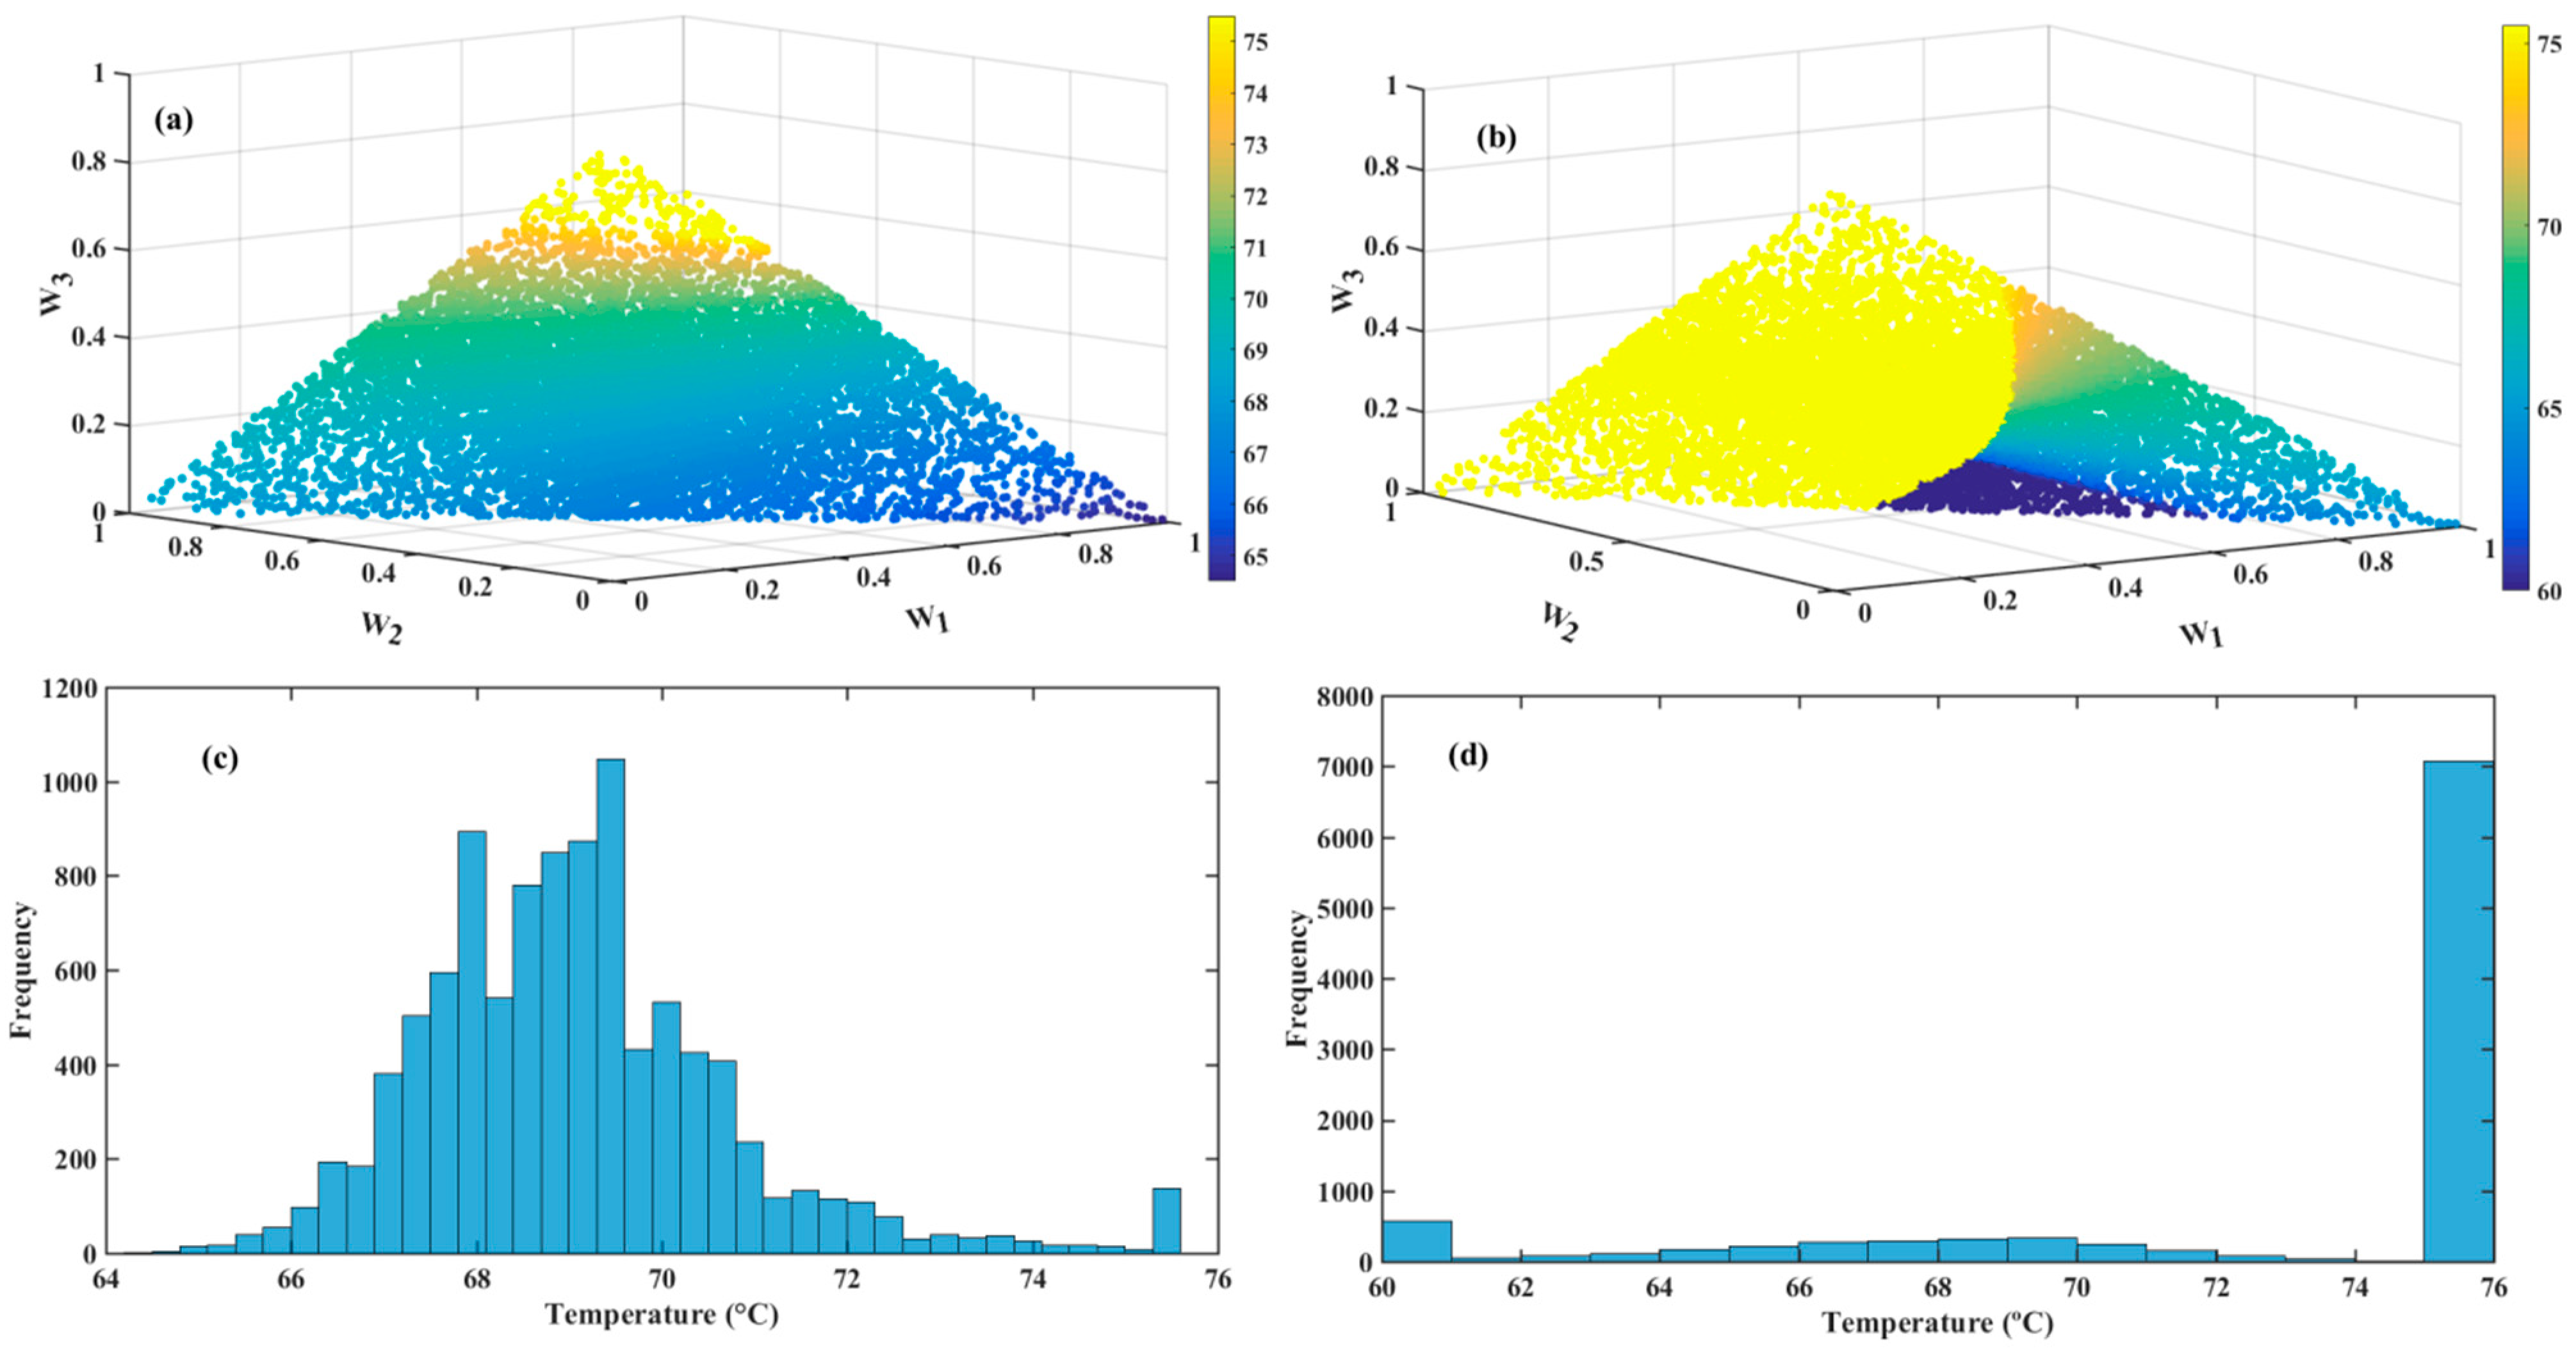
Figure 12a shows the weight plane for the weighted distance aggregating function with 10,000 different weight combinations and a color scale for each point that represents the optimal temperature for that particular weight combination. As it can be observed the optimal temperatures are well distributed along the plane and there is no marked preponderance of any optimal temperature(s). Contrarily,
Figure 12b shows the weight plane for the weighted sum aggregating function with the same number of points. It is remarkable to find in it a big preponderance of the 75.5 °C optimal temperature along the outstanding majority of the weight combinations. The rest of the optimal temperatures are distributed along a small portion of the weight plane. So, in large portions of the weight space very similar weight combinations can yield completely different optimal temperatures. A similar conclusion can be drawn when observing the histograms of the optimal temperature distribution of both methods (
Figure 12c,d). In the weighted sum method, weight vectors other than those that produce the 75.5 °C optimal temperature are very infrequent. On the other hand, the weighted distance method distributes the weight vectors along with a wider range of optimal temperatures, but weights that produce optimal temperatures from 66 to 72 °C (approximately) are more frequent. Nonetheless, it is enough to present meaningful scenarios to the DM.
3.4. Possible Scenarios for Making a Final Decision
Although the present work is not intended as a group decision analysis, in this section some examples or scenarios are presented where two stakeholders [
45] involved in the decision-making process apply different preference information (weights) to rate the importance of the same criteria (objective functions). In any industry or market, several stakeholders can be identified, but the paradigmatic example is the producer/consumer relationship, where the producer will surely favor lowering the batch time to maximize yield and, on the other hand, the consumer (internal or external) will surely favor maximizing the product quality factors. A final decision could be a middle ground between those two interested parties.
The weight’s relative value directly reflects the relative importance of each particular objective function within the optimization problem. Accordingly, in the first three scenarios, the consumer’s standpoint will be represented by setting the batch time indicator to have the lowest relative weight, specifically: w3 = 0.1. Then, for the first scenario, the DM will favor the indicators optimized at 64.5 °C (w1 = 0.7, w2 = 0.2, and w3 = 0.1); secondly, the DM will favor the indicators optimized around 68.2 °C (w1 = 0.2, w2 = 0.7, and w3 = 0.1); thirdly, the DM will consider that the indicators optimized at 64.5 °C and around 68.2 °C are equally important (w1 = 0.45, w2 = 0.45 and w3 = 0.1).
Lastly, in the fourth scenario, the producer could consider that given the fact that both acidity and pH indicators are within acceptable values in the 64.5 to 75.5 °C interval, the most important thing is to minimize batch time without setting a marked preference on the rest of the indicators (w1 = 0.2, w2 = 0.1, and w3 = 0.7).
Table 6 presents all results for every weight combination scenario set by the DMs, including the decision variable
T and the ANN predictions for each indicator corresponding to that temperature value. Those outcomes show that the most preferred alternative for the producer is to apply a 73.1 °C drying temperature. On the other hand, the consumer prefers lower drying temperatures, which range from 66.4 to 68.1 °C, depending on the relative weight.
Finally, if we assume that the third scenario best represents the consumer’s standpoint, then any temperature between 67.3 and 73.1 °C would be an acceptable compromise between the two parties since any temperature within that range is an efficient solution.
4. Conclusions
In the present work, the MOO of the watermelon rind nontraditional flour fabrication is presented. First, a data-based model of the watermelon rind drying and milling processes based on experimental data was developed. Such a model presented very good performance indicators with an average regression coefficient, R2, of 0.988.
Then, the data-based model (ANN) and a pure random search algorithm were used to find the Pareto-optimal front. Before that, the elimination of redundant objectives was necessary to reduce the complexity of the problem. The remaining objective functions were only three: acidity, WHC, and drying time.
Finally, four scenarios for making a final decision were analyzed based on the producer–consumer relationship. In conclusion, it was found that any temperature between 67.3 and 73.1 °C would be an acceptable compromise solution between the two decision-makers because any temperature within that range is an efficient one. Optimum indicators’ values ranged from 0.12–0.19 g malic acid/100 g dwb for acidity; 5.7–5.8 for pH; 8.93–9.08 g of H2O/g dwb for WHC; 1.46–1.56 g of oil/g dwb for OHC; and 128–139 min for drying time.
Future work includes the optimization of processes involving other wastes suitable for nontraditional flour fabrication, such as local microbrewery’s spent grains and pomegranate shells. A comparative study is also considered for a follow-up paper.


 ,
, 


