Article

Thermal Behavior of Estonian Graptolite–Argillite from Different Deposits

1
Department of Materials and Environmental Technology, Tallinn University of Technology, Ehitajate tee 5, 19086 Tallinn, Estonia
2
Department of Geology, Tallinn University of Technology, Ehitajate tee 5, 19086 Tallinn, Estonia
*
Author to whom correspondence should be addressed.
Processes 2022, 10(10), 1986; https://doi.org/10.3390/pr10101986
Submission received: 24 August 2022 / Revised: 20 September 2022 / Accepted: 24 September 2022 / Published: 1 October 2022
(This article belongs to the Section Materials Processes)

Abstract

:
Graptolite–argillites (black shales) are studied as potential source of different metals. In the processing technologies of graptolite–argillites, a preceding thermal treatment is often applied. In this study, the thermal behavior of Estonian graptolite–argillite (GA) samples from Toolse, Sillamäe and Pakri areas were studied using a Setaram Labsys Evo 1600 thermoanalyzer coupled with the Pfeiffer OmniStar Mass Spectrometer. The products of thermal treatment were studied by XRD, FTIR, and SEM analytical methods. The experiments were carried out under non-isothermal conditions of up to 1200 °C at different heating rates in the atmosphere containing 79% Ar and 21% O2. The differential isoconversional Friedman method was applied for calculating the kinetic parameters. All studied GA samples are characterized with high content of orthoclase (between 38.0 and 57.3%) and quartz (between 23.8 and 35.5%), and with lower content of muscovite, jarosite, pyrite, etc. The content of organic carbon in GA samples studied varied between 7.3 and 14.2%. The results indicated that, up to 200 °C, the emission of hygroscopic and physically bound water takes place. Between 200 °C and 500–550 °C, this is followed by thermo-oxidative decomposition of organic matter. The first step of thermo-oxidation of pyrite with the emission of water, carbon and sulphur dioxide, nitrogen oxides, and different hydrocarbon fragments indicated the complicated composition of organic matter. At higher temperatures, between 550 °C and 900 °C, the transformations continued by dehydroxylation processes in clay minerals, and the decomposition of jarosite and carbonates took place. At temperatures above 1000–1050 °C, a slow increase in the emission of sulphur dioxide followed, indicating the beginning of the second step of thermo-oxidative decomposition of pyrite, which was not completed for temperatures of up to 1000 °C. Kinetic calculations prove the complicated mechanism of thermal decomposition of GA samples: for Pakri GA samples, it occurs in two steps, and for Silllamäe and Toolse GA samples, it occurs in three steps. Preliminary tests for the estimation of the influence of pre-roasting of GA samples on the solubility of different elements contained in GA at the following leaching in sulphuric acid is based on Toolse GA sample.

1. Introduction

Graptolite–argillite (black shale) originally formed in the shallow sea areas of the Baltica paleocontinent and in the deeper part of oceans where the various sediments transported by rivers have been deposited. Over the hundred million years that followed, these sediments were partially moved inland by different tectonic and glacial forces.
Throughout the Earth’s history, especially during the Phanerozoic eon, the oceanic anoxic (reduced level of oxygen) and euxinic environments (increase in the content of sulphides, especially hydrogen sulphide) in the deeper layers of ocean have played crucial roles in the formation of GA [1,2,3,4,5,6,7]. The major forcing function behind oceanic anoxic events (OAE) was an abrupt rise in temperature caused by rapid increase in carbon dioxide content in the atmosphere caused by volcanogenic/methanogenic activity [8,9,10,11,12,13]. Rapid global warming accelerated weathering of land, and nutrient loading to the ocean triggered ocean eutrophication and global anoxia/euxinia. The Corg/P ratios of marine sediments are strongly influenced by benthic redox conditions. Oxygen depletion simultaneously enhances preservation of organic carbon and diffusive loss of re-mineralized organic phosphorus [7,14,15,16].
Graptolite–argillite (GA) is characterized by a low content of organic matter, usually on the level of 10–12% (often lower at 2–8%, and sometimes higher, up to 25%), and hence ineffective as fuel. On the other hand, GA contains a large variety of different chemical elements (Pb, Zn, Cd, Cu, As, Mo, V, S, U, etc.) including rare earth elements (REE: La, Ce, Nd, Pr, Sm, Gd, Dy, etc.) [1,2,17,18,19,20,21], which have extremely important roles in different high-technology areas. Usually, these elements are bound into the structure of organic matter and/or into the structure of different minerals contained in GA (muscovite, feldspar, etc.). For better extraction of these elements, a preceding thermal treatment of GA samples at 500–900 °C with or without different additives (NaCl, Na2CO3, etc.) is frequently proposed [22,23,24,25].
The Estonian graptolite–argillites, forming a part of the Baltoscandian graptolite–argillite deposition, were formed between the Middle Cambrian and Lower Ordovician. They are distributed in northern and north-western Estonia and belong to the Türisalu formation. The thickness of the GA layer reaches 7.4 m in NW Estonia and decreases towards the east and south. Estonian GA is characterized by high content of a number of trace elements, including U, V, Mo, and REEs [17,18,26,27]. Redox-sensitive metals such as U, Mo, and V tend to be enriched in anoxic–euxinic environments and exhibit loose covariance with organic matter content [18,28,29]. The total preserved amount of Estonian GA is calculated to be about ~60–70 billion tons, with an average content of organic carbon on the level of 9.3%: 95 g per ton of U, 235 g of Mo, 700 g of V, and 198 g of total REEs, offering great perspective into the sources of these elements [17,18,30,31].
In a limited number of works, the thermal behavior of graptolite–argillite (black shale) samples has been studied, but not systematically based on Estonian GA. For example, the thermal analysis technique coupled with mass-spectroscopy in vacuum was exploited for characterization of the nature of organic matter in paleozoic black shales from the Saxothuringikum deposit (Germany) [32]. The emission of volatile hydrocarbons was detected at up to 350 °C and emission of water, carbon oxide, and hydrocarbon fragments (m/z = 15) between 400–800 °C, resulting from the pyrolysis of kerogen. At temperatures above 1100 °C, the release of CO from the kerogen was fixed, and iron oxides were proposed to be the most probable source of oxygen for this reaction.
Different thermoanalytical techniques were exploited for studying the Polish Paleozoic rock samples from different deposits with low content of organic matter (between 0.6 and 5.08%) [33,34]. It was estimated that in neutral gaseous atmosphere, the pyrolysis of organic matter took place between 310 and 715 °C and most intensively between 471 and 544 °C. In oxidizing environments, the thermo-oxidation of organic matter took place between 300 and 600 °C and pyrite between 400 and 550 °C. In both cases, these processes are accompanied by dehydroxylation of clay minerals and muscovite and decomposition of carbonates contained in the studied rocks.
The aim of the present work was to study the thermo-oxidative decomposition of Estonian GA samples collected from different deposits and to determine the changes in the mineralogical composition during calcination up to 1200 °C.

2. Materials and Methods

2.1. Materials

The thermo-oxidative decomposition of four GA samples from Pakri, Sillamäe, and Toolse deposits were studied (Figure 1). Pakri I and Pakri II samples were collected from Pakerort Cliff on Pakri Peninsula from black shale at intervals of 0–20 cm and 100–120 cm above the basal boundary of the Türisalu Fm. Toolse sample was obtained from Toolse PH014B drill core from a depth of 19.69 to 21 m. GA from Sillamäe was collected from outcrops in the Sillamäe port area, and the bulk sample represented the whole GA cross-section. The mineralogical and chemical compositions of the samples are presented in Table 1 and Table 2, respectively.
In all the samples studied, two minerals prevailed: quartz and orthoclase. The content of quartz was the highest in Toolse GA (35.5%), while in the other samples, it varied around 24%. The content of orthoclase was much higher in Pakri samples (around 55–57%) compared to Sillamäe and Toolse samples, at 38.0% and 41.8%, respectively. All samples contained muscovite and pyrite, with the highest content in Toolse GA, at 9.1% and 9.9%, respectively. The lowest content of muscovite was seen in Sillamäe GA (3.8%), while for pyrite, Pakri GA II (5.7%). GAs from Pakri I and II deposits also contained jarosite, with 4.5% and 1.0%, respectively. In Toolse GA, the content of it is lower (0.4%), and in Sillamäe GA, it is missing. Sillamäe GA showed a high content of carbonates: 19.1% calcite and 6.9% dolomite. Toolse GA contained 1.8% dolomite, but in Pakri GA samples, the content of carbonates was not fixed. The content of chlorite, anatase, hematite, and sphalerite were also fixed in some of GA samples studied, but at much lower levels compared to the above-mentioned phases, at between 0.3–1.7% (Table 1).
The content of SiO2 prevailed in all studied GA samples: between 41–45% in Pakri and Sillamäe samples, and around 54% in the Toolse sample. The content of Fe2O3 varied from 5% to 9% and K2O from 6% to 8%, respectively (Table 2).
The content of organic carbon was slightly higher at 12.6% and 14.2%, respectively, in Pakri I and Pakri II samples, and lower in Sillamäe and Toolse samples at 7.3% and 9.3%, respectively. The content of inorganic carbon was 0.2–0.4% in Pakri and Toolse samples, and, in accordance with the higher content of carbonates, 2.2% in Sillamäe GA (Table 2).
The content of vanadium was quite high in all the studied samples, varying from 868 to 958 ppm. Sillamäe GA is characterized by the highest content of molybdenium, at 956 ppm, and uranium at, 254 ppm. The content of copper is the highest in Pakri GA I, at 110 ppm, and lead in Sillamäe GA, at 194 ppm (Table 2).
The gross calorific value of the samples varied from 3.25, for Sillamäe GA, up to 6.13 MJ kg−1, for Pakri GA II. This is in good correlation with the content of organic carbon in these samples (Table 2).
The samples were milled before experiments and the highest value of SSA was determined for Pakri GA II at 15.6 m2 g−1 and the lowest for Pakri GA I at 7.8 m2 g−1 (Table 2).

2.2. Methods

2.2.1. Material Characterization

XRD analysis was performed with a Bruker D8 Advanced Diffractometer (Bruker Corporation, Karlsruhe, Germany) using Fe-filtered Co radiation, collecting data in the range of 2θ from 10 to 60°. Quantitative mineral composition was determined by full-profile Rietveld analysis using the TOPAS software system [35,36]. FT-IR analysis was performed with a Bruker ALPHA 55/S/NIR FTIR ATR spectrometer (Bruker Corporation, Karlsruhe, Germany) in the wavenumber range of 400–4000 cm–1 as an average of 32 scans at a resolution of 4 cm−1.
The gross calorific value of samples was performed with a Cole-Parmer Oxygen Bomb Calorimeter (Cole-parmer Instrument Company LLC, Vernon Hills, IL, USA), the surface observations were carried out with a Jeol JMS-8404A scanning electron microscope (Joel Ltd., Tokyo, Japan), and BET SSA measurements with a Kelvin 1042 sorptometer (Costech International SRL., Pioltello, Italy).
Preliminary tests for estimation of the influence of pre-roasting of GA samples on the solubility of different elements in sulphuric acid were carried out with Toolse GA. Pre-roasting was performed in a muffle furnace with a heating rate of 10 °C min−1 up to 550 °C, 700 °C, and 900 °C, followed by storing at this temperature for one hour and quick cooldown to room temperature in an exicator. The leaching of initial as well as roasted samples was performed in 10% solution of sulphuric acid in conical flasks with magnetic stirrer at 90 °C for 3 h. The mass of samples was 750 mg in 100 mL liquid. After filtration, the solutions were analyzed for the content of potassium (calculated as K2O), iron (Fe2O3), cuprum (Cu), lead (Pb), vanadium (V), molybdenum (Mo), and uranium (U) using the Agilent 4210 MP-AES equipment (Agilent Technologies, Inc., Santa Clara, CA, USA). Leaching efficiency were calculated considering the content of these elements in the initial GA sample.

2.2.2. Thermal and Kinetic Analysis

The TG-DTA-MS system consisted of a Setaram Labsys Evo 1600 thermoanalyzer (Setaram Instrumentation, Caluire, France) coupled with the Pfeiffer OmniStar Mass Spectrometer (Pfeiffer Vacuum Technology AG, Asslar, Germany) by a heated transfer line. The experiments were carried out under non-isothermal conditions up to 1200 °C at the heating rates of 1.25, 2.5, 5, and 10 °C min−1 in atmosphere containing 79% Ar and 21% O2. Standard 100 μL alumina crucibles were used, the mass of the samples was 15 ± 0.5 mg, and the gas flow was 60 mL min−1. For reproducibility, all experiments were performed twice at minimum. Prior to the experiments, the equipment was calibrated for temperature readings with calcium oxalate monohydrate.
The differential isoconversional Friedman method [37] was applied for calculating the kinetic parameters. After baseline correction and normalization of the TG signals obtained at different heating rates, the data were processed with the AKTS Advanced Thermokinetics software (AKTS AG TECHNOArk, Siders, Switzerland) [38].

3. Results and Discussion

3.1. Thermal and MS Analysis

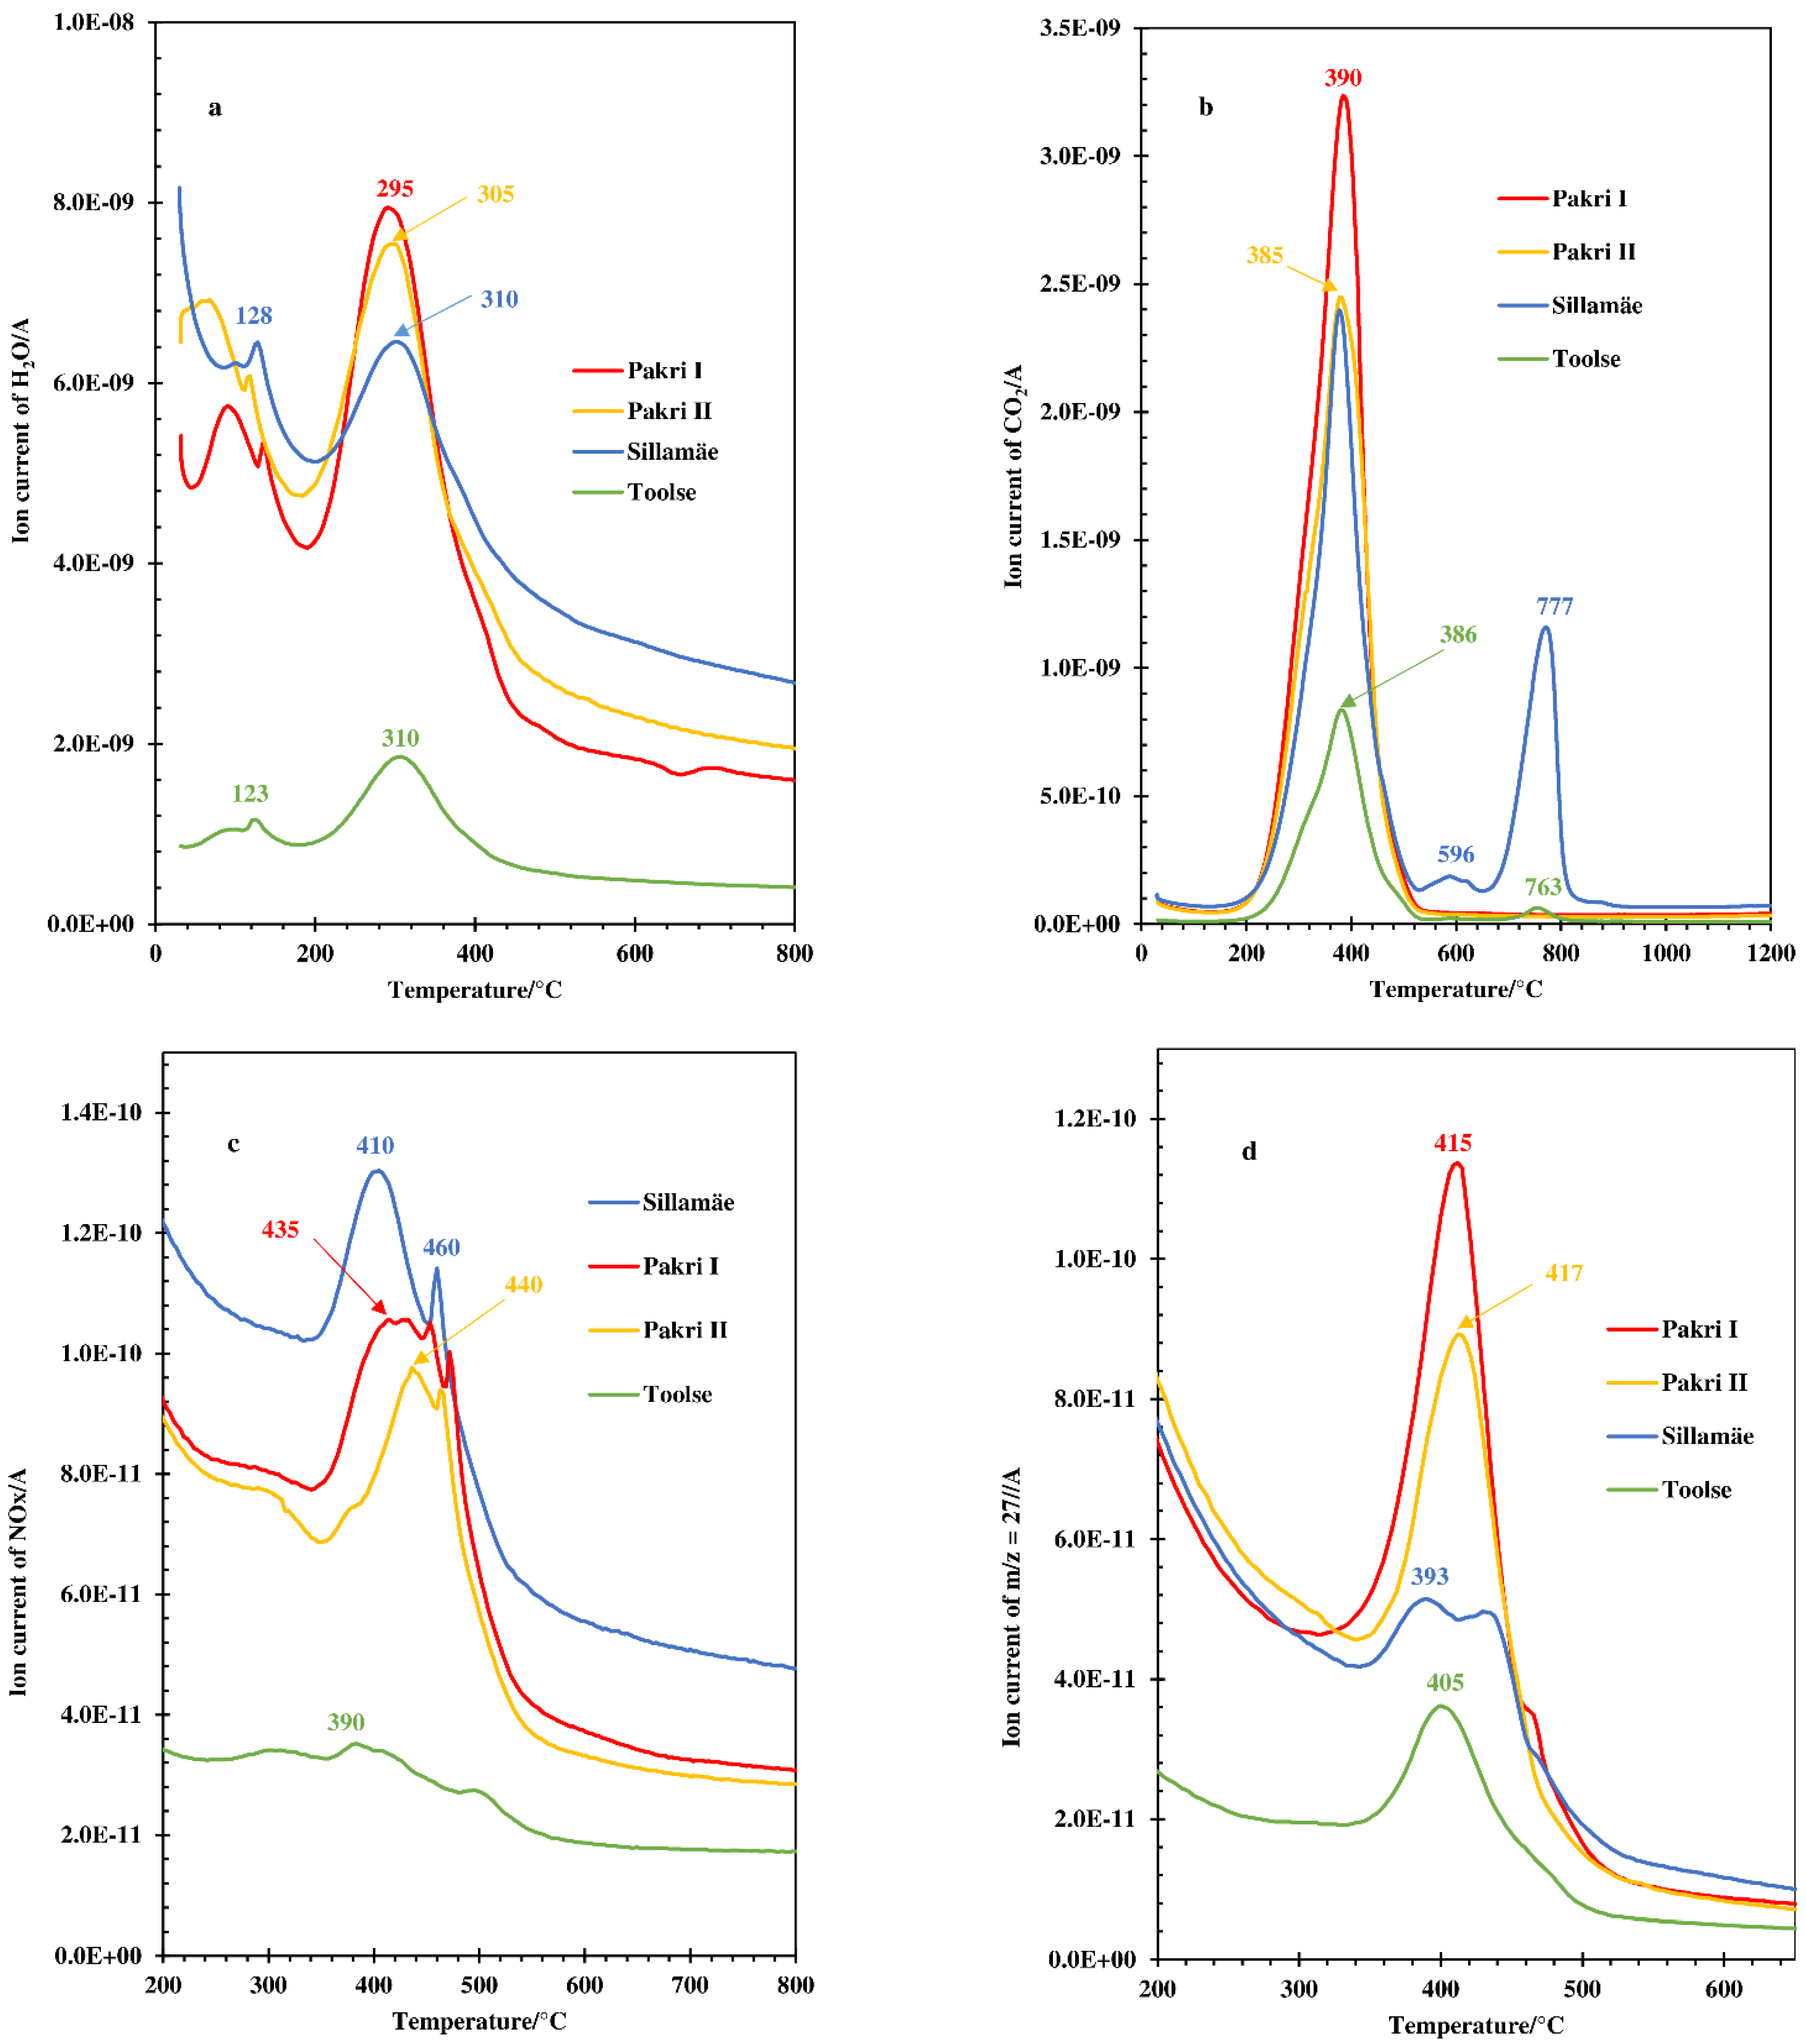
The results of thermal analysis and mass spectroscopy (MS) of the evolved gaseous compounds are presented in Figure 2 and Figure 3. The mass loss of samples up to 200 °C is mostly caused by the emission of hygroscopic and physically bound water with the corresponding peak minimums in DTG curves between 80–120 °C (Figure 2) and maximums in water emission profiles at different temperatures: 85 °C, 123 °C, etc. (Figure 3a).
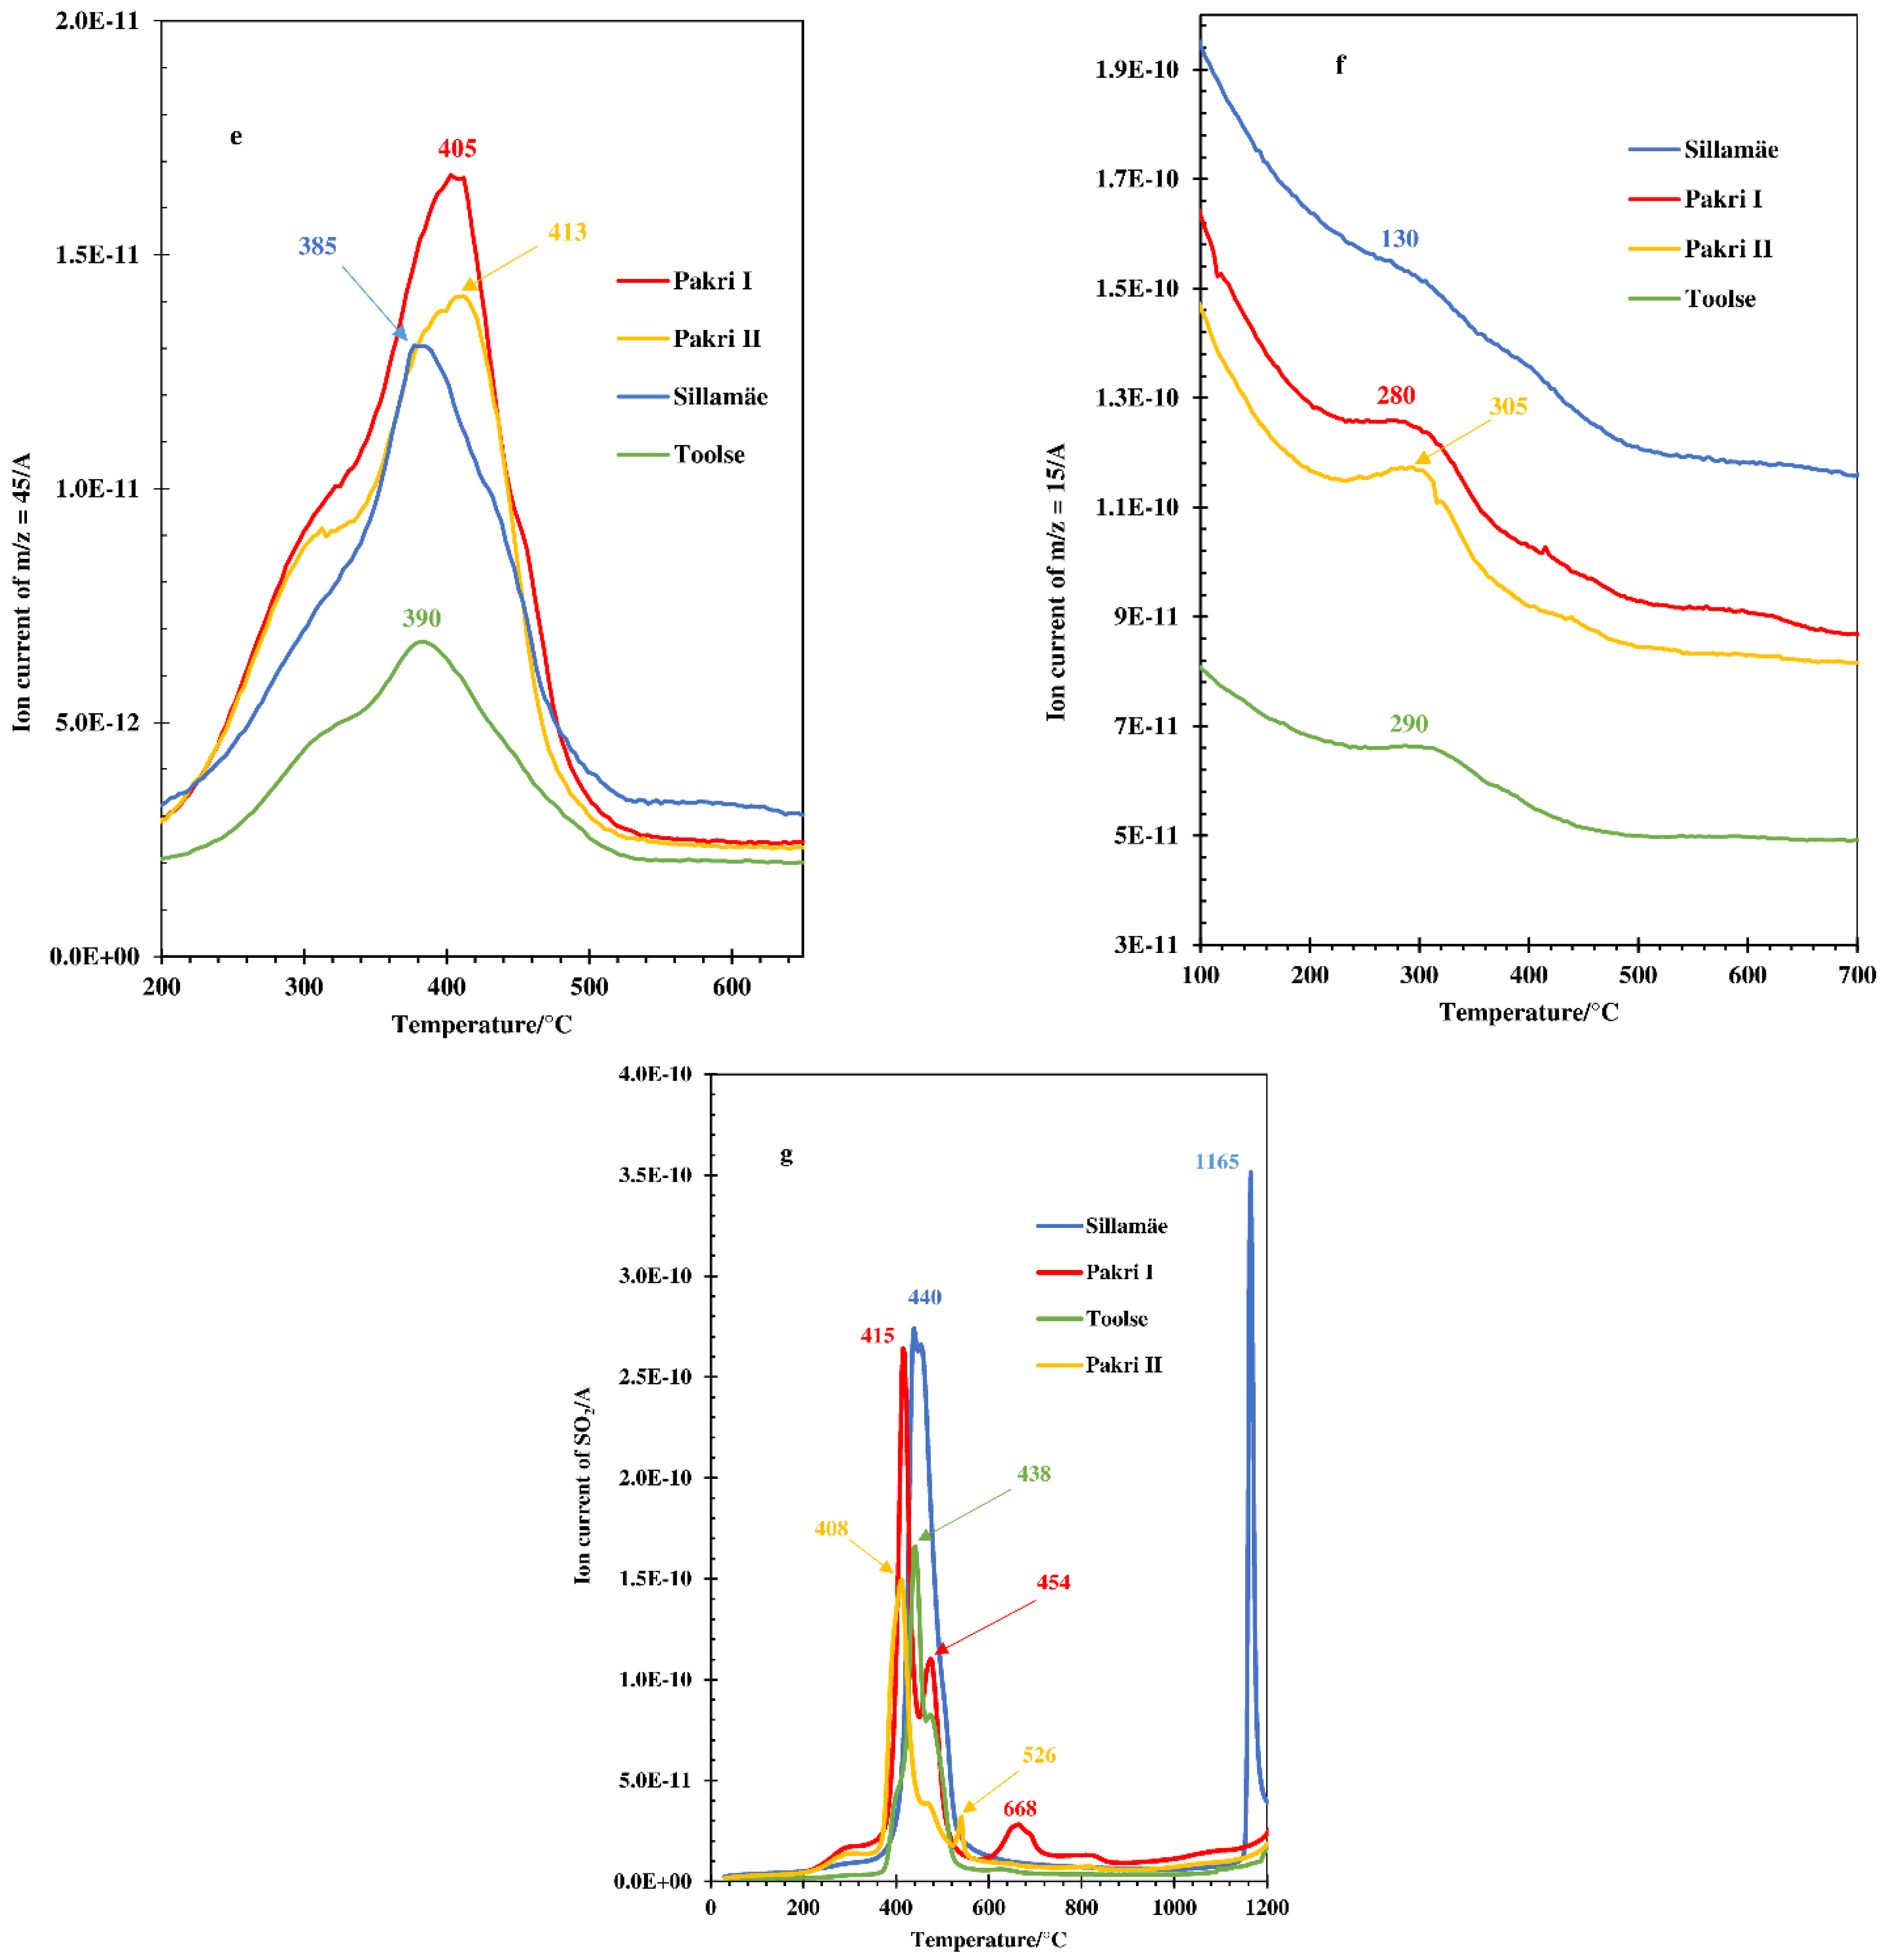
The mass loss between 200 °C and 500–550 °C with intensive multistep exotherms with maximums at 386 °C, 389 °C, 398 °C, and 401 °C in DTA curves (Figure 2), with the corresponding maximums in the water (Figure 3a), carbon dioxide (Figure 3b), and nitrogen oxides (NOx, m/z = 30) (Figure 3c) emission profiles, characterize the thermo-oxidative decomposition of organic matter contained in the samples studied. In addition, the thermo-oxidation of organic matter was accompanied by the formation and emission of different hydrocarbon fragments like m/z = 27 (probably HCN, Figure 3d), m/z = 45 (probably -COOH group, Figure 3e), and m/z = 15 (probably methane, Figure 3f), indicating the complicated character of organic matter and incomplete oxidation of it during thermal treatment. The emission of sulphur dioxide at the same temperature interval partly originates from the organic matter—starting at 200–220 °C with maximums in the SO2 emission profiles around 408–440 °C—and partly as a result of the first step of thermo-oxidative decomposition of pyrite with maximums around 454–526 °C (Figure 3g). At temperatures between 400 °C and 700–800 °C, dehydroxylation processes of phyllosilicates (muscovite and chlorite) also take place [39,40,41].
At higher temperatures, clear maximums at 596 °C and 777 °C can be seen in the carbon dioxide profile of Sillamäe GA, but in the Toolse GA profile, the peak is much more modest at 763 °C (Figure 3b). The corresponding endotherms in DTA curves can also be fixed. The maximum at lower temperature corresponds to the decomposition of dolomite and those at higher temperatures to the decomposition of calcite (Table 1). In the sulphur dioxide emission profile of Pakri GA I, a maximum at 668 °C is fixed (Figure 3g), belonging to the decomposition of jarosite [42]. The content of it in Pakri GA I is 4.5%. For Pakri GA II and Toolse GA, the maximums in the sulphur dioxide emission profile are much weaker because the content of jarosite in Pakri GA II and Toolse GA is only 1.0% and 0.4%, respectively (Table 1).
At temperatures above 1000–1050 °C, a slow increase in the emission profiles of sulphur dioxide can be seen for all the studied GA samples, caused by the second step of decomposition of pyrite, which is not completed until passing temperatures of 1000 °C (Figure 3g) [43,44]. The sharp peak with a maximum at 1165 °C in the sulphur dioxide emission profile of Sillamäe GA, with the corresponding endotherm minimum in DTA curve (Figure 2), is caused by the decomposition of secondary anhydrite formed at lower temperatures due to the binding of sulphur dioxide (emitted at thermooxidation of organic matter and pyrite) by dolomite and calcite contained in Sillamäe GA (Table 1).
Heating up to 1200 °C, the total mass loss for Toolse, Pakri II, Sillamäe, and Pakri I GA samples was 19.1%, 26.7%, 27.0%, and 29.4%, respectively (Figure 2).

3.2. FT-IR, XRD and Morphology Analysis

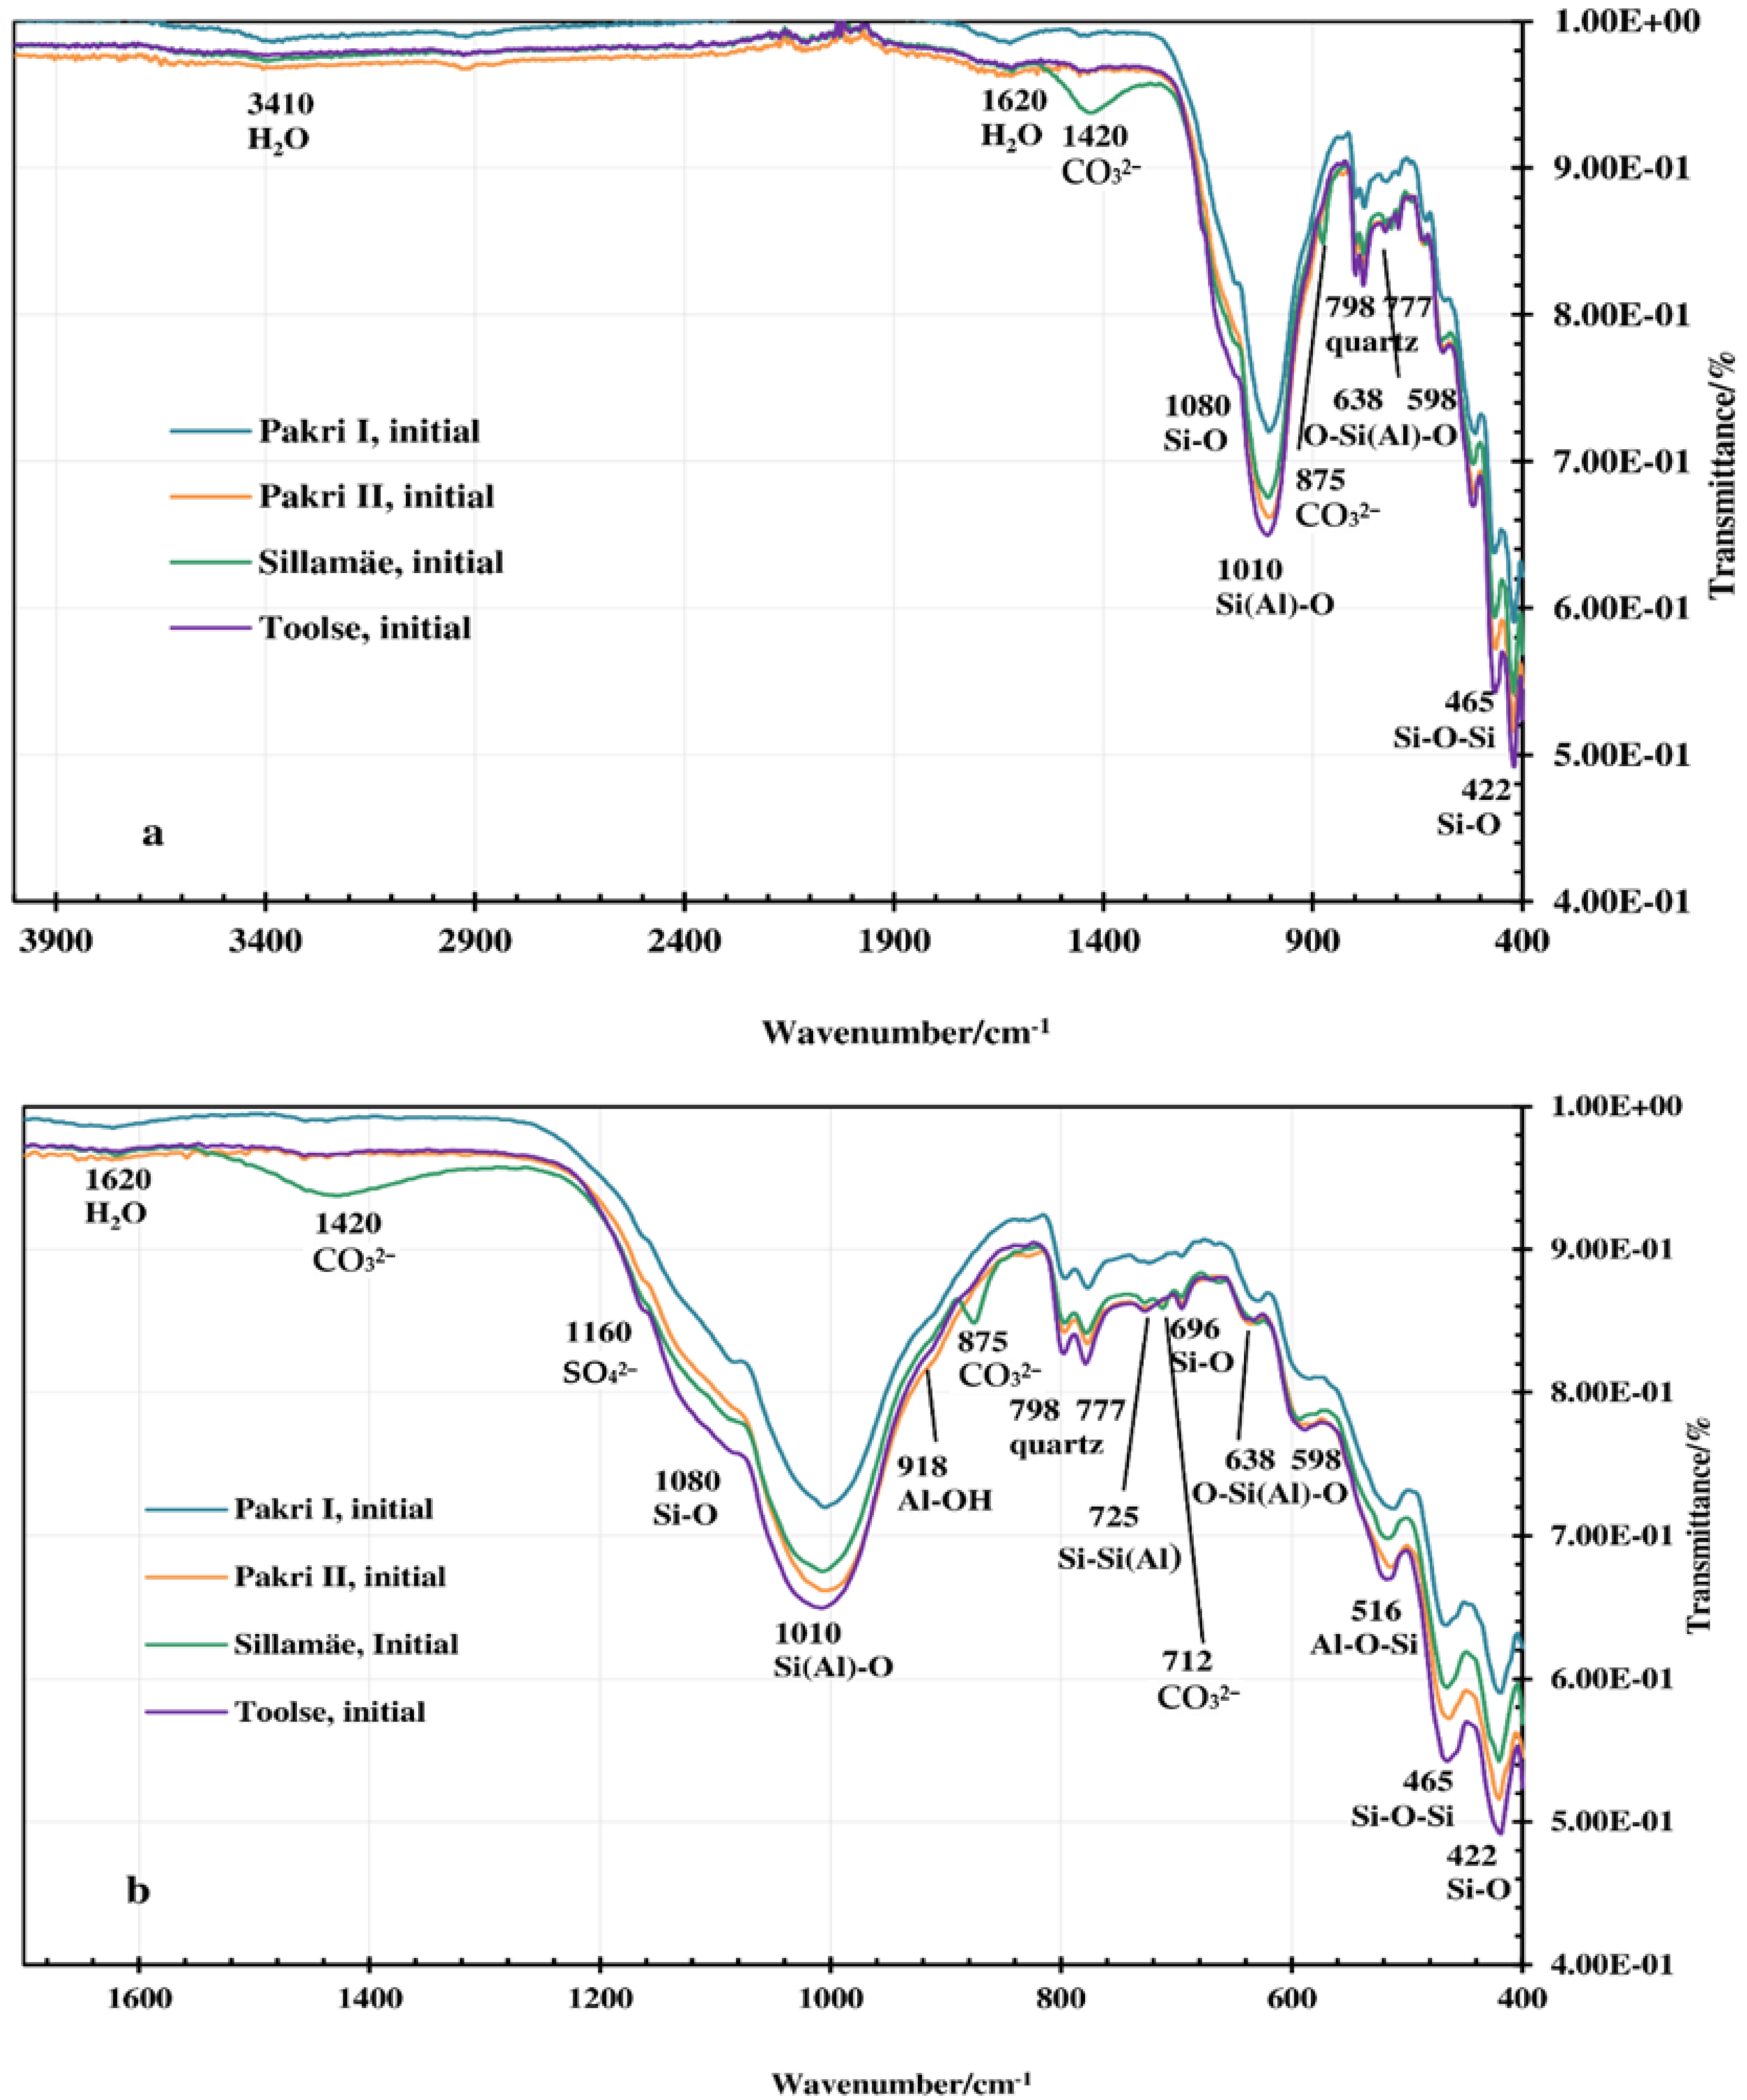
For characterization of the influence of the treating temperature on the mineralogical composition of GA samples studied, the FT-IR spectroscopic and XRD methods were applied. Certain differences in FT-IR spectra of different GA samples can be followed depending on the mineralogical composition of the samples (Figure 4a,b). The band at around 3410 cm−1 is characteristic of OH stretching, and 1620 cm−1 is characteristic of the OH bending vibration of structural hydroxyl groups, in clay minerals and absorbed water, respectively [45,46,47]. The asymmetric stretching vibration band at 1420 cm−1, the out-of-plane bending vibration band at 875 cm−1, and the in-plane bending vibration band at 712 cm−1 are characteristic of the CO32− ion [48,49], indicating the content of carbonates in GA samples, being especially intense for Sillamäe GA. In addition, in the FT-IR spectra of the studied GA samples, different absorption bands characteristic to different vibrations in the silicate and alumosilicate groups were followed. For example, Si-O stretching vibration bands at 1080 cm−1 and 696 cm−1, a deformation band at 422 cm−1 [45,50,51], and Si(Al)-O and Si-Si(Al) stretching vibration bands at 1010 cm−1 and 725 cm−1, respectively [52,53,54]. The following bands were also fixed: Al-OH bending vibration band at 918 cm−1 [50,53]; bands characteristic to the O-Si(Al)-O bending vibration at 638 cm−1 and 598 cm−1 [52]; bands characteristic to the deformation vibration of Al-O-Si and Si-O-Si group at 516 cm−1 and 465 cm−1 [47,55], respectively. A double band at 798 cm−1 and 777 cm−1 is characteristic of quartz. Also, the absorption band at 1160 cm−1, characteristic of the stretching vibration of the SO42– group [52,56] in anhydrite, was fixed, which was not seen by XRD analysis. On the contrary, the bands characteristic to vibrations of SO42– group in jarosite (1100 cm−1, 665 cm−1, 628 cm−1) [57] were not fixed in FT-IR spectra, but jarosite was determined by XRD analysis. Its content in Pakri GA I was quite high—4.5%—and was much lower in Pakri GA II and Toolse GA. In Sillamäe GA, jarosite was not present (Table 1).
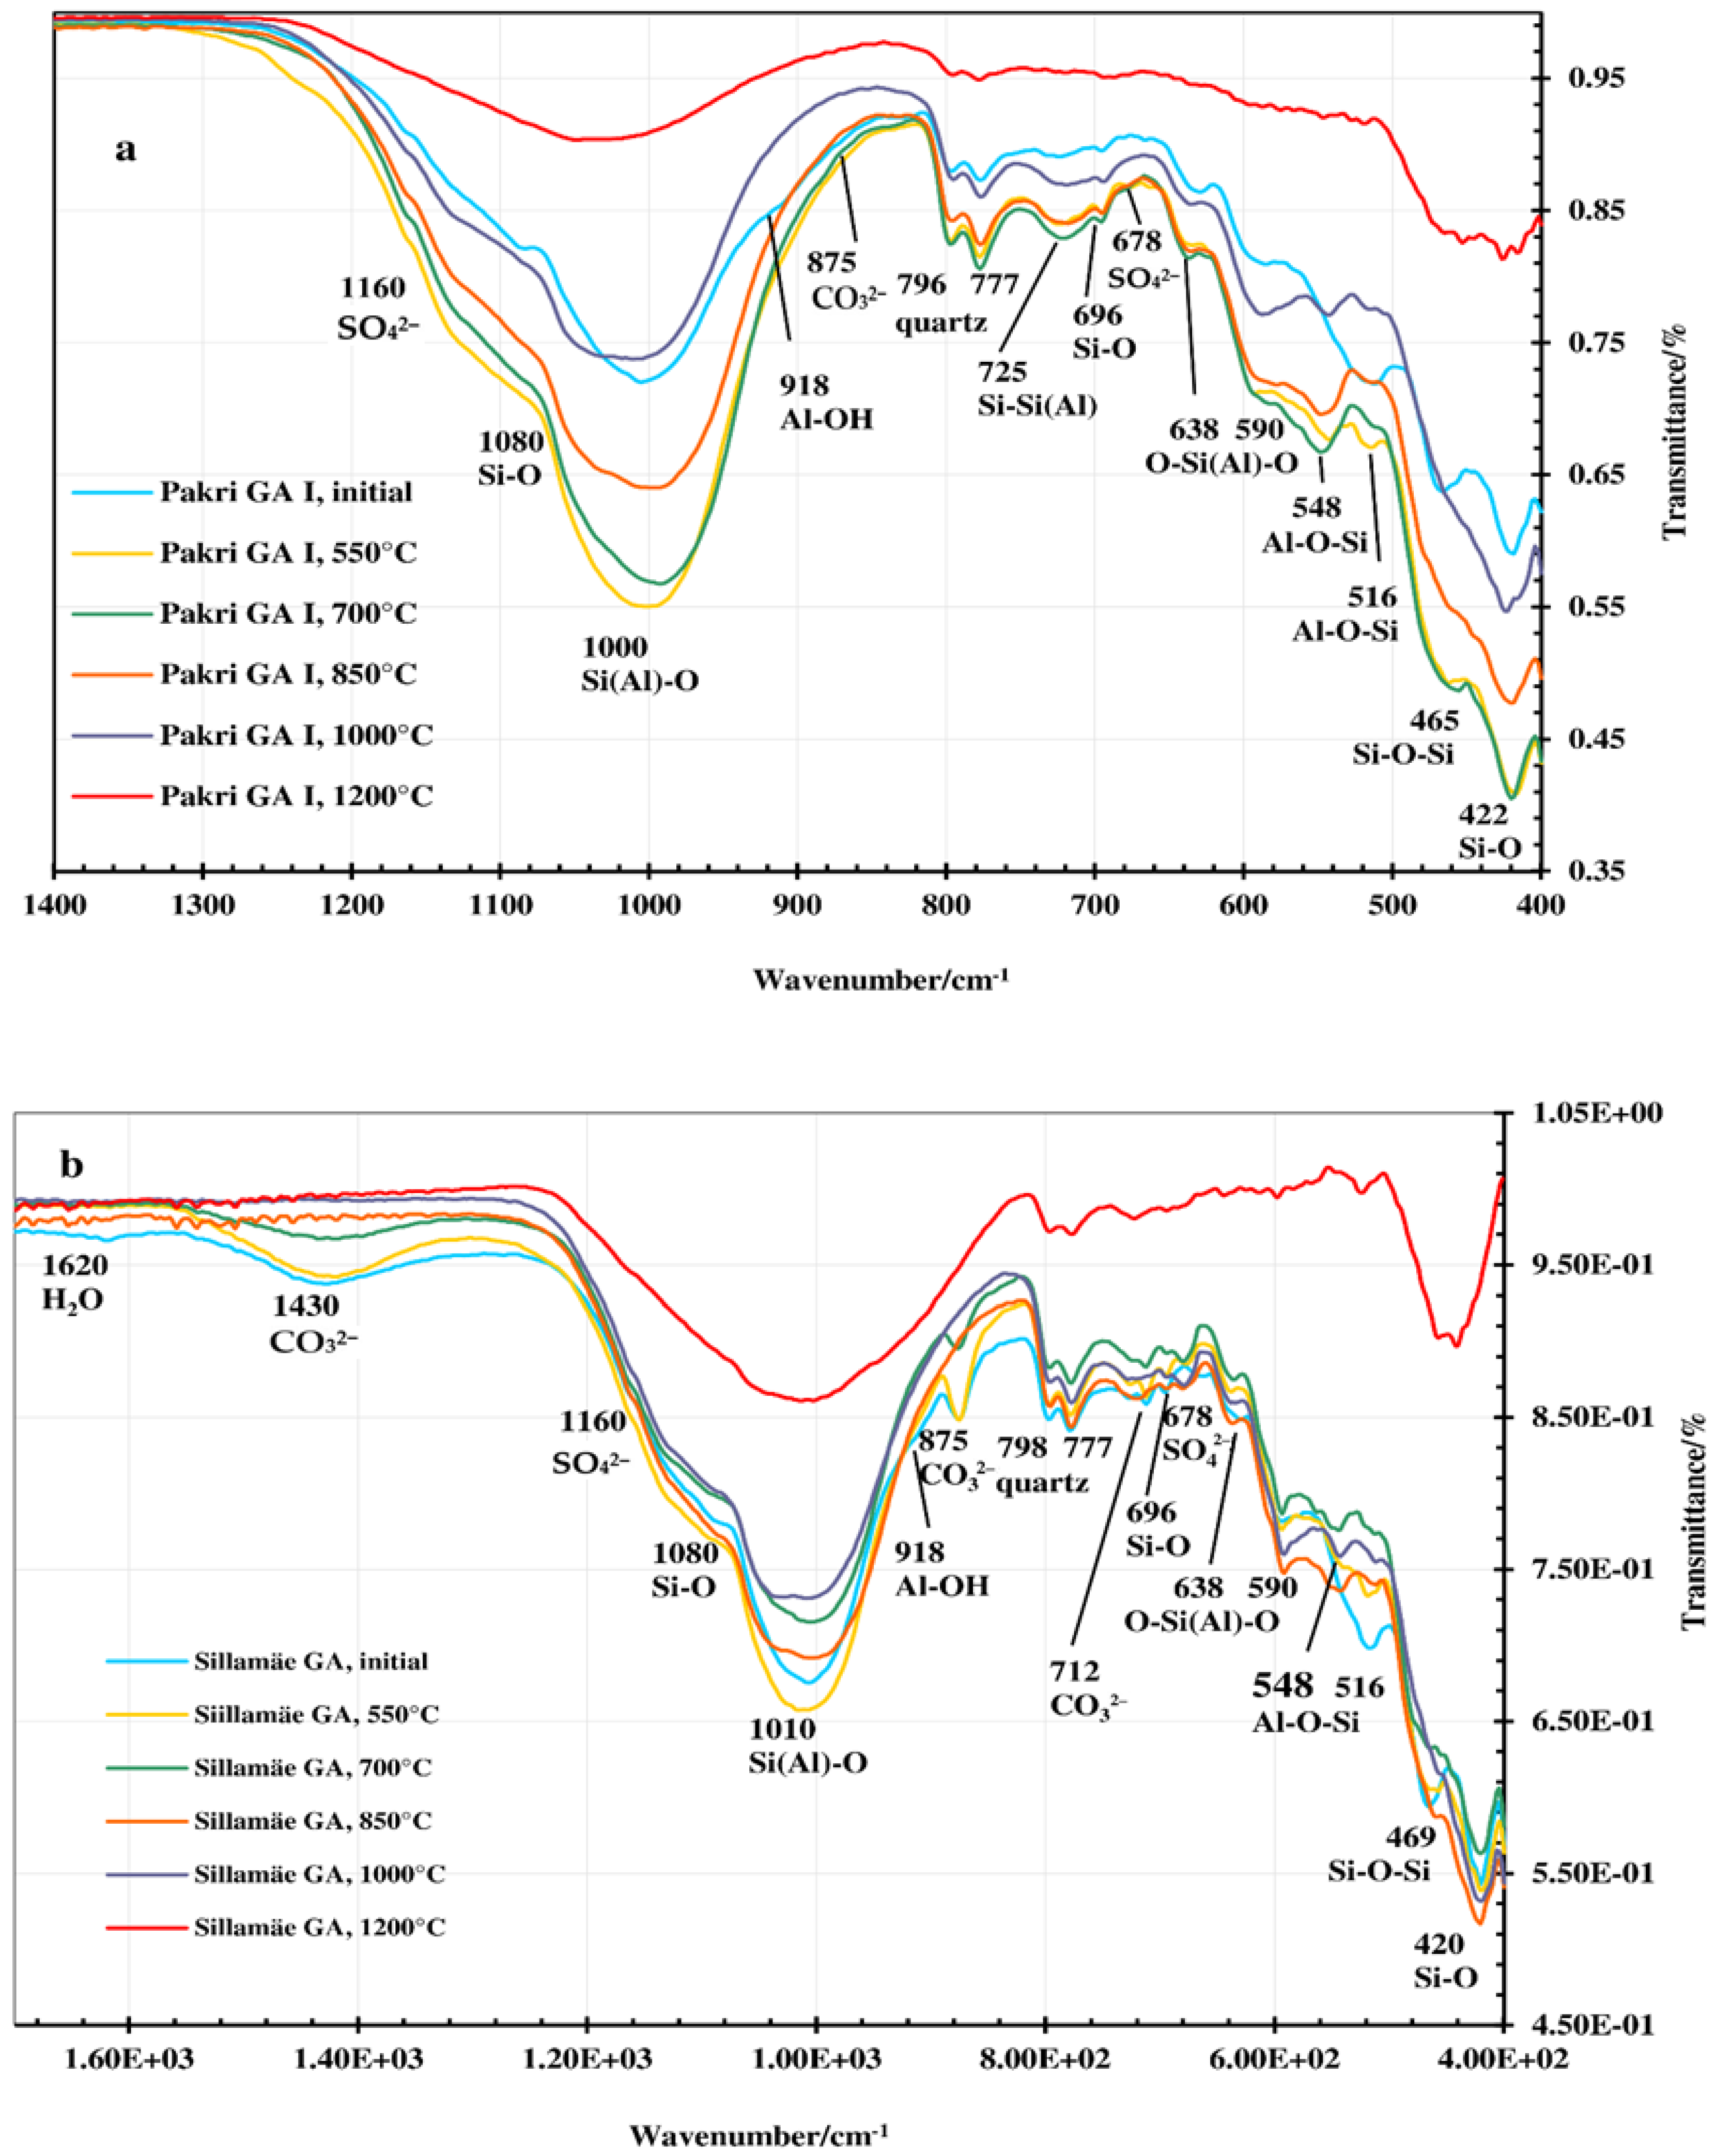
In the FT-IR spectra of the samples heated up to 550 °C (Figure 5a,b) absorption bands at 3410 cm−1, 1620 cm−1, and 918 cm−1, characterizing the vibration of the structural hydroxyl group in clay minerals, hydroxyl groups in water, and Al-OH bending vibrations, respectively, disappeared. At 1160 cm−1 and 678 cm−1, there are visible bands in spectra for all the studied samples corresponding to stretching vibration of the SO42− group [52,56].
The results of XRD analysis also indicated the formation of anhydrite and Mg- and Fe-sulphates in the samples heated up to 550 °C caused by reactions of sulphur dioxide formed at thermooxidation of organic matter and pyrite with carbonates and chlorite. The content of Mg- and Fe-sulphides decreased remarkably in the samples heated up to 700 °C, and they disappeared at 850 °C (Figure 6). Jarosite was not fixed in diffractograms of the samples heated at 550 °C, probably caused by changes in crystal structure of jarosite being at this temperature in X-ray-amorphous form. In fact, the decomposition of jarosite between 600–700 °C is well-fixed in thermograms (Figure 2) with the corresponding SO2 emission into gaseous phase (Figure 3g).
The absorption bands characteristic to vibrations of the CO32− ion can be followed up to 700 °C, and they disappeared at 850 °C due to decomposition of dolomite and calcite in the temperature interval of 550–850 °C (Figure 2 and Figure 5). The content of dolomite and calcite was not fixed in diffractograms for the initial samples of Pakri GA, but it was fixed in samples thermally treated at 550 °C, with some decrease in content at 700 °C (Figure 6). The reason is that the content of these minerals in initial samples is too low for determination using XRD method, but it increases due to the mass loss of samples upon heating to 550 °C/700 °C.
At 700–850 °C, the intensities of many absorption bands characterizing vibrations in silicate and alumosilicate groups such as those at around 465 cm1(Si-O-Si), 516 cm−1 (Al-O-Si), and 1010 cm−1 (Si(Al)-O), etc. start to weaken due to rearrangements in crystal structures, and some of these bands disappeared in FTIR spectra upon heating the samples up to 1200 °C, indicating changes in crystal structure (amorphization) at higher temperatures.
The content of quartz, orthoclase, and hematite increased in thermally treated samples due to the mass loss of samples caused by thermo-oxidation of organic matter and pyrite, dehydroxylation of clay minerals, decomposition of carbonates and secondary formed minerals like Mg- and Fe-sulphides, and also—partially—anhydrite (Figure 6). Partially, the increase in the content of orthoclase at higher temperatures could also be caused by the decomposition of muscovite with the formation of orthoclase and γ-Al2O3 [58].
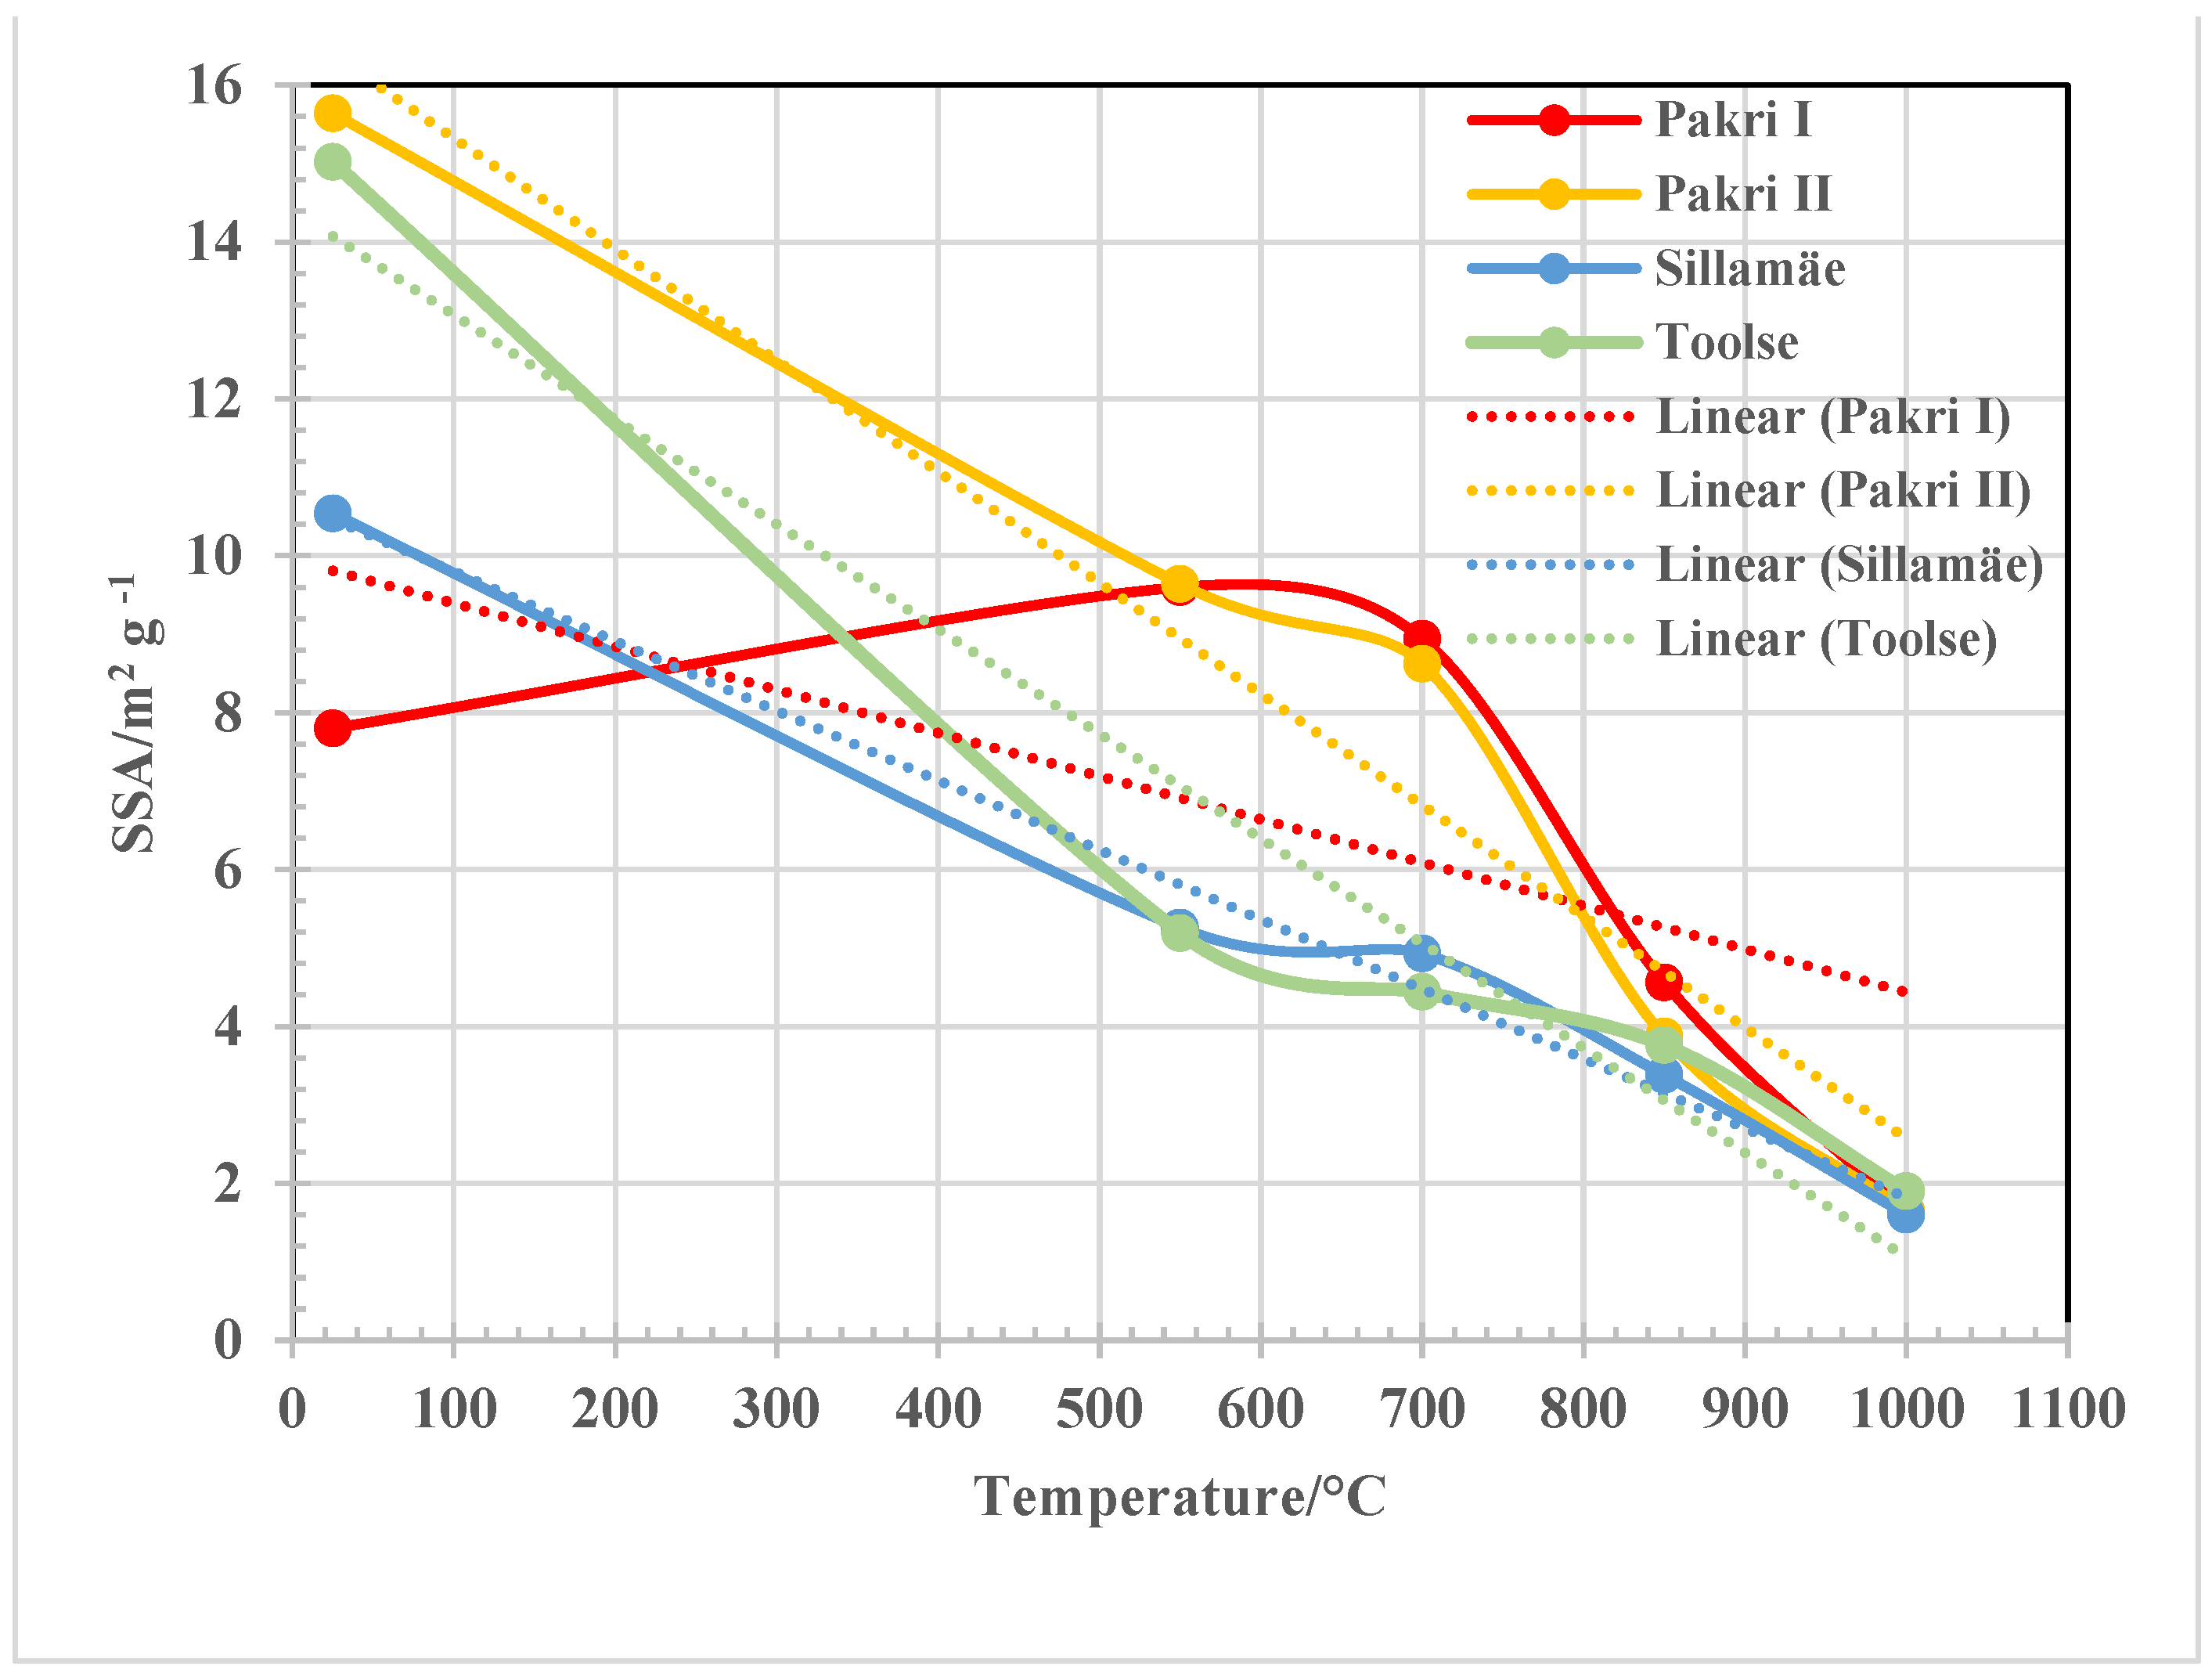
In SEM photos of the initial samples, particles with irregular shape are easily seen: for example, for Pakri GA I, with particle size ≤ 5–6 μm (Figure 7a), and for Sillamäe GA, with particle size ≤ 10–12 μm (Figure 7e). The first melting footprints on the particle surfaces can be followed already at 550 °C for Pakri (Figure 7b) as well as for Sillamäe GA (Figure 7f), with intensive increase upon increasing the treating temperature of the samples up to 850 °C (Figure 7c,g). At 1000 °C, the particle surfaces are almost completely covered with glassy phase (Figure 7d,h). The decrease in SSA values upon increasing the treatment temperature can be correspondingly followed for all the studied samples in Figure 8.

3.3. Solubility Test in Sulpuric Acid

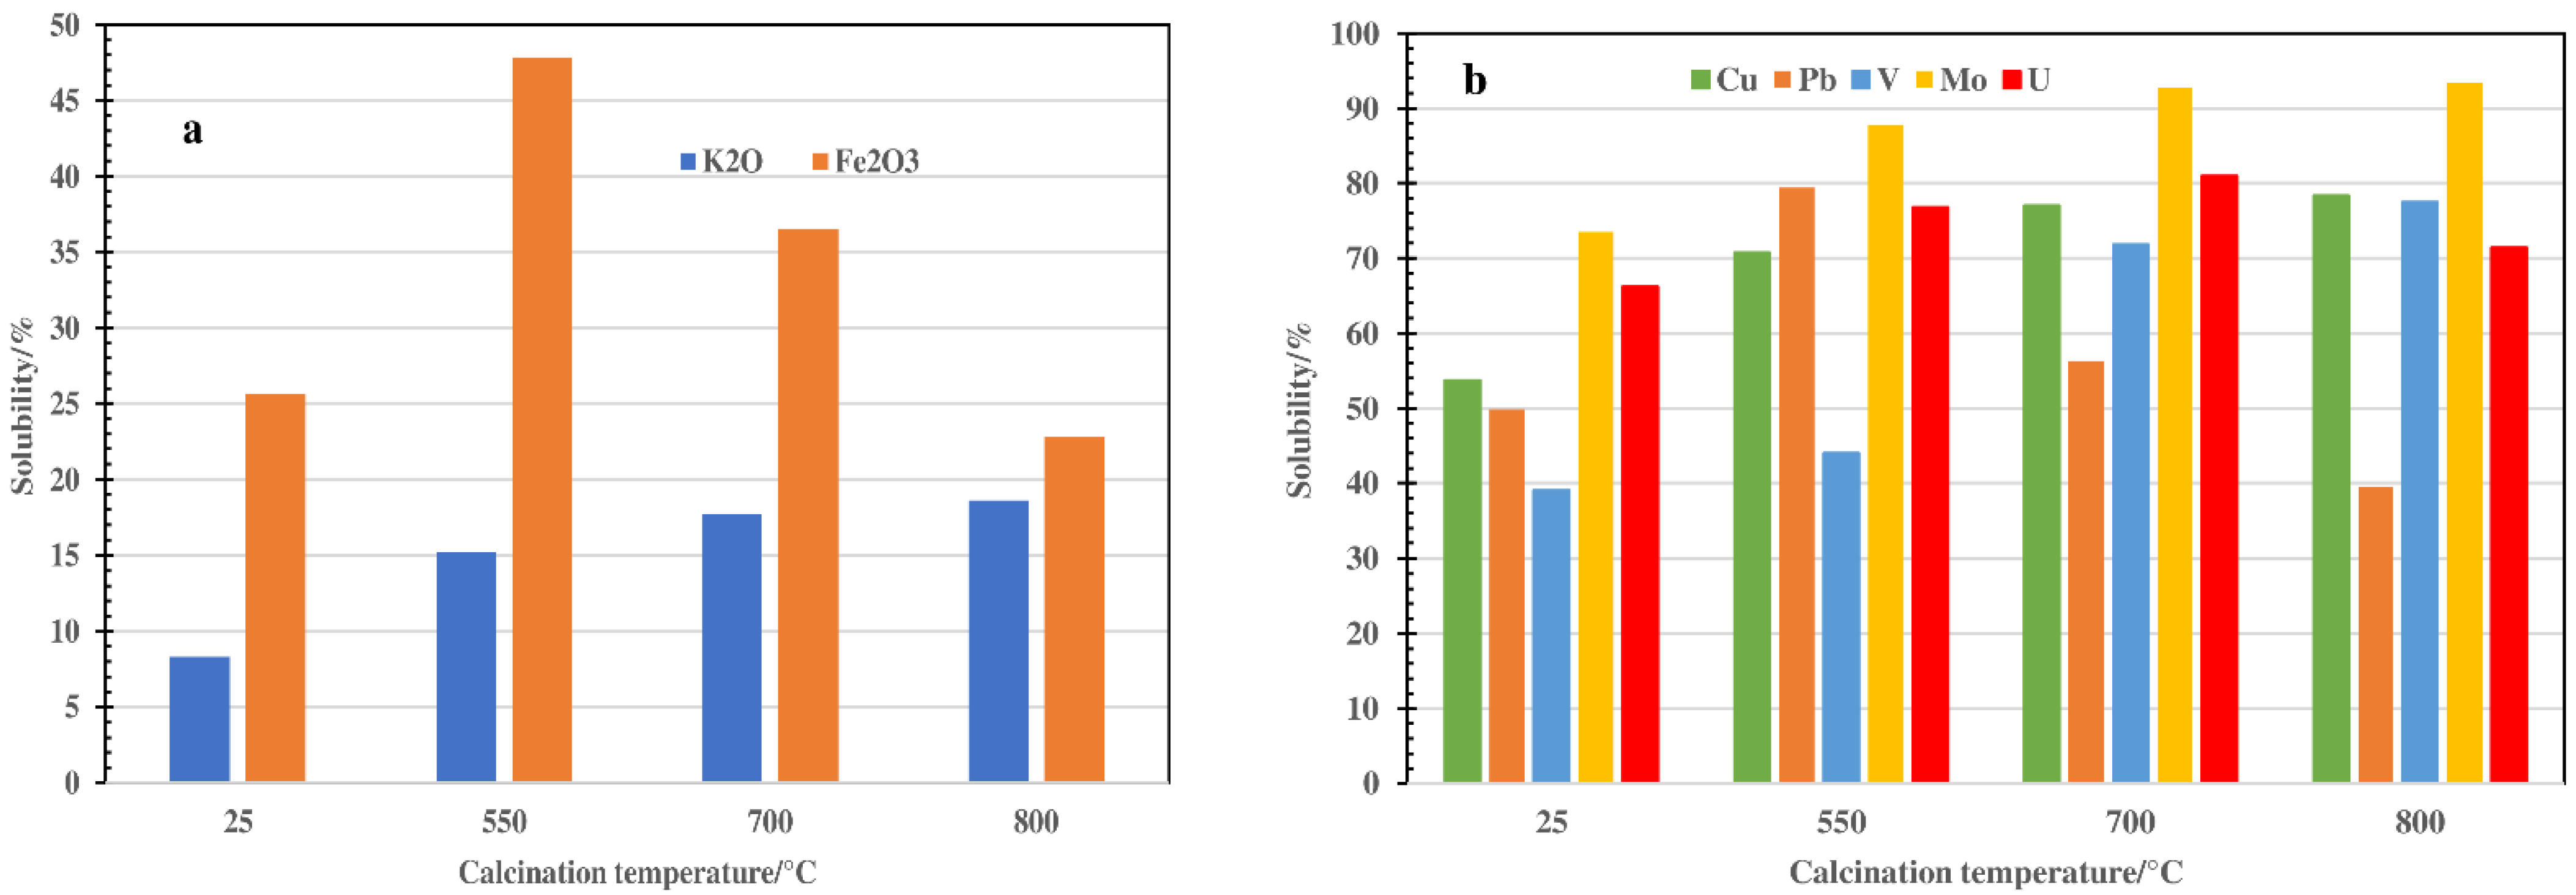
Preliminary tests for estimating the influence of pre-roasting of GA samples on the solubility of different elements contained in GA were based on the Toolse GA sample. Step-by-step increase in the solubility of potassium from 8.3% for the initial sample to 18.6% for the sample thermally treated at 800 °C was noticed. The solubility of iron increased from 25.6% for initial samples up to 47.8% for those treated at 550 °C, and then decreased to 36.5% and 22.8%, respectively, for 700 °C and 800 °C treatment, indicating better solubility of pyrite in sulphuric acid solution than hematite formed at higher temperatures (Figure 9a). Permanent increase in the solubility of Cu, V, Mo, and U can also be seen up to 700 °C: from 53.7% to 77.0%, from 39.0% to 71.8%, from 73.5% to 93.4%, and from 66.2% to 81.0%, respectively. Increasing the treatment temperature up to 800 °C resulted in a small additional increase in the solubility of Cu to 78.3% and of Mo to 93.4% and in a small decrease in the solubility of V to 69.5% and, even more noticeably, of U to 71.4%.
For Pb the solubility increased from 49.8% for the initial sample to 79.4% for the sample treated at 500 °C. At higher temperatures the solubility of Pb starts to decrease being at 700 °C 56.3% and at 800 °C only 39.5% (Figure 9b).
Therefore, the preliminary tests indicated mostly positive influence of pre-roasting of GA on the solubility of different elements at leaching of GA samples in acidic environment.

3.4. Kinetic Calculations

The differential isoconversional Friedman method was applied for calculating kinetic parameters obtained under non-isothermal conditions. The equation describing the isoconversional approach derived from the Friedman differential method can be expressed by the following equation:
ln(dα/dt) = ln[A(α)f(α)] − E(α)/RT
where
α—degree of conversion
Apre-exponential factor, characterizing the frequency of effective collisions
Eactivation energy, kJ/mol
Rgas constant (R = 8.314 × 10⁻³ kJ/mol·K)
Ttemperature, K
The function dependent on the reaction model f(α) becomes a constant at each fixed conversion degree α, and the relationship between the logarithm of the reaction rate /dt and 1/T is linear with the slope of E(α)/R.
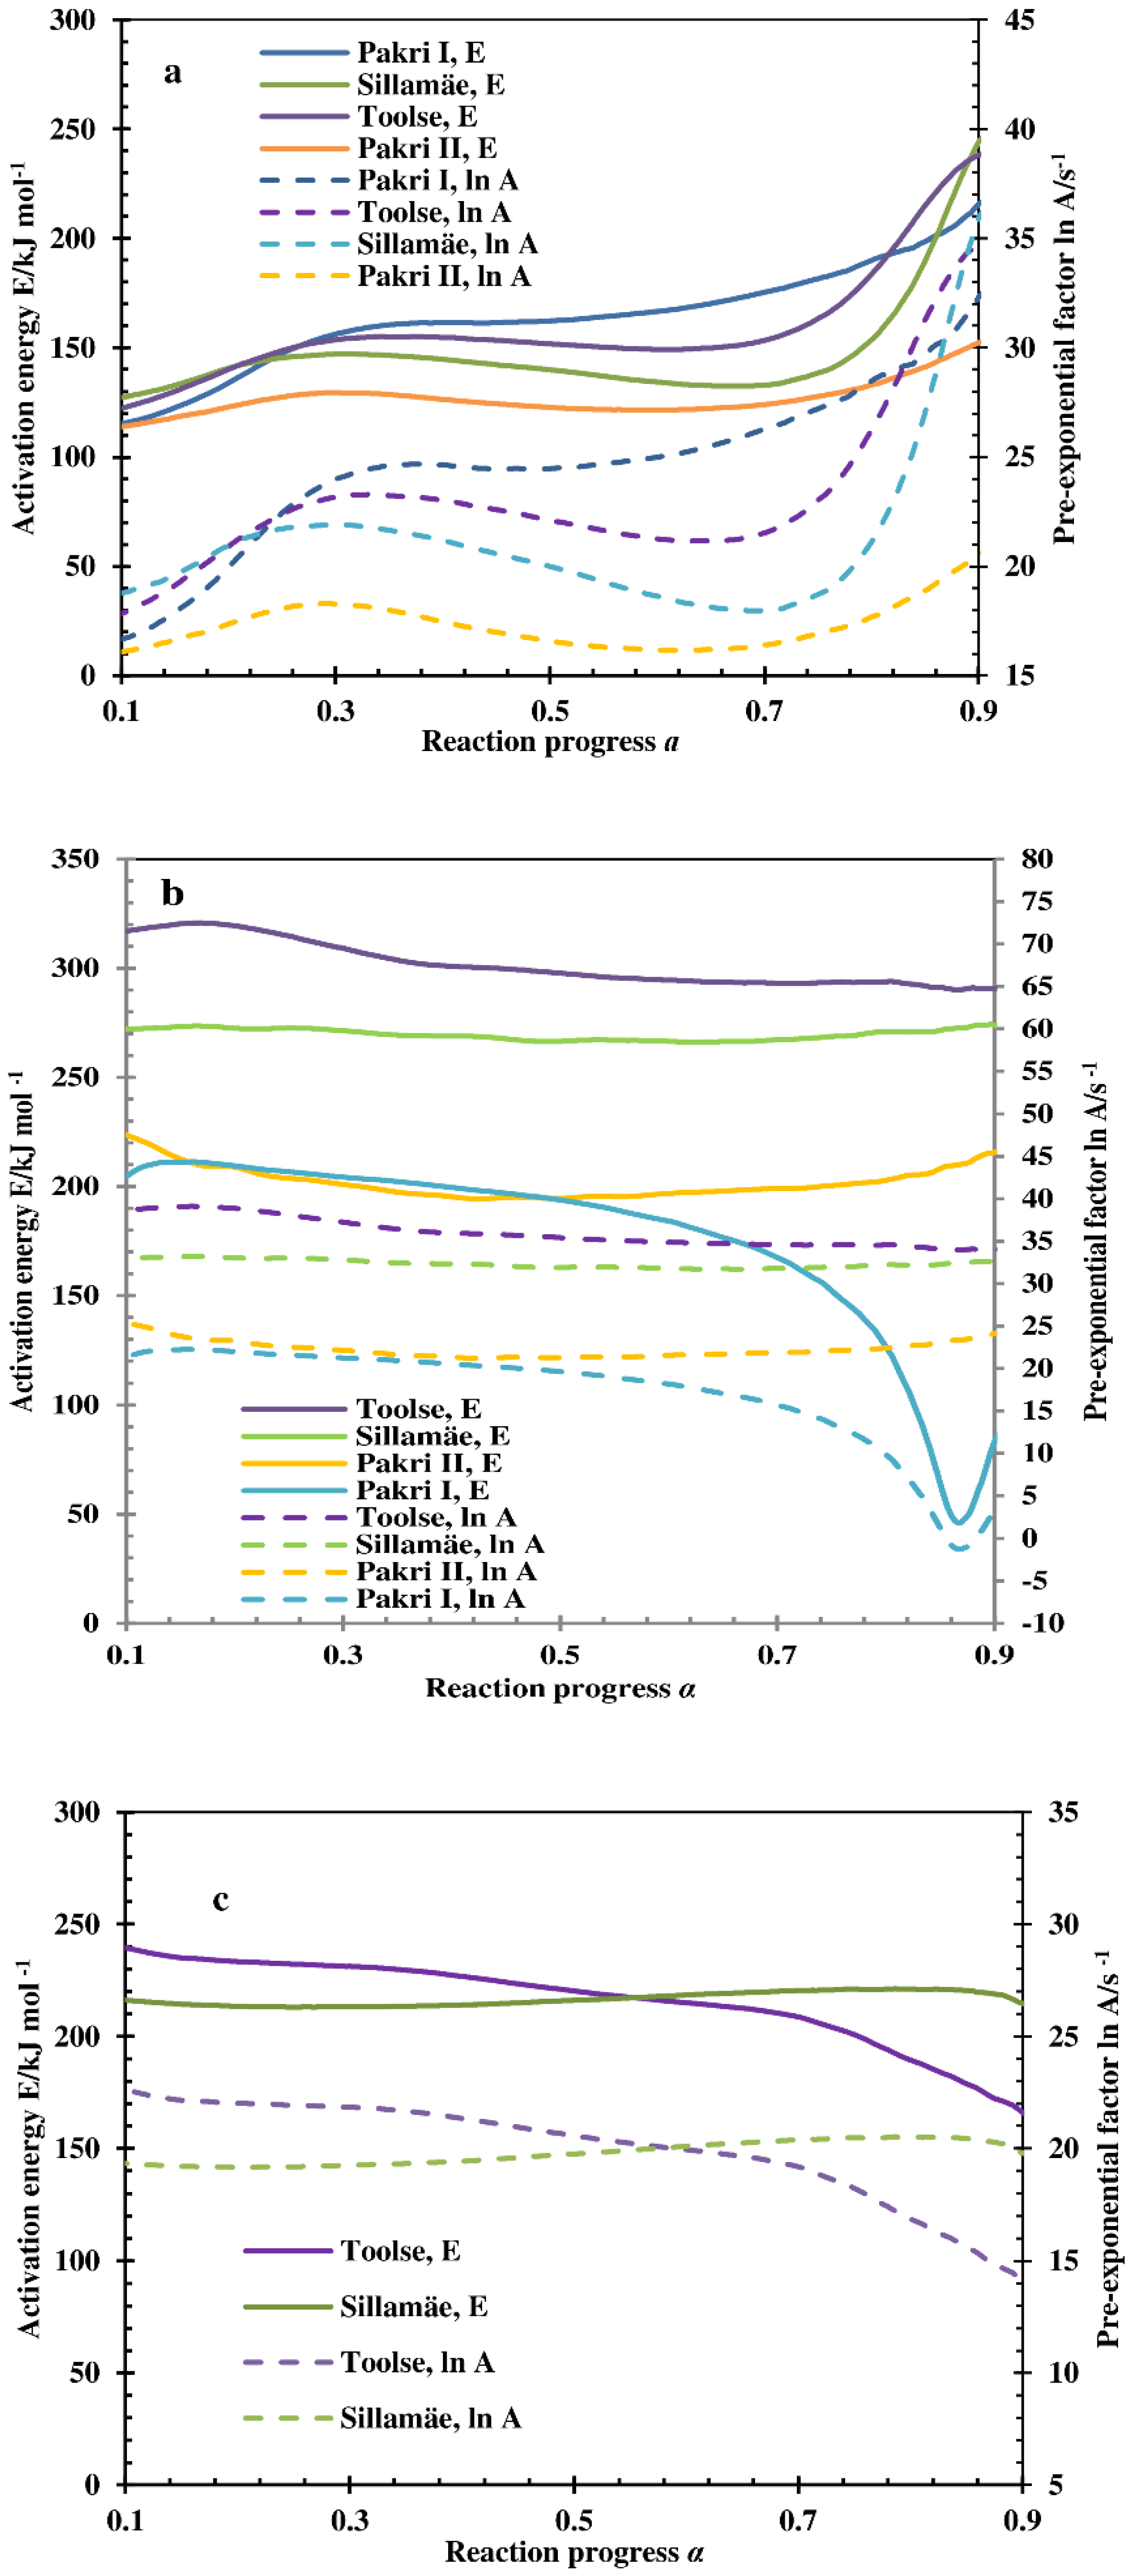
The values of activation energy E calculated in the range of conversion level 0.1 < α < 0.9 for the GA samples studied are presented in Figure 10.
In addition to the emission of physically bound water, the decomposition of GA samples from Pakri deposit takes place in two steps, the samples from Sillamäe and Toolse deposit in three steps. Thermo-oxidation of organic matter, which is the first step of thermo-oxidation of pyrite and partial dehydroxylation of clay minerals, takes place depending on heating rate up to 500 °C. The change in activation energy E values along reaction progress α is quite similar for all the studied samples (starting at 110–130 kJ mol–1 and reaching to 150–240 kJ mol−1), being the highest for Pakri GA I and lowest for Pakri GA II (Figure 10a). The most important step affecting these differences is the thermo-oxidation of pyrite, which in Pakri GA II, is present at a much lower level (5.7%) than in the other samples (between 7.2–9.9%) (Table 1).
In the temperature range between 500–550 °C and 700–750 °C (step II), dehydroxylation processes in clay minerals continue, and the decomposition of jarosite and magnesium carbonate contained in dolomite takes place. In addition, Fe(III)-sulphate and Mg-sulphate, both formed at lower temperatures, start to decompose (Table 1 and Figure 6). The activation energy E values along the reaction progress for this step are quite stable, varying for Toolse GA between 290 and 320 kJ mol−1, for Sillamäe GA between 270 and 280 kJ mol−1, and for Pakri GA II between 195 and 220 kJ mol−1 (Figure 10b). For Pakri GA I, the activation energy E value decreased slowly from 210 kJ mol−1 (α = 0.1) to 190 kJ mol−1 (α = 0.6) and then, more rapidly, to 50 kJ mol−1 at α = 0.85 (Figure 5b), caused by differences in the mineralogical composition of Pakri GA I compared with others, i.e., due to absence of dolomite and a much higher content of jarosite (Table 1).
During step III, in the temperature range between 700–750 °C and 800–850 °C, for the Sillamäe and Toolse GA samples, decomposition of calcite takes place and the decomposition of Mg-sulphate comes to an end. The activation energy E value for Sillamäe GA along the reaction progress α stays permanently on the level around 220 kJ mol−1 (Figure 10c). For Toolse GA, the activation energy E value decreases from ~220 kJ mol−1 (α = 0.1) to ~170 kJ mol −1 (α = 0.9), caused by much lower content of the secondary Ca-carbonate in Toolse GA compared with the content of it (primary and secondary) in Sillamäe GA (Table 1 and Figure 6).

4. Conclusions

The results obtained indicated that upon thermal treatment of Estonian graptolite–argillite samples in oxidizing atmosphere of up to 200 °C, the emission of hygroscopic and physically bound water takes place. Between 200 °C and 500–550 °C, the thermo-oxidative decomposition of organic matter and the first step of the thermo-oxidation of pyrite follows with the emission of water, carbon dioxide, sulphur dioxide, nitrogen oxides, and different hydrocarbon fragments such as m/z = 27, m/z = 45, and m/z = 15, indicating the complicated composition of organic matter in GA. At higher temperatures, between 550 °C and 900 °C, dehydroxylation processes in clay minerals continue, decomposition of jarosite and carbonates takes place, and the second step of thermo-oxidative decomposition of pyrite starts. In addition, for the Sillamäe GA sample, at around 1160 °C, the secondary anhydrite decomposes, which is formed at lower temperatures due to the reaction of sulphur dioxide (emitted at thermo-oxidation of organic matter and at the first step of thermo-oxidative decomposition of pyrite) with dolomite and calcite contained in Sillamäe GA. In parallel to the thermo-oxidative reactions, changes in the composition and crystal structure of K-alumosilicates also take place.
Kinetic calculations proved the complicated mechanism of thermal decomposition of GA samples, which for Pakri GA samples, occur in two and for Sillamäe and Toolse GA samples, in three steps.
Based on the preliminary results obtained, the research for applying the thermal treatment/acidic leaching method for the removal of different elements from Estonian GA samples will be actively continued.

Author Contributions

Conseptualization: T.K. (Tiit Kaljuvee), K.T. and A.T.; formal analysis: M.E., E.-K.K., T.K. (Toivo Kallaste), and V.M.; methodology and interpretation: T.K. (Tiit Kaljuvee), K.T., T.K. (Toivo Kallaste), and V.M. All authors have read and agreed to the published version of the manuscript.

Funding

This study was supported by the European Regional Development Fund and Estonian Research Council via project RESTA18.

Informed Consent Statement

Not applicable.

Data Availability Statement

These studies have no published or reported data in any open databases.

Conflicts of Interest

The authors declare no conflict of interest.

Abbreviations

DTADifferential thermal analysis
DTGDifferential TG
EGAEvolved gas analysis
FTIRFourier transform infrared
GAGraptolite–argillite
MP-AESMicrowave plasma atomic emission spectroscopy
MSMass spectroscopy
SEMScanning electron spectroscopy
BET SSABrunauer–Emmett–Teller specific surface area
TGThermogravimetry
XRDX-ray diffraction

References

  1. Brumsack, H.-J. The trace metal content of recent organic carbon-rich sediments: Implications for Cretaceous black shale formation. Palaeogeogr. Palaeoclimatol. Palaeoecol. 2006, 232, 344–361. [Google Scholar] [CrossRef]
  2. Johnson, S.C.; Large, R.R.; Coveney, R.M.; Kelley, K.D.; Slack, J.F.; Steadman, J.A.; Gregory, D.D.; Sack, P.J.; Meffre, S. Secular distribution of highly metalliferous black shales corresponds with peaks in past atmosphere oxigenation. Min. Deposita. 2017, 52, 791–798. [Google Scholar] [CrossRef]
  3. Lavergren, U.; Åström, M.E.; Bergback, B.; Holmström, H. Mobility of trace elements in black shale assessed by leaching tests and sequential chemical reaction. Geochem. Explor. Environ. Analysis. 2009, 9, 71–79. [Google Scholar] [CrossRef]
  4. Canfield, D.E. A new model for Proterozoic ocean chemistry. Nature 1998, 396, 450–453. [Google Scholar] [CrossRef]
  5. Meyer, K.; Kump, L. Oceanic Euxinia in Earth History: Causes and Consequences. Annu. Rev. Earth Planet. Sci. 2008, 36, 251–288. [Google Scholar] [CrossRef] [Green Version]
  6. Lyons, T.W.; Anbar, A.D.; Severmann, S.; Scott, C.; Gill, B.C. Tracking Euxinia in the Ancient Ocean: A Multiproxy Perspective and Proterozoic Case Study. Annu. Rev. Earth Planet. Sci. 2009, 37, 507–534. [Google Scholar] [CrossRef]
  7. Blumenberg, M.; Wiese, F. Imbalanced nutrients as triggers for black shale formation in a shallow shelf setting during the OAE 2 (Wunstorf, Germany). Biogeosciences 2012, 9, 4139–4153. [Google Scholar] [CrossRef] [Green Version]
  8. Ozaki, K.; Tajima, S.; Tajika, E. Conditions required for oceanic anoxia/euxinia: Constraints from a one-dimensional ocean biochemical cycle model. Earth Planet. Sci. Lett. 2011, 304, 270–279. [Google Scholar] [CrossRef]
  9. Turgeon, S.C.; Creaser, R.A. Cretaceous oceanic anoxic event 2 triggered by a massive magmatic episode. Nature 2008, 454, 323–326. [Google Scholar] [CrossRef]
  10. Jenkyns, H.C. Geochemistry of oceanic anoxic events. Geochem. Geophys. Geosyst. 2010, 11, Q03004. [Google Scholar] [CrossRef]
  11. Voigt, S.; Gale, A.S.; Voigt, T. Sea-level change, carbon cycling and paleoclimate during the Late Cenomanian of northwest Europe; an integrated paleoenvironmental analysis. Creteaceous Res. 2006, 27, 836–858. [Google Scholar] [CrossRef]
  12. Weissert, H.; Erba, E. Volcanism, CO2 and palaeoclimate: A Late Jurassic—Early Cretaceous carbon and oxygen isotope record. J. Geol. Soc. 2004, 161, 695–702. [Google Scholar] [CrossRef]
  13. Mattioli, E.; Pittet, B.; Palliani, R.B.; Röhl, H.J.; Schmid-Röhl, A.; Morettini, E. Phytoplankton evidence for the timing and correlation of palaeoceanographical changes during the early Toarcian oceanic anoxic event (Early Jurassic). J. Geol. Soc. 2004, 161, 685–693. [Google Scholar] [CrossRef]
  14. Nederbragt, A.J.; Thurow, J.; Vonhof, H.; Brumsack, H.-J. Modelling oceanic carbon and phosphorus fluxes: Implications for the cause of the late Cenomanian oceanic Anoxic Event (OAE2). J. Geol. Soc. 2004, 161, 721–728. [Google Scholar] [CrossRef]
  15. Algeo, T.J.; Ingall, E. Sedimentary Corg:P ratios, paleocean ventilation, and Phanerozoic atmospheric pO2. Palaeogeogr. Palaeoclimatol. Palaeoecol. 2007, 256, 130–155. [Google Scholar] [CrossRef]
  16. Mort, H.P.; Adatte, T.; Keller, G.; Bartels, D.; Föllmi, K.B.; Steinmann, P.; Berner, Z.; Chellai, E.H. Organic carbon deposition and phosphorus accumulation during Oceanic Anoxic Event 2 in Tarfaya, Morocco. Creteaceous Res. 2008, 29, 1008–1023. [Google Scholar] [CrossRef] [Green Version]
  17. Hade, S.; Soesoo, A. Estonian graptolite argillites revisited: A future resource? Oil Shale. 2014, 31, 4–18. [Google Scholar] [CrossRef] [Green Version]
  18. Voolma, M.; Soesoo, A.; Hade, S.; Hints, R.; Kallaste, T. Geochemical heterogeneity of Estonian graptolite argillite. Oil Shale. 2013, 30, 377–401. [Google Scholar] [CrossRef] [Green Version]
  19. Pagés, A.; Barnes, S.; Schmid, S.; Coveney, R.M.J.; Schwark, L.; Liu, W.; Grice, K.; Fan, H.; Wen, H. Geochemical investigation of the lower Cambrian mineralised black shales of South China and the late Devonian nick deposit, Canada. Ore Geol. Rev. 2018, 94, 396–413. [Google Scholar] [CrossRef]
  20. Dai, S.; Zheng, X.; Wang, X.; Finkelman, R.B.; Jiang, Y.; Ren, D.; Yan, X.; Zhou, Y. Stone coal in China: A review. Int. Geol. Review. 2018, 60, 736–753. [Google Scholar] [CrossRef]
  21. Marynowski, L.; Zatoń, M.; Rakociński, M.; Filipiak, P.; Kurkiewicz, S.; Pearce, T.J. Deciphering the upper Famennian Hangenberg Black Shale depositional environments based on multi-proxy record. Palaeogeogr. Palaeoclimatol. Palaeoecol. 2012, 346–347, 66–86. [Google Scholar] [CrossRef]
  22. Zhao, Y.; Wang, W.; Zhang, Y.; Song, S.; Bao, S. In -situ investigation on mineral phase transition during roasting of vanadium-bearing stone coal. Adv. Powder Techn. 2017, 28, 1103–1107. [Google Scholar] [CrossRef]
  23. Li, W.; Ma, C.; Gong, W.; Zhu, X. Clean production technology for effective recovery of vanadium from shale: Interaction between activators and vanadium-loaded minerals. J. Clean. Prod. 2021, 315, 128170. [Google Scholar] [CrossRef]
  24. Lippmaa, E.; Maremäe, E.; Pihlak, A.T.; Aguraiuja, R. Estonian graptolitic argillites—ancient ores or future fuels? Oil Shale. 2009, 26, 530–539. [Google Scholar] [CrossRef] [Green Version]
  25. Palvadre, R. Possibilities of utilization organic-poor metalliferous black shales (argillite). Oil Shale. 2020, 37, 242–267. [Google Scholar] [CrossRef]
  26. Hints, R.; Hade, S.; Soesoo, A.; Voolma, M. Depositional framework of the East Baltic Tremadocian black shale revisited. GFF 2014, 136, 464–482. [Google Scholar] [CrossRef]
  27. Hints, R.; Pajusaar, S.; Urtson, K.; Liiv, M.; Kallaste, T. Metal enrichment in lithologically complex black shales: A case study from the Tremadocian of NE Estonia. Est. J. Earth Sci. 2021, 70, 36–50. [Google Scholar] [CrossRef]
  28. Lippmaa, E.; Maremäe, E.; Pihlak, A.T. Resources, production and processing of Baltoscandian multimetal black shales. Oil Shale. 2011, 28, 68–77. [Google Scholar] [CrossRef] [Green Version]
  29. Tribovillard, N.; Algeo, J.T.; Lyons, T.; Riboulleau, A. Trace metals as paleoredox and paleoproductivity proxies: An update. Chem. Geol. 2006, 232, 12–32. [Google Scholar] [CrossRef]
  30. Soesoo, A.; Vind, J.; Hade, S. Uranium and Thorium resources of Estonia. Minerals 2020, 10, 798. [Google Scholar] [CrossRef]
  31. Vind, J.; Bauert, H. Geochemical Characterization of the Tremadocian Black Shale in North-Western Estonia; Research Report No. EGF9330; Geological Survey of Estonia: Rakvere, Estonia, 2020; Volume 91. [Google Scholar]
  32. Schmidt, C.M.; Heide, K. Thermal analysis of hydrocarbons in Paleozoic black shales. J. Therm. Anal. Calorim. 2001, 64, 1297–1302. [Google Scholar] [CrossRef]
  33. Labus, M. Thermal methods implementation in analysis of fine-grained rocks containing organic matter. J. Therm. Anal. Calorim. 2017, 129, 965–973. [Google Scholar] [CrossRef] [Green Version]
  34. Labus, M.; Lempart, M. Studies of Polish Paleozoic shale rocks using FTIR and TG/DSC methods. J. Petrol. Sci. Eng. 2018, 161, 311–318. [Google Scholar] [CrossRef]
  35. Taylor, J.C. Computer programs for standardless quantitative analysis of minerals using the full powder diffraction profile. Powder Diffr. 1991, 6, 2–9. [Google Scholar] [CrossRef] [Green Version]
  36. Ward, C.R.; Taylor, J.C.; Cohen, D.R. Quantitative mineralogy of sandstones by X-ray diffractrometry and normative analysis. J. Sed. Geo. 1999, 69, 1050–1062. [Google Scholar] [CrossRef]
  37. Friedman, H.L. Kinetics of thermal degradation of char-forming plastics from thermogravimetry. Application to phenolic plastic. J. Polym. Sci. 1965, 6, 183–195. [Google Scholar] [CrossRef]
  38. AKTS Softwear and Setaram Instruments: A Global Solution for Kinetic Analysis and Determination of the Thermal Stability of Materials; AKTS AG: Sider, Switzerland, 2006; p. 88.
  39. Gaines, G.L.; Vedder, W. Dehydroxylation of Muscovite. Nature 1964, 4918, 495. [Google Scholar] [CrossRef]
  40. Kodama, H.; Brydon, J.E. Dehydroxylation of Microcrystalline Muscovite. Trans. Faraday Soc. 1968, 64, 3112–3119. [Google Scholar] [CrossRef]
  41. Lempart, M.; Derkowski, A.; Luberda-Durnaś, K.; Skiba, M.; Błachowski, A. Dehydrogenation and dihydroxylation as drivers of the thermal decomposition of Fe-chlorites. Am. Mineral. 2018, 103, 1837–1850. [Google Scholar] [CrossRef]
  42. Frost, R.L.; Weier, M.L.; Martens, W. Thermal decomposition of jarosite of potassium, sodium and lead. J. Therm. Anal. Calorim. 2005, 82, 115–118. [Google Scholar] [CrossRef] [Green Version]
  43. Paulik, F.; Paulik, J.; Arnold, M. Kinetics and mechanism of decomposition of pyrite under conventional and quasi-isothermal –quasi-isobaric thermoanalytical conditions. J. Therm. Anal. 1982, 25, 313–325. [Google Scholar] [CrossRef]
  44. Hu, G.; Dam-Johansen, K.; Wedel, S.; Hansen, J.P. Decomposition and oxidation of pyrite. Prog. Energy Combust. Sci. 2006, 32, 295–314. [Google Scholar] [CrossRef]
  45. Diko, M.; Ekosse, G.; Ogola, J. Fourier Transform Infrared Spectroscopy and thermal analysis of kaolinite clays from South Africa and Cameroon. Acta Geodyn. Geomater. 2016, 13, 149–158. [Google Scholar]
  46. Zhirong, L.; Uddin, M.A.; Zhanxue, S. FT-IR and XRD analysis of Natural Na-bentonite and Cu (II)-loaded Na-bentonite. Spectrochim. Acta Part A 2011, 79, 1013–1016. [Google Scholar] [CrossRef] [PubMed]
  47. Eisazadeh, A.; Kassim, K.A.; Nur, H. Solid-state NMR and FTIR studies of lime stabilized montmorillonitic and lateritic clays. Appl. Clay Sci. 2012, 67–68, 5–10. [Google Scholar] [CrossRef]
  48. Cizer, Ö.; Rodrigues-Navarro, C.; Ruiz-Agudo, E.; Elsen, J.; Van Gemert, D.; Van Balen, K. Phase and morphology evolution of carbonate precipitated by carbonation of hydrated lime. J. Mat. Sci. 2012, 47, 6151–6165. [Google Scholar] [CrossRef] [Green Version]
  49. Müller, C.M.; Pejcic, B.; Esteban, L.; Piane, C.D.; Raven, M.; Mizaikoff, B. Infrared Attenuated Total Reflectance Spectroscopy: An Innovative Strategy for Analyzing Mineral components in Energy Relevant Systems. Sci. Rep. 2014, 4, 6764. [Google Scholar] [CrossRef] [PubMed] [Green Version]
  50. Madejová, J. FTIR techniques in clay mineral studies. Vib. Spectrosc. 2012, 31, 1–10. [Google Scholar] [CrossRef]
  51. Davarcioğlu, B.; Ҫiftҁi, E. Investigation of Central Anatolian Clays by FTIR Spectroscopy (Arapli-Yesilhisar-Kayseri, Turkey). Int. J. Nat. Engin. Sci. 2009, 3, 167–174. [Google Scholar]
  52. Theodosoglou, E.; Koroneos, A.; Soldatos, T.; Zorba, T.; Paraskevopoulos, K.M. Comparative Fourier transform infrared and X-ray powder diffraction analysis of naturally occurred K-feldspars. Bull. Geol. Soc. Greece Jan. 2010, XLIII, 2752–2761. [Google Scholar] [CrossRef] [Green Version]
  53. Mozgawa, W.; Król, M.; Dyczek, J.; Deja, J. Investigation of the coal fly ashes using IR spectroscopy. Spectrochim. Acta Part A 2000, 56, 1819–1823. [Google Scholar] [CrossRef] [PubMed]
  54. Matteson, A.; Herron, M.M. End-member feldspar concentrations determined by FTIR spectral analysis. J. Sediment. Petrol. 1993, 63, 1144–1148. [Google Scholar]
  55. Alver, B.E.; Dikmen, G.; Alver, Ö. Investigation of the influence of heat treatment on the structural properties of illite-rich clay mineral using FT-IR, 29Si MAS NMR, TG and DTA methods. Anadolu. Univ. J. Sci. Technol. A Appl. Sci. Engin. 2016, 17, 823–829. [Google Scholar]
  56. Smith, D.H.; Seshadri, K.S. Infrared spectra of Mg2Ca(SO4)3, MgSO4, hexagonal CaSO4 and orthorhombic CaSO4. Spectrochim. Acta Part A 1999, 55, 795–805. [Google Scholar] [CrossRef]
  57. Bishop, J.L.; Murad, E. The visible and infrared properties of jarosite and alunite. Am. Mineral. 2005, 90, 1100–1107. [Google Scholar] [CrossRef]
  58. Barlow, S.G.; Manning, D.A.C. Influence of time and temperature on reactions and transformations of muscovite mica. Br. Ceram. Trans. 1999, 98, 122–126. [Google Scholar] [CrossRef]
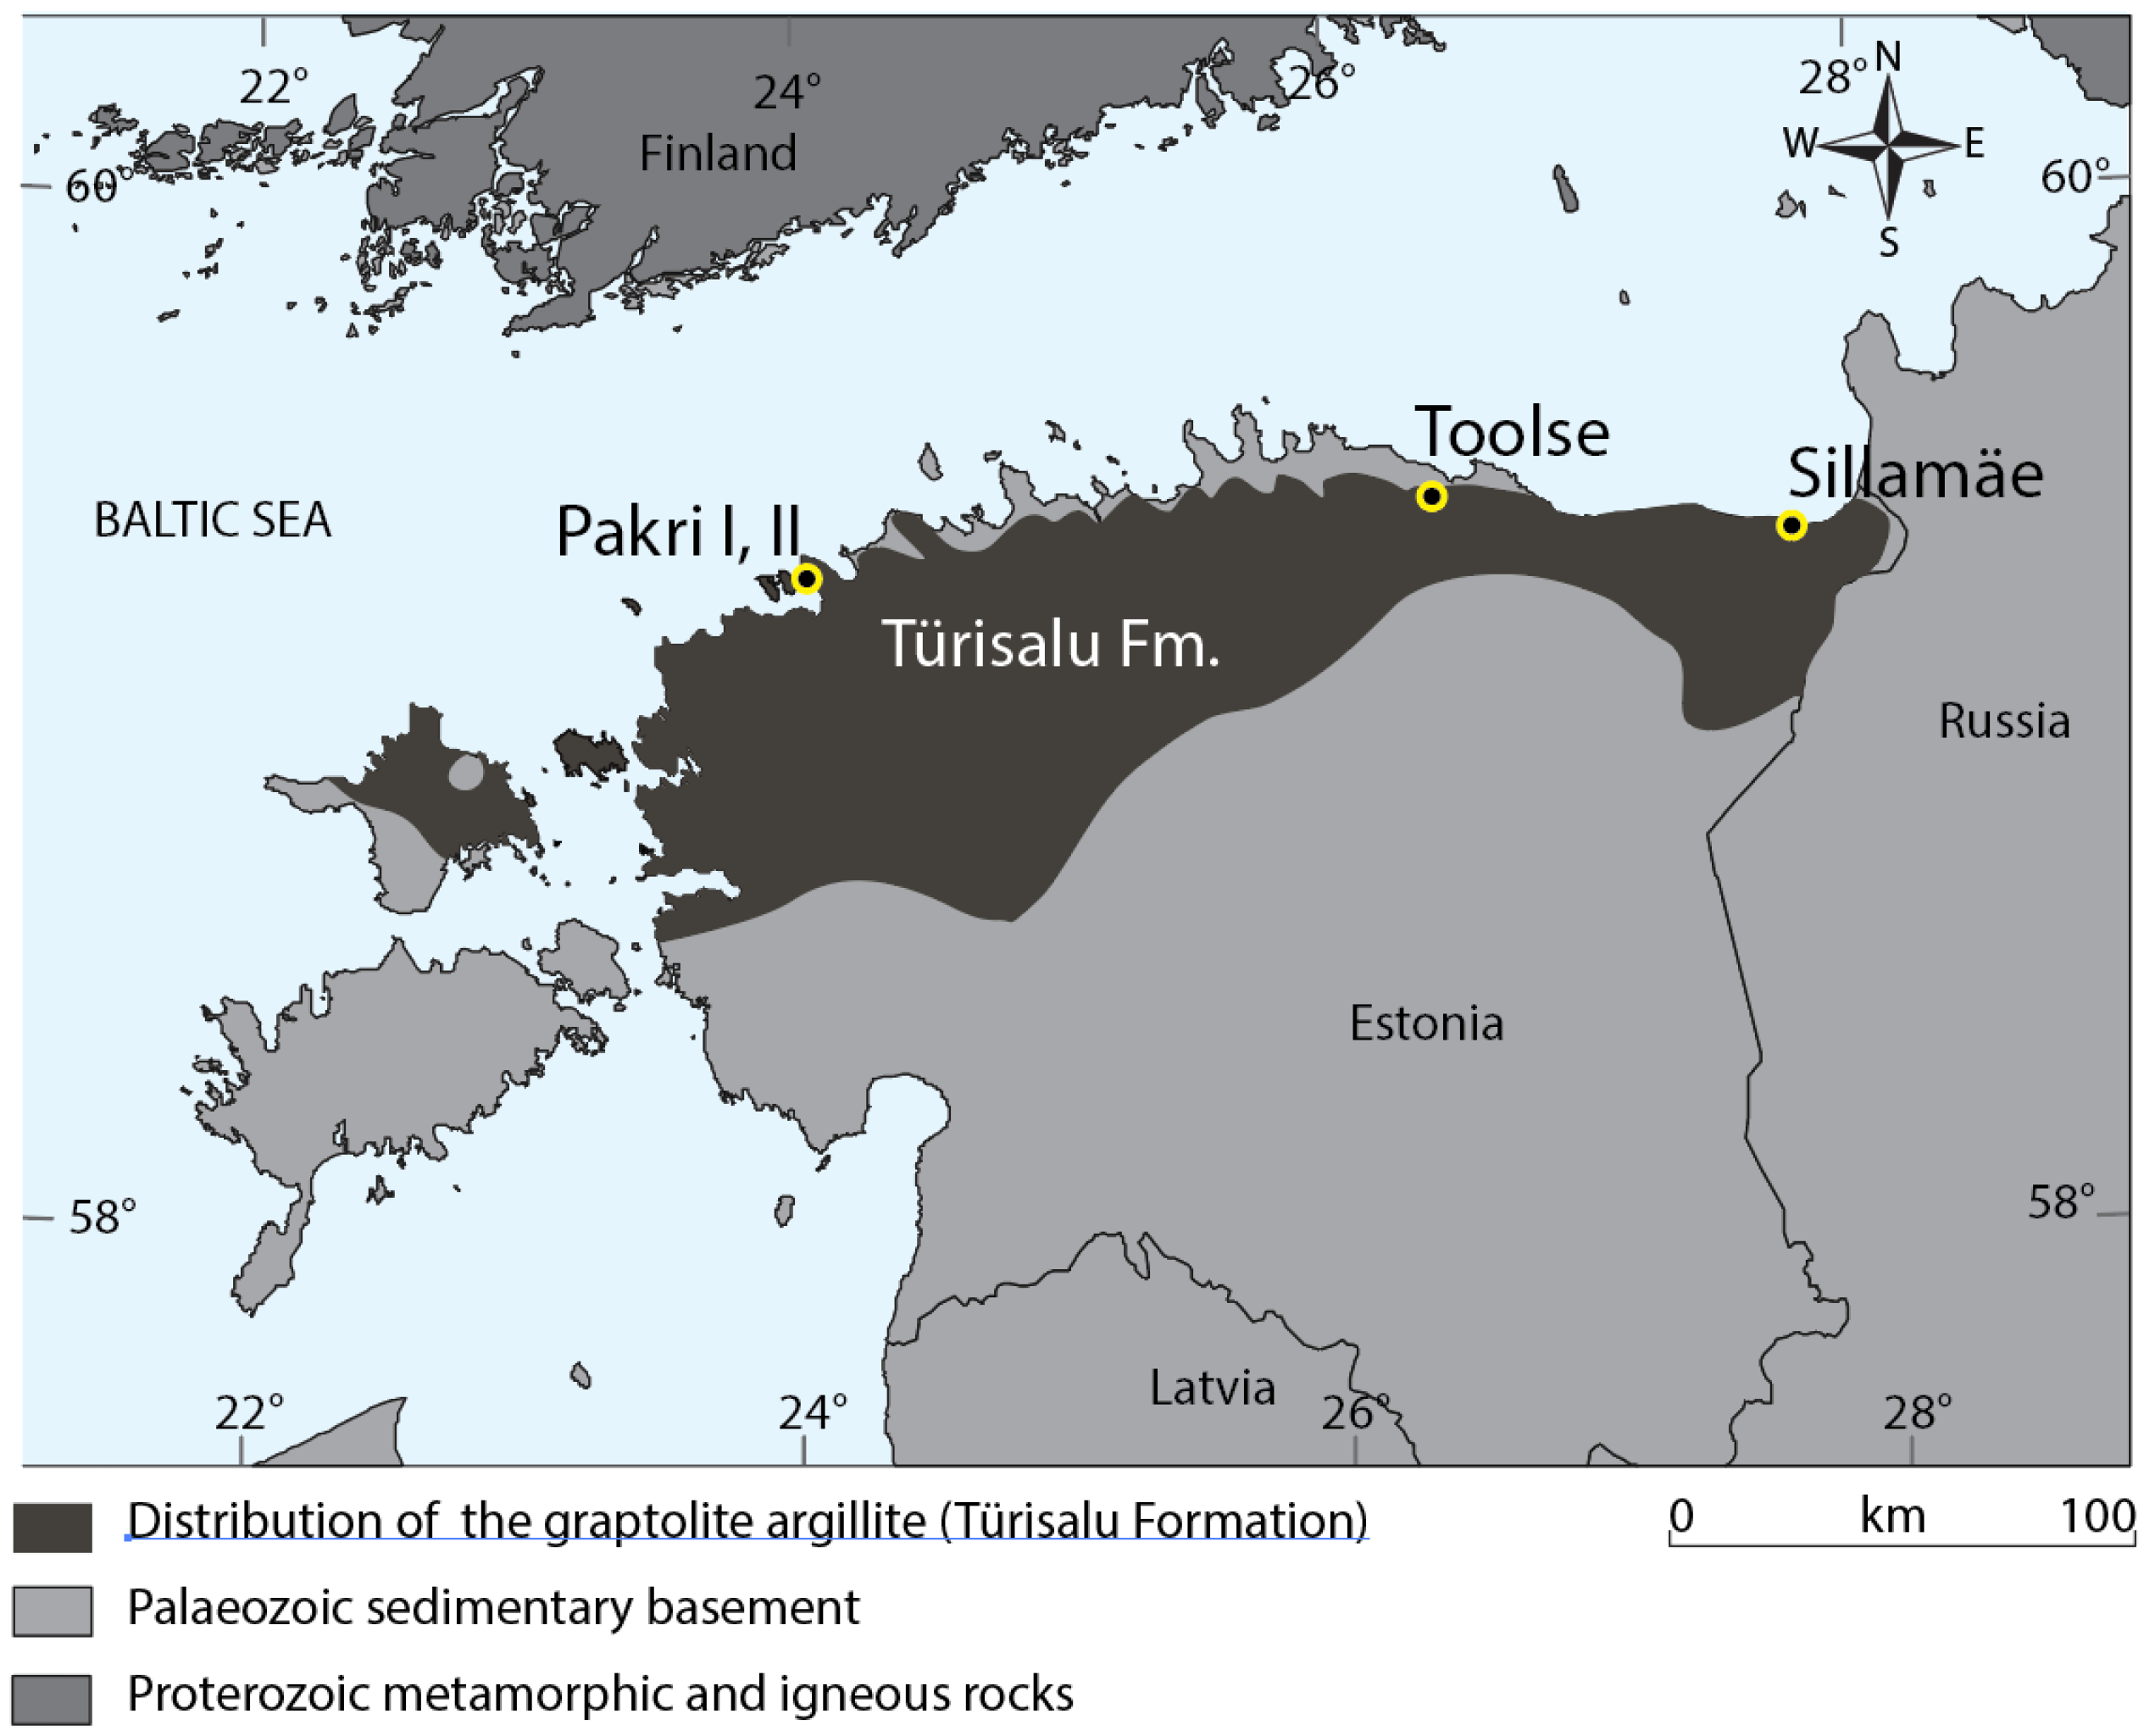
Figure 1. Distribution of the black shales of the Türisalu Formation. Yellow circles mark approximate locations of sampling sites. Türisalu is a village in Harku Parish, Sillamäe is a town in Ida-Viru County in the northern part of Estonia.
Processes 10 01986 g001
Figure 2. Thermoanalytical curves (TG, DTG, DTA) of GA samples.
Processes 10 01986 g002
Figure 3. Emission profiles of H2O (a), CO2 (b), NOx (c), hydrocarbon fragments with m/z = 27 (d), m/z = 45 (e), m/z = 15 (f), and SO2 (g) emitted at thermal treatment of GA samples.
Processes 10 01986 g003aProcesses 10 01986 g003b
Figure 4. FT-IR spectra of initial GA samples. (a) Wavenumber range, 4000–400 cm−1; (b) wavenumber range, 1700–400 cm−1.
Processes 10 01986 g004
Figure 5. FTIR spectra of Pakri GA I (a) and Sillamäe GA (b) samples thermally treated at different temperatures.
Processes 10 01986 g005
Figure 6. Changes in the mineralogical composition of GA samples thermally treated at different temperatures.
Processes 10 01986 g006
Figure 7. SEM photos of Pakri GA I: (a) initial, (b) 550 °C, (c) 850 °C, (d) 1000 °C, and Sillamäe GA samples: (e) initial, (f) 550 °C, (g) 850 °C, (h) 1000 °C (magnification: (a,b,e,f) = 5000×; (c,d) = 50,000×; (g,h) = 20,000×).
Processes 10 01986 g007
Figure 8. Changes in SSA values depending on the treatment temperature of GA samples.
Processes 10 01986 g008
Figure 9. Solubility of components (relative %) at treatment of Toolse GA sample with 10% H2SO4 solution (90 °C, 3h): (a) K2O and Fe2O3, (b) Cu, Pb, V, Mo, and U.
Processes 10 01986 g009
Figure 10. Activation energy E and pre-exponential factor lnA values determined by Friedman analysis as a function of conversion level α for GA samples: step I (a), step II (b), and step III (c).
Processes 10 01986 g010
Table 1. Mineralogical composition (wt%) of GA samples.
Compound/FormulaPakri IPakri IISillamäeToolse
Quartz, SiO224.224.723.835.5
Orthoclase, KAlSi3O854.757.338.041.8
Muscovite, KAl2(AlSi3O10)(F,OH)27.27.83.89.1
Jarosite, KFe33+(OH)6(SO4)24.51.0-0.4
Chlorite, (Mg,Fe)3(SiAl)4O10(OH)2(Mg,Fe)3(OH)60.51.70.4-
Pyrite, FeS28.45.77.29.9
Anatase, TiO20.50.70.30.4
Hematite, Fe2O3-1.1-1.1
Calcite, CaCO3--19.1-
Dolomite, CaMg(CO3)2--6.91.8
Sphalerite, (Zn,Fe)S--0.5-
Table 2. Chemical composition (wt% or ppm), SSA, and calorific value of GA samples.
ItemSample/Content
Pakri IPakri IISillamäeToolse
SiO2, %45.345.241.254.0
Al2O3, %11.411.39.19.6
K2O, %6.88.45.55.9
Fe2O3, %7.95.48.19.4
CaO, %0.30.211.81.6
MgO, %0.81.01.41.8
SO3total, %12.78.110.313.2
CTC, %12.9714.429.519.59
CTIC, %0.400.242.230.32
Corg *, %12.5714.187.289.27
V, ppm890958868916
Mo, ppm336137956414
U, ppm90120254146
Cu, ppm110978987
Pb, ppm135104194158
BET SSA, m2 g−17.8115.6410.5415.02
Goss calorific value, MJ kg−15.276.133.254.37
(* Corg = CTC − CTIC; TC—total carbon, TIC—total inorganic carbon).
Publisher’s Note: MDPI stays neutral with regard to jurisdictional claims in published maps and institutional affiliations.