Article

Numerical Simulation Study on the Flow Properties of Materials for Plugging While Drilling in MWD

1
School of Petroleum Engineering, Yangtze University, Wuhan 430100, China
2
Cooperative Innovation Center of Unconventional Oil and Gas, Yangtze University (Ministry of Education & Hubei Province), Wuhan 430100, China
3
Key Laboratory of Drilling and Production Engineering for Oil and Gas, Wuhan 430100, China
4
PetroChina Xinjiang Oilfield Development Company, Karamay 834000, China
*
Authors to whom correspondence should be addressed.
Processes 2022, 10(10), 1955; https://doi.org/10.3390/pr10101955
Submission received: 21 August 2022 / Revised: 10 September 2022 / Accepted: 14 September 2022 / Published: 28 September 2022

Abstract

:
The method of plugging while drilling has been one of the commonly used methods to control formation loss during drilling. The damage to materials for plugging while drilling to MWD has become a complex problem. For many years, field engineers had insufficient knowledge of the passing performance of materials for plugging while drilling in measurement while drilling (MWD). In the existing research, the blocking mechanism of materials for plugging while drilling to mud screen during the flow process is still unclear. In this study, we use computational fluid dynamics coupled with discrete element method (CFD–DEM) to investigate materials’ plugging mechanism while drilling. The results show that the migration process of lost circulation materials (LCMs) in the mud screen can be divided into three stages, displacement, retention, and accumulation of LCMs. The blocking mechanism of LCMs on the mud screen comes from two aspects. One is from the bridging of LCMs with larger particle size in the holes of the mud screen. Another source is the difference between the entry speed and the overflow speed of LCMs. The particle size and mass fraction of LCMs and the viscosity and displacement of the fluid affect the flow properties of LCMs from these two factors, respectively.

1. Introduction

As the oil and gas industry gradually develops into more challenging and deeper formations, this presents more significant challenges for drilling operations [1,2]. Deep formations are prone to feature narrow pressure windows and significant pressure gradient changes, and these unstable factors often lead to the loss of drilling fluids [3,4,5]. In order to deal with the formation leakage problem quickly and effectively, the MWD technology is widely used. Loss-while-drilling refers to the addition of circulating lost circulation materials (LCMs) to the drilling fluid. It can plug the entire well section while drilling and is a practical section to prevent complex bottom hole conditions [6]. It is especially effective in controlling the leakage of the formation with more and less clear leakage. Compared with the traditional plugging method, the measurement while drilling (MWD) method does not require lifting and unloading the MWD, significantly reducing the field operation time [7].
Measurement while drilling (MWD) is a while drilling tool included in most oil wells drilled today [8]. It is a system developed to take drilling-related measurements downhole and transmit the information to the surface while drilling. The channels they provide for drilling fluids are limited and much smaller than the inner diameter of the drill pipe [9]. Periodic movement of the valve within the tool restricts the flow of drilling fluid through the inner diameter of the tool. Debris in the drilling fluid can cause damage to the tools inside the tool, such as the pulse generator, because of the narrow flow paths [10]. Materials for plugging while drilling pose challenges to today’s measurement while drilling (MWD) [11]. Improper selection of materials for plugging while drilling can bring the risk of plugging in MWD [12]. Therefore, to prevent this kind of damage, a mud screen is installed on the top of the MWD tool and connected to the drill pipe, as shown in Figure 1. This method filters out large particles in the mud that could harm the tool. A mud screen should be used whenever the circulation of the drilling fluid begins to prevent debris in the drilling fluid from flowing from the drill pipe into the tool, blocking the mud pulse generator or the drill bit jet [13].
At present, there are few studies on the circulation of materials for plugging while drilling in MWD tools. Only a few conference papers have suggested that using LCMs for MWD poses certain risks. Hussain S et al. (2014) proposed that the concentration of LCMs is harmful to MWD [14]. Attong D J et al. (1995) suggested that MWD is highly sensitive to LCMs, especially for high concentrations of LCMs [15]. Valerio A et al. (2020) argue that the inability to know the flow-through properties of LCMs from MWD makes operators less confident in pumping large particle size or high concentrations of LCMs [10]. Klotz C et al. (2008) proposed that in a mud pulsator, adjusting the angle of the rotor entering the flow region can help LCMs to obtain larger flow channels [16]. However, such measures are still limited. At present, the operators of drilling rigs are not aware of the logic of LCMs blocking MWD, especially the mud screen. Regarding the optimal injection rate of LCM, the choice of the critical concentration of LCMs and the maximum particle size of the material is ambiguous [17]. Drilling engineers have eagerly raised this demand in the South China Sea, where leakage accidents are frequent [18].
The flow and particle properties of the drilling fluid impact the passage performance of the plugging slurry from the MWD. The flow of LCMs mixed with drilling fluid in the tool can be considered particle flow [19,20,21]. At present, particle flow is mainly studied by numerical simulation, most of which are coupled by the computational fluid dynamics–discrete element method (CFD–DEM). It is an Eulerian–Lagrangian method that analyzes complex problems in fluid mechanics and structural mechanics of continuum (fluids) and discontinuous media (particles) and fields. By tracking and calculating the microscopic motion between fluid, particle, and boundary in each unit, the overall flow law of LCMs in MWD is obtained. Casas G et al. (2022) discussed the flow properties of particles and fluids within the drill bit using numerical techniques of the CFD–DEM method [22]. Feng C et al. (2022) investigated the process of particles and fluids expelled from the bottom of the bit and impacted the bit body through numerical simulations and field experiments [23]. They also studied the key factors in the erosion of polycrystalline diamond compact (PDC) bits. The transport of drill cuttings in drilling operations is also a typical particle flow. Especially in horizontal wells and deviated wells, Zakerian A et al. (2018) studied cuttings migration parameters by establishing a CFD–DEM model [24]. Lin C et al. (2022) tracked the migration behavior of each particle in the fracture using numerical simulation, analyzed the sealing of the fracture by the particles in stages, and explained the evolution process of the sealing layer in the fracture [25]. The method of numerical simulation is beneficial to the understanding of the flow law between particles and fluid.
In fact, in order to ensure the safety of MWD, the selection of materials for plugging while drilling by on-site drilling engineers is often conservative. This stems from the ambiguity about the flow properties of LCMs in MWD tools. In this paper, combining the computational dynamics model with the discrete element method, the downhole mud screen tool is used as the object, and the CFD–DEM model is established simultaneously. This model simulates the entire process of the Materials for plugging while drilling from the drill string to the mud screen tool. The parameters such as the appropriate viscosity of the fluid, the injection speed of LCMs, the critical concentration of LCMs, and the maximum particle size of LCMs are further clarified. The boundary condition of materials for plugging while drilling on mud screen tool plugging is helpful for drilling engineers to expand the choice of MWD system. This facilitates dealing with a broader range of missed incidents.

2. Methods

Based on the coupling of computational fluid dynamics and discrete elements, a 3D model identical to the actual tool was established to study the flow properties of LCMs in the mud screen, in which the shape of the LCMs was set as spherical. The drilling fluid (continuous phase) is considered incompressible based on the Lagrangian method. While LCMs are considered to be the dispersed phase. The solution for the continuous phase is determined by using the Navier–Stokes (RANS) equations. The dispersed phase is solved by tracking the particles through the flow field, and each particle is numerically integrated through Newton’s equations governing the translation and rotation of the particle and is individually tracked along the continuous phase by the forces acting on the particle [26].

2.1. Governing Equations of the Particle Model

2.1.1. Particle Motion

The particle is tracked based on the DEM method in Lagrangian coordinates, the velocity and acceleration of the particle are calculated based on Newton’s second law, and the translation and rotation of the particle are controlled [27,28]. The governing equations are as follows:
m p d v p d t = F C + F f p + m p g
H p d w p d t = T C + T f p
where mp is the particle mass (kg), g is the gravitational acceleration (m/s2), vp is the particle translation velocity (m/s), and FC is the particle–particle and particle–wall interaction force (N). Ffp is the interaction force between the fluid surrounding the particle and the particle. Hp is the moment of inertia (kg·m2), and wp is the angular velocity of the particle (rad/s). TC is the particle–particle and particle–wall tangential force (N) that causes particle rotation. Tfp is the additional torque (kg·m2·s−2) due to the velocity gradient of the fluid.

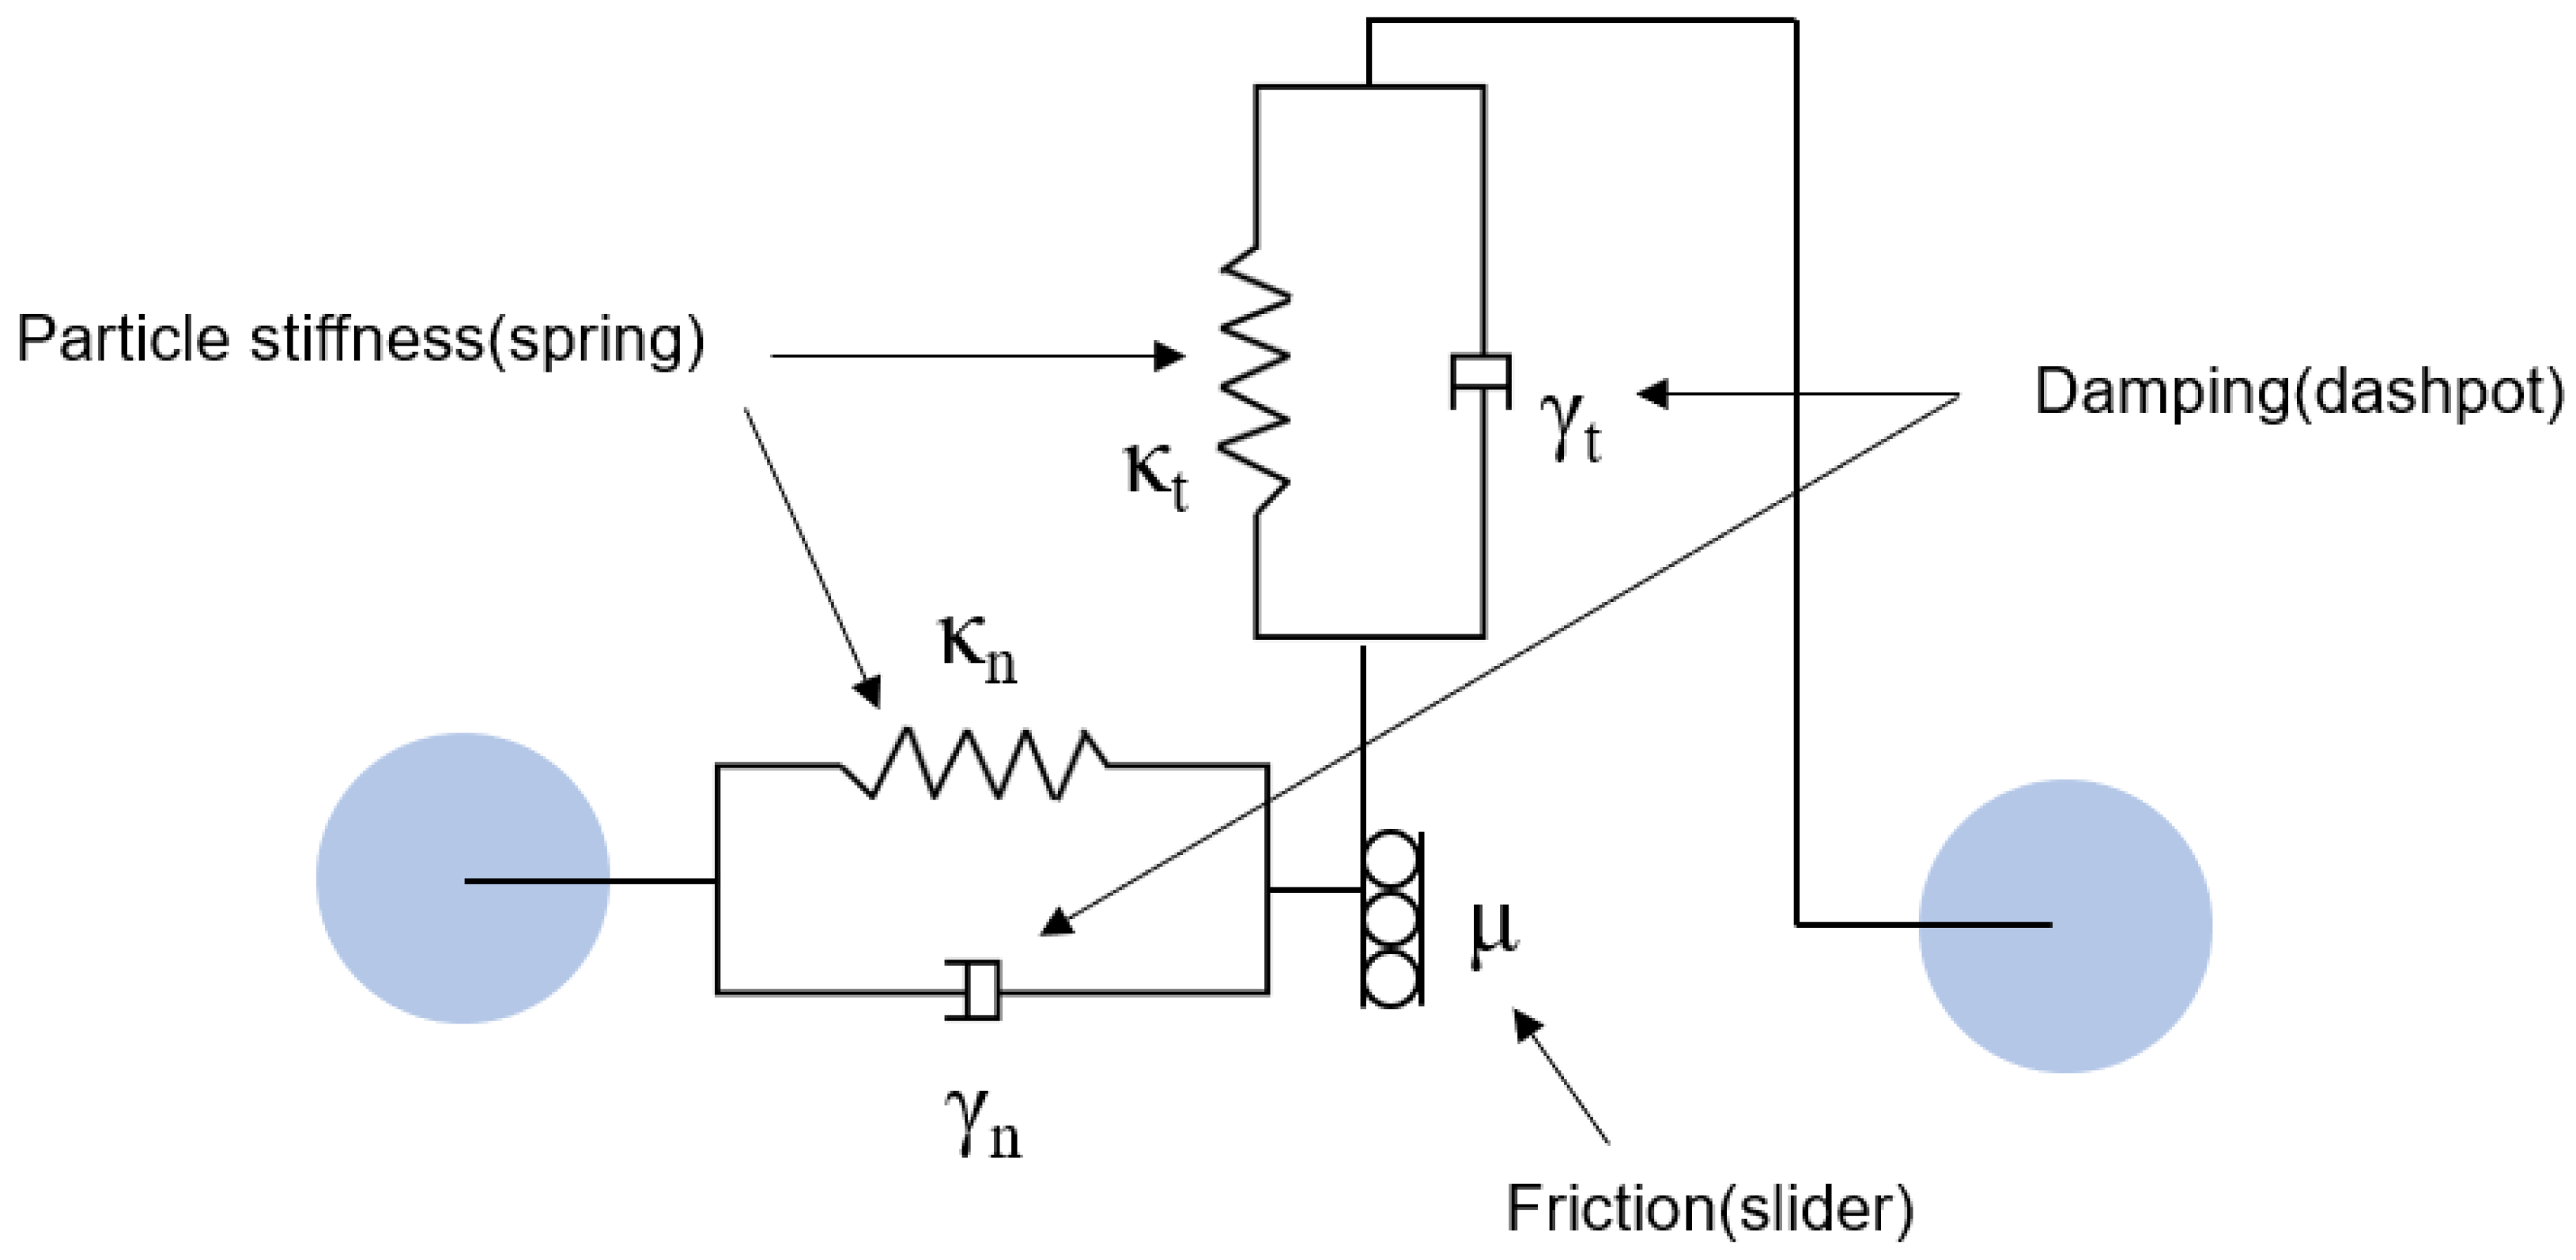
2.1.2. Contact Force Models

In the dispersed phase, the force is mainly generated by the contact between the solid phase and the solid phase, including two particles or a particle and a wall.

Normal Force

The contact force between particle–particle and particle–wall consists of stress in the normal and tangential directions. The normal contact force model is specified by the Hertzian spring–dashpot model [29]. The Hertzian spring–dashpot model used can be written as:
F n = K H S n 3 2 + ξ H S n 1 4 S n
K H = 4 3 E * R *
1 E * = 1 v 1 2 E 1 + 1 v 2 2 E 2
1 R * = 1 L 1 + 1 L 2   f o r   p a r t i c l e p a r t i c l e   c o l l i s i o n 1 L   f o r   p a r t i c l e b o u n d a r y   c o l l i s i o n
Following the idea proposed by Tsuji Y et al. [30], the definition of the damping coefficient for the Hertz model is similar to that of the linear spring–damper model:
ξ H = 2 η H m * K H

Tangential Force

The model of the tangential force of the contact force uses the Mindlin–Deresiewicz model, which is called the linear friction damper model, which includes springs, dampers, and friction blocks, as shown in Figure 2. The model combines Hertz’s theory to describe normal stress and Mindlin and Deresiewicz’s theory [31]. The expression for the tangential force is given by:
F τ = μ F n 1 ζ 3 2 s τ s τ + η τ 6 μ m * F n s τ , m a x ζ 1 4 s τ
ζ = 1 min s τ , m a x s τ , m a x
where µ is the friction coefficient; F n is the normal stress; and s τ   is the tangential displacement at the contact point. s τ is the tangential component of the relative velocity at the contact point; s τ , m a x is the maximum displacement of the particle slipping at the contact point. m * is the effective mass; η τ is the damping ratio, which is related to the restitution coefficient of the material.

2.2. Governing Equations of the Fluid Model

In the CFD–DEM coupled simulation, using the Multiphase Model, when using the Eulerian method, the fluid phase is regarded as a continuous phase, and the fluid phase is an incompressible fluid, which is described by the volume-averaged classical Navier–Stokes equation [33]. Its mean mass conservation equation and mean momentum conservation equation are given by Equations (10) and (11), respectively:
t α f ρ f + · α f ρ f u = 0
t α f ρ f + · α f ρ f u = α f p + · α f T f + α f ρ f g + F p f
T f = μ f u + u T + λ f 2 3 μ f · u I
F P f = P = 1 N F f p V c
where α f represents the fluid volume fraction, p is the pressure, ρ f is the fluid density, u is the fluid phase velocity, and T f is the stress tensor of the fluid phase; the stress tensor of T f in Equation (11) is defined by Equation (12);
In Equation (11), F P f represents the momentum source term of the interaction between particles and the fluid, which is defined according to Equation (13), where V c is the calculation unit volume, and n is the particle in the calculation unit volume. The number, F P f describes the force the fluid exerts on the particles.

2.3. Particle-Fluid Interaction Forces

The interaction force F f p between the fluid and the particle is usually divided into two terms: the drag force FD and the second term consisting of the residual (nonresistance) force FN−D, in the following way [34]:
F f p = F D + F N D
The most common non-drag forces are the pressure gradient force Fp, the additional (virtual) mass force FVM, and the lift force FL, so we can also write:
F f p = F D + F p + F L + F V M + F o t h e r s
In fact, depending on the flow conditions, most of these forces are negligible, and only drag and pressure gradient forces need to be considered since, in most cases, the density of particles is much greater than that of the fluid, where the drag force F D is expressed according to Equation (16),
F D = 1 2 C D ρ f A u v p u v p
In Formula (16), A is the projected area of the particle in the direction of the fluid; u v p is the velocity difference between the fluid and the particle. Where the pressure gradient force   F p is calculated according to Equation (13):
F p = V p p
where Vp is the volume of the particle and p is the local pressure.

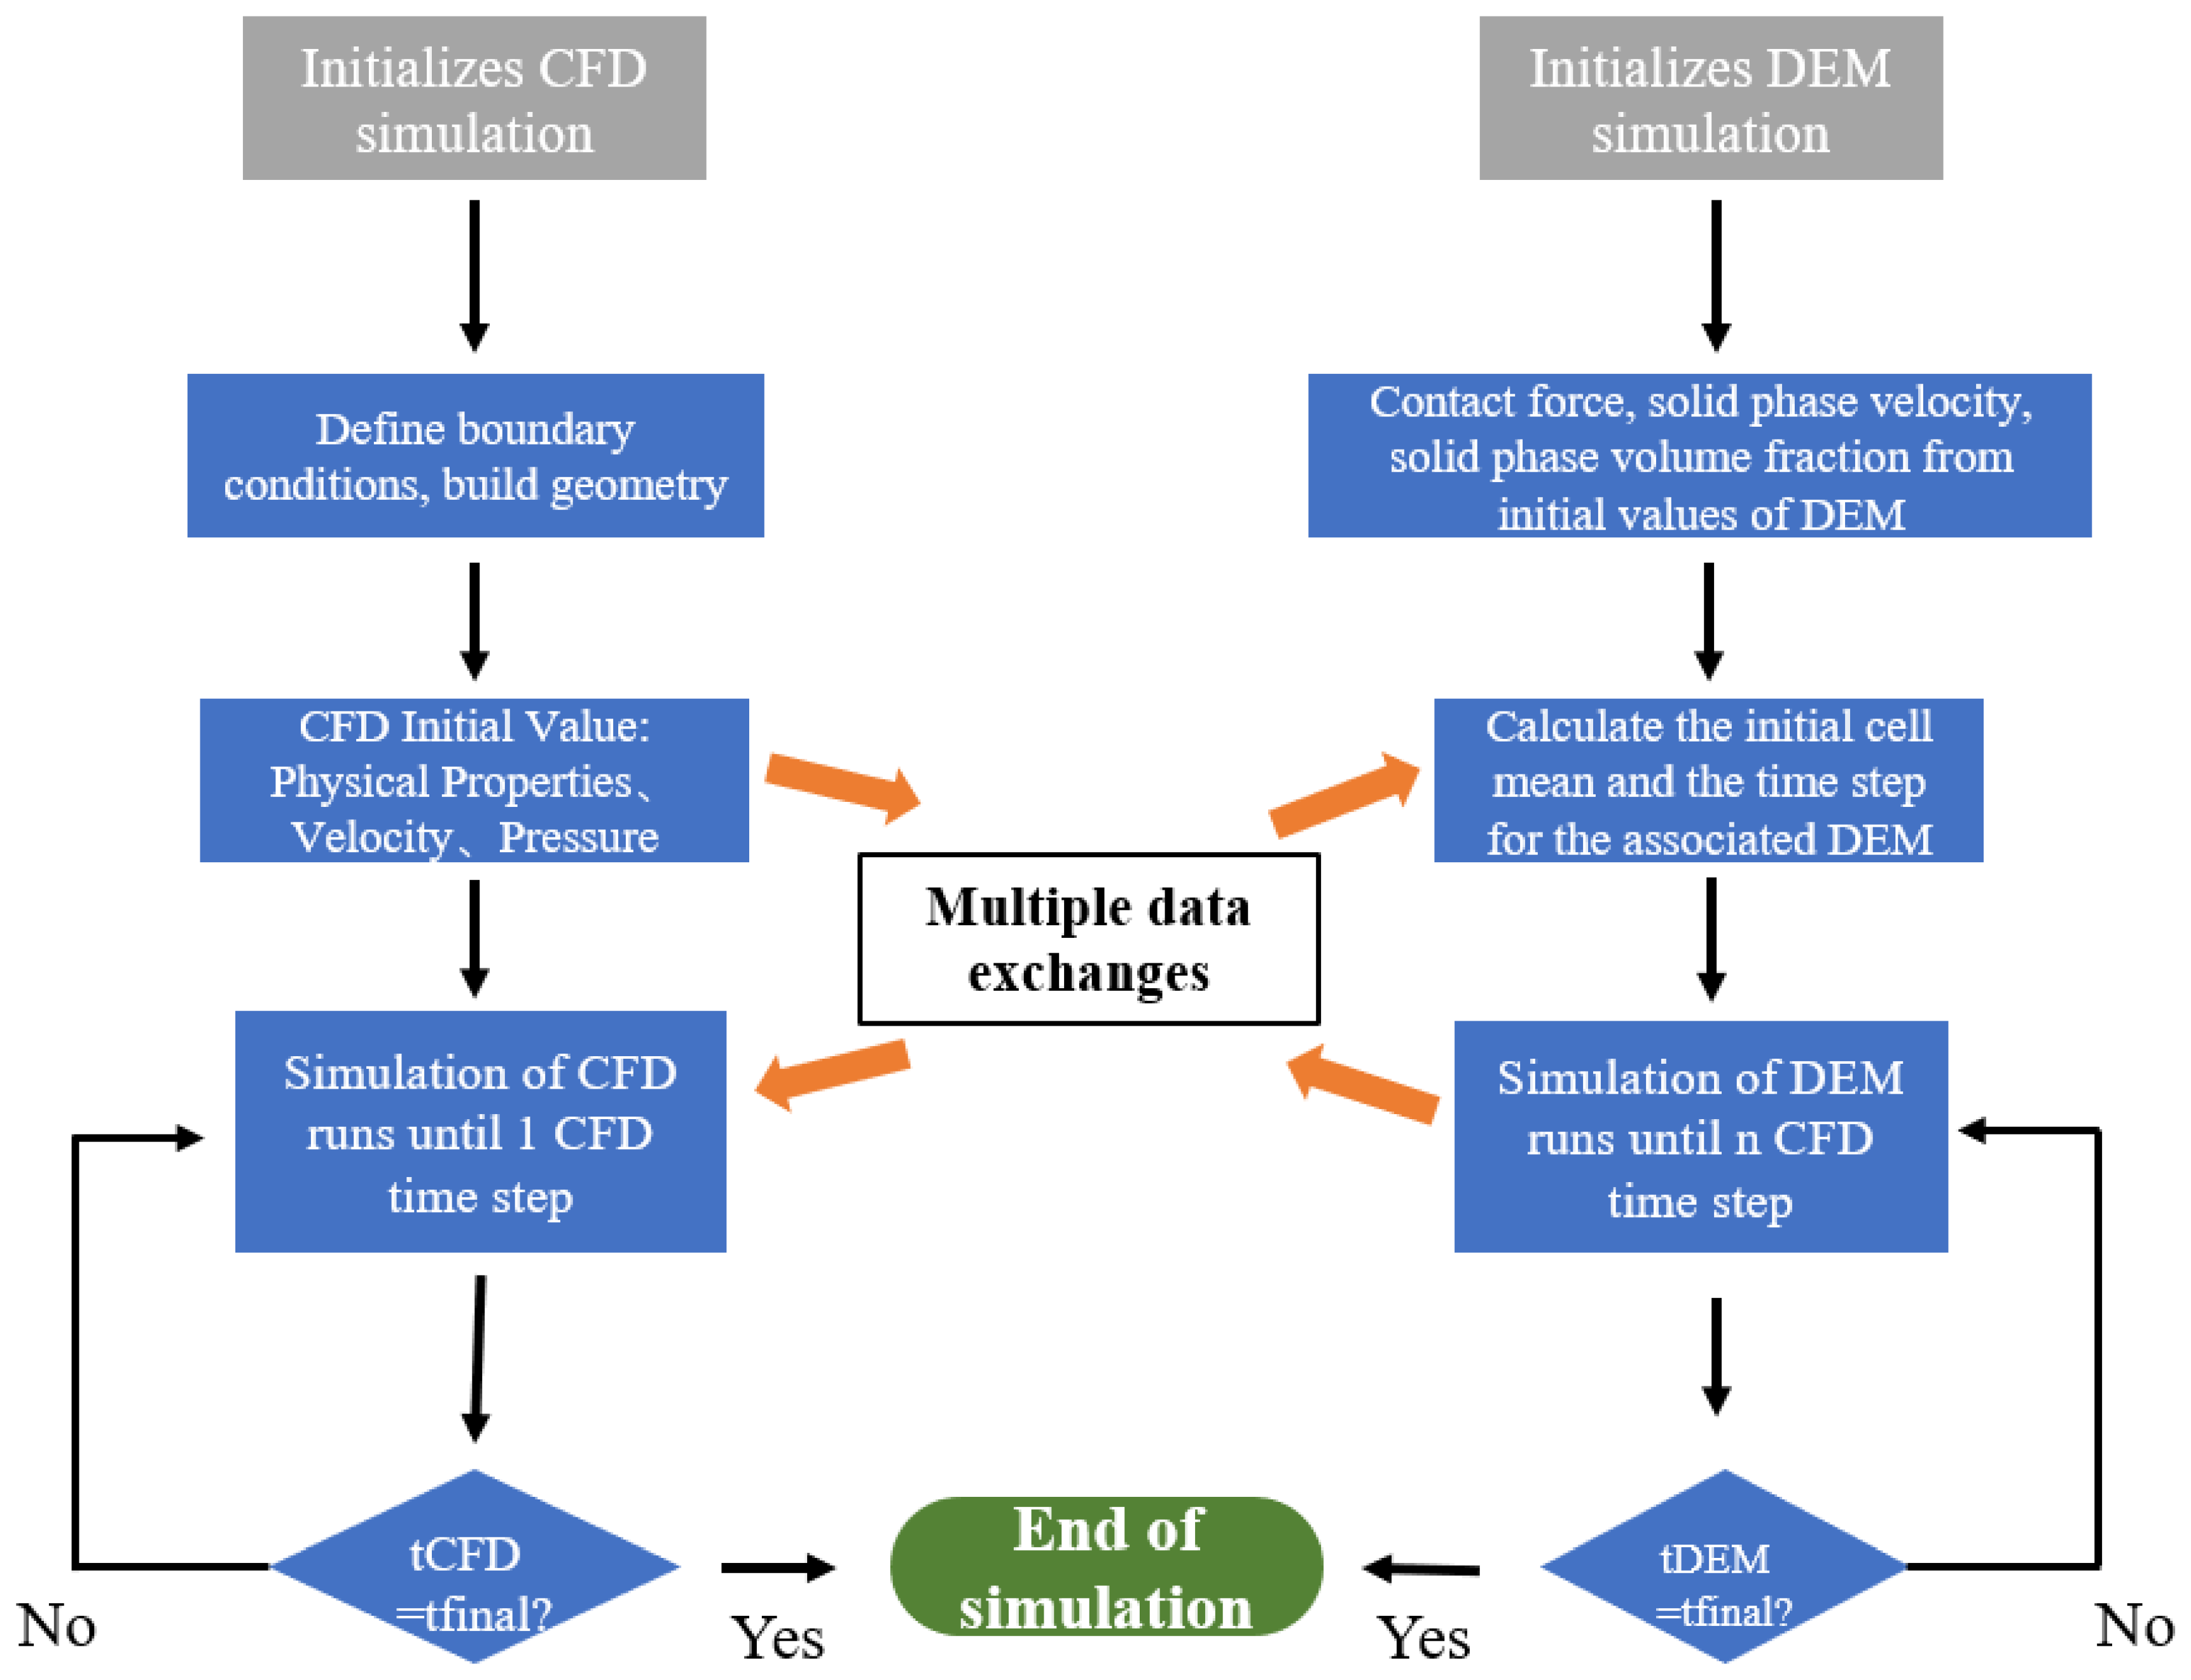
2.4. Coupling Algorithm

Based on the Euler–Lagrangian framework, Figure 3 shows a diagram of the two-way coupling of CFD–DEM. It allows CFD and DEM to exchange information for the transfer of momentum and energy. First, determine the time step in the DEM solver. On the CFD solver, the flow velocity, pressure, density, and viscosity data of each grid in the computational domain are transferred to the DEM solver, and the interaction between the discrete phase and the continuous phase is calculated on the DEM solver, and the discrete phase is obtained. The speed of translation and rotation and the data are transferred to CFD for a solution again. CFD determines that the time step is an integer multiple of the DEM time step, and the initial discrete phase field in CFD is updated. The schematic diagram of CFD–DEM coupling technology is shown in Figure 3.

3. Numerical Model

Since the mud screen is a cone, the drilling fluid carrying LCMs flows out of the tip first, and when the particles carried by the drilling fluid are blocked at the tip, they begin to flow out from the holes on both sides. Under the action of a fluid with a specific flow rate and viscosity, the particles are not enough to block the tool, which means that the plugging slurry can safely pass through the tool. If the LCMs are trapped in the screen, the amount of LCMs coming out of the holes is less than the amount of LCMs entering the screen, and the LCMs will gradually fill the entire screen. This will cause the entire steering-while-drilling tool to be blocked, which will bring safety risks to on-site drilling construction.

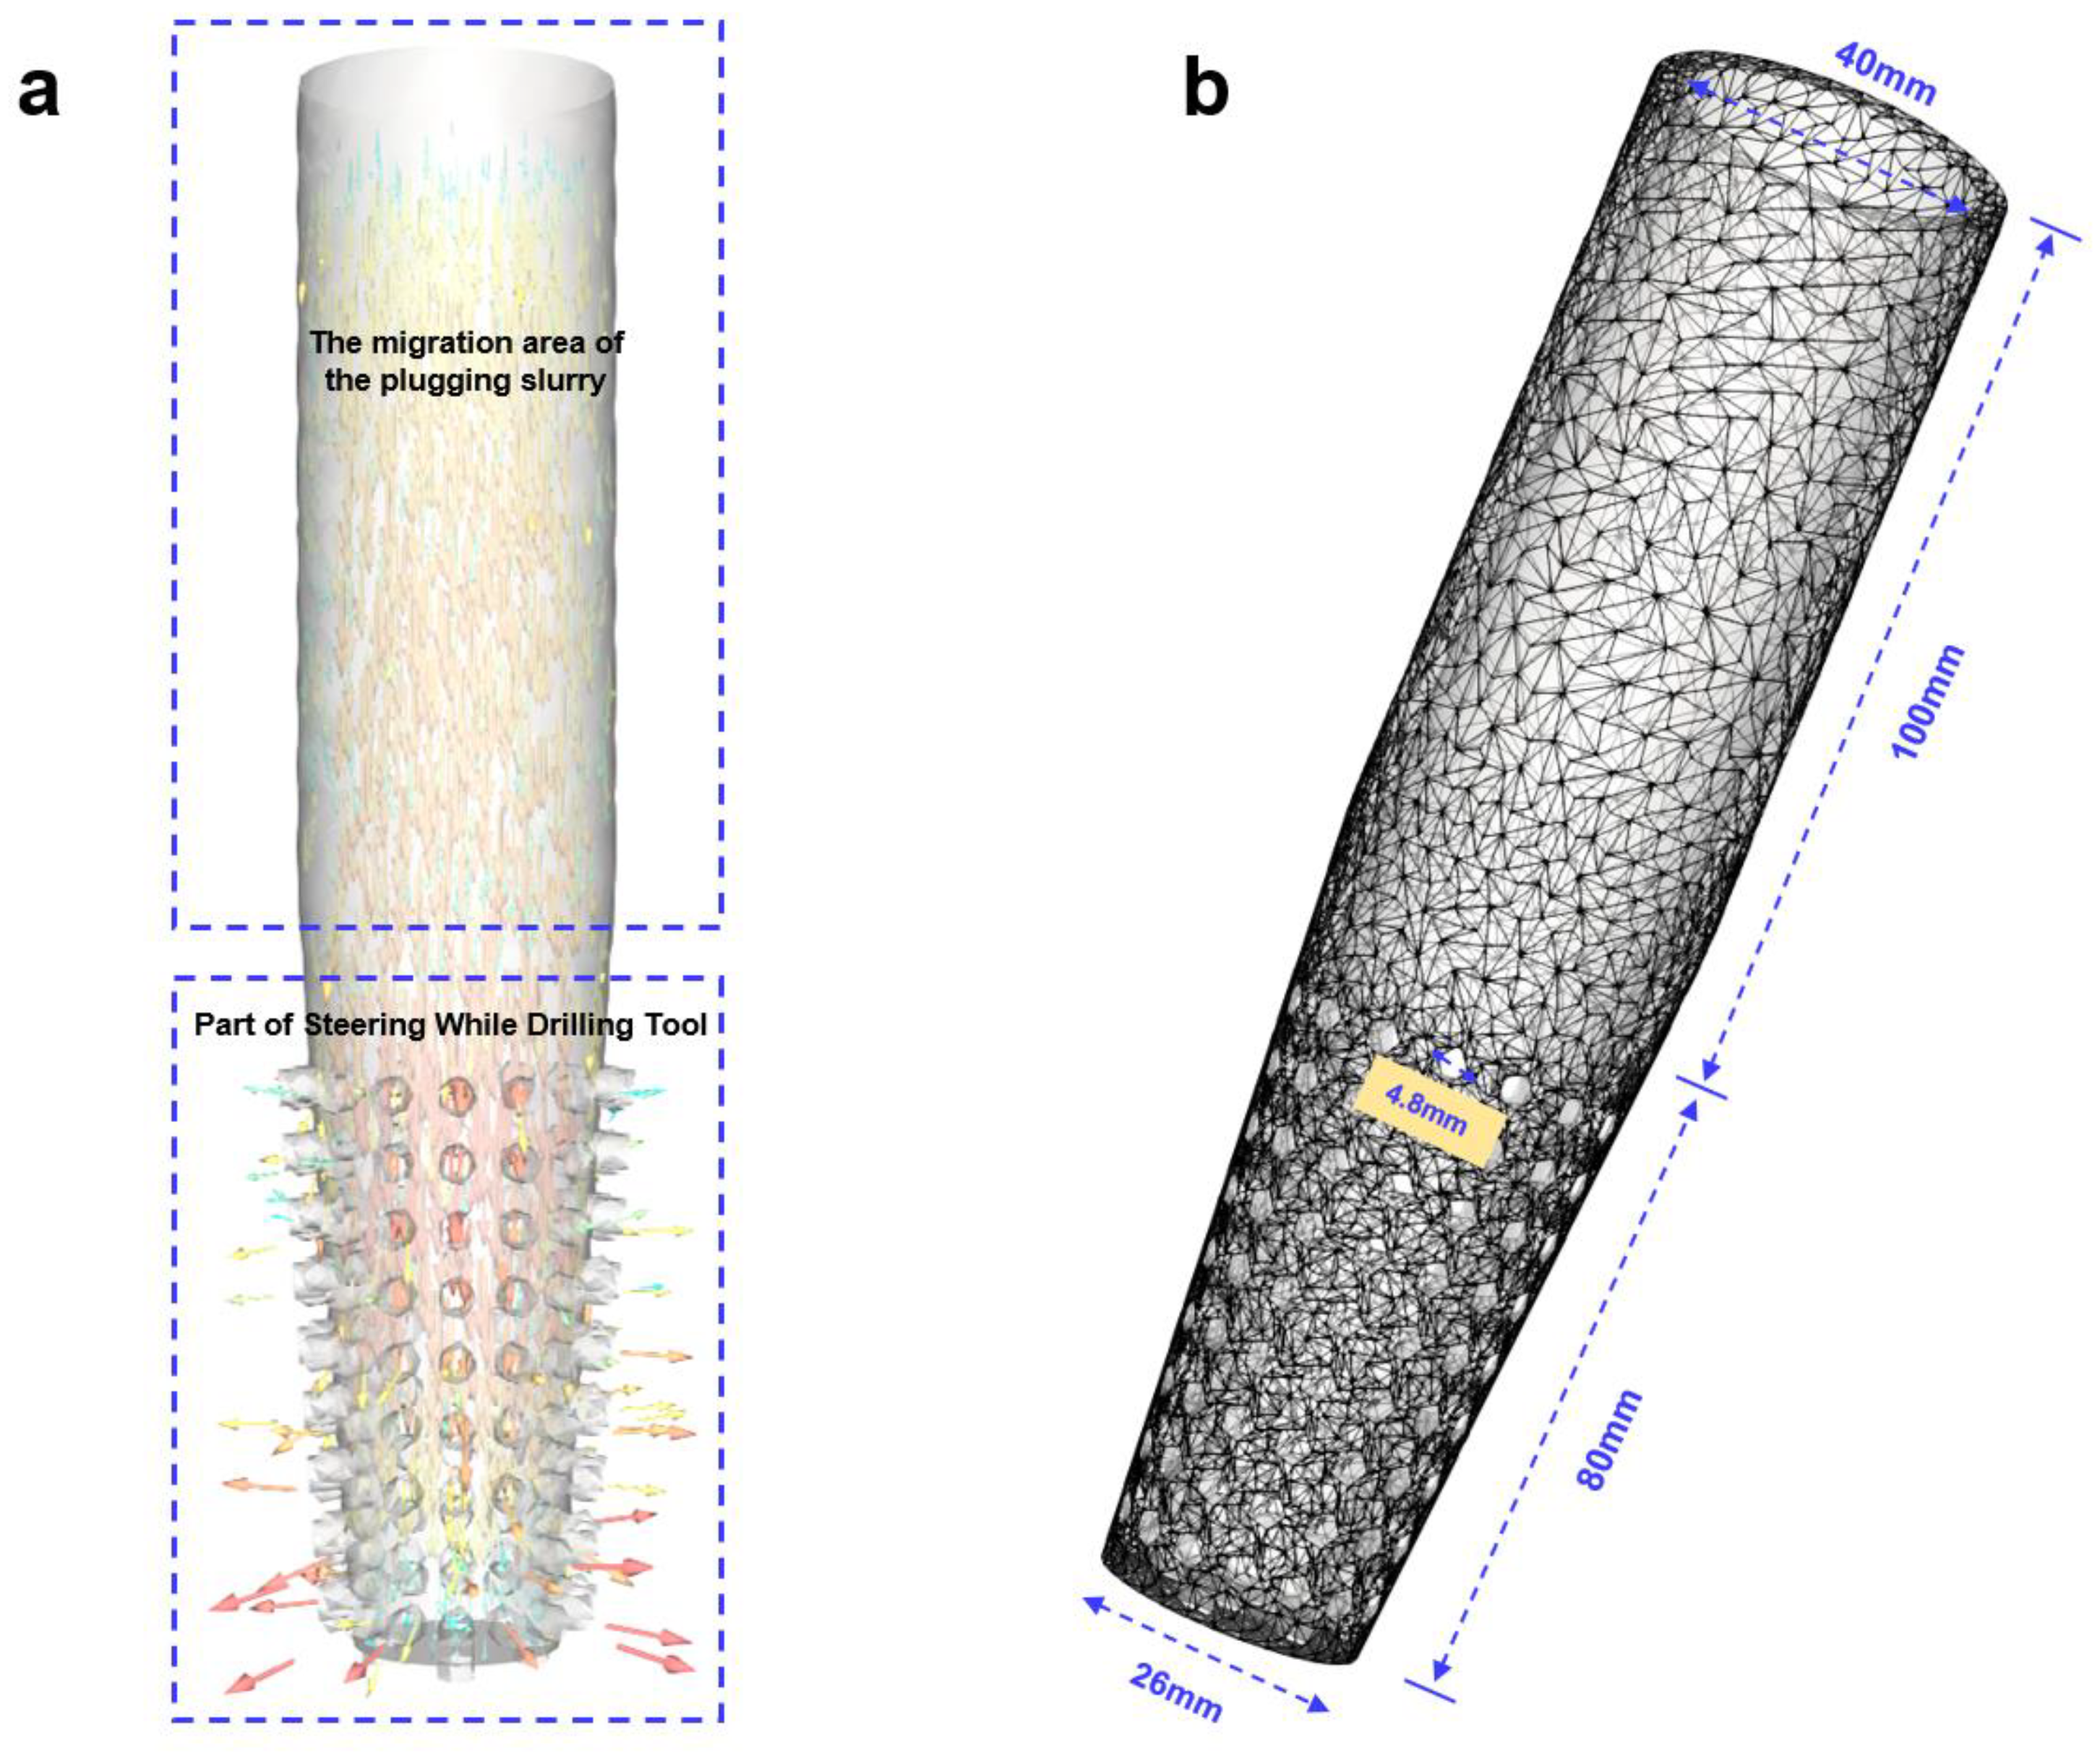
3.1. Architecture of the Model

Drilling fluid enters the tool from the inlet and flows out at the screen. The particles and fluid are in the cylinder part, forming a steady flow of particles. Figure 4a depicts the process of simulating materials for plugging while drilling from the drill pipe into the mud screen tool at a steady flow rate. The geometric model established in this study consists of two parts, the stable flow area of the plugging slurry and the screen structure. The boundary conditions of the entire geometric model are shown in Figure 4b. The stable flow area of the plugging slurry is a cylindrical structure with a cross-section of 20 mm in diameter and a length of 100 mm, providing a stable flow area for the plugging slurry, simulating the upper half of the steering-while-drilling tool. Particles are randomly generated on the cylindrical structure’s top face and carried into the cylindrical structure by the fluid. The particle concentration was adjusted by the particle formation rate, and the volume fraction ranged from 7.5% to 20%. The fluid inlet also sets the top of the circular structure. The fluid velocity at the inlet is set in the range of 6.6 m/s~10 m/s to simulate the actual displacement of drilling fluid during drilling, ranging from 30 m3/h to 50 m3/h.
The diameter of the circle at the upper end of the mud screen tool is 20 mm, which is consistent with the cross-sectional diameter of the cylindrical structure. The diameter of the circle at the lower end is 26 mm. The overall height is 80 mm, and the cone angle is −8.58°. The conical part contains 144 holes with a diameter of 4.8 mm. The scale of the model is 1:1 with the size of the actual tool. The dimension of the entire computational domain is 0.0446 m × 0.1805 m × 0.0446 m, with a total of 54,891 boundary faces and 61,478 boundary nodes. Based on issues such as the computational stability of the solver, the accuracy of the drag force calculations, etc., the size of the mesh is kept at more than three times the diameter of the largest particle being simulated. Therefore, the maximum size of the unit is 6 × 10⁻³ m, and the minimum size is set to 3 × 10⁻³ m. The walls are set as no-slip boundary conditions.

3.2. Setting of Boundary Conditions

The inlet boundary condition of the fluid field is set to a specific velocity inlet, the outlet boundary condition is set to the pressure outlet, and the outlet pressure is standard atmospheric pressure to simulate the actual situation of drilling tools in the formation. Select the standard k-epsilon(2eqn) for the turbulence model of the fluid. For the wall function of the fluid field, select the near-wall treatment of the scalable wall function. Based on the collection and calculation of fluid parameters in the plugging operation at the drilling site, the drilling fluid in the drilling tool mostly flows in the form of laminar flow. Therefore, according to the calculated value, the turbulence intensity of the fluid is set to 1%. When leakage occurs in the formation, the leakage rate is lower than 10 m3/h, and the method of plugging while drilling is adopted. The concentration of the MWD agent is generally controlled at 5% to 25%, and the particle size is less than 2 mm. During the drilling process, the displacement of drilling fluid is different under different working conditions. This study divides it into three types: low (55 m3/h), medium (90 m3/h), and high (125 m3/h), type of displacement. Other parameter settings are the same as the actual field parameters, see Table 1 for details.

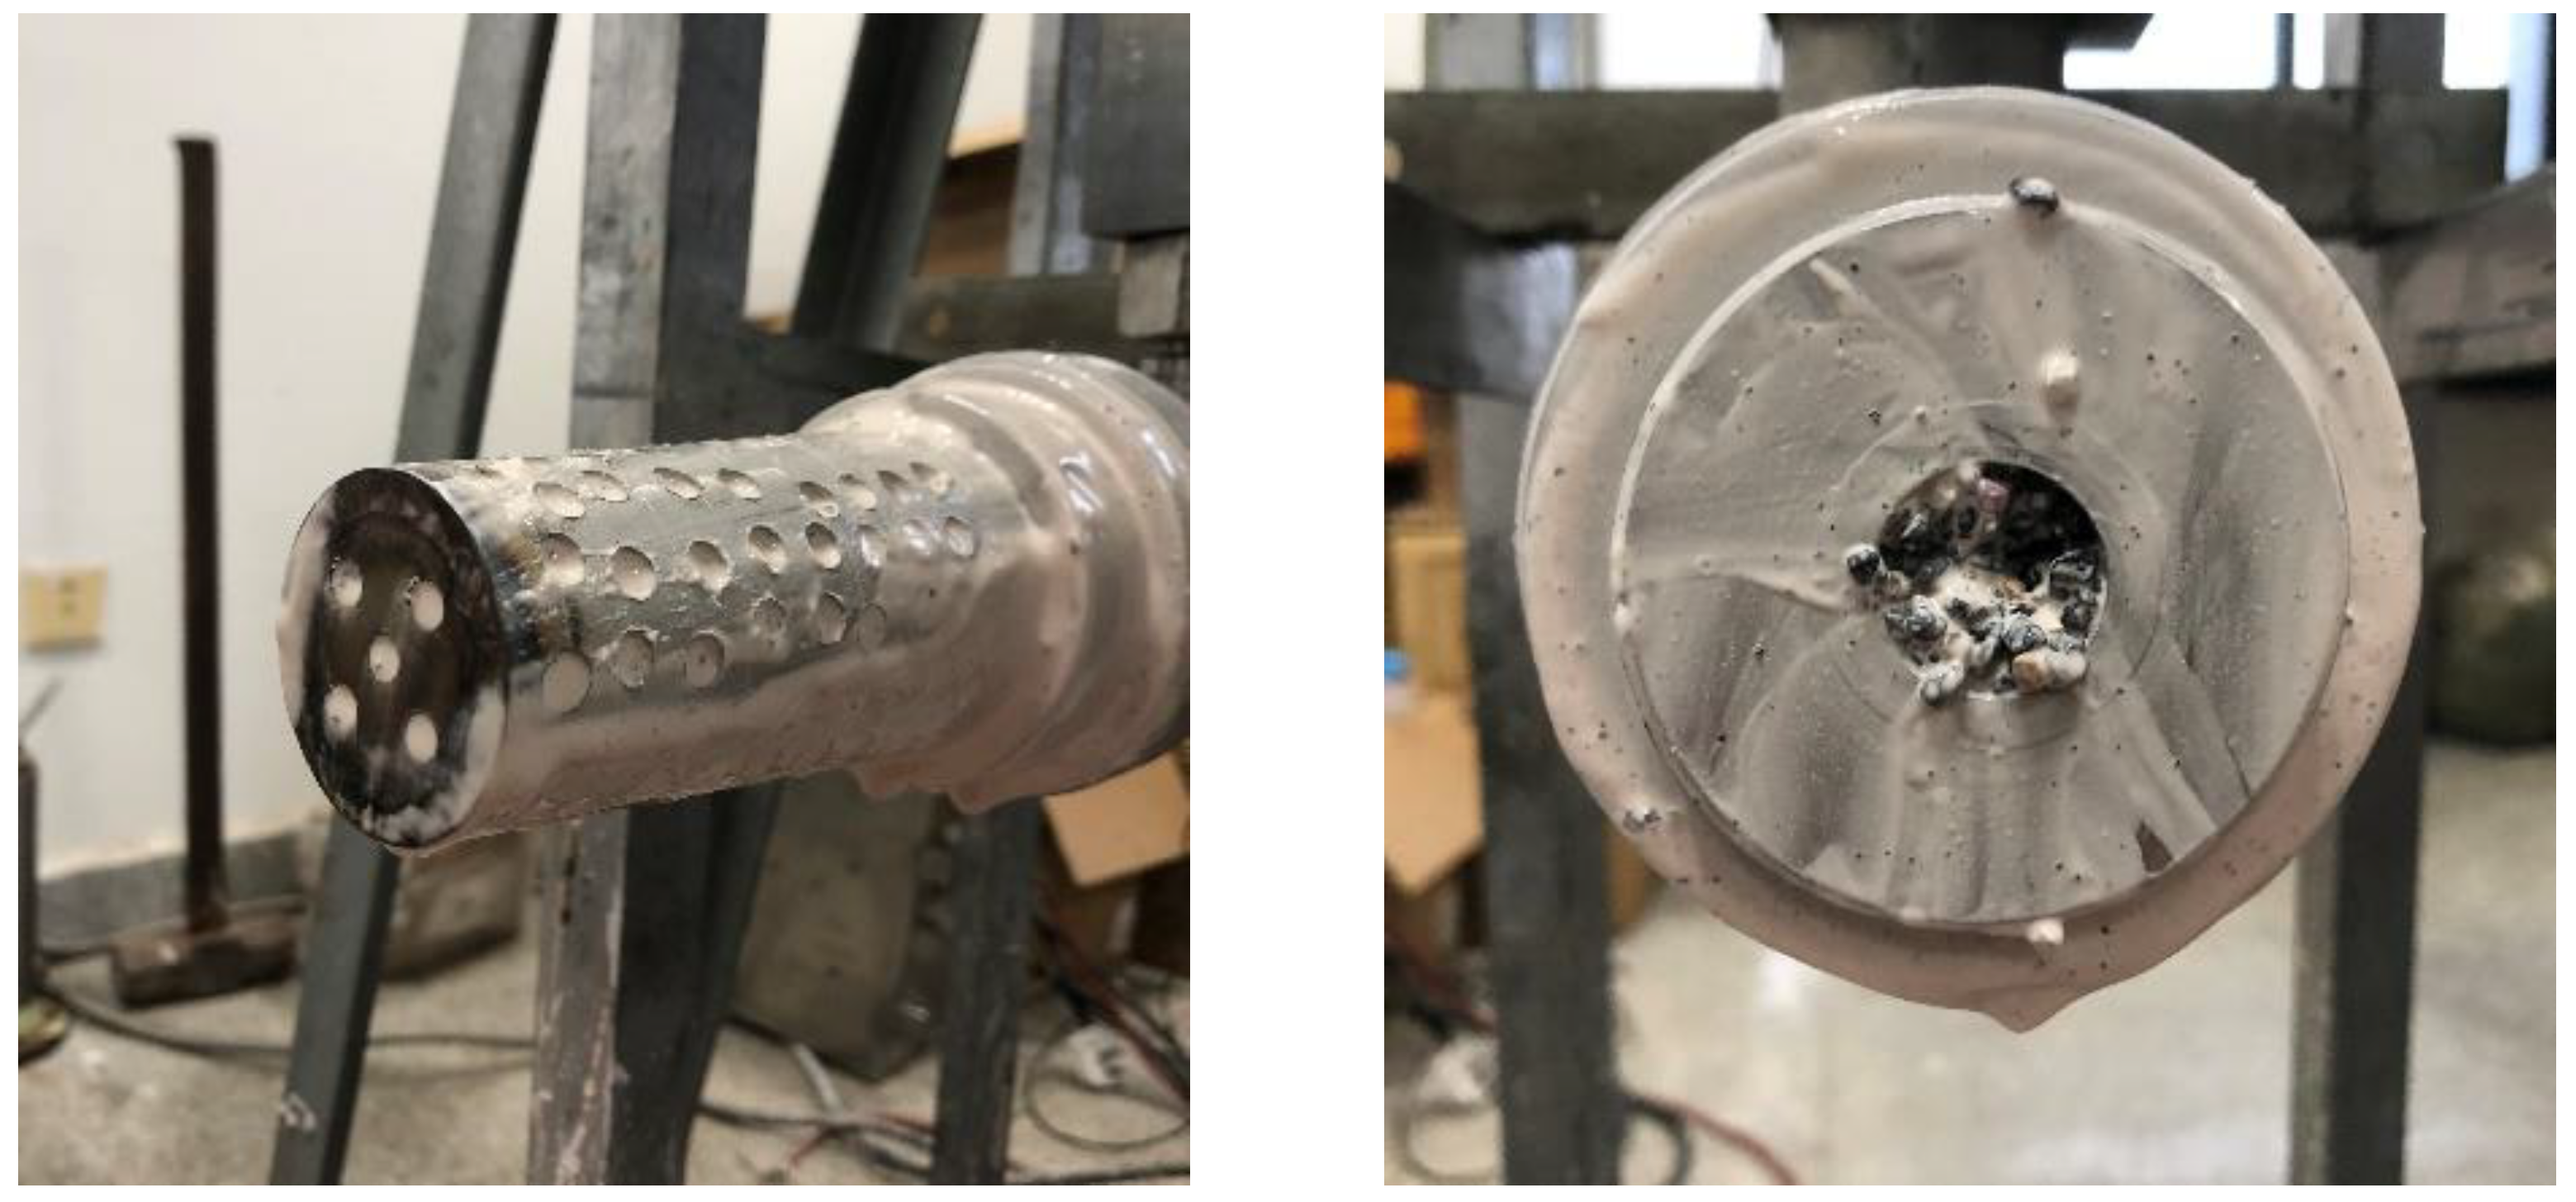
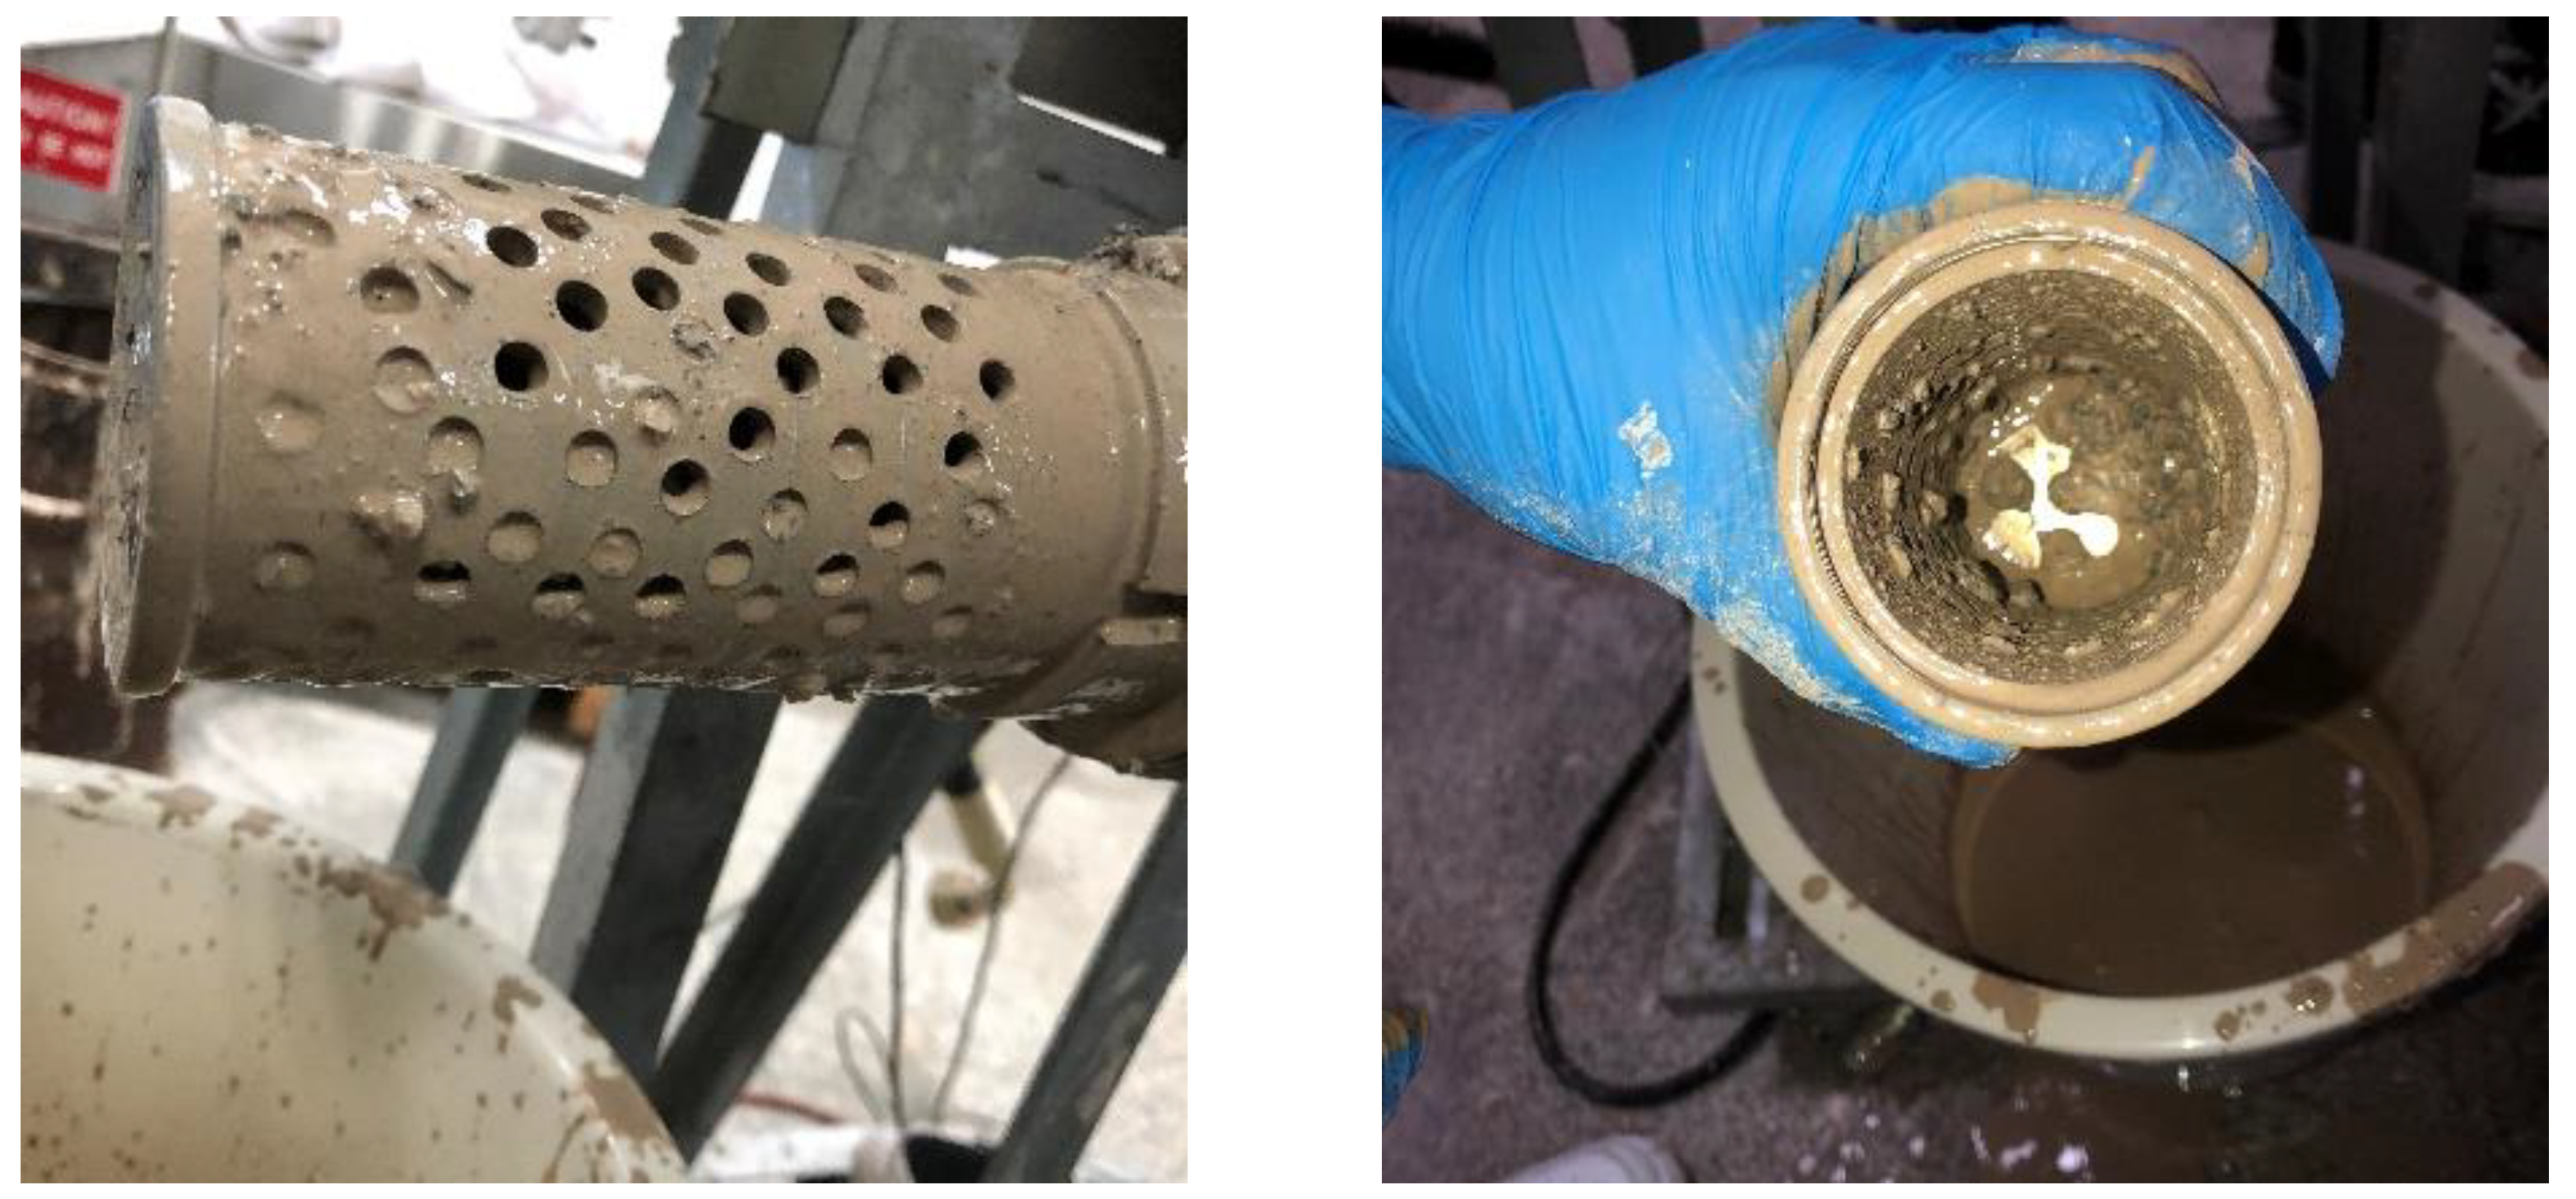
3.3. Validation of the Model

An experimental device for testing the flow properties of Materials for plugging while drilling in the mud screen tool was established indoors. The experimental device consists of three parts: pump, simulated wellbore, and simulated mud screen, as shown in Figure 5. The construction of the simulated mud screen is derived from the tip part of the actual mud screen. Due to the natural drilling fluid circulation environment, the tip of the mud screen is the most sensitive position for LCMs. According to feedback from field operations on the rig, whether or not it is plugged by LCMs determines whether or not the entire tool is plugged by LCMs. Therefore, considering the feasibility of indoor experiments, the most easily blocked area of the mud screen is used as the experimental model. Because the mud screen is placed inside the drill pipe close to the MWD in the design of the drilling tool, the mud screen for indoor simulation is also placed in the cylinder, which simulates the drill pipe.
Therefore, the dynamic viscosity of the drilling fluid in the room is 0.03 kg/m·s, and the density is 1.3 g/cm3. The materials for plugging while drilling select regular spherical particles, which are as consistent as possible with the shape and properties of the LCMs used in the field. The drilling fluid is driven by a screw pump and the number of materials for plugging while drilling is set to 5%. Due to the limited performance of the indoor screw pump, the pumping displacement of the drilling fluid was set to 5 m3/h. Under this condition, the flow properties test was carried out on materials for plugging while drilling with different particle sizes, and the particle size ranged from 0.5 mm to 1.5 mm.
Figure 6 shows the simulation and laboratory results of the flowability of materials for plugging while drilling. The simulation predictions agree well with the indoor results on a larger scale. However, when the particle size of LCMs is 0.9 mm, there is a specific difference between the two results. This is because the LCMs in the laboratory experiments do not flow in a uniform state during the cycle. The internal structure of the pump and the influence of gravity lead to the accumulation of LCMs during the circulation process, resulting in an excessively high concentration of some structures, thus making the experimental results more prone to tool blockage. Overall, the developed numerical model has high accuracy and can be used to simulate the fluid-solid flow of materials for plugging while drilling in the mud screen.
Figure 7 and Figure 8 show the different results of the flow properties of the materials for plugging while drilling in the simulated mud screen in the laboratory experiment. It is evident that when the LCMs fill the entire tool, drilling fluid cannot flow through it. It is conceivable that once the LCMs clog the tool in actual drilling situations, this will be a challenging problem. The problem can only be solved once the drilling is stopped, the drill pipe is lifted, and the MWD is taken out, which is time-consuming.

4. Results and Discussion

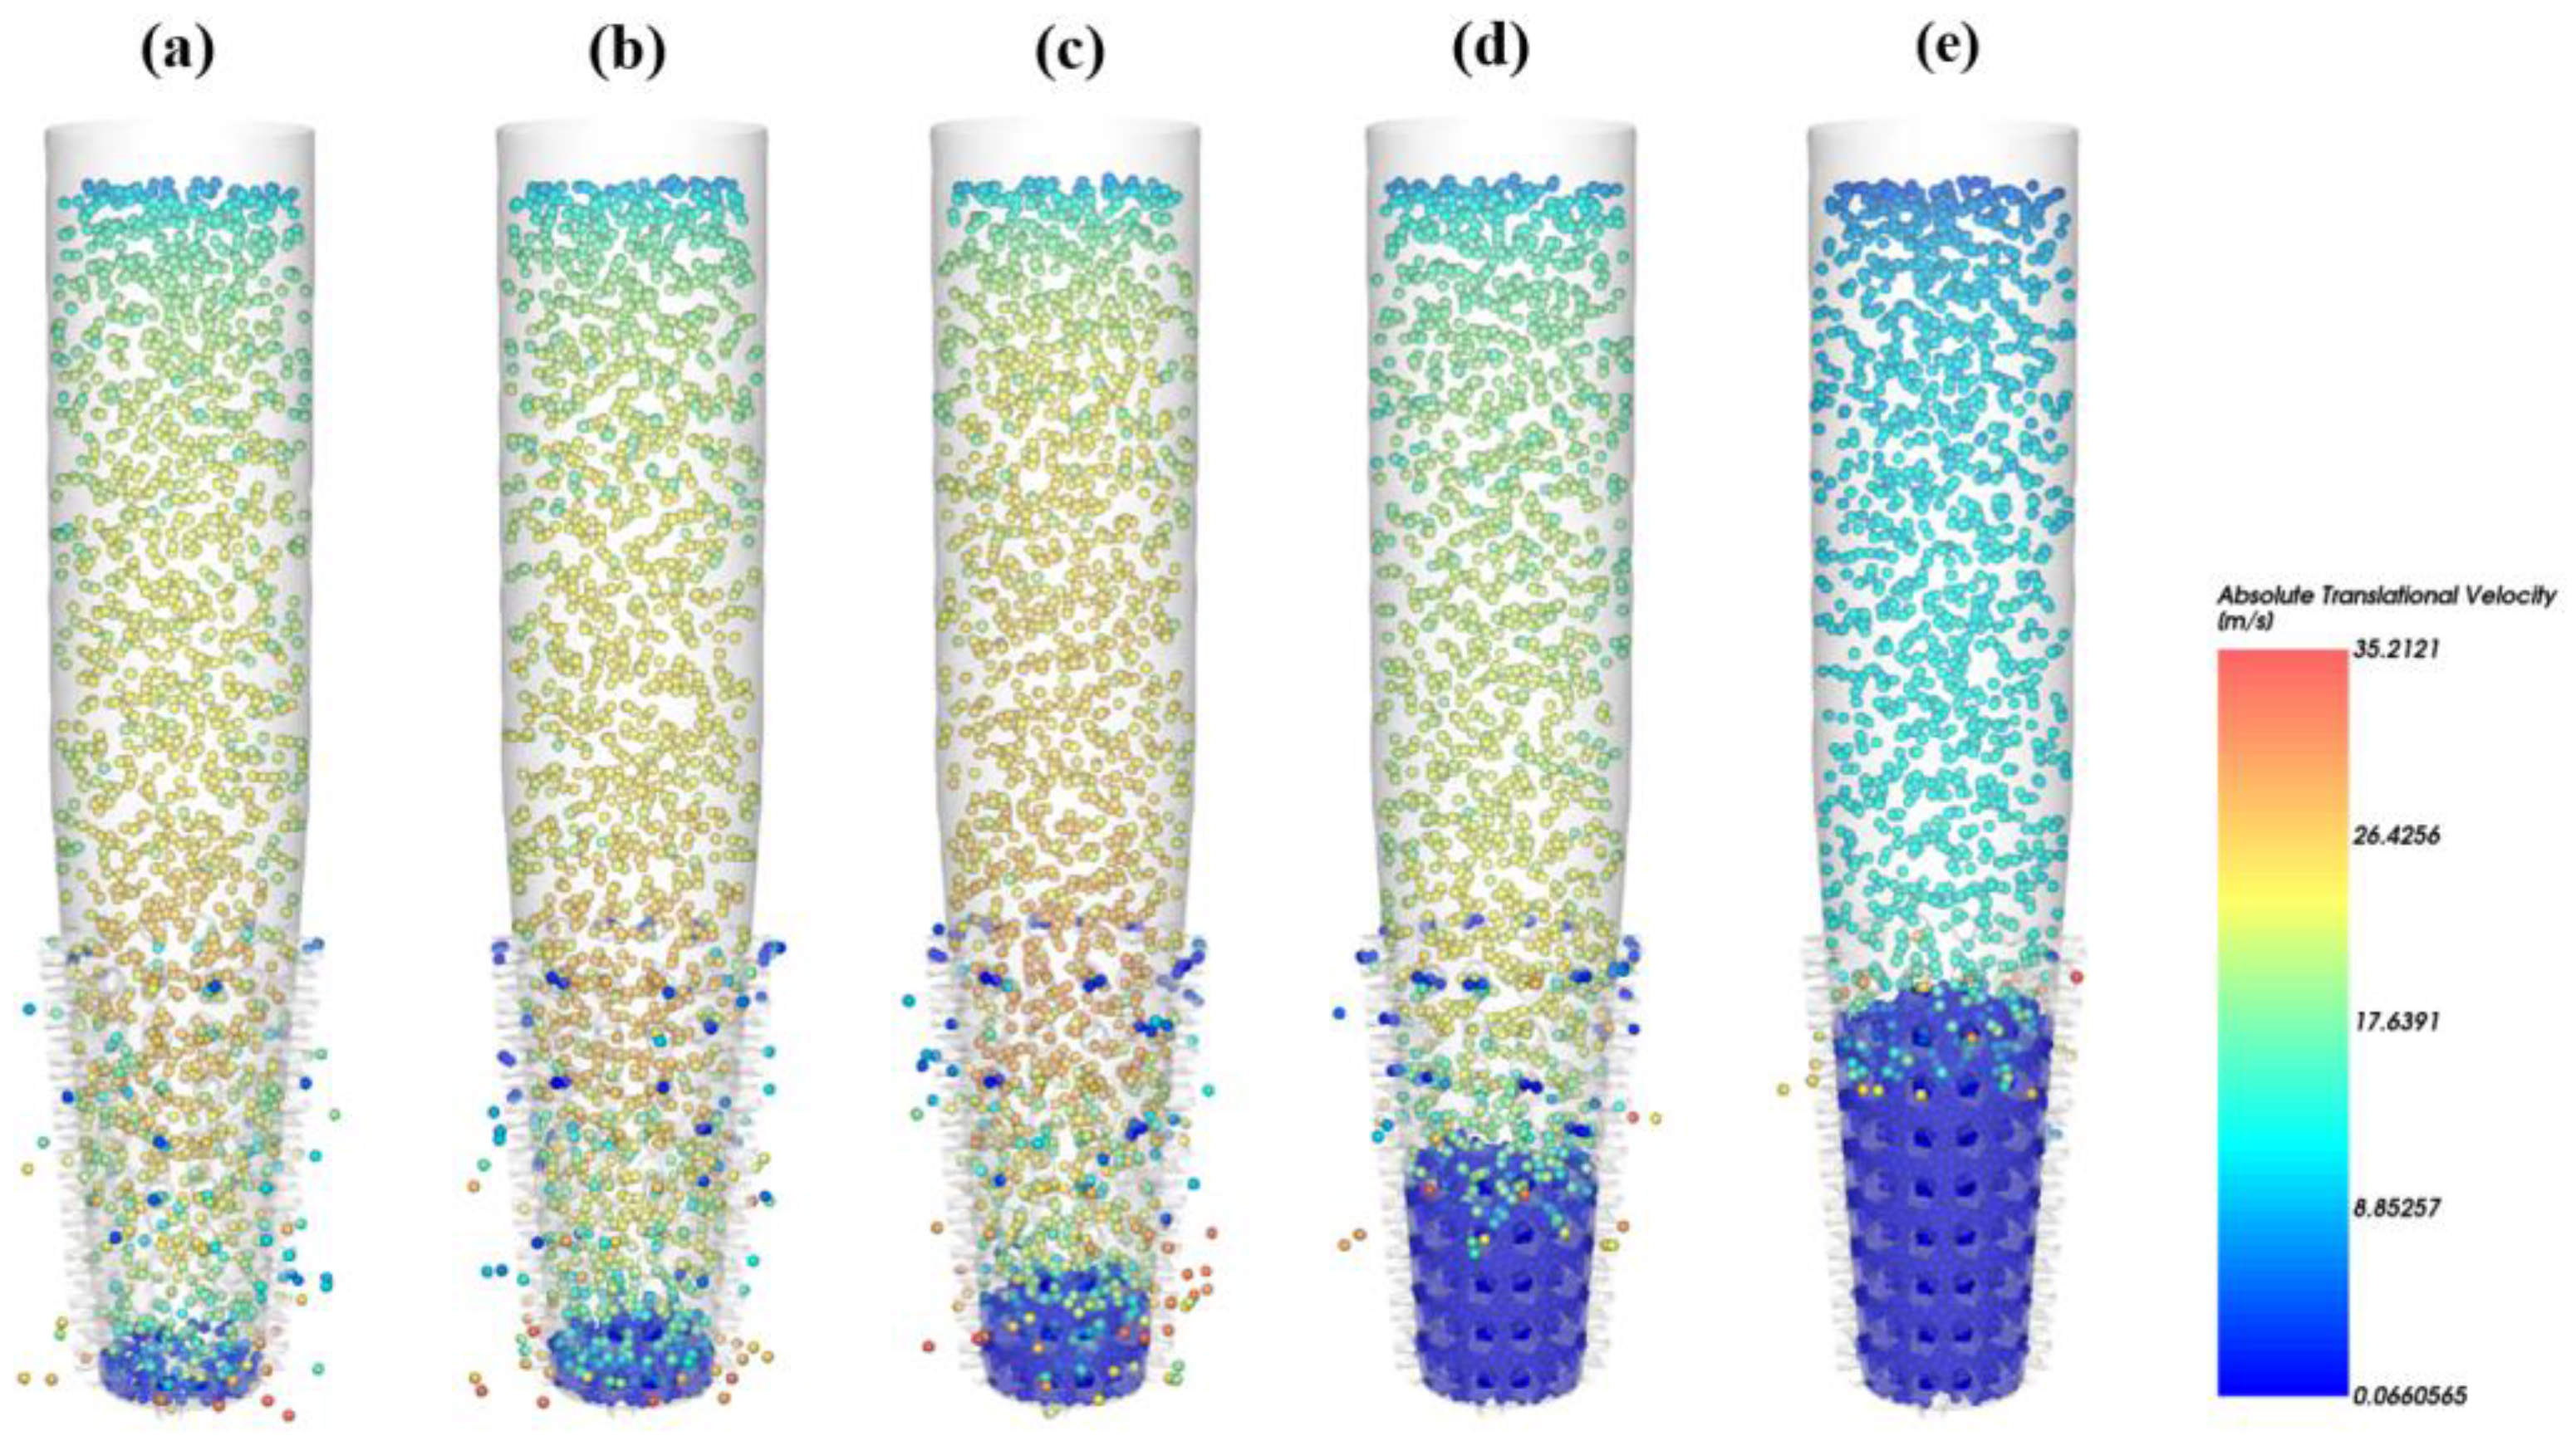
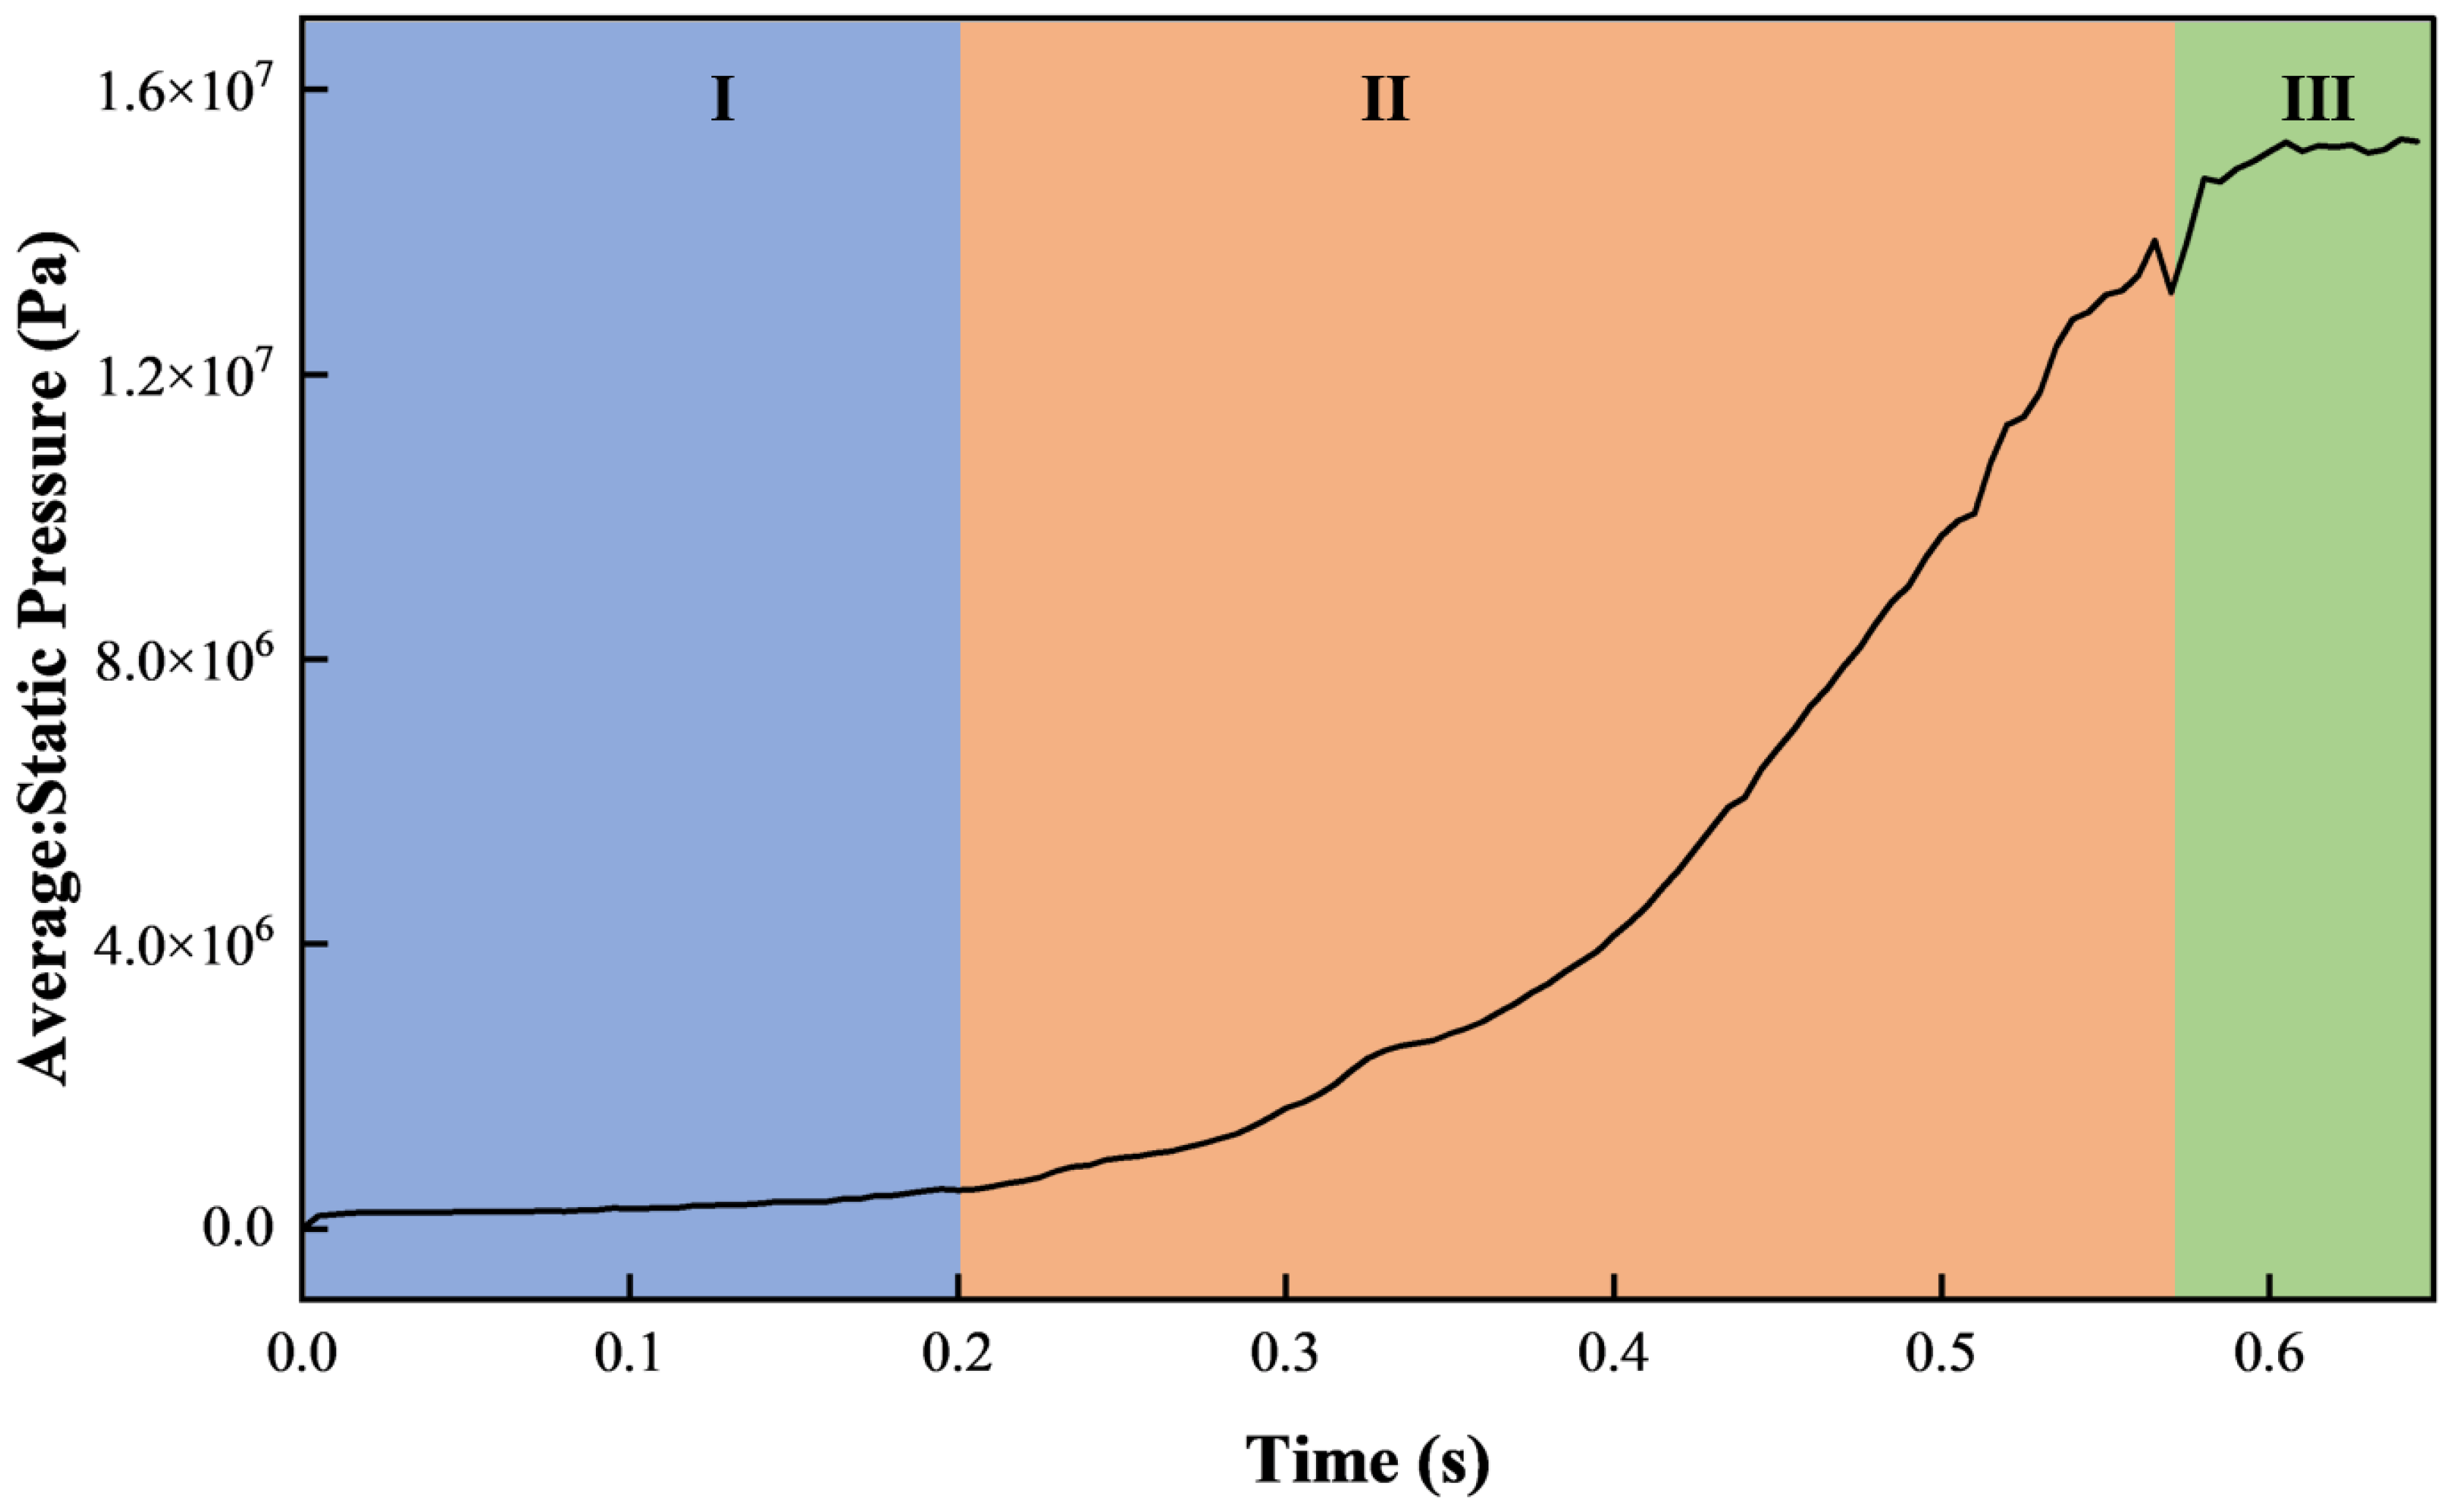
4.1. Circulation Process of LCMs in Mud Screen

It is necessary to understand how the displacement and retention of LCMs behave in the mud screen. The simulation results of the migration of LCMs in the mud screen are shown in Figure 9. The results show that the LCMs migrate smoothly from the drill pipe with a gradual increase in velocity. When the LCMs migrate into the mud screen, the speed decreases. Part of the LCMs overflowed from the holes of the mud screen, and the remaining part of the LCMs remained at the tip of the mud screen. As the number of LCMs entering the mud screen from the drill pipe gradually increased, it was much larger than the number of LCMs overflowing from the hole. At this point, the blockage develops from the tip portion of the mud screen to the entire mud screen [35]. This clogging develops rapidly. If you want to avoid clogging, you should try to control the particles and not stay at the mud screen’s tip.
Accordingly, the whole process can be divided into three stages, as shown in Figure 10. I, Migration of LCMS, referring to Figure 9a,b. II, LCMS retention, refer to Figure 9c,d. III, LCMS stacking, refers to Figure 9e. In the first stage, LCMS is carried by the fluid from the drill pipe to the mud screen. At this time, the entering particles are the same as the overflowing particles, and no particles block the opening of the mud screen, so the pressure of the fluid is maintained at a superficial level. In the second stage, the hole of the mud screen is gradually blocked by the remaining particles, and the passage of the fluid is blocked, resulting in an increase in the fluid pressure. In the third stage, as time increases, all the openings of the mud screen are blocked by LCMS, the main overflow channel of fluid disappears, and it can only overflow from the pores of LCMS particles. The fluid field Is restored to a new equilibrium, and the fluid pressure remains relatively stable without significant changes.

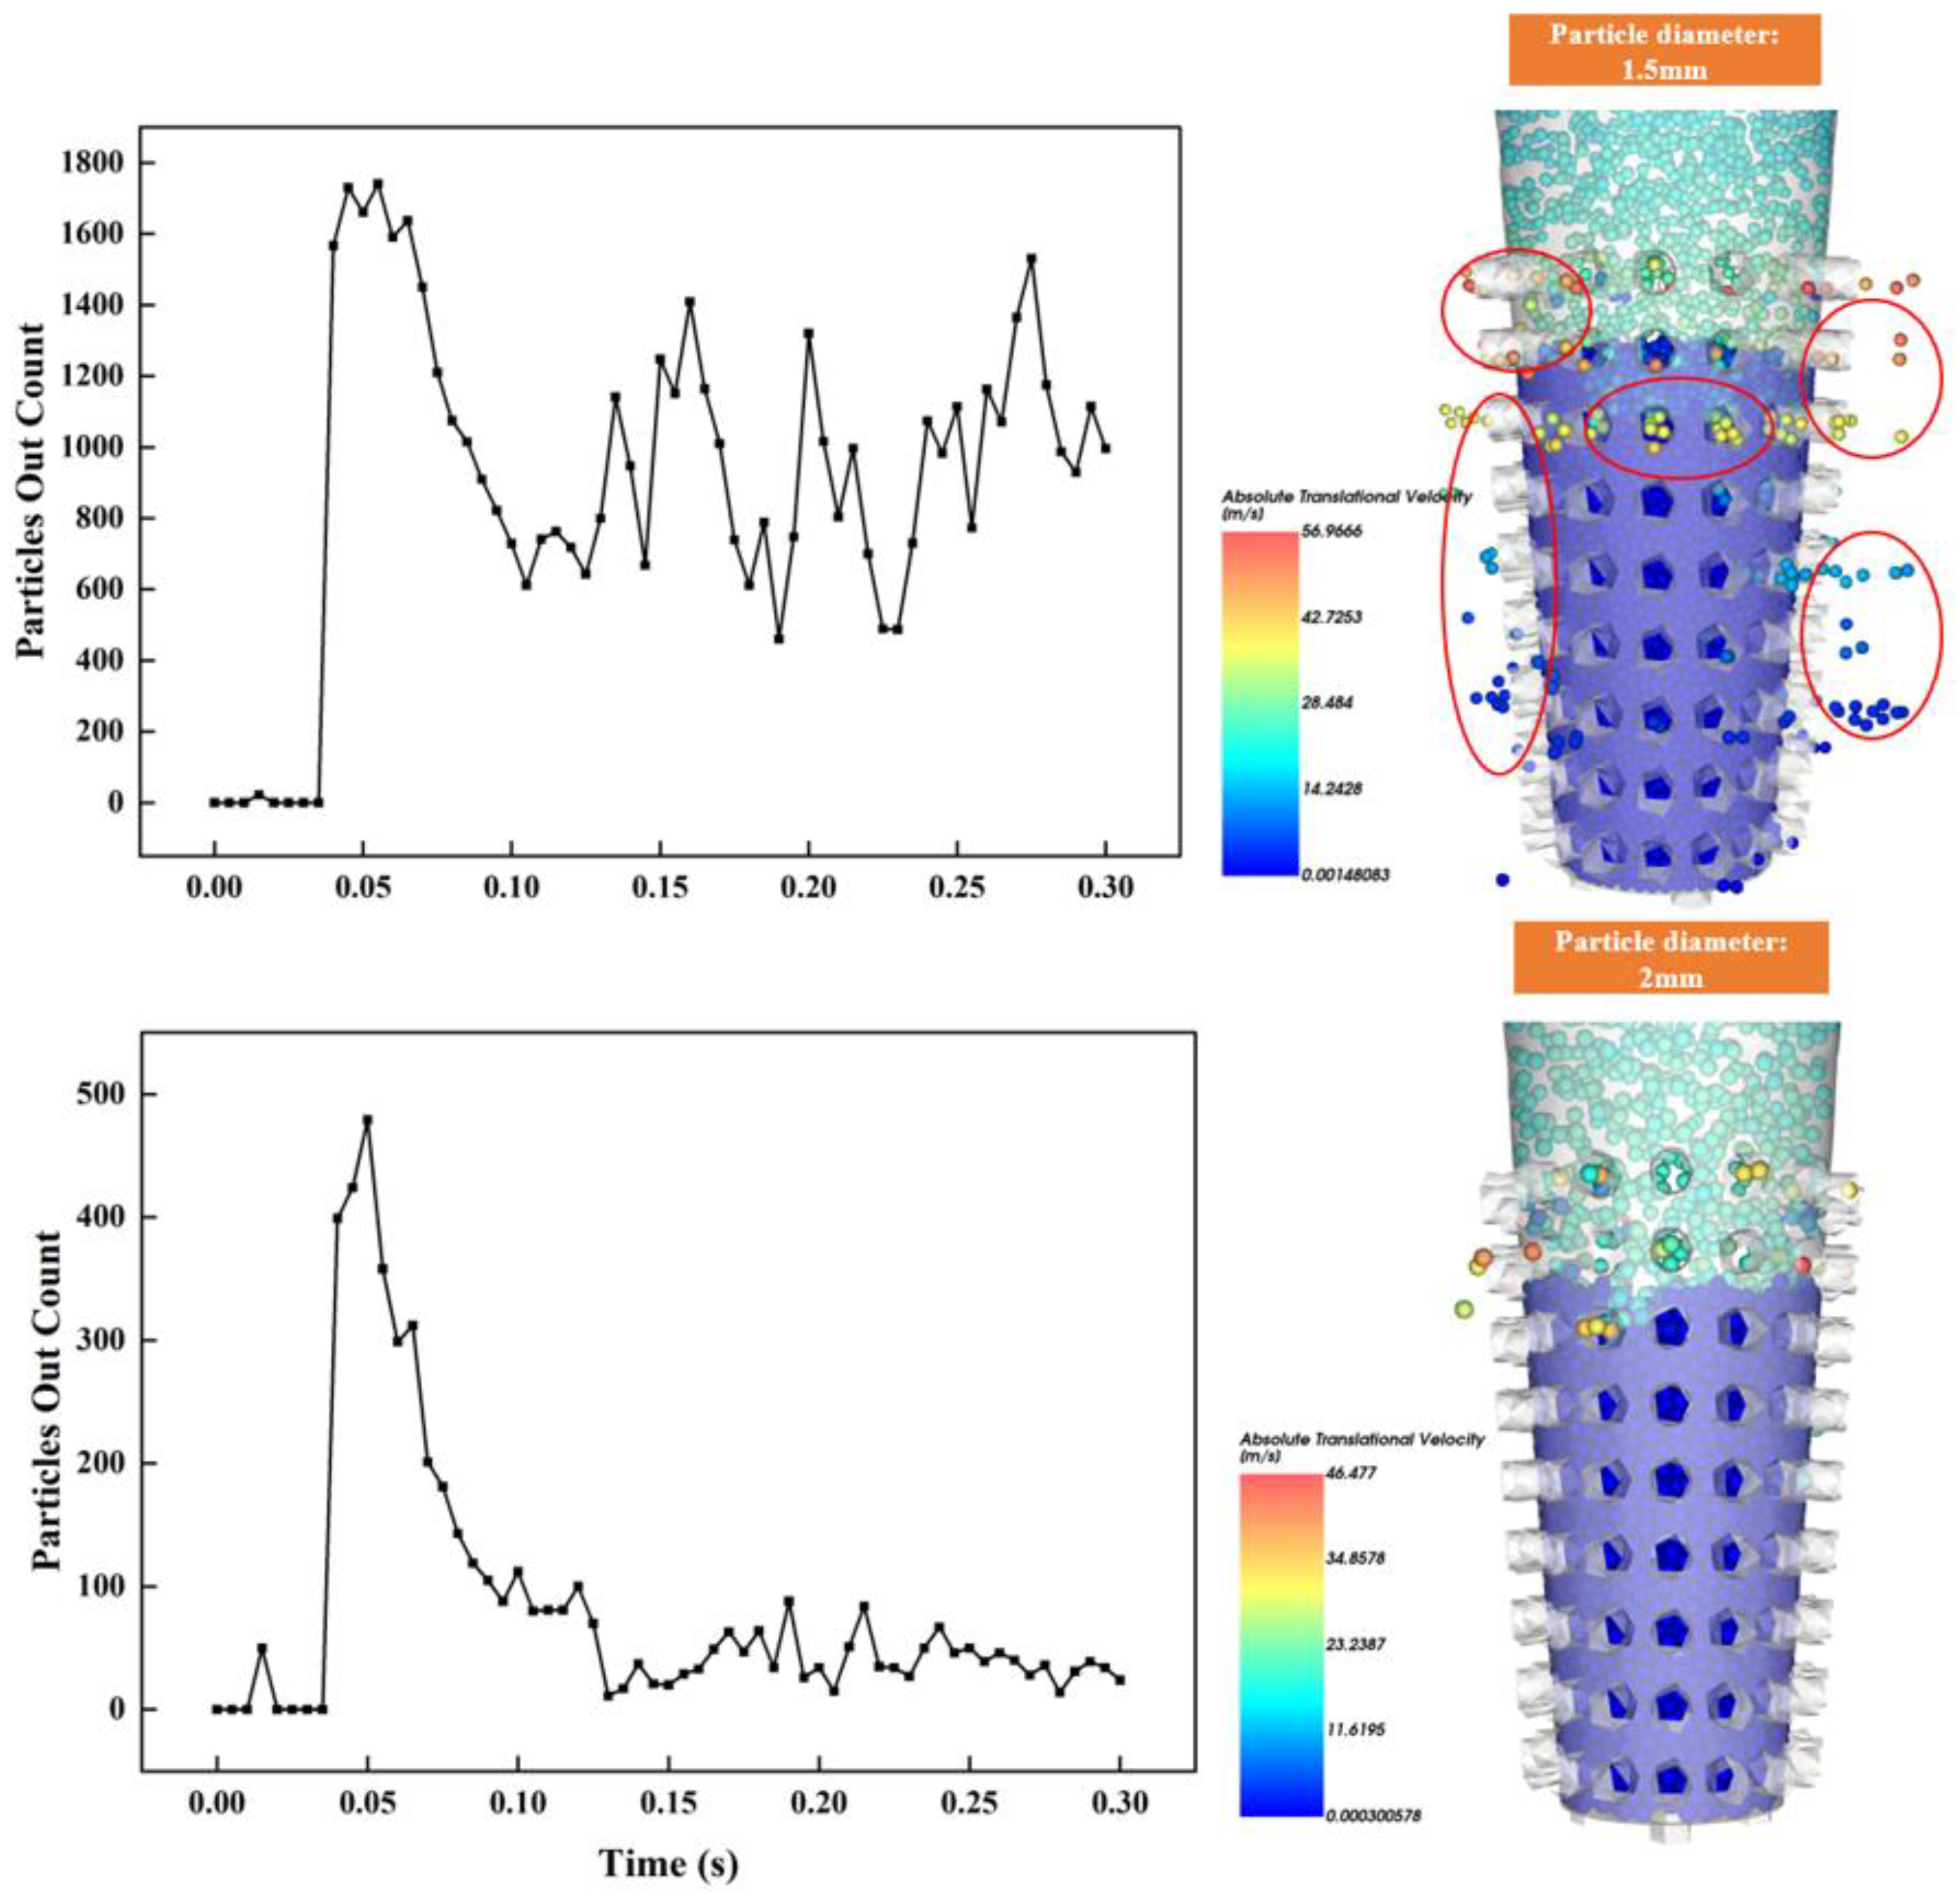
4.2. Effect of Particle Size of LCMs on Flow Properties

In order to intuitively understand the effect of particle size of LCMs on the flow properties in the mud screen. The particle size range of LCMs is set at 1.1 mm~2.2 mm, and the range of mass flow is set at 1~6 kg/s. The flow-through results under different particle size ranges and mass flow conditions were tested. The differences in the occurrence time of LCMs with different particle sizes after plugging the tool were compared. As well as the particle size of LCMs, the behavior of LCMs clogging tools is classified.
The larger the particle size of the LCMs, the greater the blocking probability of the mud screen tool. According to the results given in Figure 11, when the particle size is more significant than 2.0 mm, the tool will be blocked regardless of the mass flow size pumped by the LCMs. It can therefore be concluded that for MWD, LCMs over 2.0 mm should be prohibited from being added to drilling fluids. It can cause damage to the drilling tool. At the same time, when the particle size of the particles is less than 1.2 mm, the flow properties of LCMs in the tool are good, and we think that the LCMs below 1.2 mm are in the safe range. When the particle size is between 1.2 mm and 2.0 mm, the mass concentration of LCMs needs to be considered, which is necessary to ensure the tool’s safety.
In Figure 12, at a mass flow of 3 kg/s, the increase in particle size accelerated the process of tool plugging by LCMs. The larger the LCMs, the faster the entire tool is filled. Figure 13 explains the difference between the two types of particle size in filling the entire tool. When the particle size of LCMs is 1.5 mm, the tool is filled with LCMs because the speed of LCMs entering the tool is greater than the speed of overflowing the tool. It can be seen that although the LCMs have blocked the entire mud screen, the small LCMs still overflow from the punched holes. Its overflow curve is also wavy. When the particle size of LCMs was 2.0 mm, the LCMs bridged in the pores, and the subsequent LCMs could not overflow from the pores. It can be seen from the overflow curve of the particles that when the number of particles overflowed reaches a peak value, it decreases rapidly. Through the study of these two different types of plugging behaviors, we learned that expanding the overflow rate of LCMs is the key to improving the flow-through performance of LCMs.

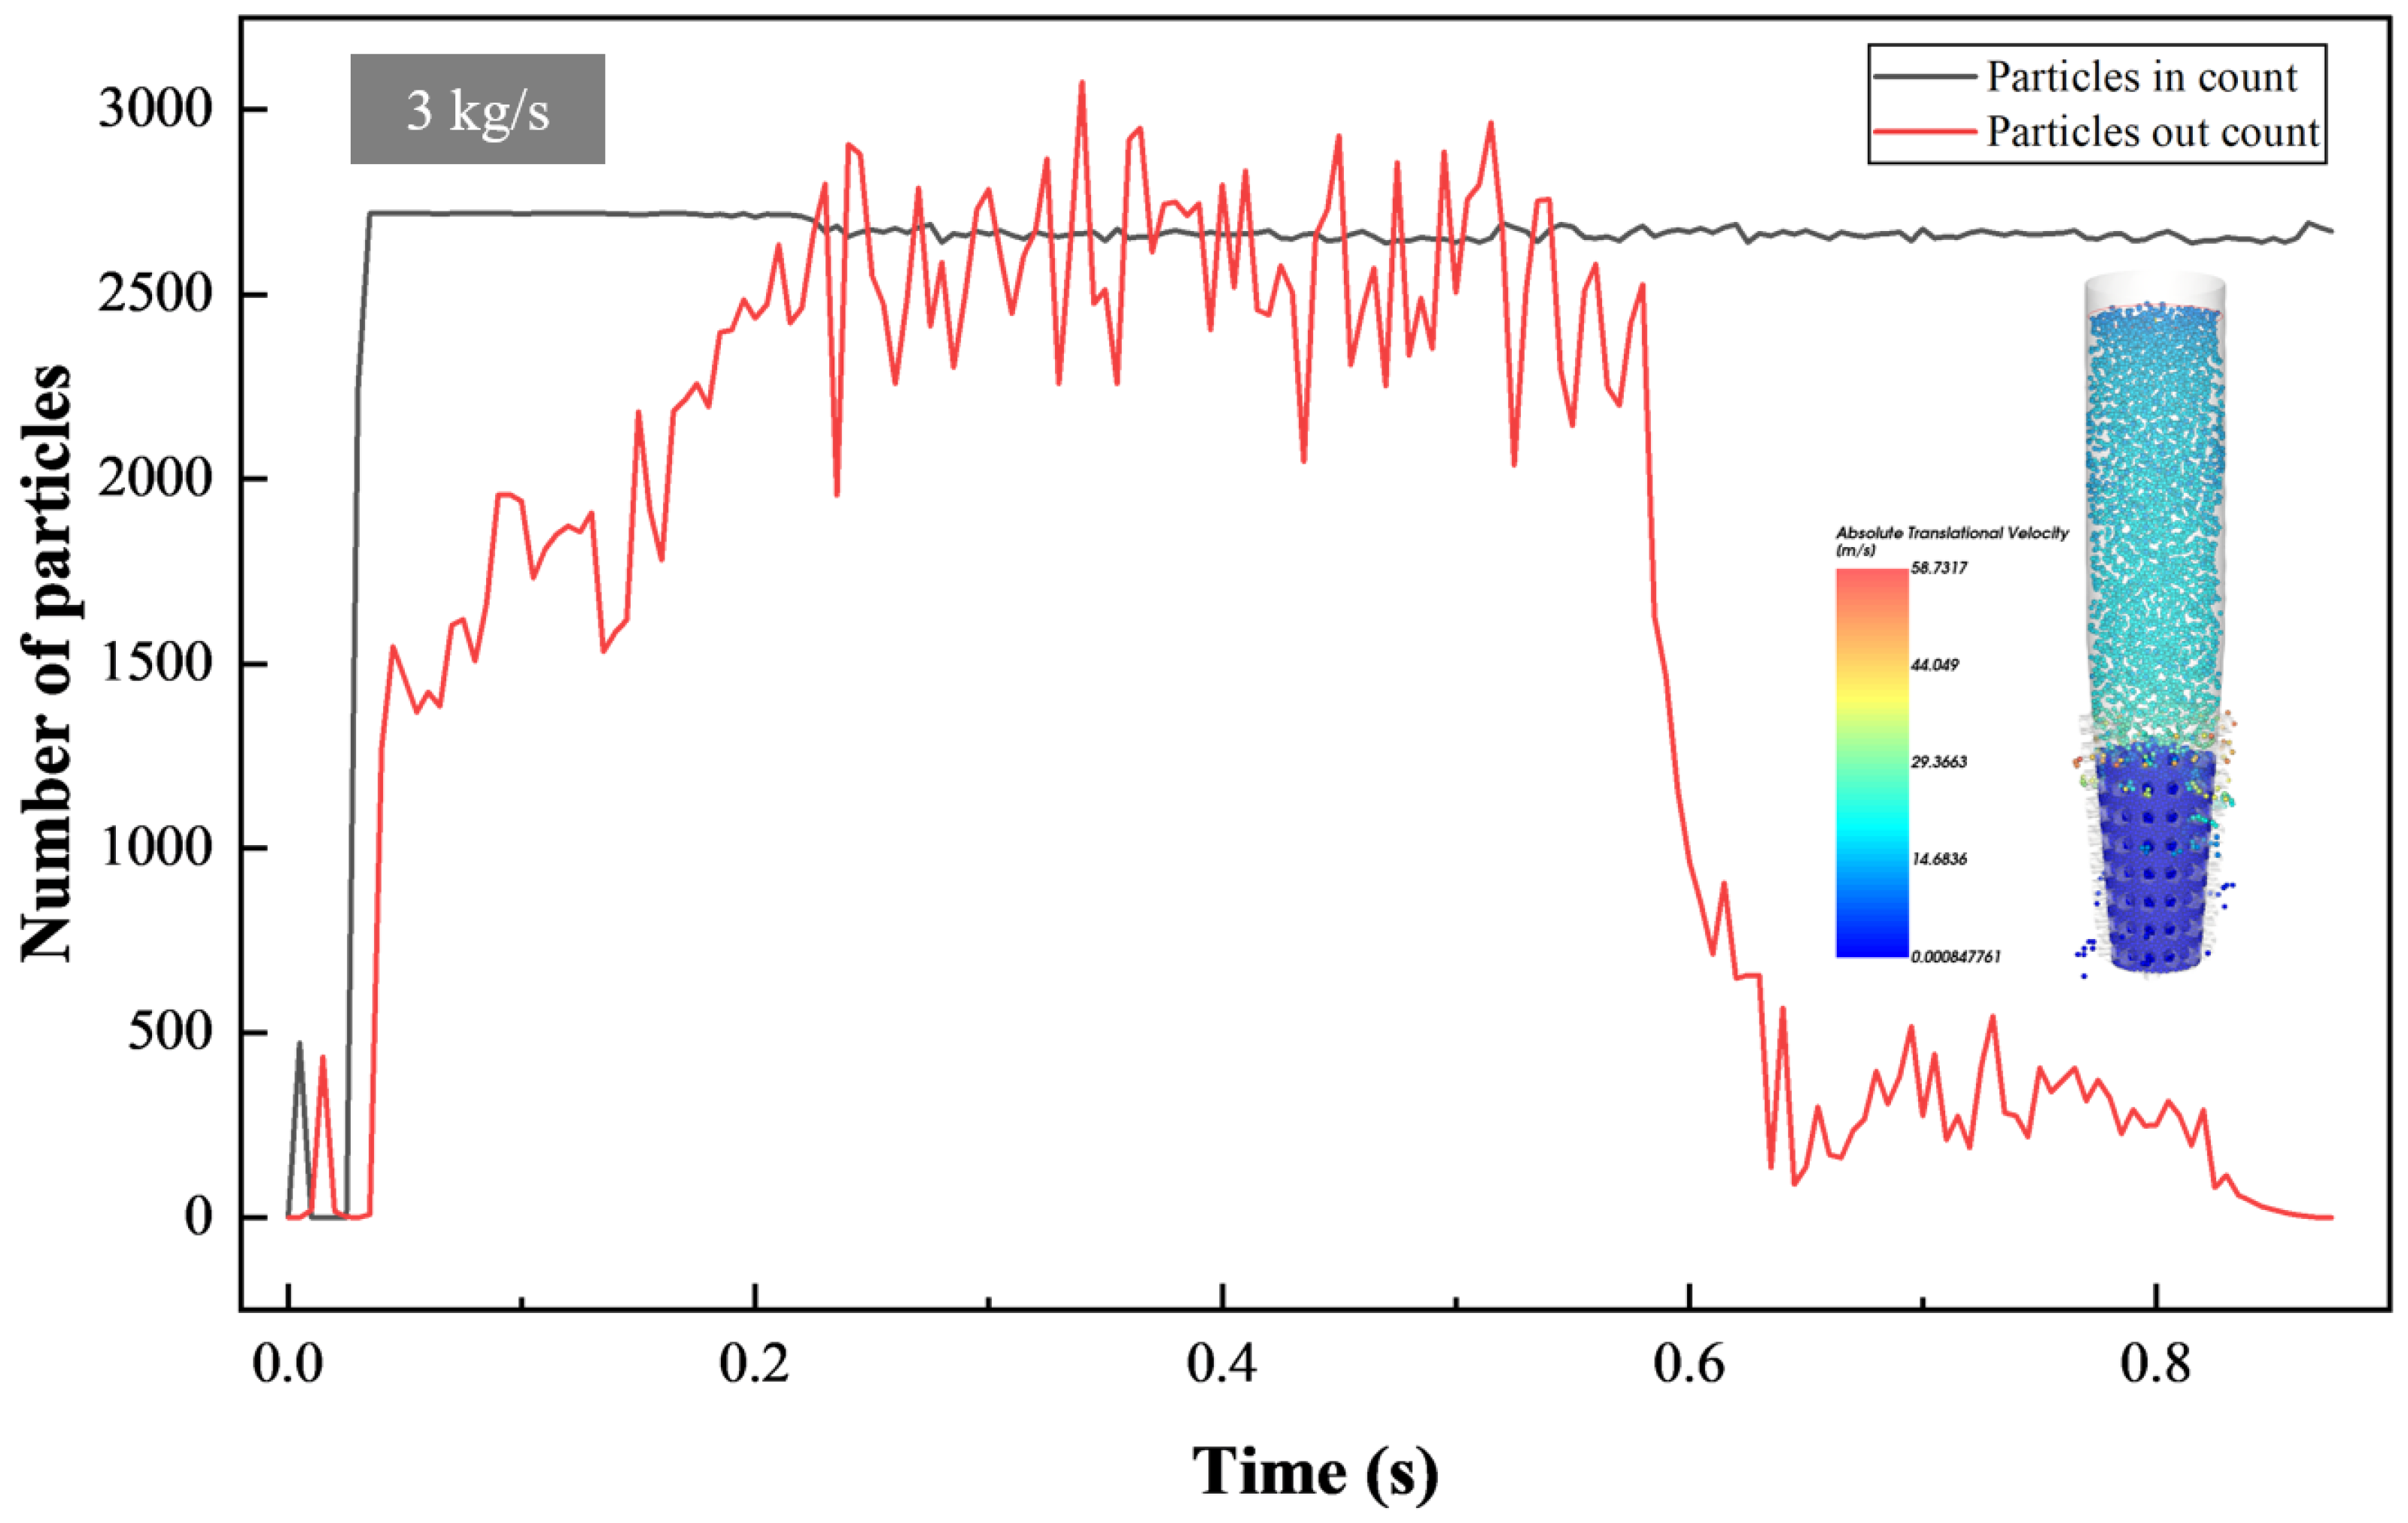
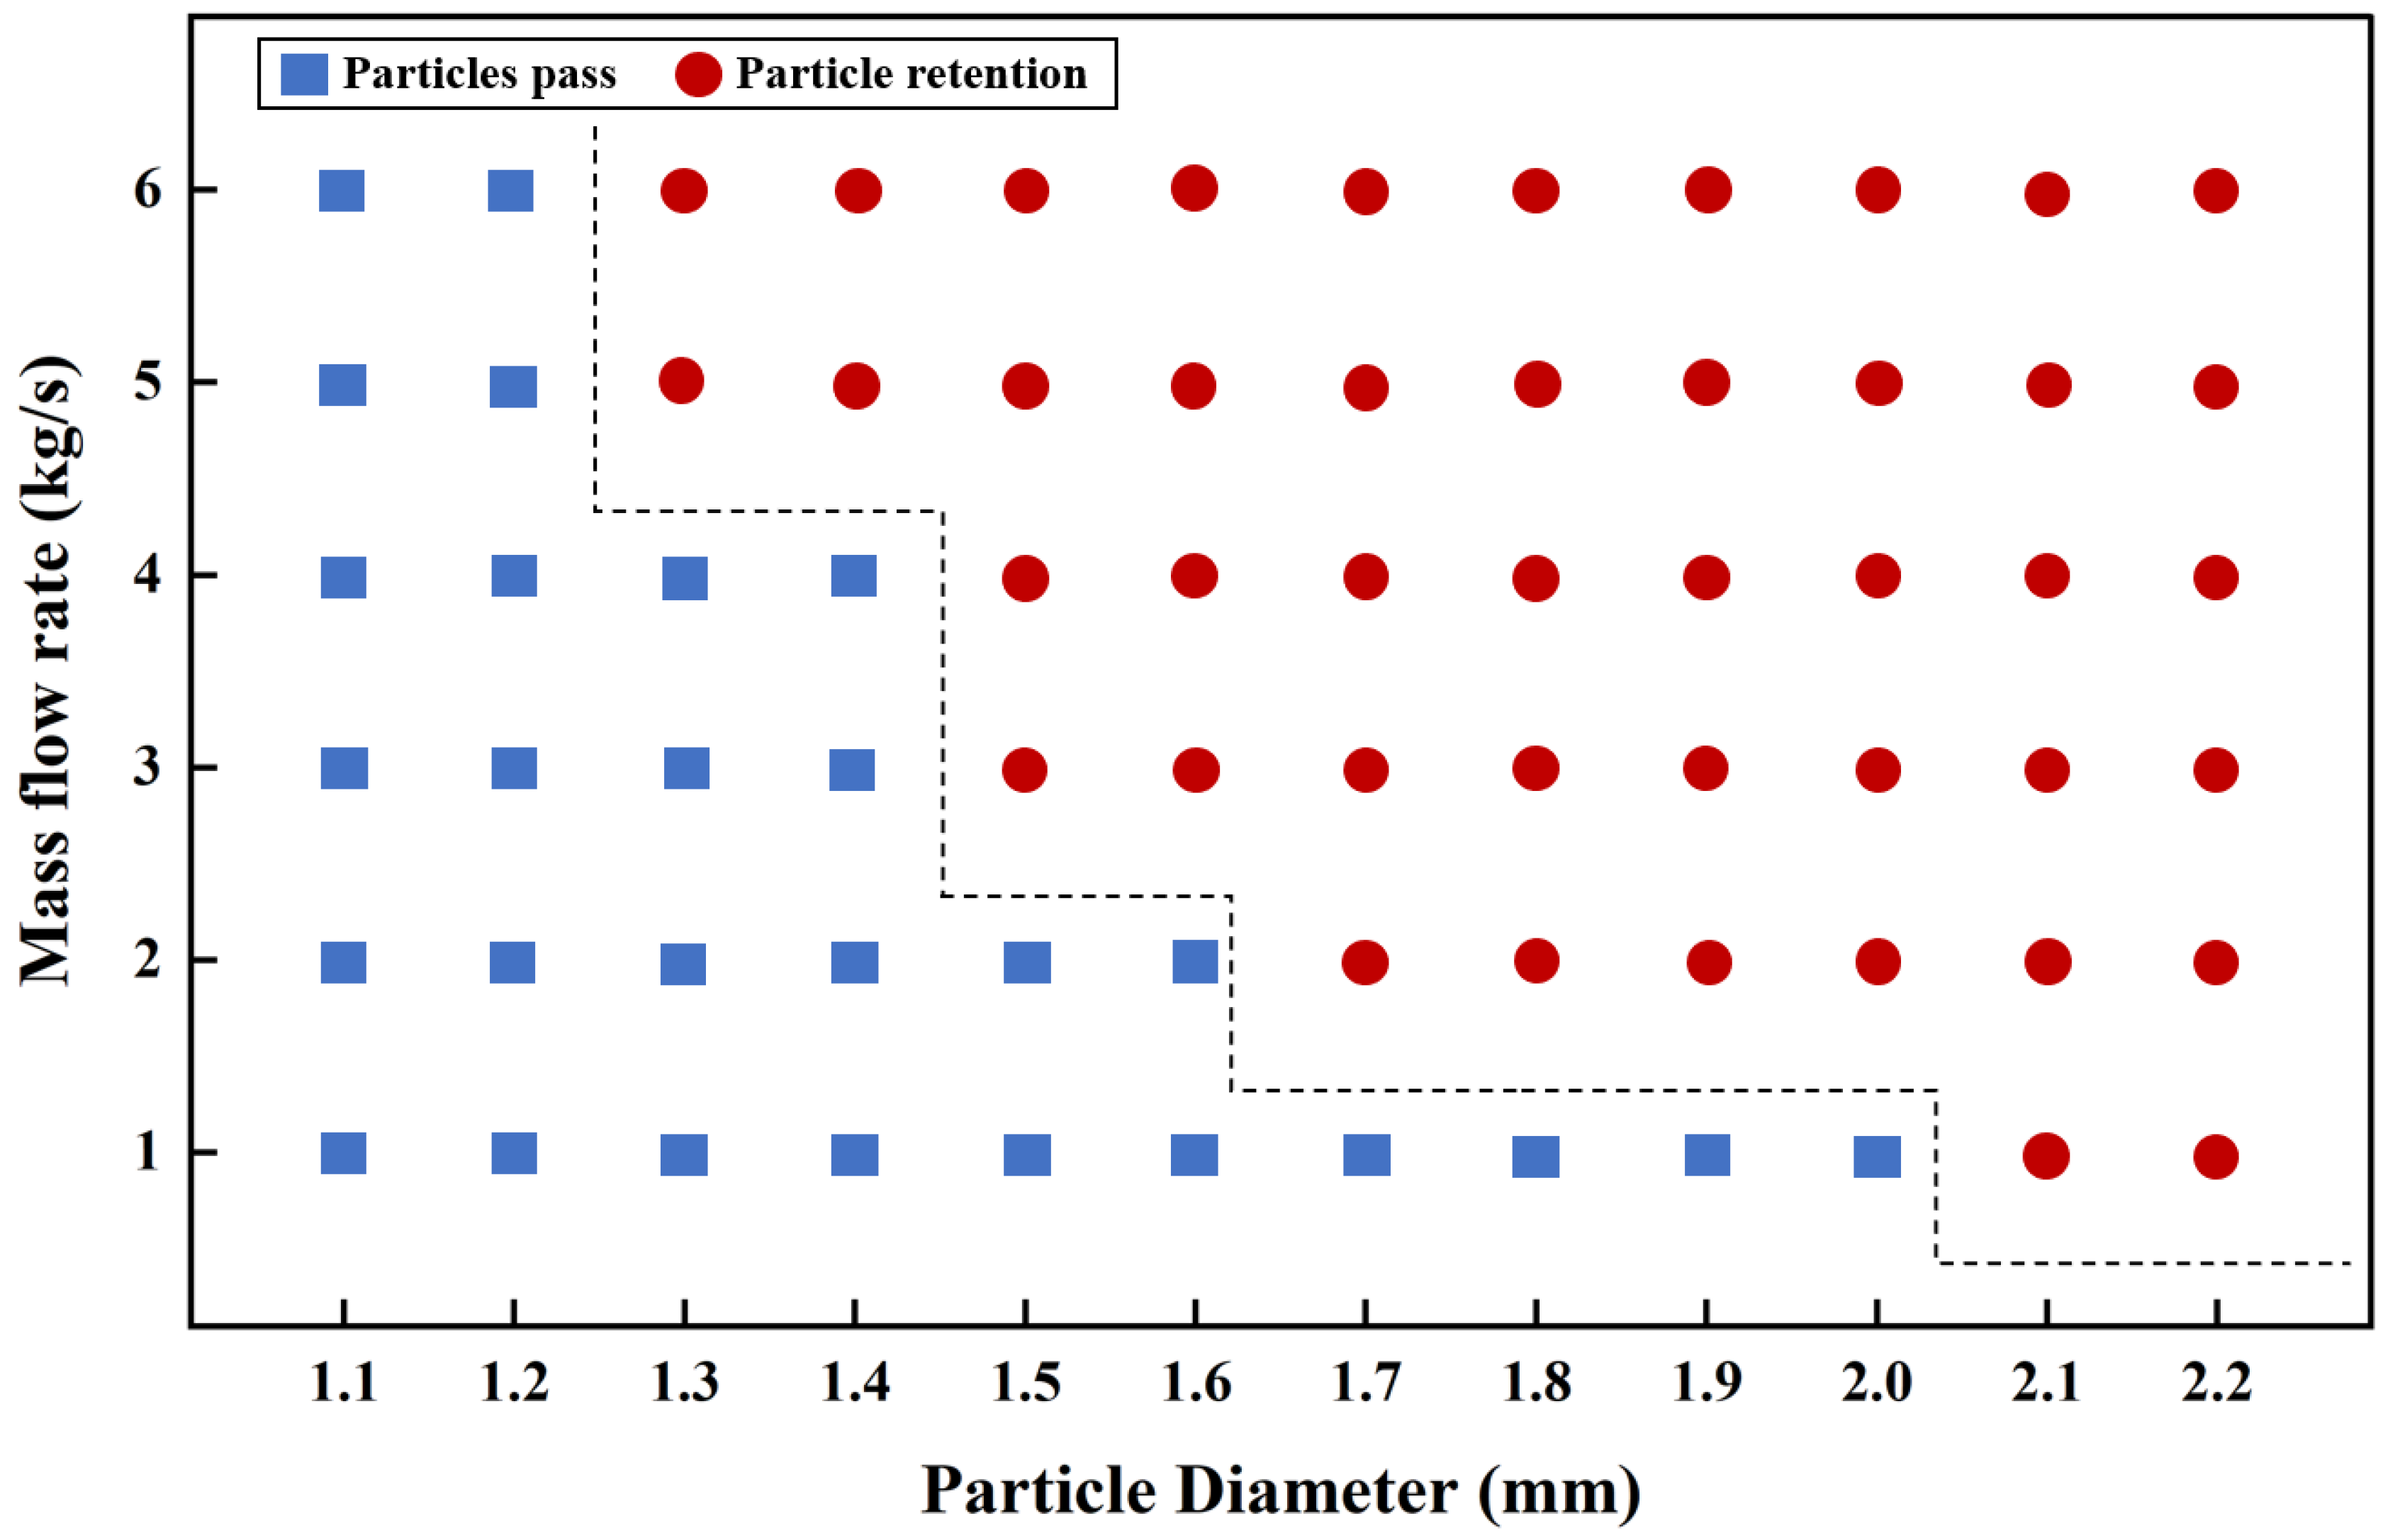
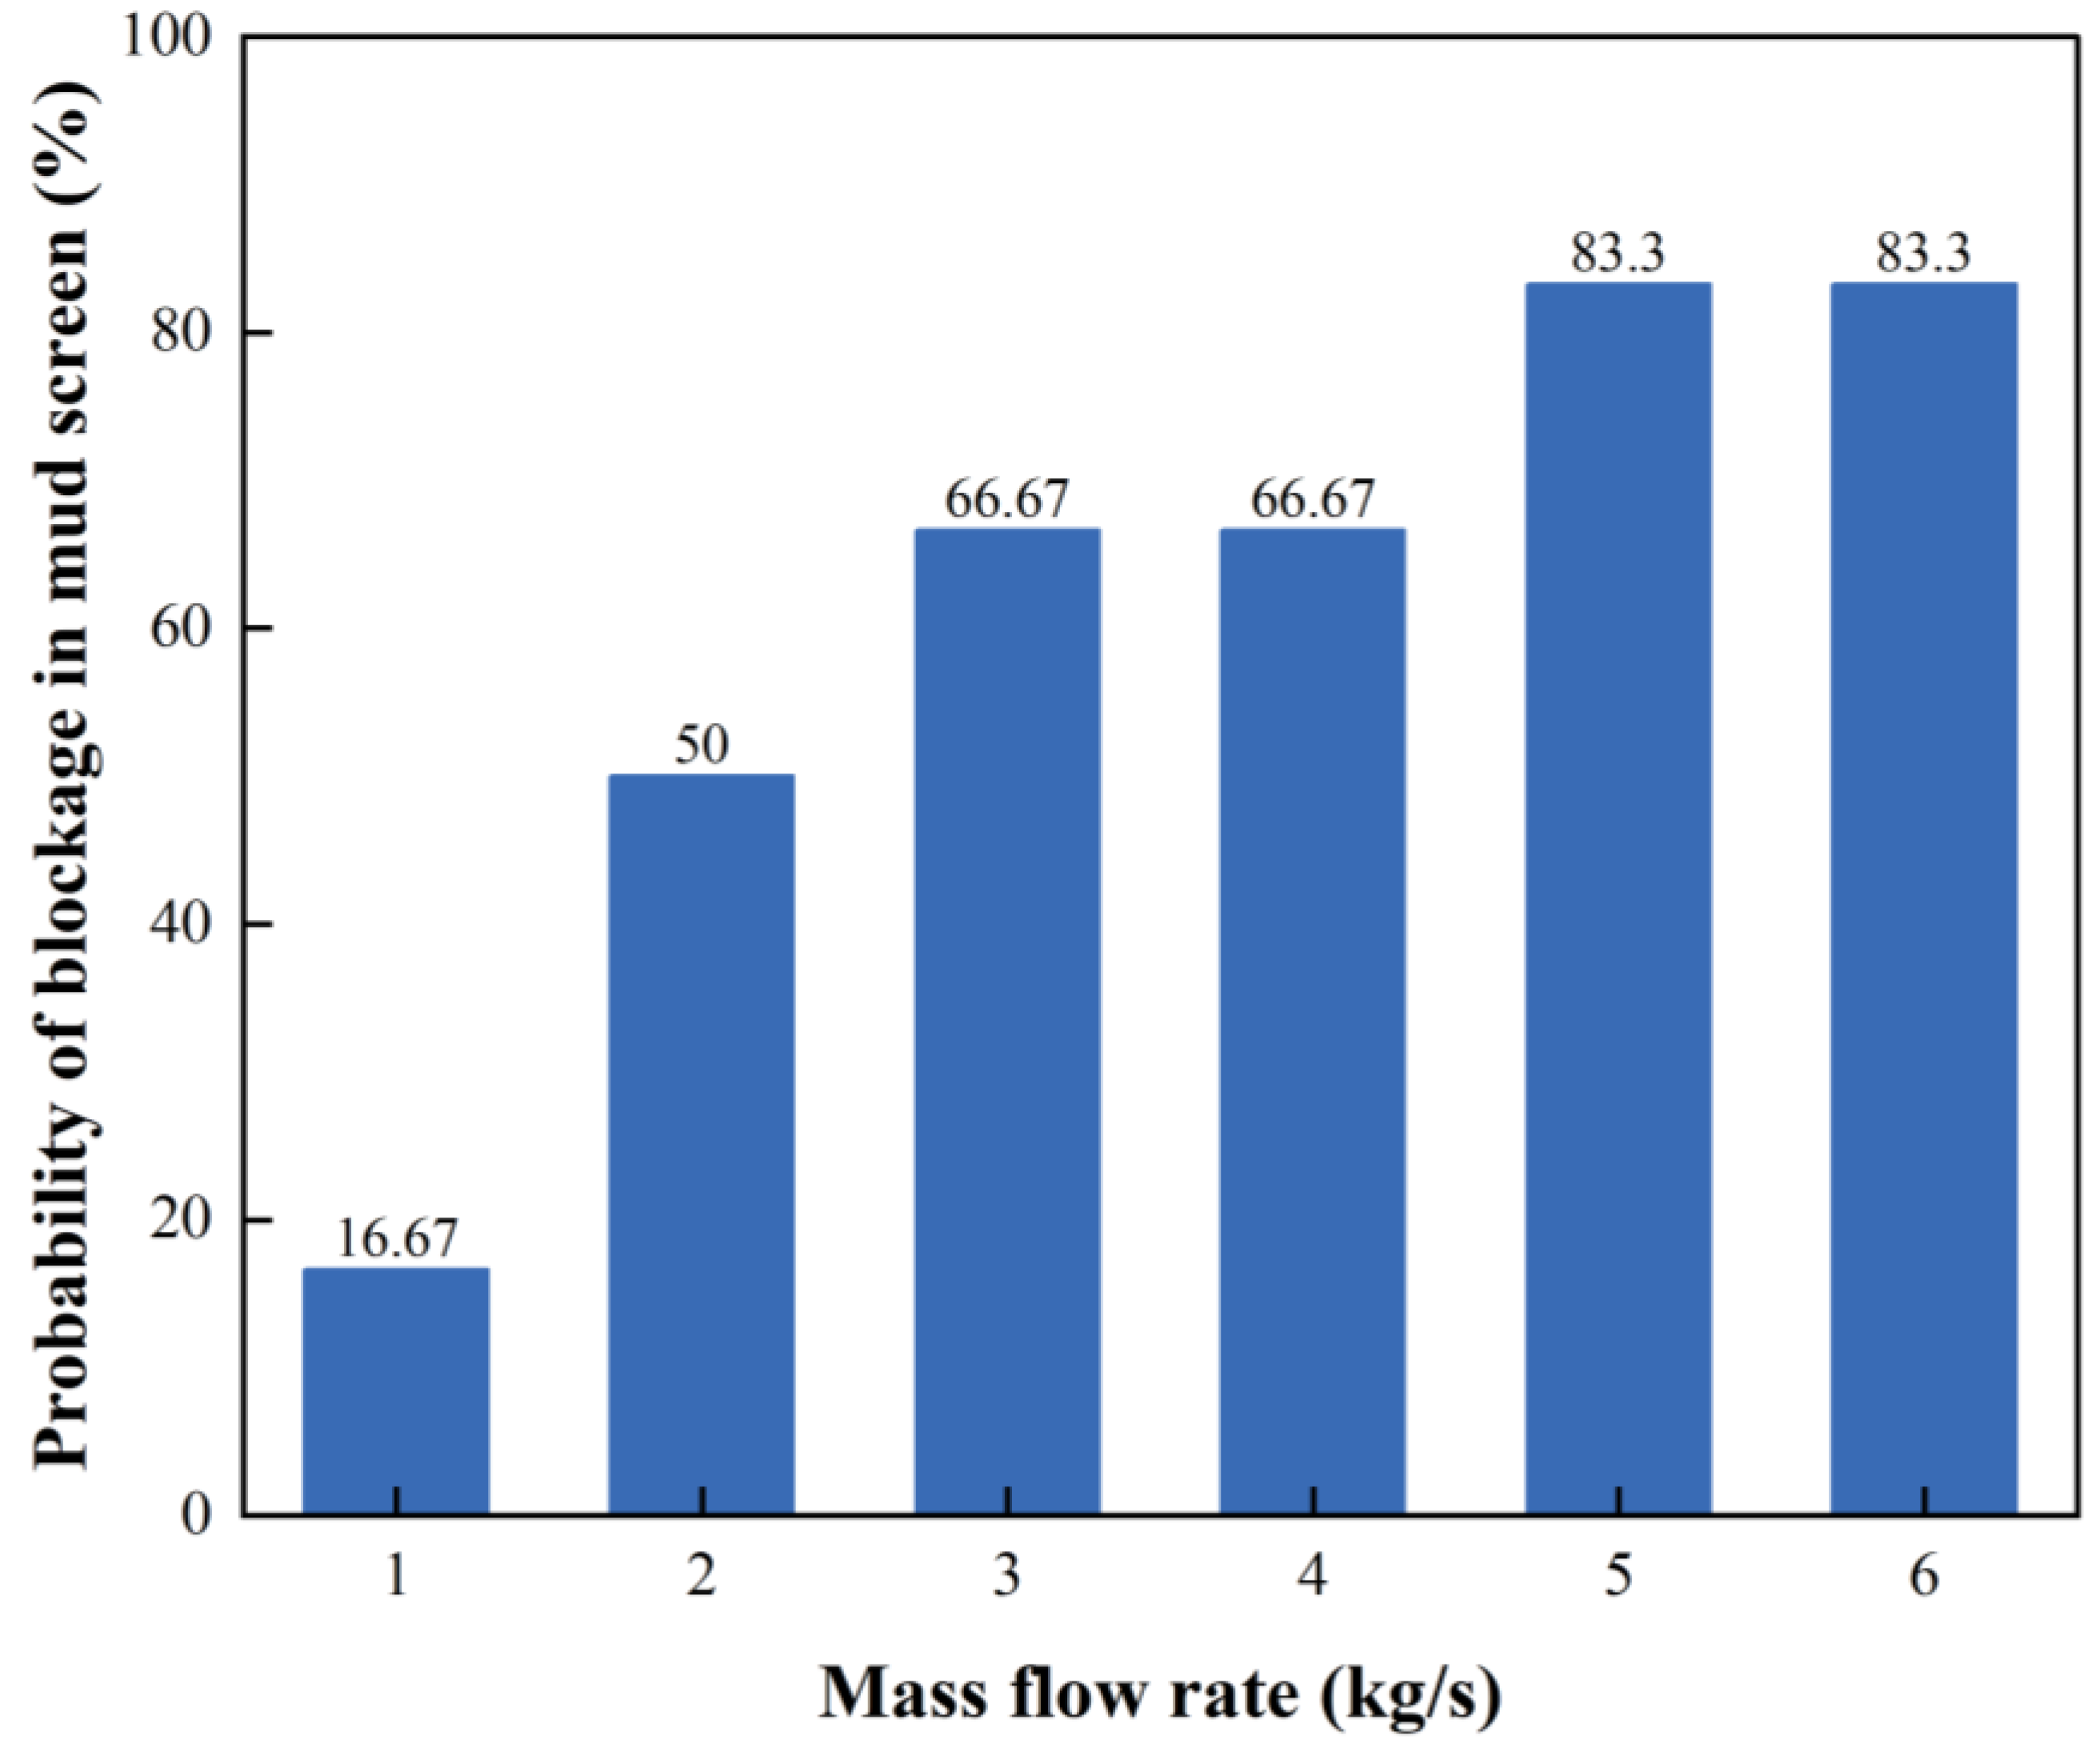
4.3. Influence of Mass Flow of LCMS on Flow Properties

As shown in Figure 14, the lower the mass flow range, the lower the probability of tool clogging by LCMs. It shows that controlling the entry speed of LCMs to keep them consistent with the speed of overflowing LCMs is beneficial to the circulation of LCMs in the mud screen. At the same time, the high mass flow makes it easier for particles to build bridges in the pores, hindering the migration of particles. Overall, LCMs are better able to ensure the safety of MWD while maintaining a lower mass flow. In the actual operation of the drilling platform, when using LCMs with larger particle size, it is necessary to ensure that the concentration of LCMs is maintained in a lower range.
It can be seen from the comparison between Figure 15 and Figure 16 that the entry velocity and the overflow velocity of LCMs with a mass flow of 2 kg/s are maintained in an equilibrium state. Therefore, LCMs maintain good liquidity. When the mass flow of LCMs rises to 3 kg/s, the entry velocity of LCMs is greater than the overflow velocity of LCMs. Meanwhile, the high concentration of LCMs had a side effect on the spillover behavior. Therefore, LCMs build up rapidly in the tool, filling the entire tool.

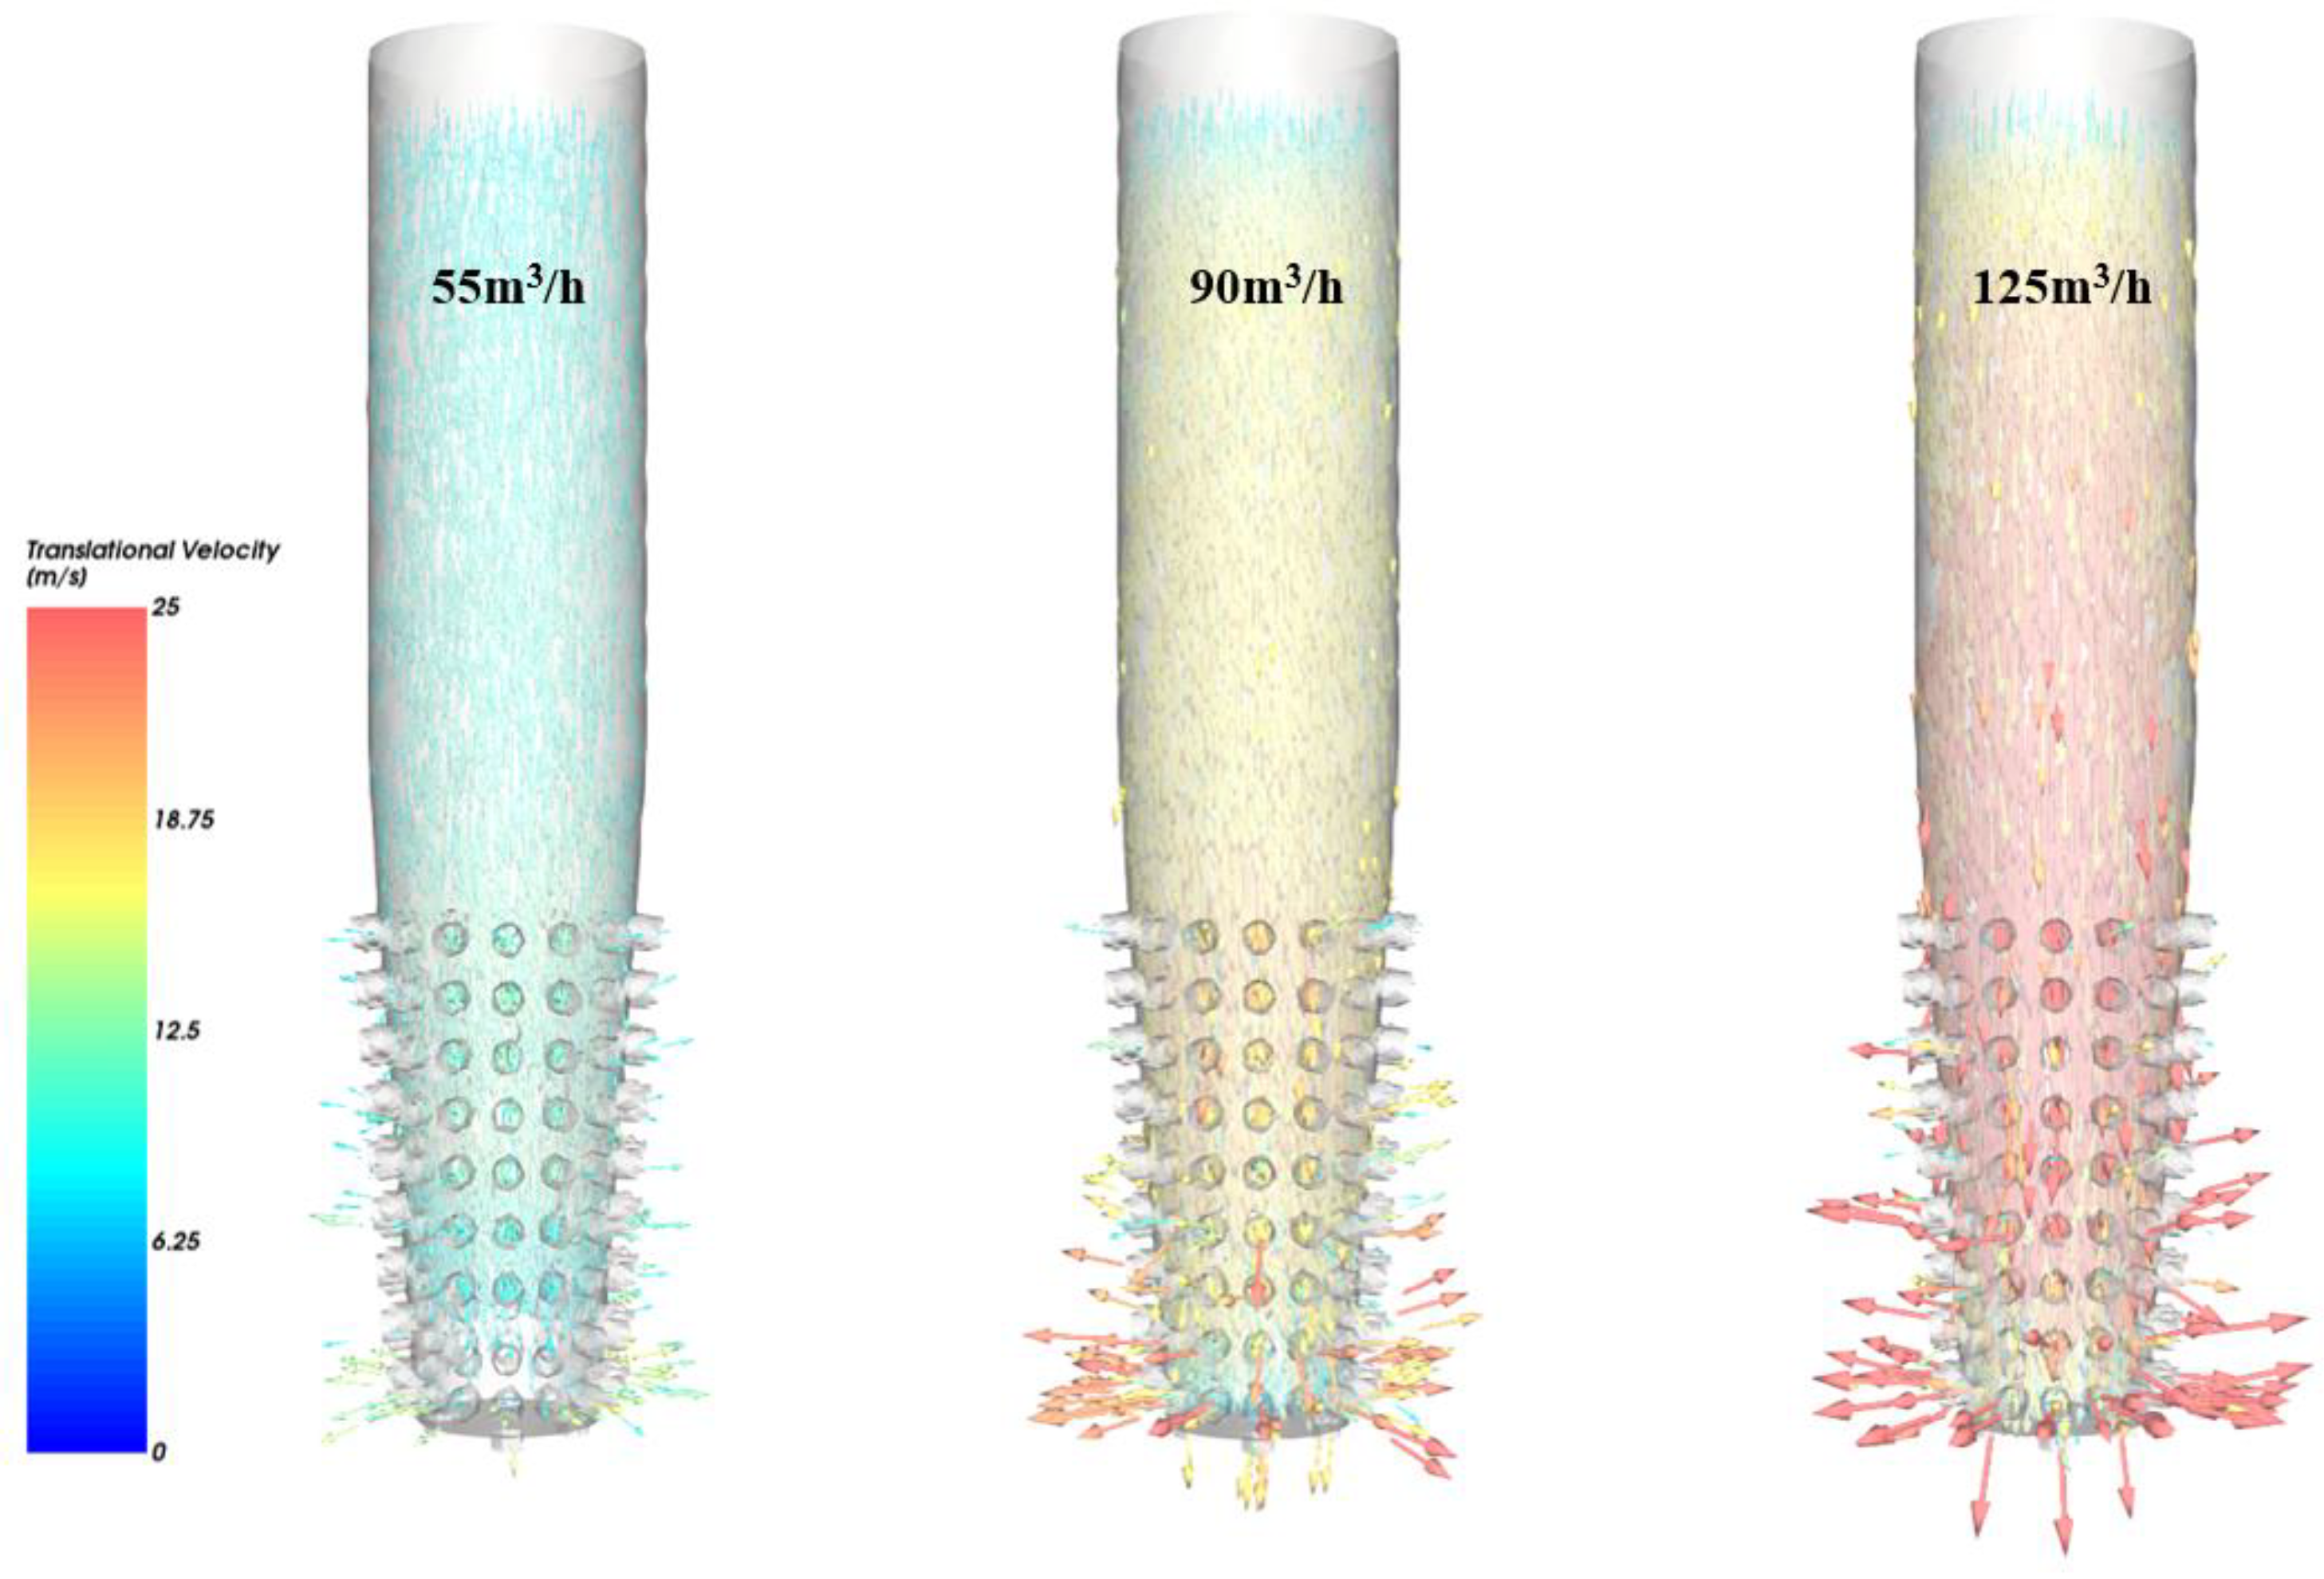
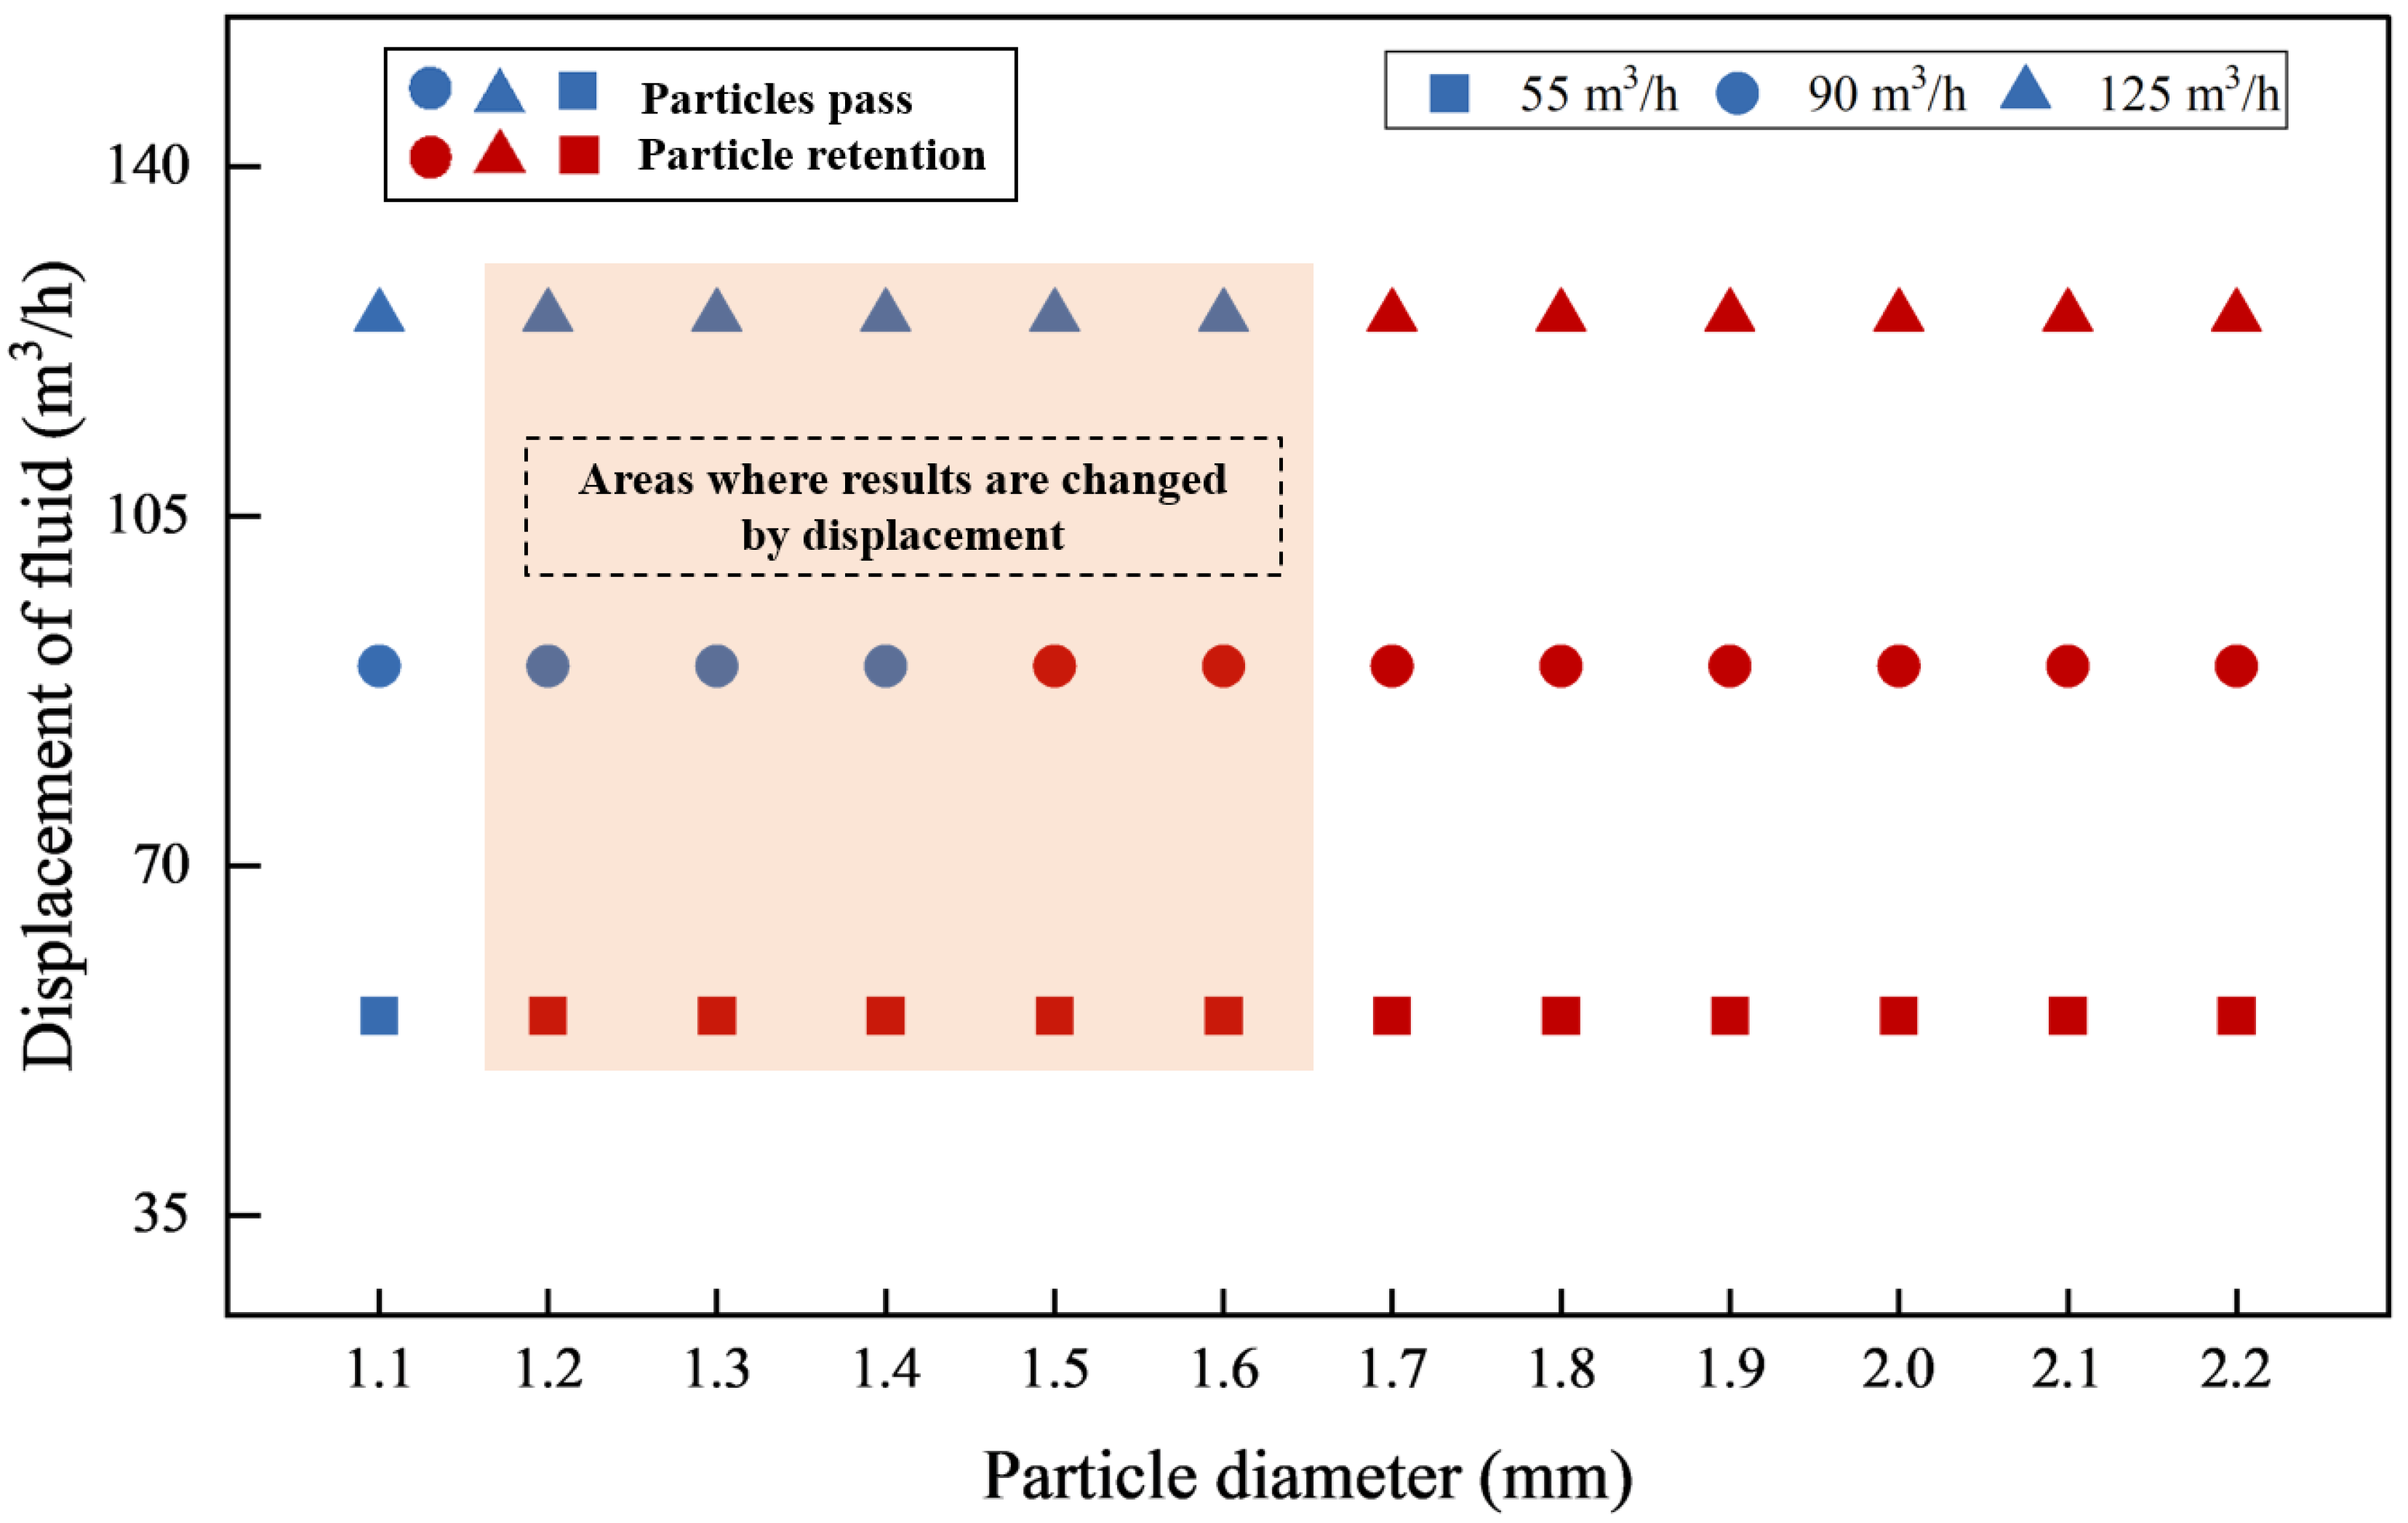
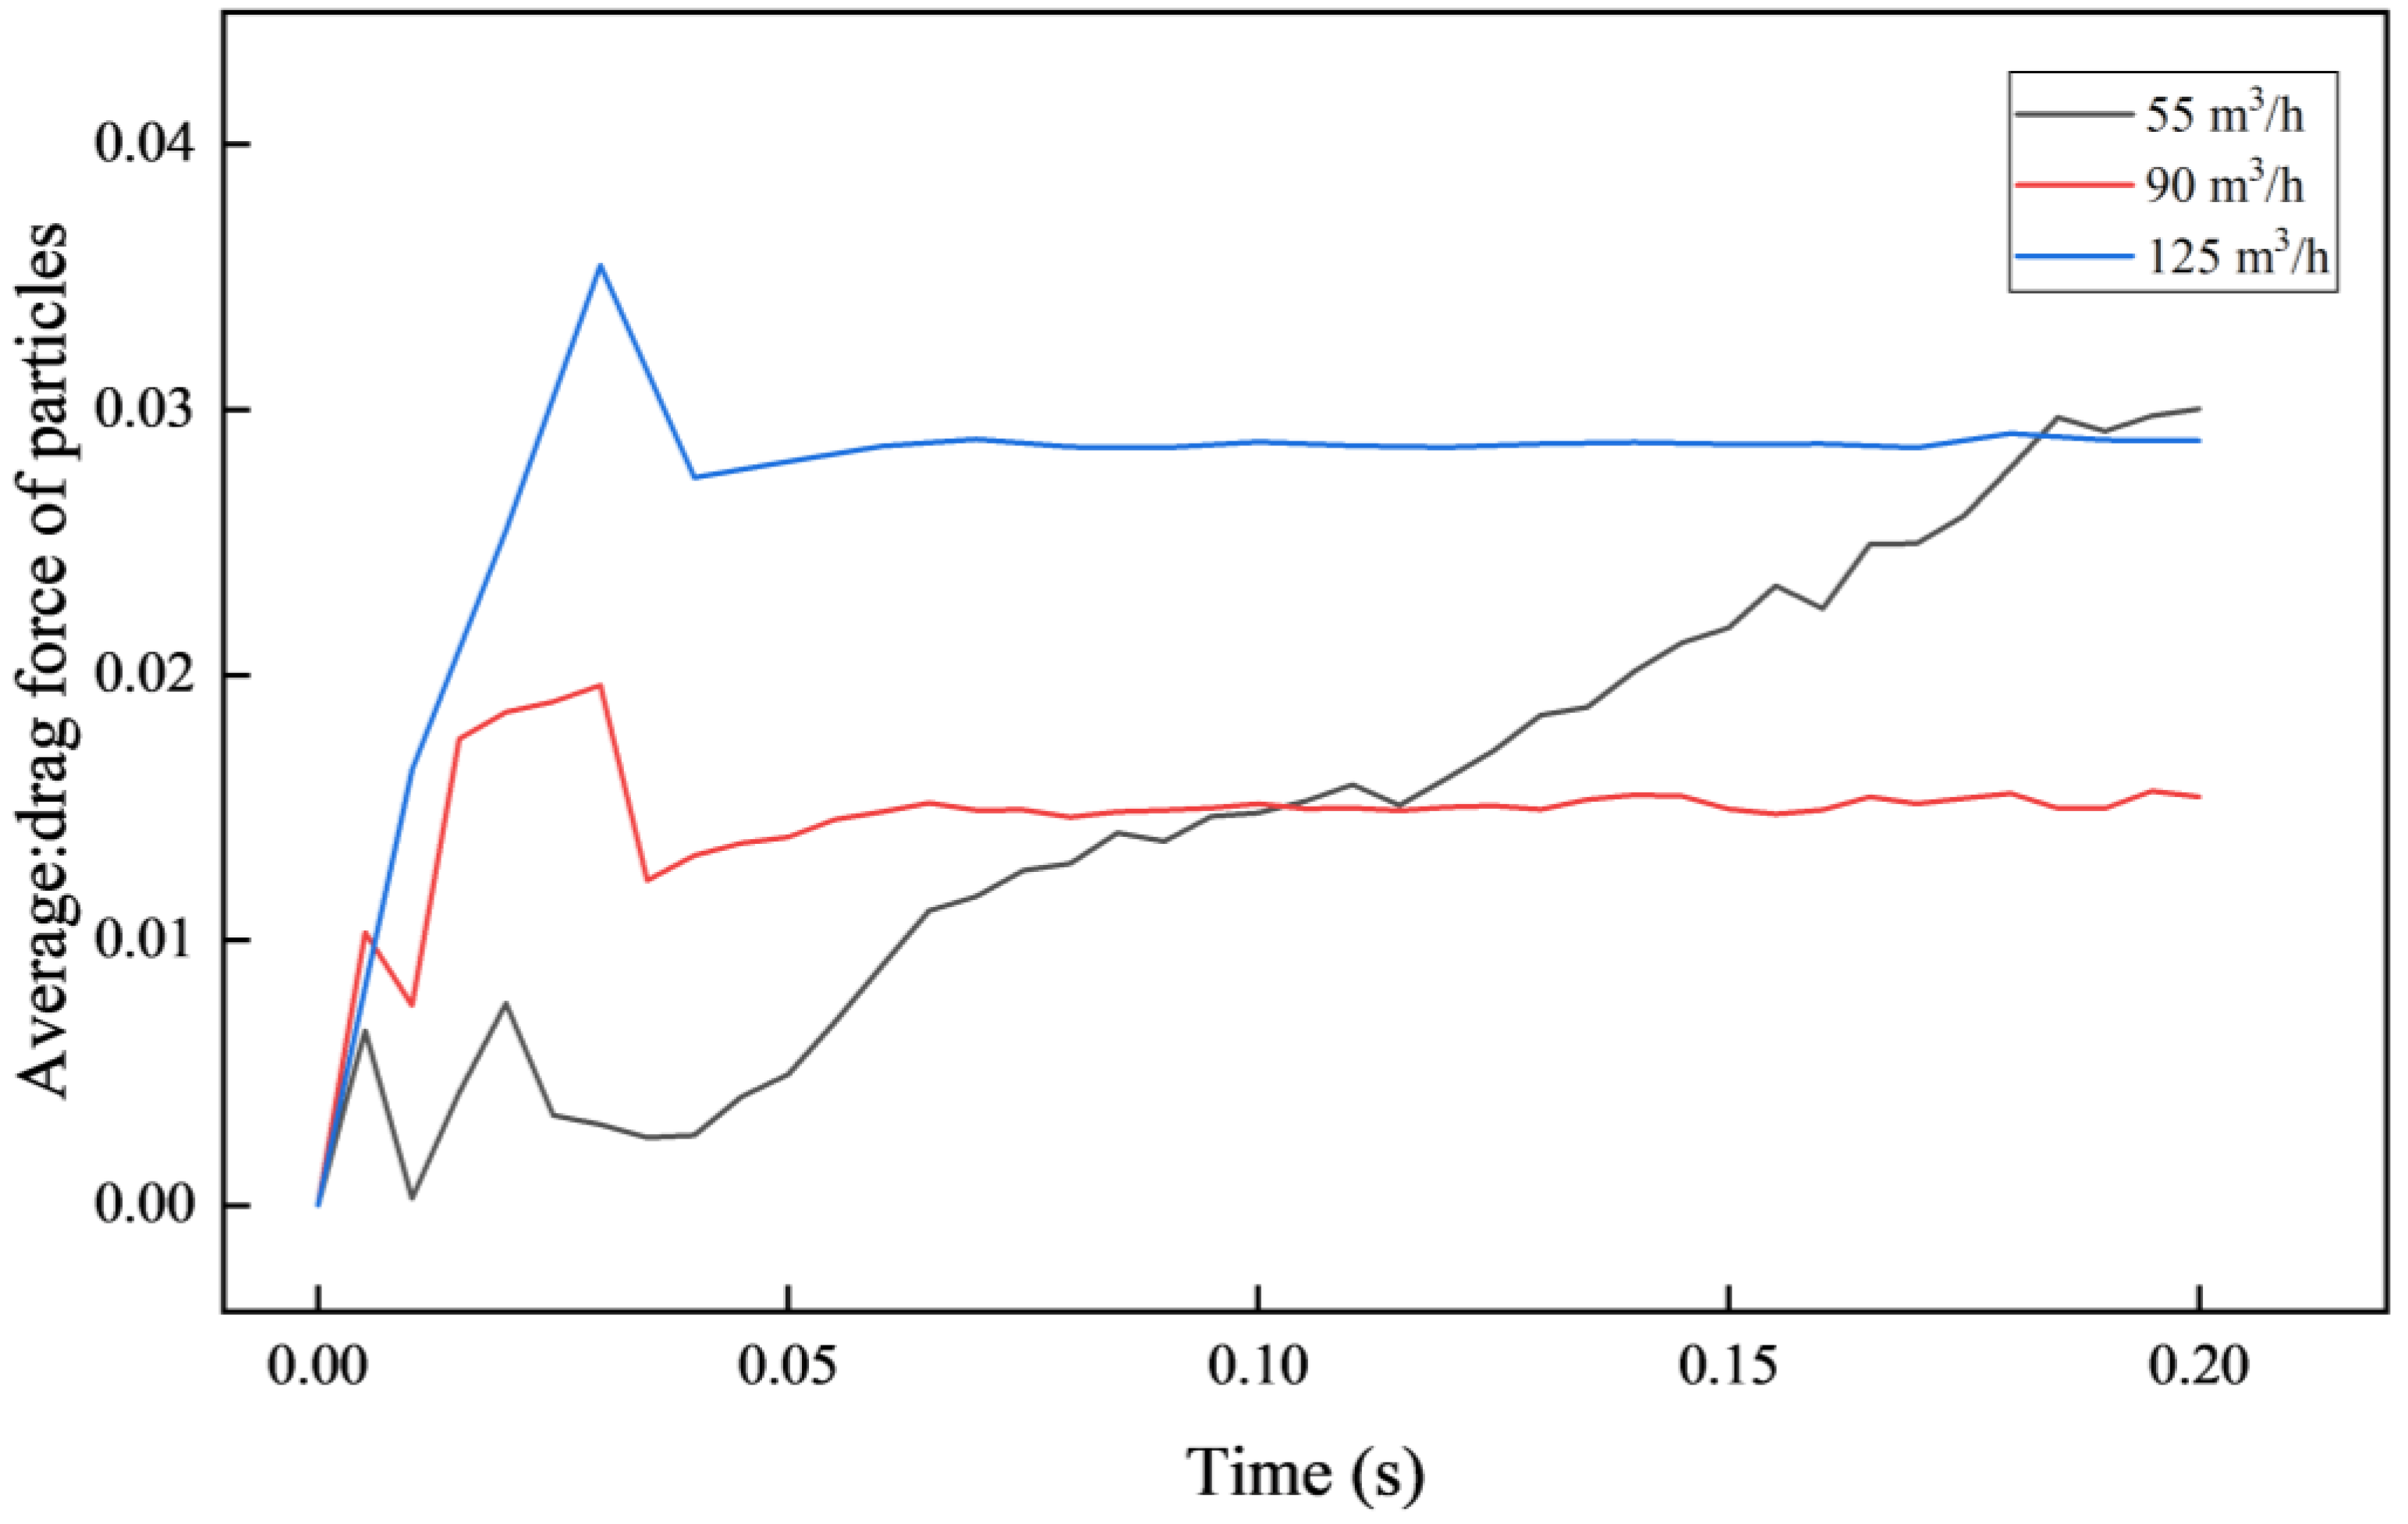
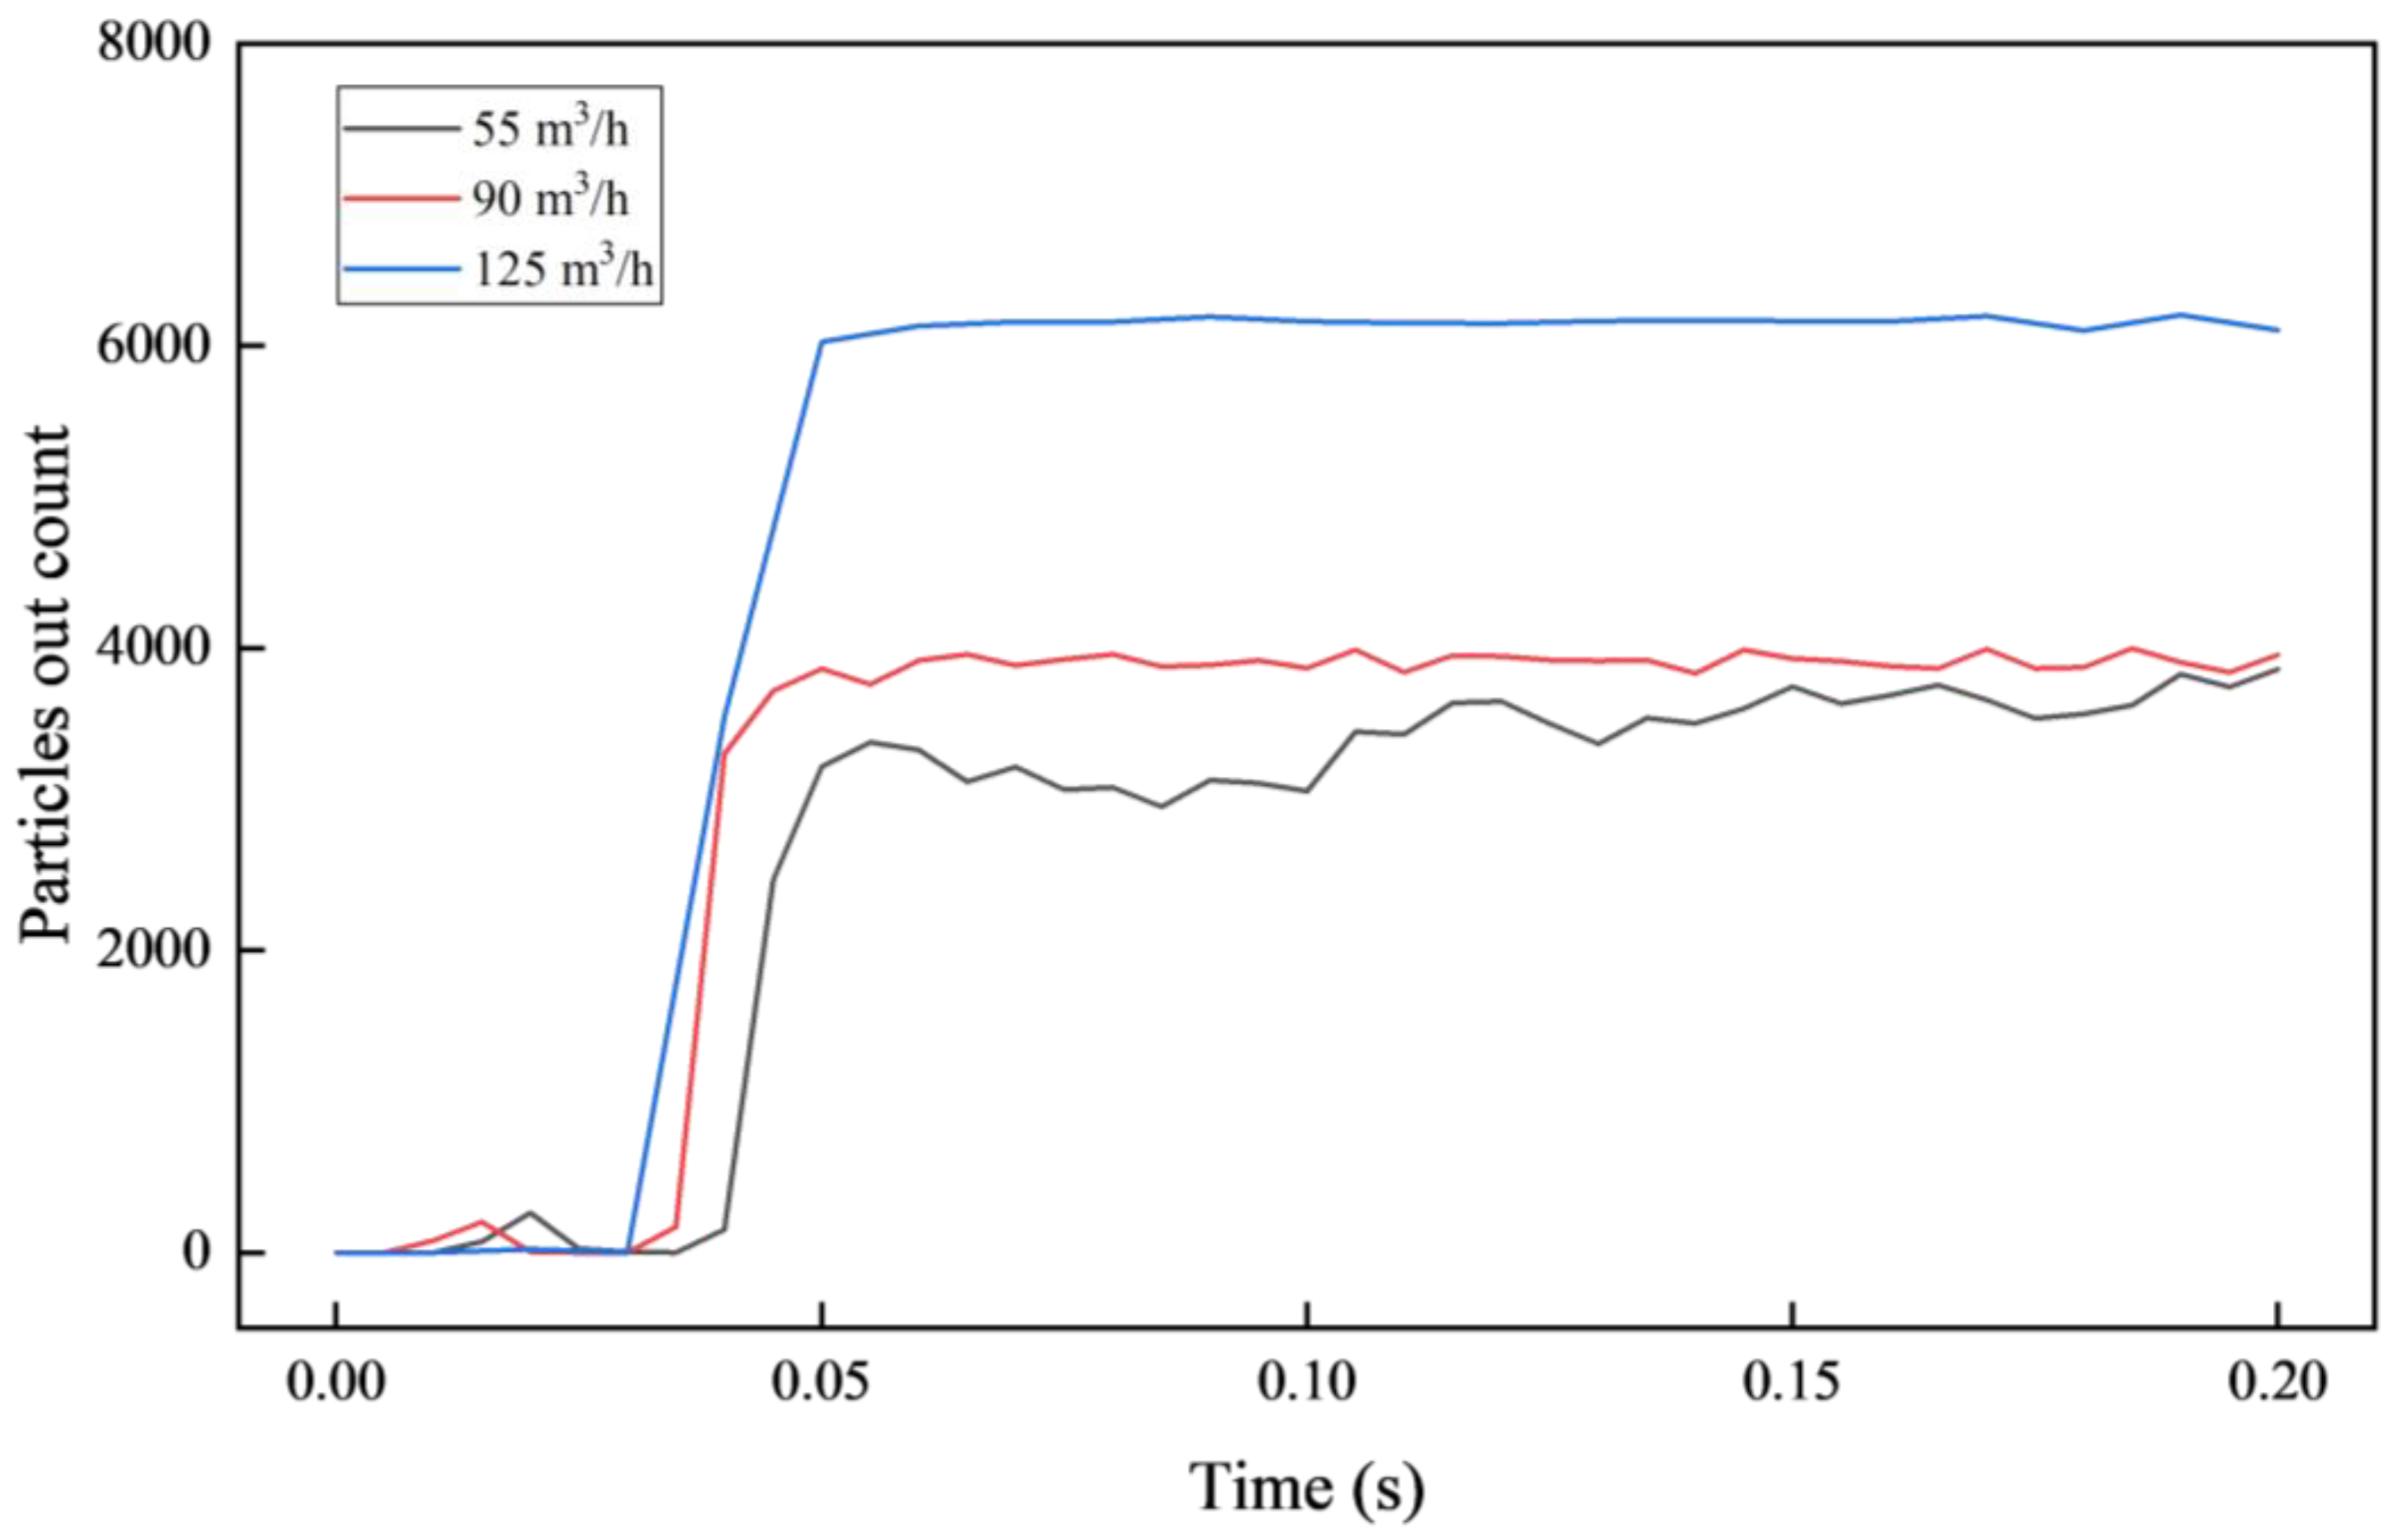
4.4. Influence of Fluid Displacement on Flow Properties

Considering the actual working conditions in the drilling process, the displacement of the drilling fluid is different. Therefore, according to the actual parameters, the drilling fluid displacement is divided into three levels: low, medium, and high. The influence of liquid velocity was revealed by comparing the flow properties of materials for plugging while drilling under three types of displacement. Figure 17 shows the displacement velocity of LCMs in the whole tool under different displacements of fluid. It can be clearly seen that the overflow rate of LCMs increases with the increase of fluid displacement.
Under the condition that the mass flow of LCMs is 3 kg/s, it can be found that the fluid displacement has a significant influence on the results. In Figure 18, the parameters for which the effect of fluid displacement changes the fluidity of LCMs are circled by boxes. Low displacement mainly affects the flow properties of LCMs.
Figure 19 and Figure 20 reflect the effect of different displacements on LCMs. The reduction of the fluid displacement will reduce the overflow speed of the particles, resulting in the deterioration of the flow properties. The drag force on the LCMs is also affected by the displacement. The larger the displacement, the greater the drag force on the LCMs. As shown in Figure 20, with a displacement of 55 m3/h, the drag force on the LCMs suddenly increased in the subsequent period. This is because the LCMs clog the tool and reduce the fluid flow channel area, which increases the fluid velocity around the LCMs.

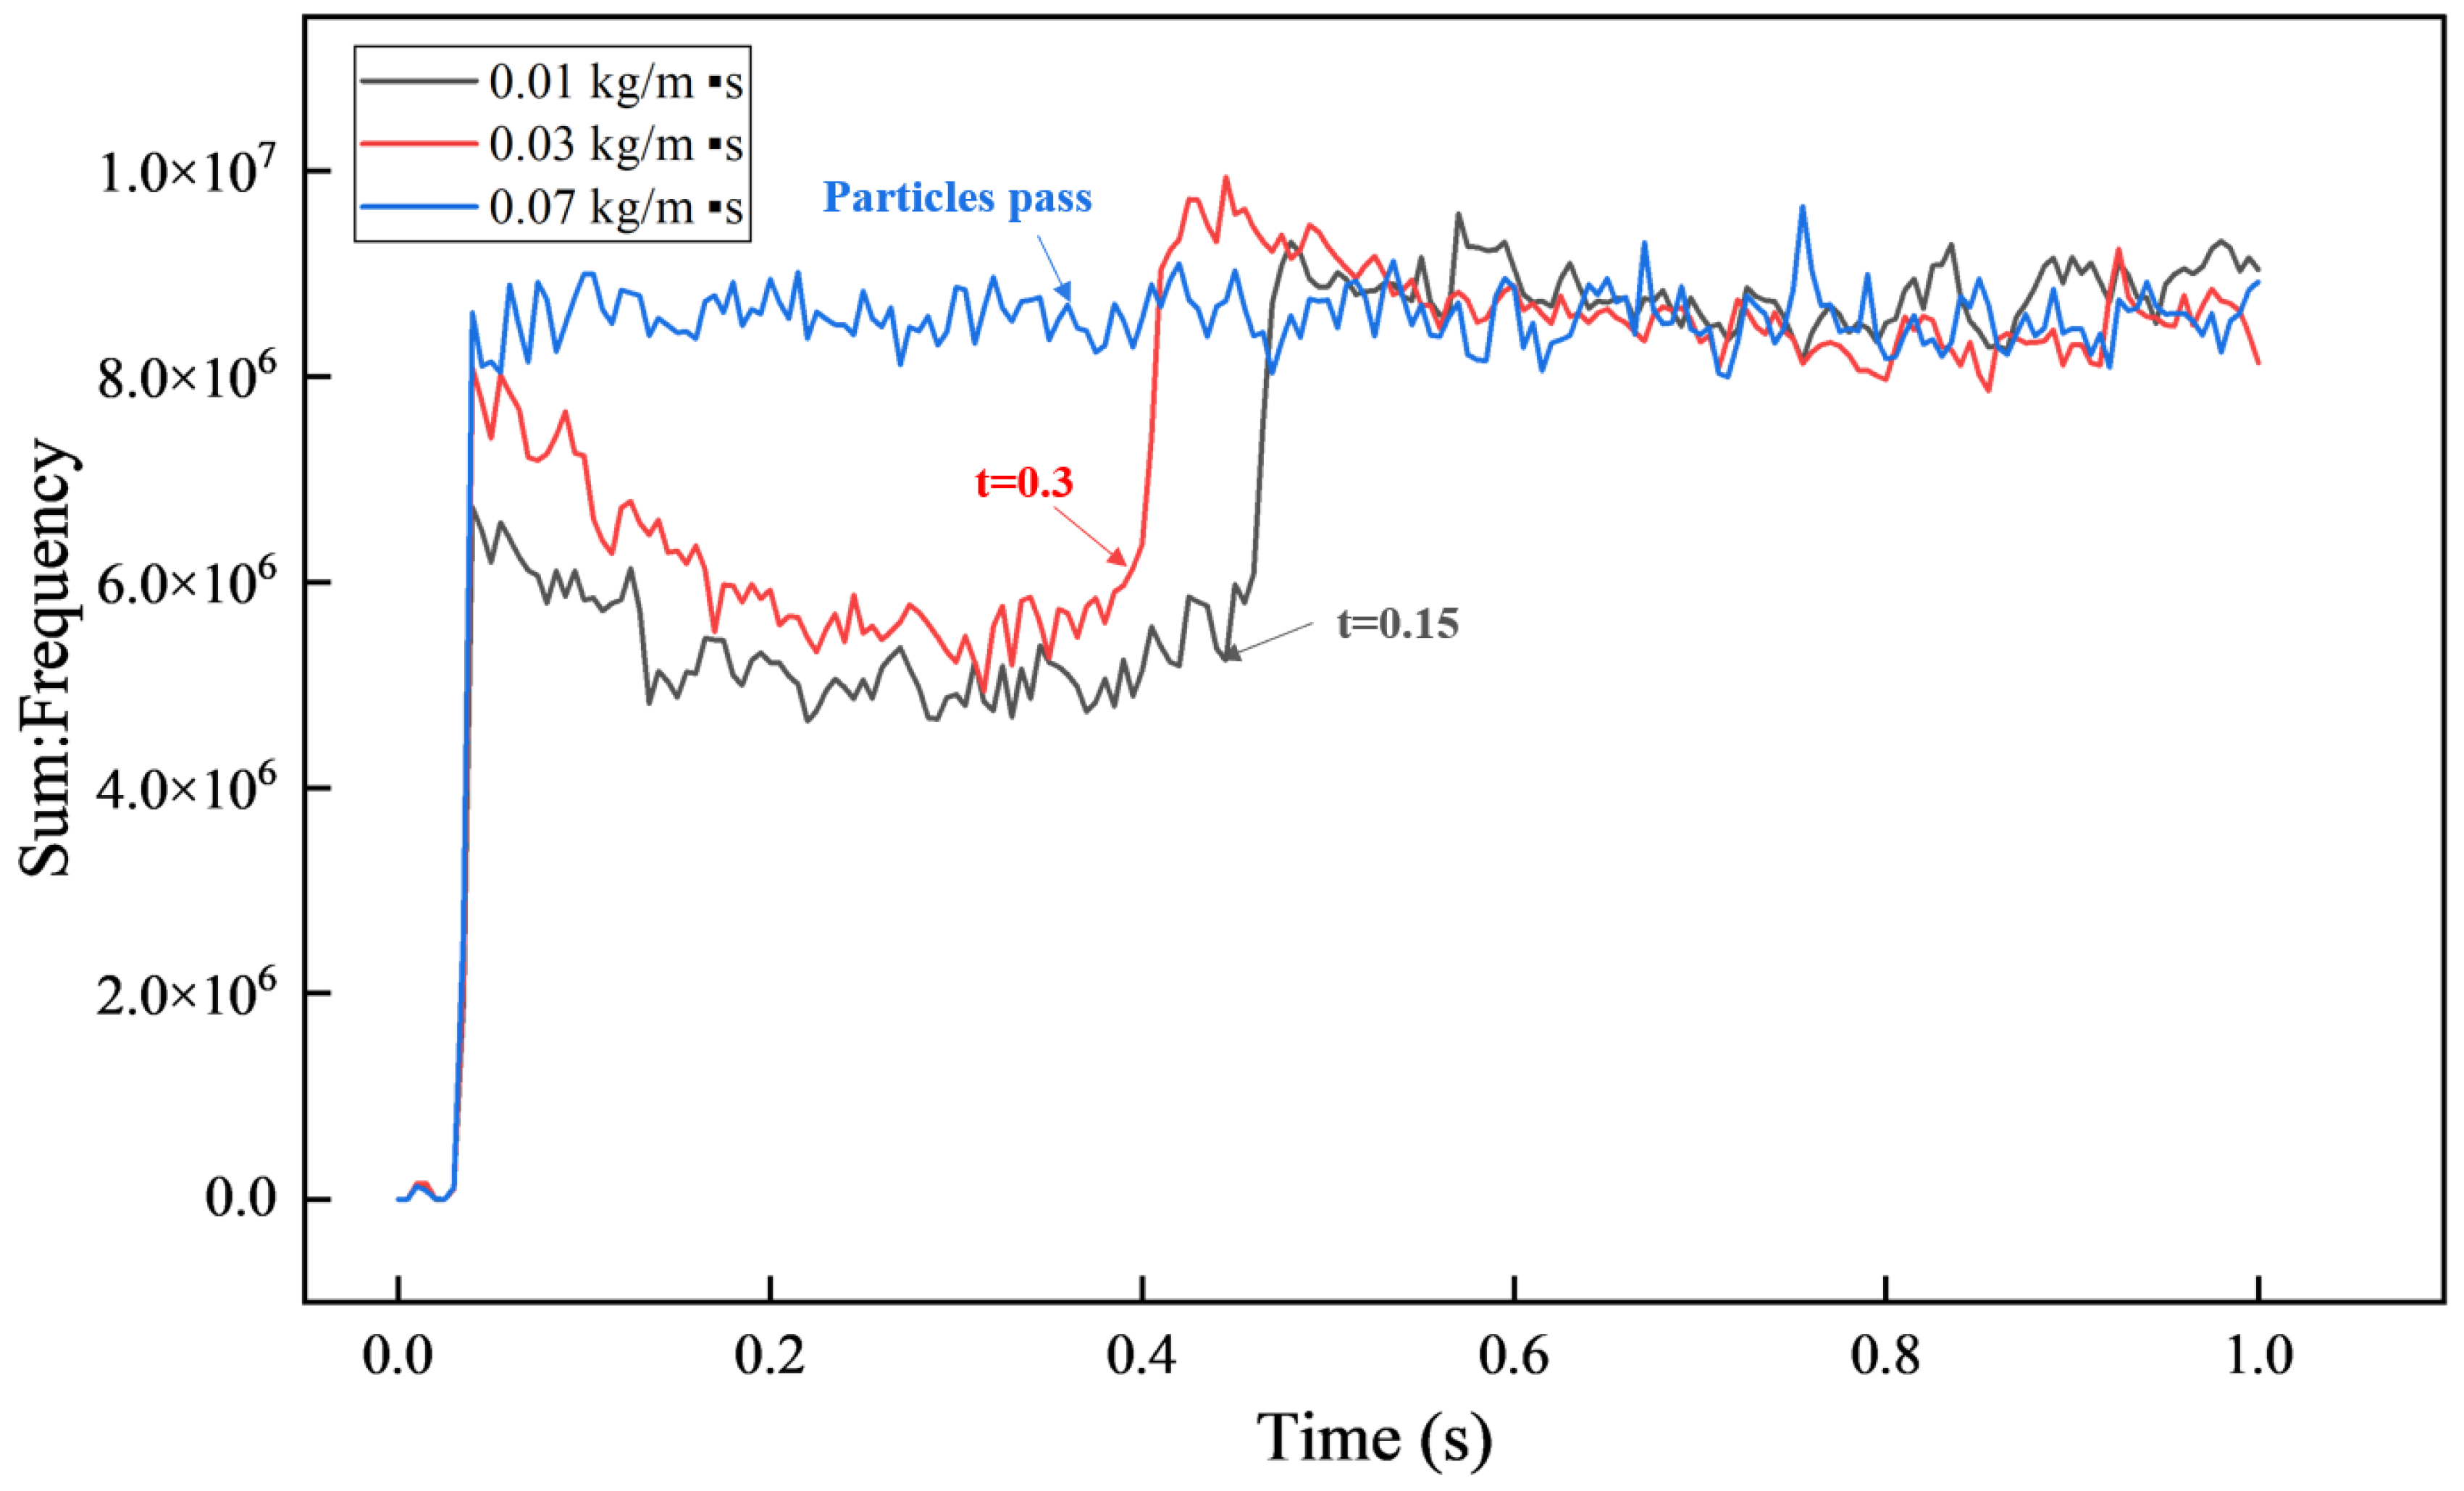
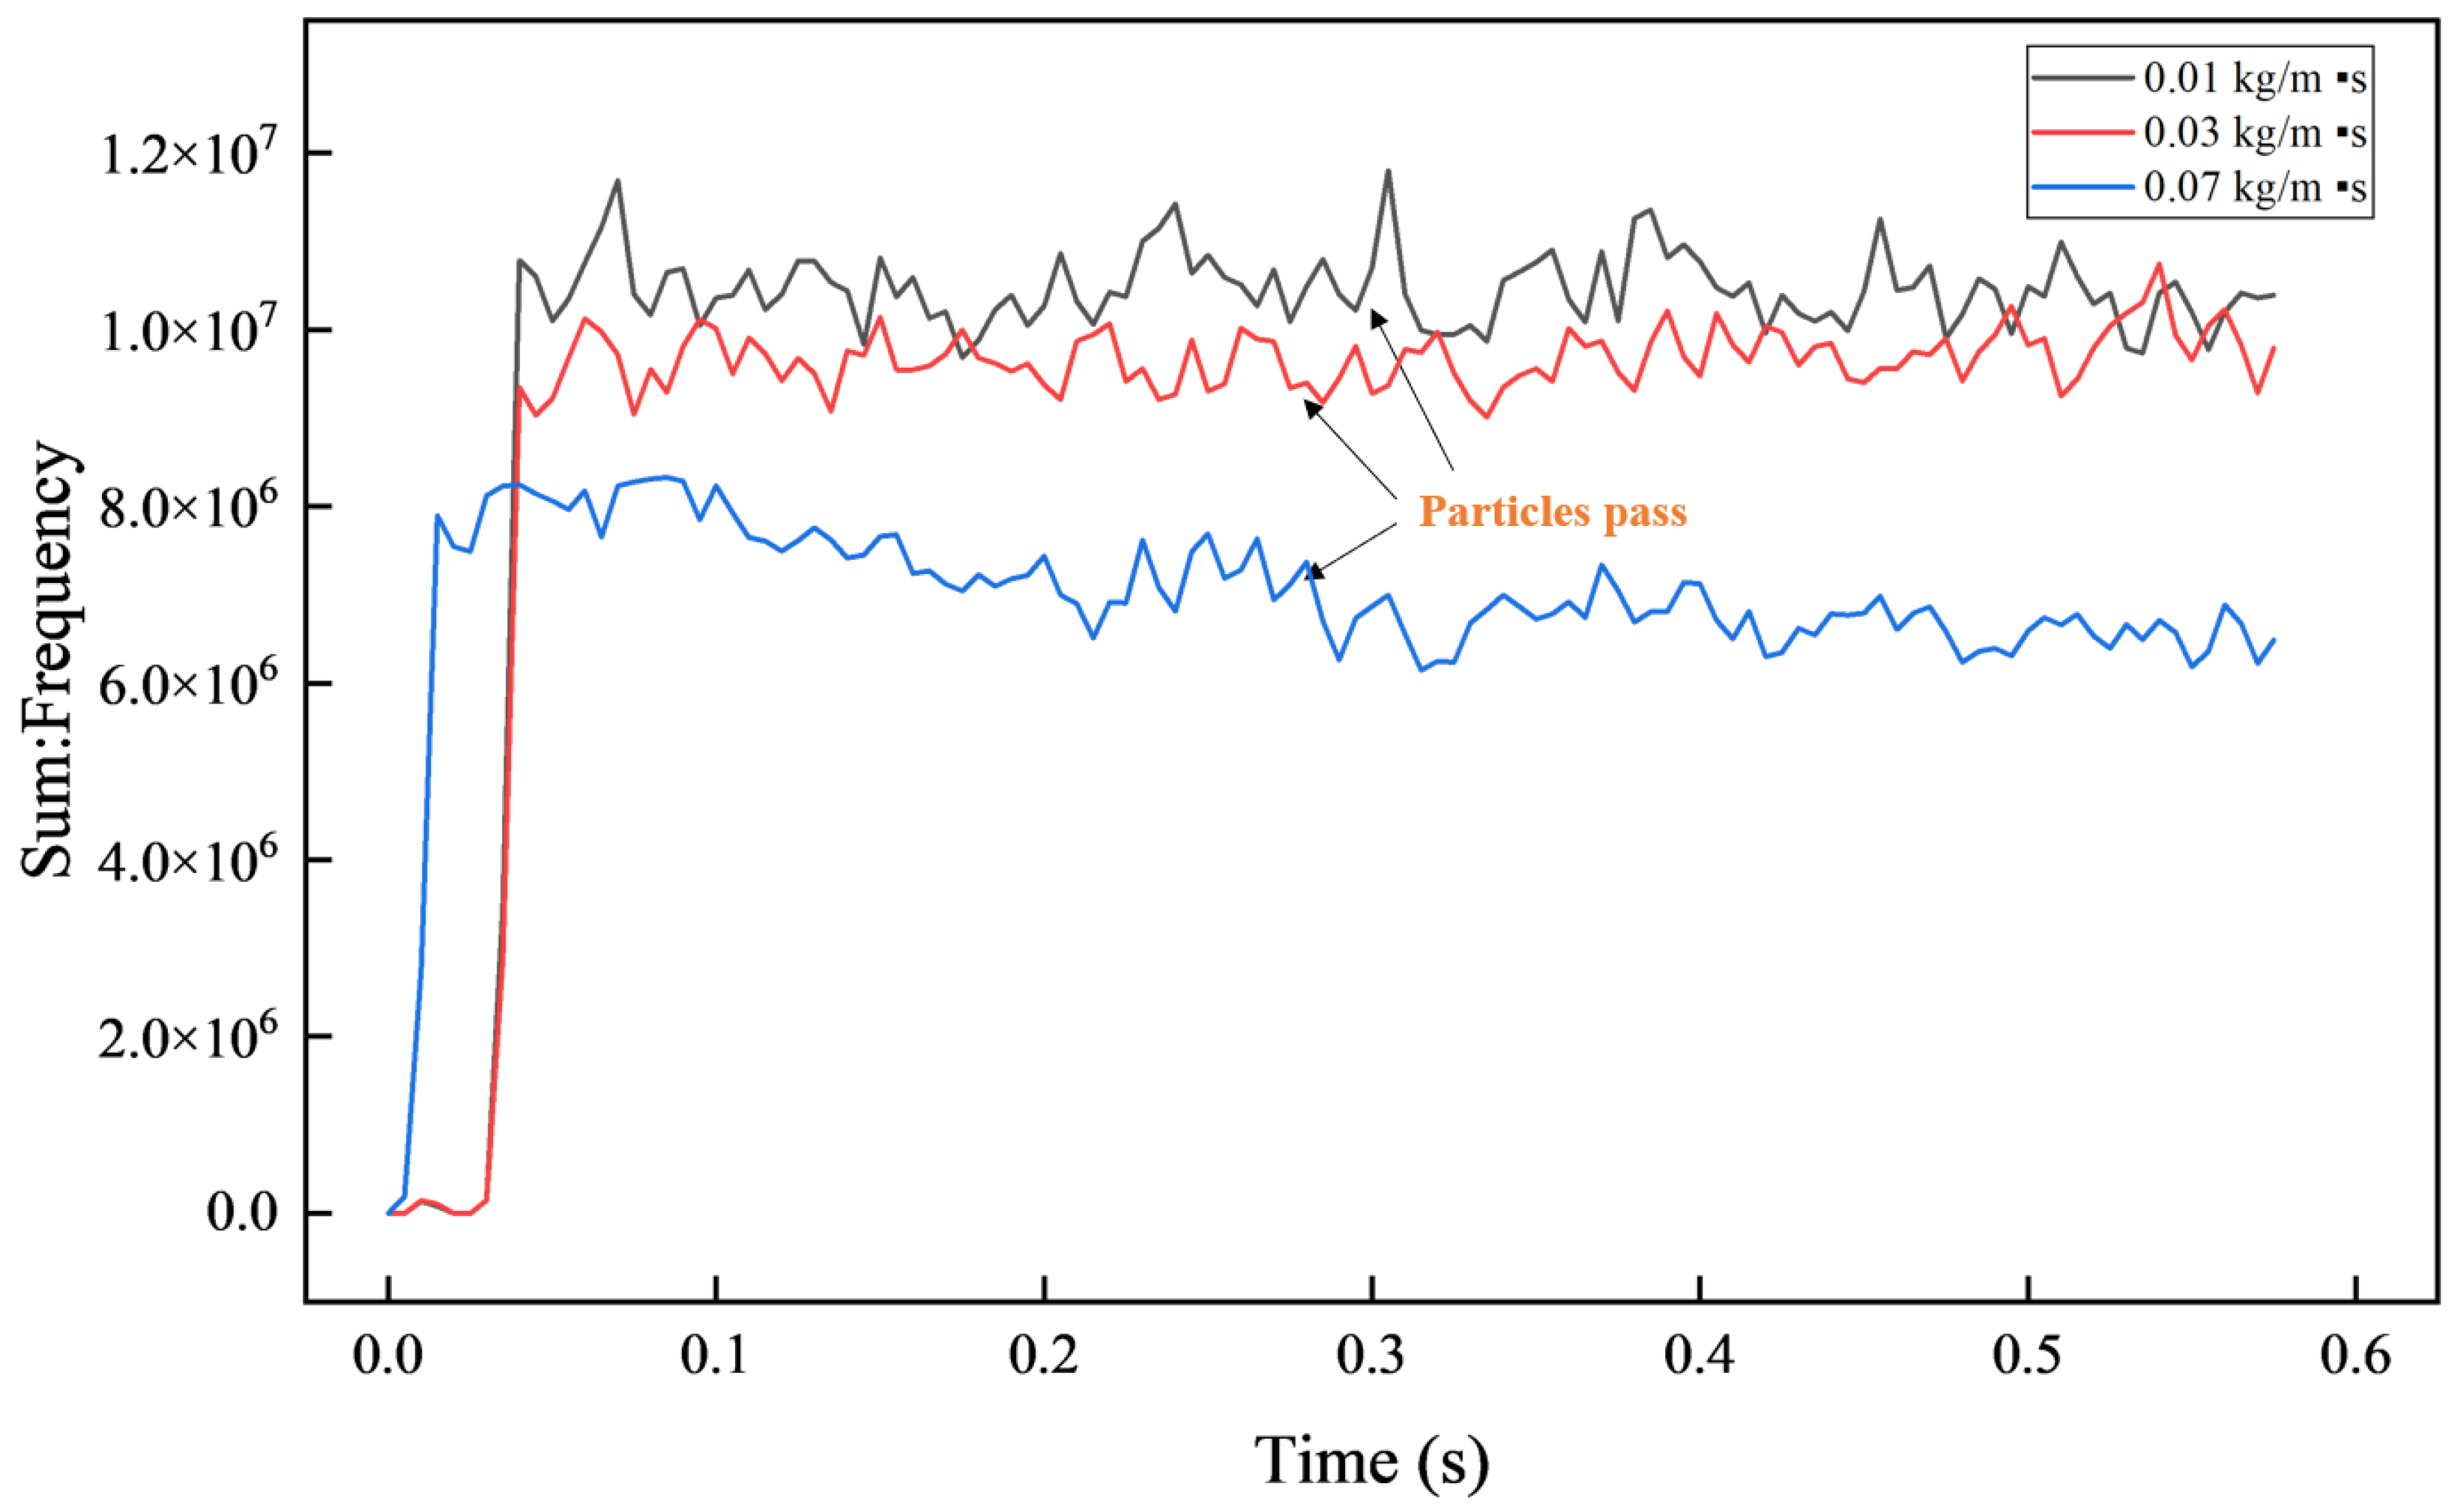
4.5. Influence of Fluid Viscosity on Flow Properties

As the primary performance of drilling fluid, viscosity cannot be ignored. Drilling fluid relies on its own viscosity to suspend and carry solid phase materials. Therefore, it has a specific influence on the flow properties of LCMs.
The flow properties of LCMs with two particle size under the action of different fluid viscosities were tested. The particle size of LCMs is 1.4 mm and 1.5 mm, which are the boundary conditions for blocking the mud screen or not, respectively. Figure 21 shows that the increase in fluid viscosity effectively reduces the collision of LCMs with the tool. This weakens LCMs from being hindered by tools. This enables the LCMs to leave the mud screen in a more orderly manner from the pores, which improves the overflow rate of the LCMs. As seen in Figure 22, the increase in fluid viscosity caused the LCMs to shift from clogging the tool to a gentle spill. This shows that the fluid’s viscosity can change whether the LCMs pass or not to a certain extent. In the process of plugging while drilling, the viscosity of the drilling fluid should be increased within a safe range, which is beneficial to the tool’s safety.

5. Conclusions

In this study, the flow-through performance of LCMs in mud screen was investigated by using a coupled CFD–DEM method to build a scale model with the actual tool. Concluded as follow:
(1)
The migration process of LCMs in the mud screen can be divided into three stages, including I, the migration of LCMS. II, Retention of LCMS. III, LCMS stacking. Among them, the retention stage of LCM dominates the clogging degree of LCMs to mud screen.
(2)
The retention behavior of LCMs can be divided into two types. One is derived from the bridging of LCMs with larger particle size in the pores of the mud screen, thereby hindering the subsequent overflow of LCMs. Another source is that the difference between the entry speed and the overflow speed of LCMs causes the accumulation of LCMs in the mud screen.
(3)
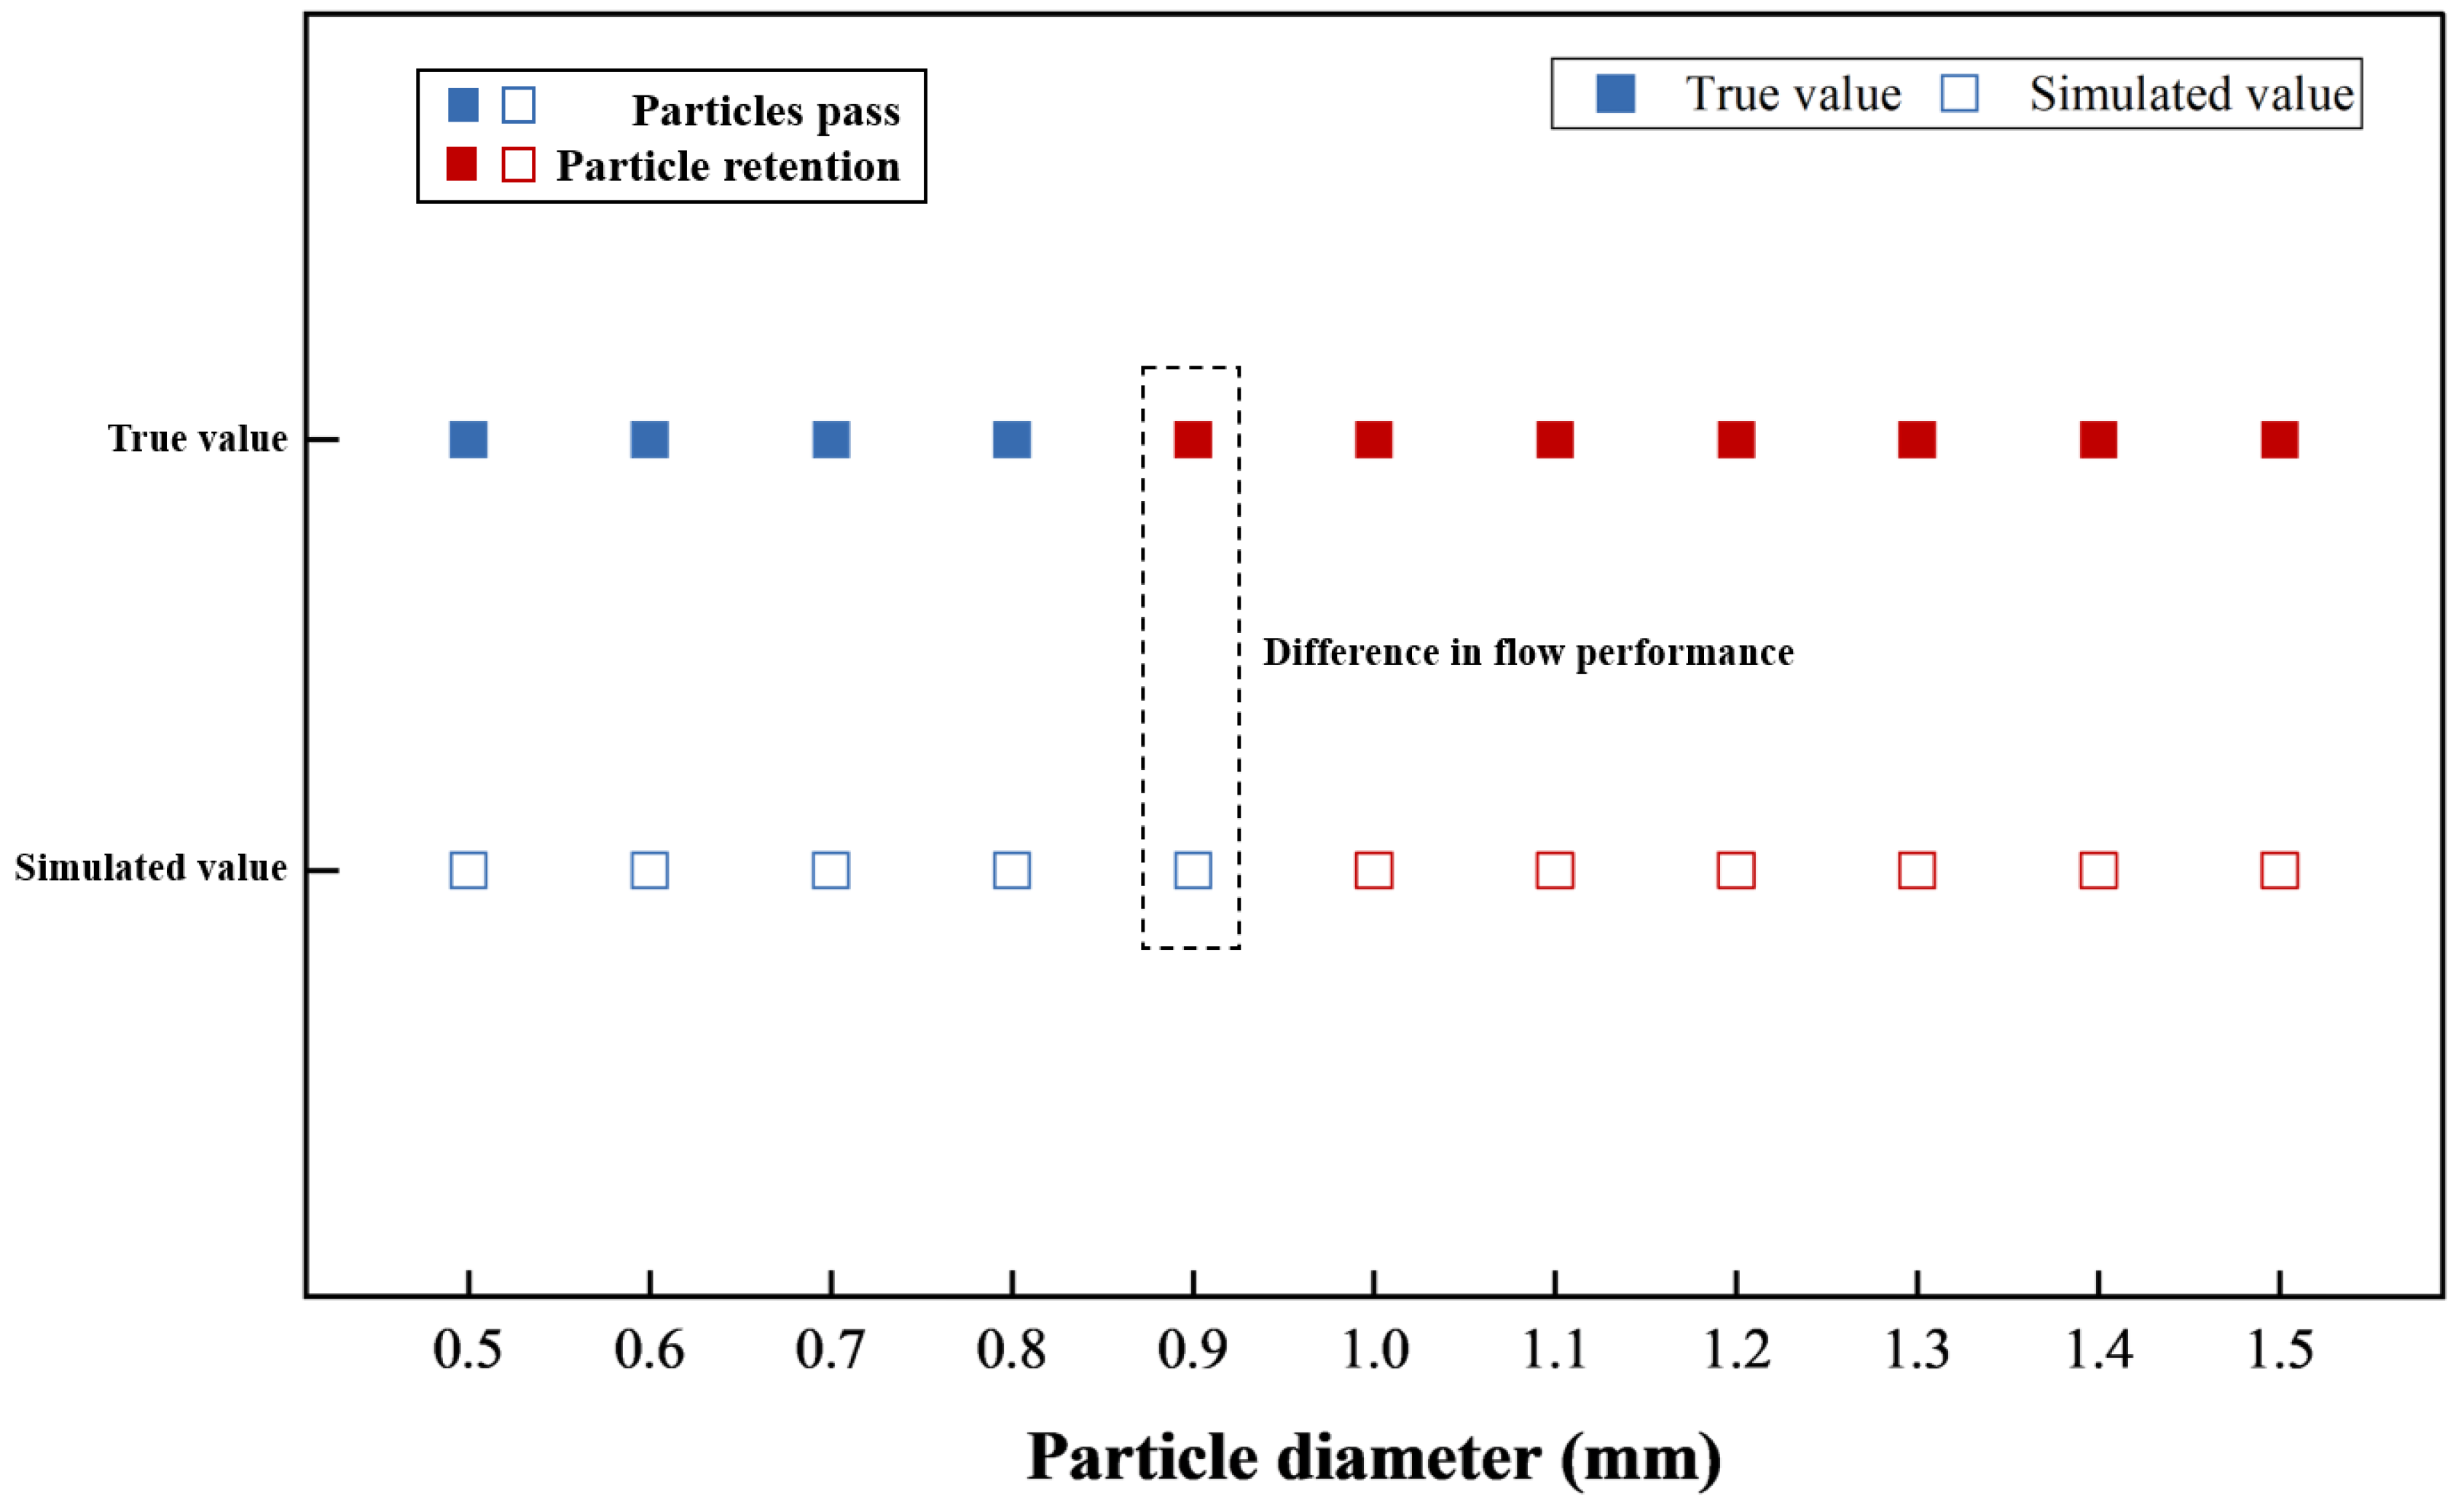
Mud screen requires that the particle size of LCMs needs to be controlled at 2 mm or less. When the particle size of LCMs is less than 1.2 mm, the results of the mass flow convection performance of LCMs do not change much. When the particle size of LCMs ranges from 1.2 mm to 2 mm, the mass flow of LCMs needs to be paid attention to because it dramatically affects the flow properties of LCMs.
(4)
The flow properties of LCMs are favorable for fluid at high displacement. It helps LCMs achieve higher overflow speed. Low displacement results in more severe clogging of the mud screen by LCMs. The increase of fluid viscosity reduces the collision frequency of LCMs with the tool, and the overflow of LCMs from the holes is more orderly. Therefore, in the MWD construction, optimizing the viscosity and displacement of the drilling fluid can reduce the probability of the mud screen being blocked.

Author Contributions

Conceptualization, L.P. and M.X.; methodology, P.X. and M.X.; software, J.S.; validation, L.P., J.S. and M.X.; formal analysis, L.P.; investigation, P.X. and Q.L.; resources, M.X. and J.Z.; data curation, L.P.; writing—original draft preparation, L.P.; writing—review and editing, P.X.; visualization, L.P.; supervision, M.X.; project administration, P.X.; funding acquisition, M.X. All authors have read and agreed to the published version of the manuscript.

Funding

This research was supported by the Open Foundation of Cooperative Innovation Center of Unconventional Oil and Gas, Yangtze University (Ministry of Education & Hubei Province), No. UOGBX2022-02 and UOG2022-02.

Acknowledgments

We would like to thank The Bakken Laboratory of YANGTZE University for their support. At the same time, I would like to thank my teacher Mingbiao Xu for his help.

Conflicts of Interest

The authors declare no conflict of interest.

References

  1. Sun, J.; Bai, Y.; Cheng, R.; Lyu, K.; Liu, F.; Feng, J.; Lei, S.; Zhang, J.; Hao, H. Research progress and prospect of plugging technologies for fractured formation with severe lost circulation. Pet. Explor. Dev. 2021, 48, 732–743. [Google Scholar] [CrossRef]
  2. Pu, L.; Xu, P.; Xu, M.; Song, J.; He, M. Lost circulation materials for deep and ultra-deep wells: A review. J. Pet. Sci. Eng. 2022, 214, 110404. [Google Scholar] [CrossRef]
  3. Yan, C.; Deng, J.; Yu, B.; Li, W.; Chen, Z.; Hu, L.; Li, Y. Borehole stability in high-temperature formations. Rock Mech. Rock Eng. 2014, 47, 2199–2209. [Google Scholar] [CrossRef]
  4. Meng, M.; Chen, P.; Ren, R. Statistic evaluation of failure criteria in wellbore stability with temperature effects. Fuel 2019, 252, 730–752. [Google Scholar] [CrossRef]
  5. Feng, Y.; Cai, W.; Deng, J.; Lin, H.; Xie, T.; Chu, M. Application of geomechanics modeling in the study of fluid loss mechanism of fractured reservoirs in Bohai Bay, China. J. Pet. Sci. Eng. 2022, 212, 110297. [Google Scholar] [CrossRef]
  6. Izyurov, V.; Kharitonov, A.; Semenikhin, I.; Korsunov, E.; Gassan, A.; Tikhonov, E.; Jadan, G.; Stashko, V.; Blagonadeshniy, I.; Manikhin, A.; et al. Selecting Bridging Agents’ Particle Size Distribution for Optimum Plugging While Drilling in Permeable Zones. In Proceedings of the SPE Russian Petroleum Technology Conference, Moscow, Russia, 22 October 2019; OnePetro: Richardson, TX, USA, 2019. [Google Scholar]
  7. Zhai, K.; Yi, H.; Liu, Y.; Geng, Y.; Fan, S.; Zhu, D. Experimental evaluation of the shielded temporary plugging system composed of calcium carbonate and acid-soluble preformed particle gels (ASPPG) for petroleum drilling. Energy Fuels 2020, 34, 14023–14033. [Google Scholar] [CrossRef]
  8. Lu, C.; Zhang, T.; Zhao, H. Improving the application depth of electromagnetic measurement while drilling (EM-MWD) systems by receiving signals from adjacent wells. J. Appl. Geophys. 2021, 195, 104468. [Google Scholar] [CrossRef]
  9. Shinmoto, Y. A case study on downhole measurement to monitor drilling hazards in integrated ocean drilling program (IODP) expedition 314. In Proceedings of the OCEANS 2008-MTS/IEEE Kobe Techno-Ocean, Kobe, Japan, 28 May 2008; IEEE: Manhattan, NY, USA, 2008; pp. 1–8. [Google Scholar] [CrossRef]
  10. Valerio, A.; Carvalho G, L. MWD and MPD System Combination Successfully Manages Ultra-High LCM Concentrations and Cement Slurries in Loss Scenarios. In Proceedings of the SPE International Conference and Exhibition on Formation Damage Control, Lafayette, LA, USA, 12 February 2020; OnePetro: Richardson, TX, USA, 2020. [Google Scholar] [CrossRef]
  11. Reckmann, H.; Jogi, P.; Kpetehoto, F.T.; Chandrasekaran, S.; Macpherson, J.D. MWD failure rates due to drilling dynamics. In Proceedings of the IADC/SPE Drilling Conference and Exhibition, New Orleans, LA, USA, 2 February 2010; OnePetro: Richardson, TX, USA, 2010. [Google Scholar] [CrossRef]
  12. Kuyken, C.; van der Plas, K.; Frederiks, K.; Williams, M.; Cockburn, C. Developing and Using Slimhole Rotary Steerable Systems in the North Sea Changing the Economics of Mature Asset Drilling. In Proceedings of the SPE Offshore Europe Oil and Gas Exhibition and Conference, Aberdeen, UK, 2 September 2003; OnePetro: Richardson, TX, USA, 2003. [Google Scholar] [CrossRef]
  13. Han, G.Z.; Ai, C. In Proceedings of the Applications of Mud Pulse MWD/LWD System in Bakken Formation, North Dakota, USA. In Proceedings of the Applied Mechanics and Materials, Bangkok, Thailand, 21–22 June 2013; Trans Tech Publications Ltd.: Bäch, Switzerland, 2013; Volume 415, pp. 672–676. [Google Scholar] [CrossRef]
  14. Hussain, S.; Huelvan, Y.; Adams, W. Measurement while drilling, logging while drilling, and rotary steerable systems performance, benefits, and challenges in managed pressure drilling and underbalanced drilling. In Proceedings of the SPE Bergen one day seminar, Bergen, Norway, 2 April 2014; OnePetro: Richardson, TX, USA, 2014. [Google Scholar] [CrossRef]
  15. Attong, D.J.; Singh, U.B.; Teixeira, G. Successful use of a modified MWD tool in a high-concentration LCM mud system. SPE Drill. Complet. 1995, 10, 22–26. [Google Scholar] [CrossRef]
  16. Klotz, C.; Bond, P.R.; Wassermann, I.; Priegnitz, S. A new mud pulse telemetry system for enhanced MWD/LWD applications. In Proceedings of the IADC/SPE Drilling Conference, Orlando, FL, USA, 4 March 2008; OnePetro: Richardson, TX, USA, 2008. [Google Scholar] [CrossRef]
  17. Hache, J.M.; Till, P. New-generation retrievable MWD tool delivers superior performance in harsh drilling environments. In Proceedings of the SPE/IADC Drilling Conference, Amsterdam, The Netherlands, 27 February 2001; OnePetro: Richardson, TX, USA, 2001. [Google Scholar] [CrossRef]
  18. Zhao, X.; Qiu, Z.; Sun, B.; Liu, S.; Xing, X.; Wang, M. Formation damage mechanisms associated with drilling and completion fluids for deepwater reservoirs. J. Pet. Sci. Eng. 2019, 173, 112–121. [Google Scholar] [CrossRef]
  19. Zhang, T.; Zeng, X.; Guo, J.; Zeng, F.; Li, M. Numerical simulation on oil-water-particle flows in complex fractures of fractured-vuggy carbonate reservoirs. J. Pet. Sci. Eng. 2022, 208, 109413. [Google Scholar] [CrossRef]
  20. Ardekani, A.M.; Rangel, R.H. Numerical investigation of particle-particle and particle–wall collisions in a viscous fluid. J. Fluid Mech. 2008, 596, 437–466. [Google Scholar] [CrossRef]
  21. Wang, G.; Dong, M.; Wang, Z.; Ren, T.; Xu, S. Removing cuttings from inclined and horizontal wells: Numerical analysis of the required drilling fluid rheology and flow rate. J. Nat. Gas Sci. Eng. 2022, 102, 104544. [Google Scholar] [CrossRef]
  22. Casas, G.; De-Pouplana, I.; Gandikota, R.; Oñate, E. Numerical simulation of particle impact drilling (PID) systems: A one-way coupled approach. Comput. Part. Mech. 2022, 9, 735–757. [Google Scholar] [CrossRef]
  23. Feng, C.; Liu, W.; Gao, D. CFD simulation and optimization of slurry erosion of PDC bits. Powder Technol. 2022, 408, 117658. [Google Scholar] [CrossRef]
  24. Zakerian, A.; Sarafraz, S.; Tabzar, A.; Hemmati, N.; Shadizadeh, S.R. Numerical modeling and simulation of drilling cutting transport in horizontal wells. J. Pet. Explor. Prod. Technol. 2018, 8, 455–474. [Google Scholar] [CrossRef]
  25. Lin, C.; Taleghani, A.D.; Kang, Y.; Xu, C. A coupled CFD-DEM numerical simulation of formation and evolution of sealing zones. J. Pet. Sci. Eng. 2022, 208, 109765. [Google Scholar] [CrossRef]
  26. Kloss, C.; Goniva, C.; Hager, A.; Amberger, S.; Pirker, S. Models, algorithms and validation for opensource DEM and CFD–DEM. Prog. Comput. Fluid Dyn. Int. J. 2012, 12, 140–152. [Google Scholar] [CrossRef]
  27. Kanitz, M.; Grabe, J. Multiscale investigation of suffusion with coupled CFD-DEM-Influence of different drag force models. In Proceedings of the 2nd International Conference on the Material Point Method for Modelling Soil-Water-Structure Interaction, Cambridge, UK, 8–10 January 2019; Available online: https://onlinelibrary.wiley.com/doi/pdf/10.1002/nag (accessed on 20 August 2022).
  28. Wang, D.; You, Z.; Wang, M.; Li, Q.; Wu, L. Numerical investigation of proppant transport at hydraulic-natural fracture intersection. Powder Technol. 2022, 398, 117123. [Google Scholar] [CrossRef]
  29. Hertz, H. Über die Berührung fester elastischer Körper. J. Für Die Reine Angew. Math. 1882, 92, 22. [Google Scholar]
  30. Tsuji, Y.; Tanaka, T.; Ishida, T. Lagrangian numerical simulation of plug flow of cohesionless particles in a horizontal pipe. Powder Technol. 1992, 71, 239–250. [Google Scholar] [CrossRef]
  31. Mindlin, R.D.; Deresiewicz, H. Elastic Spheres in Contact Under Varying Oblique Forces. J. Appl. Mech. 1953, 20, 327–344. [Google Scholar] [CrossRef]
  32. Hærvig, J. On the Adhesive Behaviour of Micron-sized Particles in Turbulent Flow: A Numerical Study Coupling the Discrete Element Method and Large Eddy Simulations; Aalborg University Press: Aalborg, Denmark, 2017. [Google Scholar]
  33. Liu, D.; van Wachem, B.G.M.; Mudde, R.F.; Chen, X.; Ommen, J.R.V. An adhesive CFD-DEM model for simulating nanoparticle agglomerate fluidization. AIChE J. 2016, 62, 2259–2270. [Google Scholar] [CrossRef]
  34. Zhou, Z.Y.; Kuang, S.B.; Chu, K.W.; Yu, A.B. Discrete particle simulation of particle–fluid flow: Model formulations and their applicability. J. Fluid Mech. 2010, 661, 482–510. [Google Scholar] [CrossRef]
  35. Izyurov, V.; Kharitonov, A.; Semenikhin, I.; Korsunov, E.; Gassan, A.; Tikhonov, E.; Jadan, G.; Stashko, V.; Blagonadeshniy, I.; Manikhin, A.; et al. Lessons Learned from Formation Pressure Measurements While Drilling. In Proceedings of the SPWLA 45th Annual Logging Symposium, Noordwijk, The Netherlands, 6 June 2004; OnePetro: Richardson, TX, USA, 2004. [Google Scholar] [CrossRef]
Figure 1. The mud screen placed in the MWD tool.
Processes 10 01955 g001
Figure 2. Spring–slider–dashpot model for Hertzian contact model [32].
Processes 10 01955 g002
Figure 3. Schematic diagram of CFD–DEM coupling technique.
Processes 10 01955 g003
Figure 4. (a): Slurry migration from the mud screen tool. (b): Mud screen tool size and grid.
Processes 10 01955 g004
Figure 5. The experimental device for the blocked safety test of the mud screen tool.
Processes 10 01955 g005
Figure 6. Flow properties of materials for plugging while drilling with different particle size in mud screen.
Processes 10 01955 g006
Figure 7. The mud screen tool is blocked by LCMs.
Processes 10 01955 g007
Figure 8. LCMs pass smoothly through the mud screen tool.
Processes 10 01955 g008
Figure 9. Displacement and retention behavior of LCMs in mud screen, (ae): behavior changes with mud injection time.
Processes 10 01955 g009
Figure 10. The pressure change of the fluid during the process of blocking the mud screen by LCMs.
Processes 10 01955 g010
Figure 11. Effect of particle size and mass flow of LCMs on flow properties.
Processes 10 01955 g011
Figure 12. Effect of particle size of LCMs on the plugging time under the condition of mass flow of 3 kg/s.
Processes 10 01955 g012
Figure 13. Behavior of LCMs with different particle size to plug the tool.
Processes 10 01955 g013
Figure 14. Influence of mass flow of LCMs on the probability of blocking in mud screen.
Processes 10 01955 g014
Figure 15. 1.6 mm LCMs entering at 2 kg/s mass flow.
Processes 10 01955 g015
Figure 16. 1.6 mm LCMs entering at 3 kg/s mass flow.
Processes 10 01955 g016
Figure 17. Velocity vector diagrams of LCMs under the action of low, medium and high displacement fluids.
Processes 10 01955 g017
Figure 18. Flow properties of LCMs under the action of the low, medium, and high displacement fluids.
Processes 10 01955 g018
Figure 19. The magnitude of the pulling force of 1.4 mm LCMs at different displacements.
Processes 10 01955 g019
Figure 20. Spill velocity of 1.4 mm LCMs at different displacements.
Processes 10 01955 g020
Figure 21. Flow properties of 1.4 mm LCMs under the action of drilling fluids with different viscosities.
Processes 10 01955 g021
Figure 22. Flow properties of 1.5 mm LCMs under the action of drilling fluids with different viscosities.
Processes 10 01955 g022
Table 1. Input parameters of DEM-CFD numerical simulation.
DEM ParametersValuesCFD ParametersValues
Particle Size, d (m) [1.1 × 10⁻³, 2.2 × 10⁻³]The density of the fluid, ρf (g/cm3)1.3
Particle Density, ρs (g/cm3)2.6The viscosity of the fluid, μf (kg/m·s) [0.01, 0.07]
Particle Young’s Modulus, E (MPa)1.0 × 10⁹Displacement of fluid, m3/h [55, 125]
Poisson’s ratio of particles0.3Turbulence intensityk-epsilon(2eqn)
Static Friction of Particle to particle, μs0.8Wall roughness constant1%
Dynamic Friction of Particle to particle, μr0.5Wall roughness height, h (mm)0.5
Restitution Coefficient of Particle to particle0.3CFD time step, Δts (s)0.2
Static Friction of Particle to boundary, μs0.9Acceleration of gravity, g (m/s2)10−3
Dynamic Friction of Particle to boundary, μr0.5
Restitution Coefficient of Particle to the boundary0.2
Tangential Stiffness Ratio1
DEM time step, Δts (s)5 × 10⁻³
Publisher’s Note: MDPI stays neutral with regard to jurisdictional claims in published maps and institutional affiliations.

