Article

Improving the Efficiency of the Bowden Cable Terminal Injection Process for the Automotive Industry

by
José L. T. A. Pereira
1,
Raul D. S. G. Campilho
1,2,*,
Francisco J. G. Silva
1,2,
Isidro J. Sánchez-Arce
2,
Chander Prakash
3,4 and
Dharam Buddhi
5
1
Departamento de Engenharia Mecânica, Instituto Superior de Engenharia do Porto, Instituto Politécnico do Porto, R. Dr. António Bernardino de Almeida, 431, 4200-072 Porto, Portugal
2
INEGI—Institute of Science and Innovation in Mechanical and Industrial Engineering—Pólo FEUP, Rua Dr. Roberto Frias, 400, 4200-465 Porto, Portugal
3
School of Mechanical Engineering, Lovely Professional University, Phagwara 144411, India
4
Division of Research and Development, Lovely Professional University, Phagwara 144411, India
5
Division of Research & Innovation, Uttaranchal University, Dehradun 248007, India
*
Author to whom correspondence should be addressed.
Processes 2022, 10(10), 1953; https://doi.org/10.3390/pr10101953
Submission received: 22 August 2022 / Revised: 11 September 2022 / Accepted: 16 September 2022 / Published: 28 September 2022
(This article belongs to the Special Issue Synergies in Combined Development of Processes and Models)

Abstract

:
Control cables transfer force between two separate locations by a flexible mean, and hence, they are important in the automotive industry and many others; their terminals interact with both moving and moved mechanisms, so they must be strong. Cable terminals are commonly made of ZAMAK and are created by injection molding. However, such a production method requires leaving extra material to allow the correct molding, also known as sprues, which are removed later in the process. In this case, the sprues were separating from the terminals in an uncontrolled way. In this work, the cause of sprues separating prematurely from the terminals in a production line is addressed. The whole process was analyzed, and each possible solution was evaluated using process improvement techniques and the Finite Element Method, leading to the best solutions. Molds, mold structures, and auxiliary equipment were improved, resulting in a minimally invasive intervention and remaining compatible with other equipment. Cost analyses were done, indicating an investment return in less than a year. The modification led to a reduction of 62.6% in the sprue mass, while porosity was reduced by 10.2% and 55.9%, corresponding to two terminal models. In conclusion, the interventions fulfilled the requirements and improved the operation of the line.

1. Introduction

In the global scenario of the industry, all organizations are dedicated to being more competitive with the increase in productivity achieved through superior quality manufacturing processes and at a lower cost [1]. Quality control has the function of guaranteeing and improving the quality of the product through inspection and process control, which leads to the fulfilment of customer requirements and the reduction of quality losses [2]. Ishikawa [3] proposed seven basic tools to find solutions to problems and achieve process improvements: histograms, Pareto diagrams, cause and effect diagrams, control charts, verification sheets, and scatter diagrams. Continuous quality improvement is a management strategy that aims to maintain and improve quality through constant evaluation of causes that generate quality defects. After identifying the causes, solutions are created to avoid defects and make optimizations [4]. Within the currently available tools, brainstorming, Ishikawa (or cause and effect) diagrams, and Strengths, Weaknesses, Opportunities, and Threats (SWOT) analyses are particularly useful for process improvement in industrial environments [5].
Brainstorming is a group or even individual process used to generate ideas in a non-judgmental environment. In the meeting, the problem is presented and the members should present ideas, while not criticizing the other ideas [4]. There are three fundamental principles for group brainstorming [6]: (1) aiming for quantity instead of quality (anything that limits the number of ideas goes against brainstorming principles), (2) freedom of thought (not to criticize the ideas of others, even implicitly, and to let ideas flow to also allow new ones to be built from them), and (3) encouraging new and innovative ideas (innovative ideas, even if outside the context of the theme, serve as pillars for creative cycles). Typically, this technique involves the following steps: problem presentation, idea creation, idea review, idea selection, and idea prioritization. For example, Rodrigues et al. [7] employed the brainstorming process for the development of a computer application to solve the mismanagement of waste reports that existed in a company in the automotive industry. In this case, workers from various sectors of the company were involved in the brainstorming process to define the required specifications for the application. As a result, using the developed computer application, it was possible to increase the reliability of waste reports by 76% and reduce their associated cost and time by 75%. The cause-effect diagram, also known as the Ishikawa diagram or fishbone diagram, is a tool used for identifying the possible causes of a problem [4]. The causes are organized by families, which in turn are divided into subcategories. The families considered by Ishikawa [3] are method, labor, raw material, measurement, and environment. The diagram helps to understand the relationships between these parts by determining causes with a positive or negative impact, determining the causes of a given effect and identifying areas with lack of information [3]. Silva et al. [8] carried out a study to reduce finishing operations and obtain defect-free parts with a good appearance by optimizing die-casting processes and mold configuration. To analyze all factors that influence the quality of the produced parts, a cause-effect diagram was made, and guidelines were established, leading to the intended results in the ZAMAK casting process. Likewise, the SWOT analysis is a strategic quality tool to analyze both internal and external factors involved in a process. Through external analysis, the threats and opportunities of the competitive environment in which the process operates are identified, while the internal analysis helps to assess the organization’s strengths and weaknesses [9]. After identifying these factors, strategies are developed in order to intensify strengths, eliminate weaknesses, explore opportunities, and combat threats [10]. Karimi et al. [11] studied the factors affecting the production performance of the ceramic industry, aiming to increase the level of exports, understand the best opportunities in terms of investments, and formulate a competitive strategy based on the potential of the company and the industry. The objectives were met, and the SWOT analysis proved to be an effective approach to the assessment of the strengths, weaknesses, opportunities, and threats involved in the ceramic industry.
Metal casting is a widely used process for large production runs due to the low cost and flexibility in the components’ geometry and materials. In casting, the parts are obtained through the solidification of the molten metal previously poured into the mold cavity. Casting is nowadays vital in the metalworking industry [12]; it can be applied to almost all metal alloys, with iron, aluminum, steel, and copper being the most common [13]. Casting is a very versatile process with significant advantages, such as the ability to produce complex geometry parts, the possibility to obtain the final form, the capacity to produce large parts, and the application to any type of metal. Nonetheless, some issues require attention, such as the obtained mechanical properties, the existence of porosities, poor surface finish, and poor geometric precision [12,14]. One of the most popular variants of casting processes is die casting, a complex process that depends on many parameters, so it must, therefore, be properly controlled to optimize it. Die casting is characterized by filling the mold cavity by injecting molten metal at high speed and pressure. Typical pressures, ranging from 7 to 350 MPa, are maintained during solidification and, subsequently, the molds are opened [14]. This process makes it possible to obtain parts with good mechanical properties, high dimensional accuracy, complex geometries, and excellent surface finishes [8,15]. It is a process of extreme precision since it works at high temperatures and pressures in short time intervals. Otherwise, it would cause numerous problems [16]. The steel molds are made up of two halves, to allow the extraction of the parts, and enable serial production of parts. The process begins with the closing of the molds, followed by the injection of molten metal. After solidification, the mold is opened, and the parts are extracted. The whole process is carried out in short time intervals, resulting in the most productive process for non-ferrous alloys [15]. Despite the high cost of molds, the price of parts produced in large series is reduced [17]. The geometry of the parts to be produced sometimes requires the use of cores and modules in the molds. Runner and cooling systems must also be incorporated during mold development [15]. The automation of processes can additionally be considered as an important parameter that allows reducing production costs [15]. Cavity filling can be improved with mold coatings that not only reduce the coefficient of friction but also improve wear resistance [18]. The main advantages of this manufacturing process are the high production rates, the unit cost of the parts in large series, the tight tolerances (±0.076 mm) for small parts, the good finishes, the small geometries thickness (around 0.5 mm), and the rapid solidification, which lead to small grain size and high strength. The major drawbacks are the limitation in the metal alloys to be used and in the geometries, which have to allow the extraction of the part from the mold [14]. The parts typically most produced by this process are transmission housings, pumps, and engine and industrial machinery components [19]. The molds are one of the most important components, because there the molten metal takes shape and the parts are produced [20]. Die casting molds are normally produced from mild steel with hardening heat treatment. In addition, molds are sprayed with lubricant to prevent the material from adhering to the mold [14].
Research is ongoing regarding process improvement in die casting from different perspectives [20,21]. Nunes, Silva, Andrade, Alexandre, and Baptista [18] studied the wear mechanisms of two molds for the automotive industry with severe problems. Mold coating was proposed, and its benefits were tested by analyzing the wear resistance behavior and respective wear mechanisms. Tribological tests were undertaken to study the correlation between laboratory and industrial tests using Scanning Electron Microscopy (SEM) and Energy Dispersive Spectroscopy (EDS). The most suitable results, involving less friction coefficient and improved wear resistance, were found for the Ti40Al60N coating. Silva et al. [8] optimized the injection parameters and mold configuration for the fabrication of a ZAMAK aesthetic part that should be injected in one-shot and with minimal finishing operations. To optimize defect-free parts, the high-pressure die casting process and relevant parameters were addressed. The work involved numerical simulations in the SolidCastTM software to analyze the material flow into the mold. As a result, the optimal set of parameters was defined, and mold geometry modifications were undertaken, leading to achieving the best results. Sun et al. [22] addressed the gas pores in engine crankcases fabricated by low-pressure die casting. Gas entrainment defects were detected near the top crankcases’ faces, with the presence of oxide films. It was found that filters could be useful to remove oxide inclusions bigger than the mesh size from the furnace and the crucible. Numerical simulations were carried out to model mold filling with magma in the Flow-3D software, showing that the gating velocity increased for higher pressurization rates. Moreover, turbulence occurred in the middle of the casting due to a waterfall structure and confluence of the free surface metal. The authors suggested reducing the gating velocity by decreasing the pressurization rate.
This work addresses the sprue size and its consequences from an industrial case study. In this case, the process was studied; also, techniques such as the Strengths, Weaknesses, Opportunities, and Threats (SWOT) method together with the Finite Element Method were employed to determine the best alternative solutions. Subsequently, the mold and mold structure were improved, allowing for a controlled sprue size and a common mold structure for 95% of the products of the company, which reduced the tooling preparation time. Then, adjacent components such as the measuring kit, the strength testing device, and the structure of the robotic manipulator were addressed to facilitate the product flow. All the interventions were planned and minimally invasive as possible, while taking advantage of the components currently in operation, maintaining the compatibility with the other production lines in the company, and reducing the interventions’ costs.

2. Methods and Problem Characterization

2.1. Objectives and Requirements

The production line for Bowden cables analyzed here is part of a company located in northern Portugal while the analysis and design were done on their request; the company name is kept anonymous by their request. One of the processes performed in the production line is the injection molding of cable terminals suiting several applications; thus, molds are specific for each model. Inherently to the injection molding process, the injected cable terminal is accompanied by sprues, which in their current form are large and with a random shape; an example is shown in Figure 1. Although the sprues are meant to be removed at a specific stage, due to their size, they break and fall through the production line, leaving them scattered around. In their current form, the average weight of the sprue for each injected cable is 1.93 g, the company produces on average 72,450 cables/month (as calculated from December 2020 to May 2021), giving a total of 140.5 kg/month of ZAMAK being scrapped.
This work aims to reduce the sprue size on the control cables, while also having control over the sprues’ size, allowing for its removal within a specific zone of the equipment. The necessary modifications are planned for the production line BX726 of the company, which is in continuous operation; consequently, all the modifications should be done within a two-day period, as requested by the host company. In addition, the modifications should be as minimal as possible, allowing the interchangeability with other lines and reducing costs.

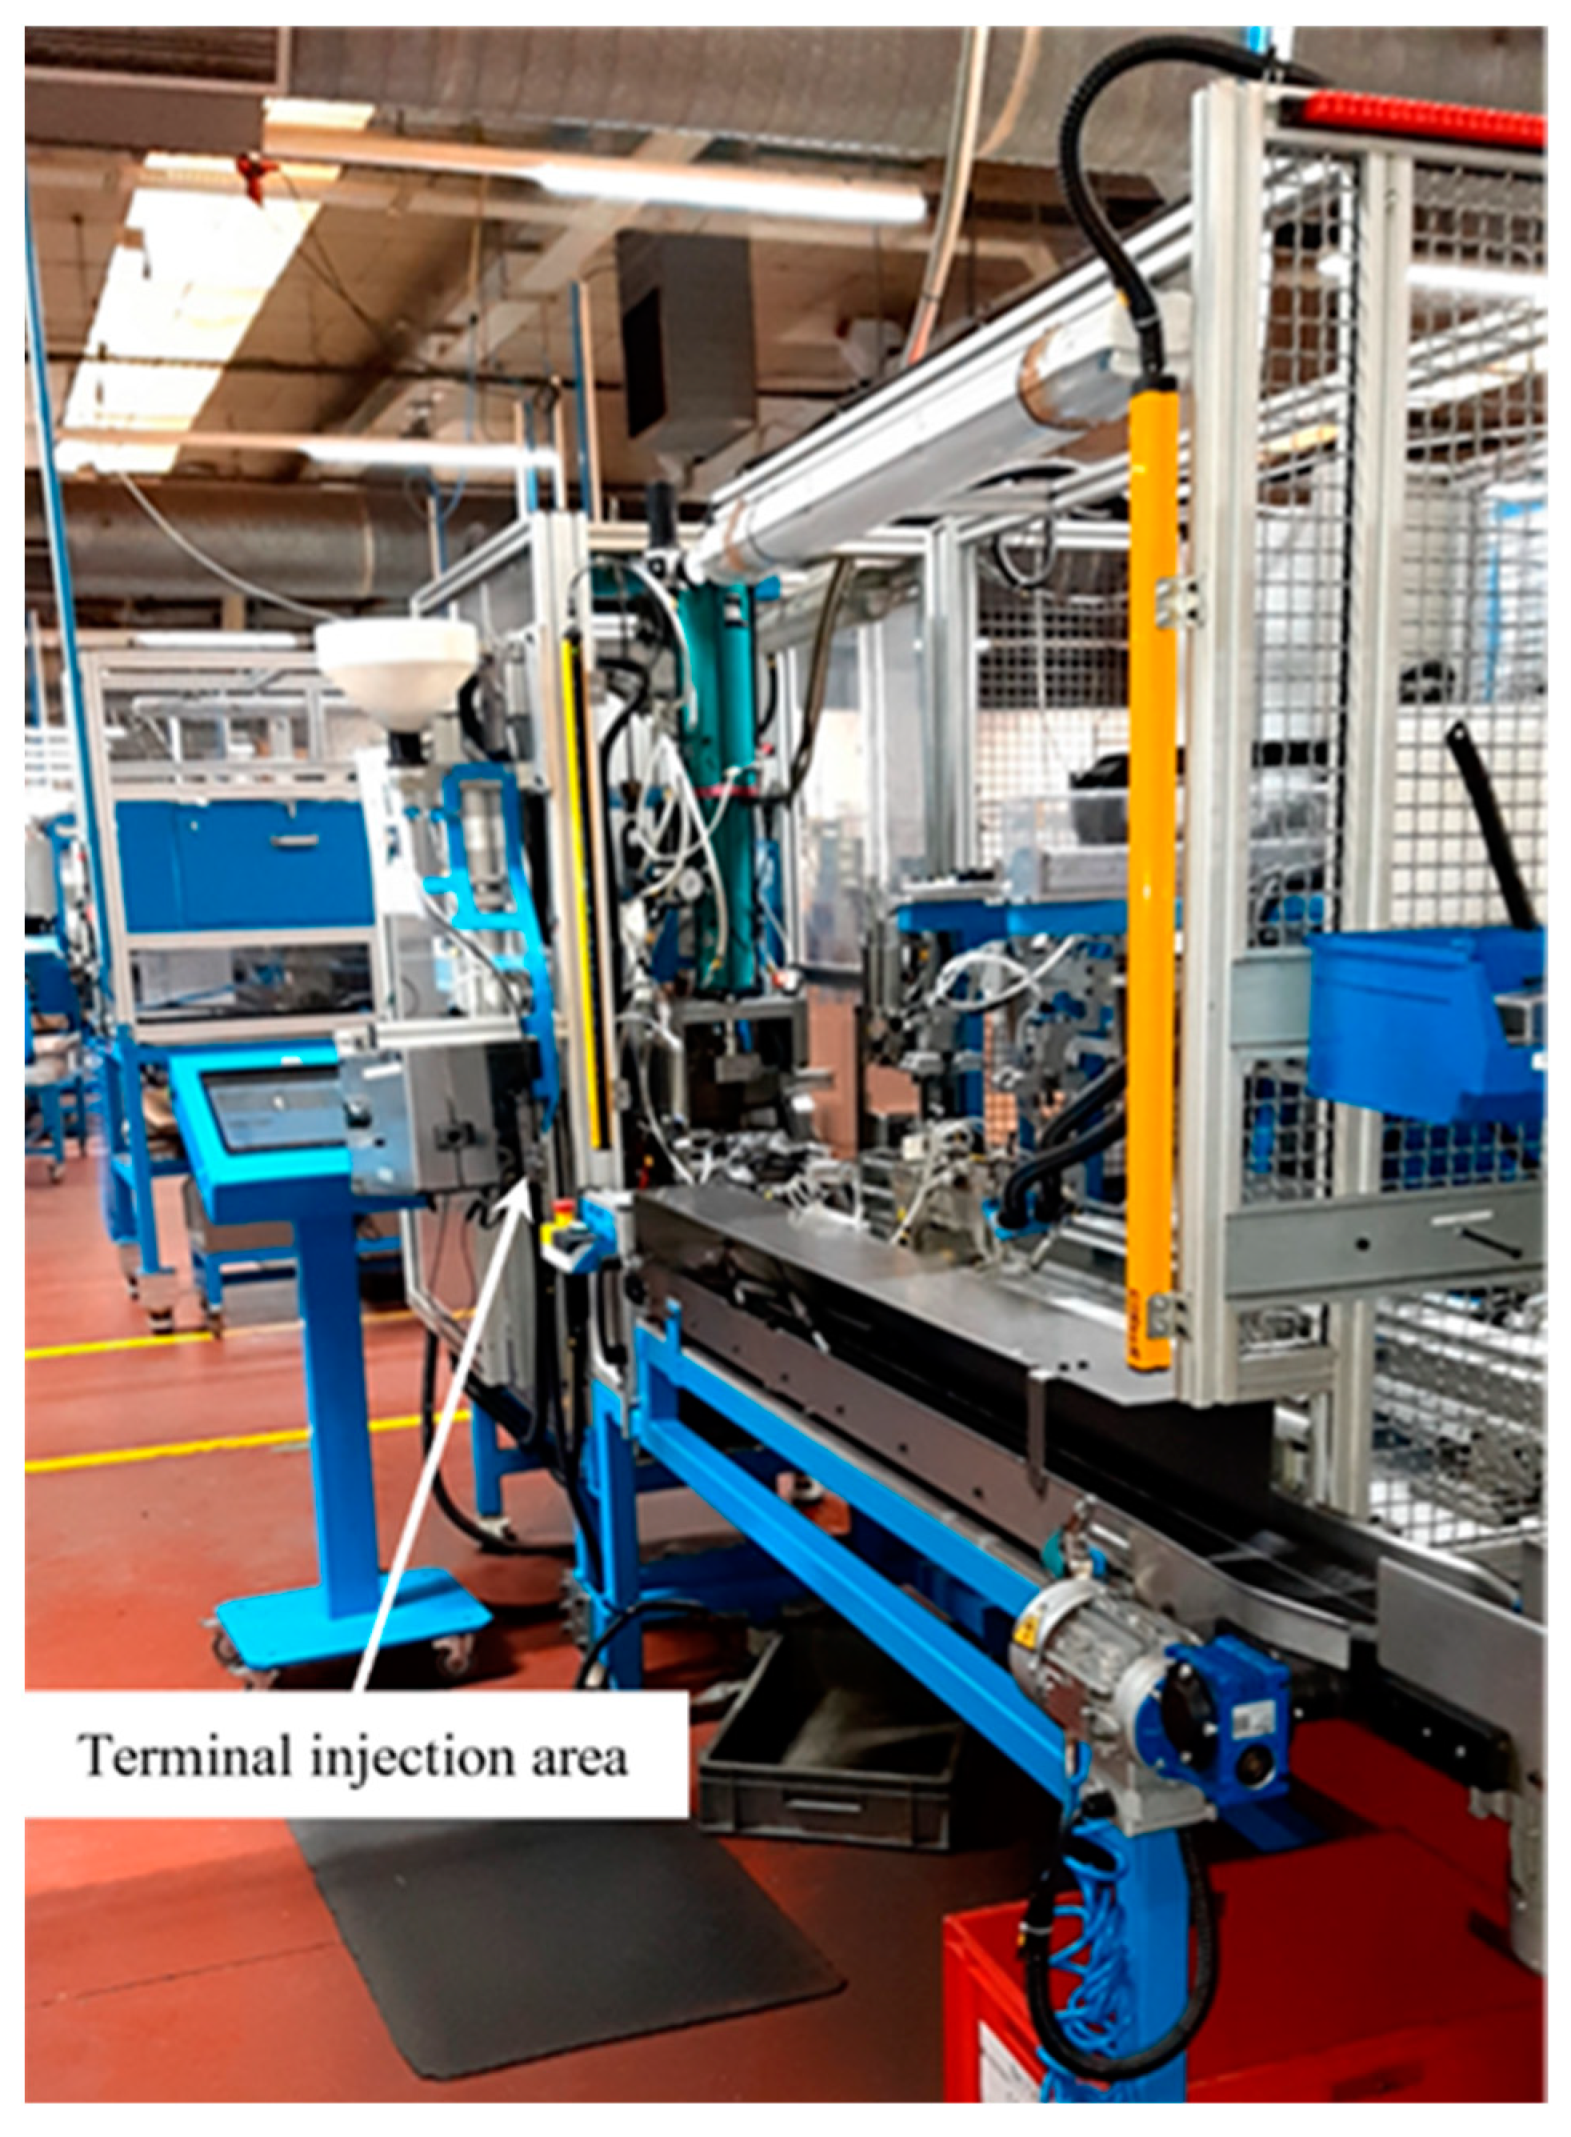
2.2. Process Characterization

The fabrication of a control cable starts with the injection of the first terminal to the inner cable, completed in another production line. Then, the inner cable is transferred to line BX726, the objective of this study. Currently, the line BX726 is used in the production of four models of control cable, shown in Figure 2. The cable terminal injected in this line corresponds to those on the left side of Figure 2. The model numbers were shortened to three numbers to ease their identification throughout this manuscript; these numbers are located at the right of Figure 2. The preparation process depends on the cable model; overall, this process involves the removal of the plastic coating to the cable, when applicable, (Figure 3a), the installation of all the grommets on the cable spiral (sheath) (Figure 2), threading of the inner cable, and mushrooming of the inner cable’s remaining tip (Figure 3b). The latter is important to ensure a strong connection between the cable and the injected terminal. Once the cables are assembled, they pass to the injection station, where the second terminal is injected, shown in Figure 4.
Once the control cable is within the injection station, three operations are performed: (1) injection of the cable terminal, (2) strength test, and (3) length measurement. In addition, two different terminal models are injected in the line BX726, shown in Figure 5, these terminals are injected using the ZAMAK 5 alloy [23]. The cables are manually placed in the injection mold by an operator.
The measurement is automatically done with the cable taut, which is achieved by a 10 N load. If the cable length is correct, the cable is subject to an 800 N load. Then, the cable is transported by a robotic manipulator (Figure 6) to another station, where the sprues are removed by shearing, as shown in Figure 7.
Regarding the ZAMAK injection process, it is performed within specific stations (Figure 8) and is capable of around 600 injections/h. The machine has the following general parameters: crucible temperature of 430 ± 10 °C, input compressed air pressure of 7 ± 1 bar, injection, cooling times of 0.2 ± 0.05 s each, and an extraction time of 0.3 ± 0.05 s. Among the subassemblies composing the injection machine, only the frontal support where the molding takes is further studied in this work because of the molds. The mold size most used in the company is 43 mm. For example, Figure 9 shows the internal faces of the molds for terminal models 75 and 70 produced in the company. At the center of the mold, the shape of the terminal is visible, the cable guide grooves, and the sprue cavities; the latter being the object of this study. On the other hand, the mold structure holds both mold halves and keeps them aligned throughout the injection process. The mold structure contains cooling passages and a pressure sensor to ensure the cable is installed before the injection. In addition, the mold structure contains an extracting device that extracts the cable from the mold after the injection takes place.

2.3. Existing Problems

The main problem is the excessive size of the injection molding sprues; moreover, in the current form, the sprues are non-uniform, behaving randomly throughout the process. Consequently, their random breaking leaves them scattered around the facilities (Figure 10). The large sprue size affects the final properties of the cable terminal because it alters the cooling rates, compromising the final quality of the product. These factors are difficult to control during the process. In addition, the mean weight of a resulting sprue is 1.94 g/cable, and the line has a production capability of 450 cables/h; hence, large quantities of ZAMAK are wasted. Furthermore, in the current form, containers were placed in various parts as a palliative measure to collect the broken sprues with limited success, as shown in Figure 10c,d.

3. Results

3.1. Pre-Design

The first stage consisted of the observation of the current process, but the observation continued until the project’s completion. The observation led to determining the possible modifications and improvements for the process and equipment. This process was done following a SWOT analysis, allowing to select the most appropriate improvements. In order to reduce the sprue size, it is necessary to improve the mold structure. A common mold base eases the mold changing processes according to the production run. In this regard, several options were proposed and analyzed using the SWOT method. The chosen design allows keeping the current mold bases, adapted now for 16 mm ones. This is suitable for 95% of the cable ends manufactured in the facilities. Furthermore, the mold was modified to inject cable terminals with sizes up to 7 mm. Finally, the final design was compact, as shown in Figure 11.
Subsequently, modifications to the injection machine are necessary to accommodate the modified mold bases. The components to modify are the front and crucible supports. The modifications involved slight machining of four existing parts and the fabrication of one extra support. In addition, the modifications described above imply the displacement of the measuring kit by 22.4 mm forwards. This required slight modifications in the current mechanisms to allow the clearance with the mold base and to hold new components; two current parts were slightly modified by machining while three auxiliary supports were fabricated. The proposed positioning devices are shown in Figure 12. Following the SWOT analysis, the modifications were found to fulfil the requirements without changing the actual working principle, remaining like the other machines in the production line. Moreover, the parts requiring fabrication were designed to be integrated with the current componentry.
The supporting structure of the robotic manipulator, which handles the control cables, also requires slight modifications due to interference with the flow of control cables. The modifications required refitment of the supports at one side of the structure (Figure 13a) and were designed to be carried out on-site. An analysis using the Finite Element Method (FEM) was performed on the modified structure to ensure its performance under load. The assembly of the robotic manipulator on the structure and the new supports is shown in Figure 13b. The structure was assumed to be constructed with steel C45E. For the models, this material was considered to have a linear-elastic behavior, so no permanent deformations should occur.
Regarding the boundary conditions of these models, the bottom parts of the supports were considered fixed in all directions (UX = UY = UZ = 0); hence, their displacement (Ui) is set to zero. The load applied in the manipulator was 0.551 N, corresponding to the weight of the control cables. The imposed boundary conditions and loads are shown in Figure 14. Afterward, the structure was meshed with solid elements, four-node tetrahedrons, resulting in 203,484 elements and 404,962 nodes; the meshed structure is shown in Figure 14. The analysis was solved as linear elastic under the assumption of large deformations.
The results from the FEM analyses indicated that the modifications do not affect the mechanical characteristics of the structure under working loads. In this case, the von Mises stress under working loads has a maximum value of 180 kPa while the yield strength of this material is 620 MPa, indicating that the applied load has no significant effect on the structure (Figure 15). Similarly, the deformation of the structure was evaluated, with the displacement’s magnitude being around 7 μm at the grips, which does not affect the function of the manipulator (Figure 16).

3.2. Workstation Interventions

The main subset of this intervention is molds and their structures due to the precision and heat treatments involved in the process. Subsequently, a metrological inspection is performed to validate their compliance with the design, followed by a functional validation, described below.

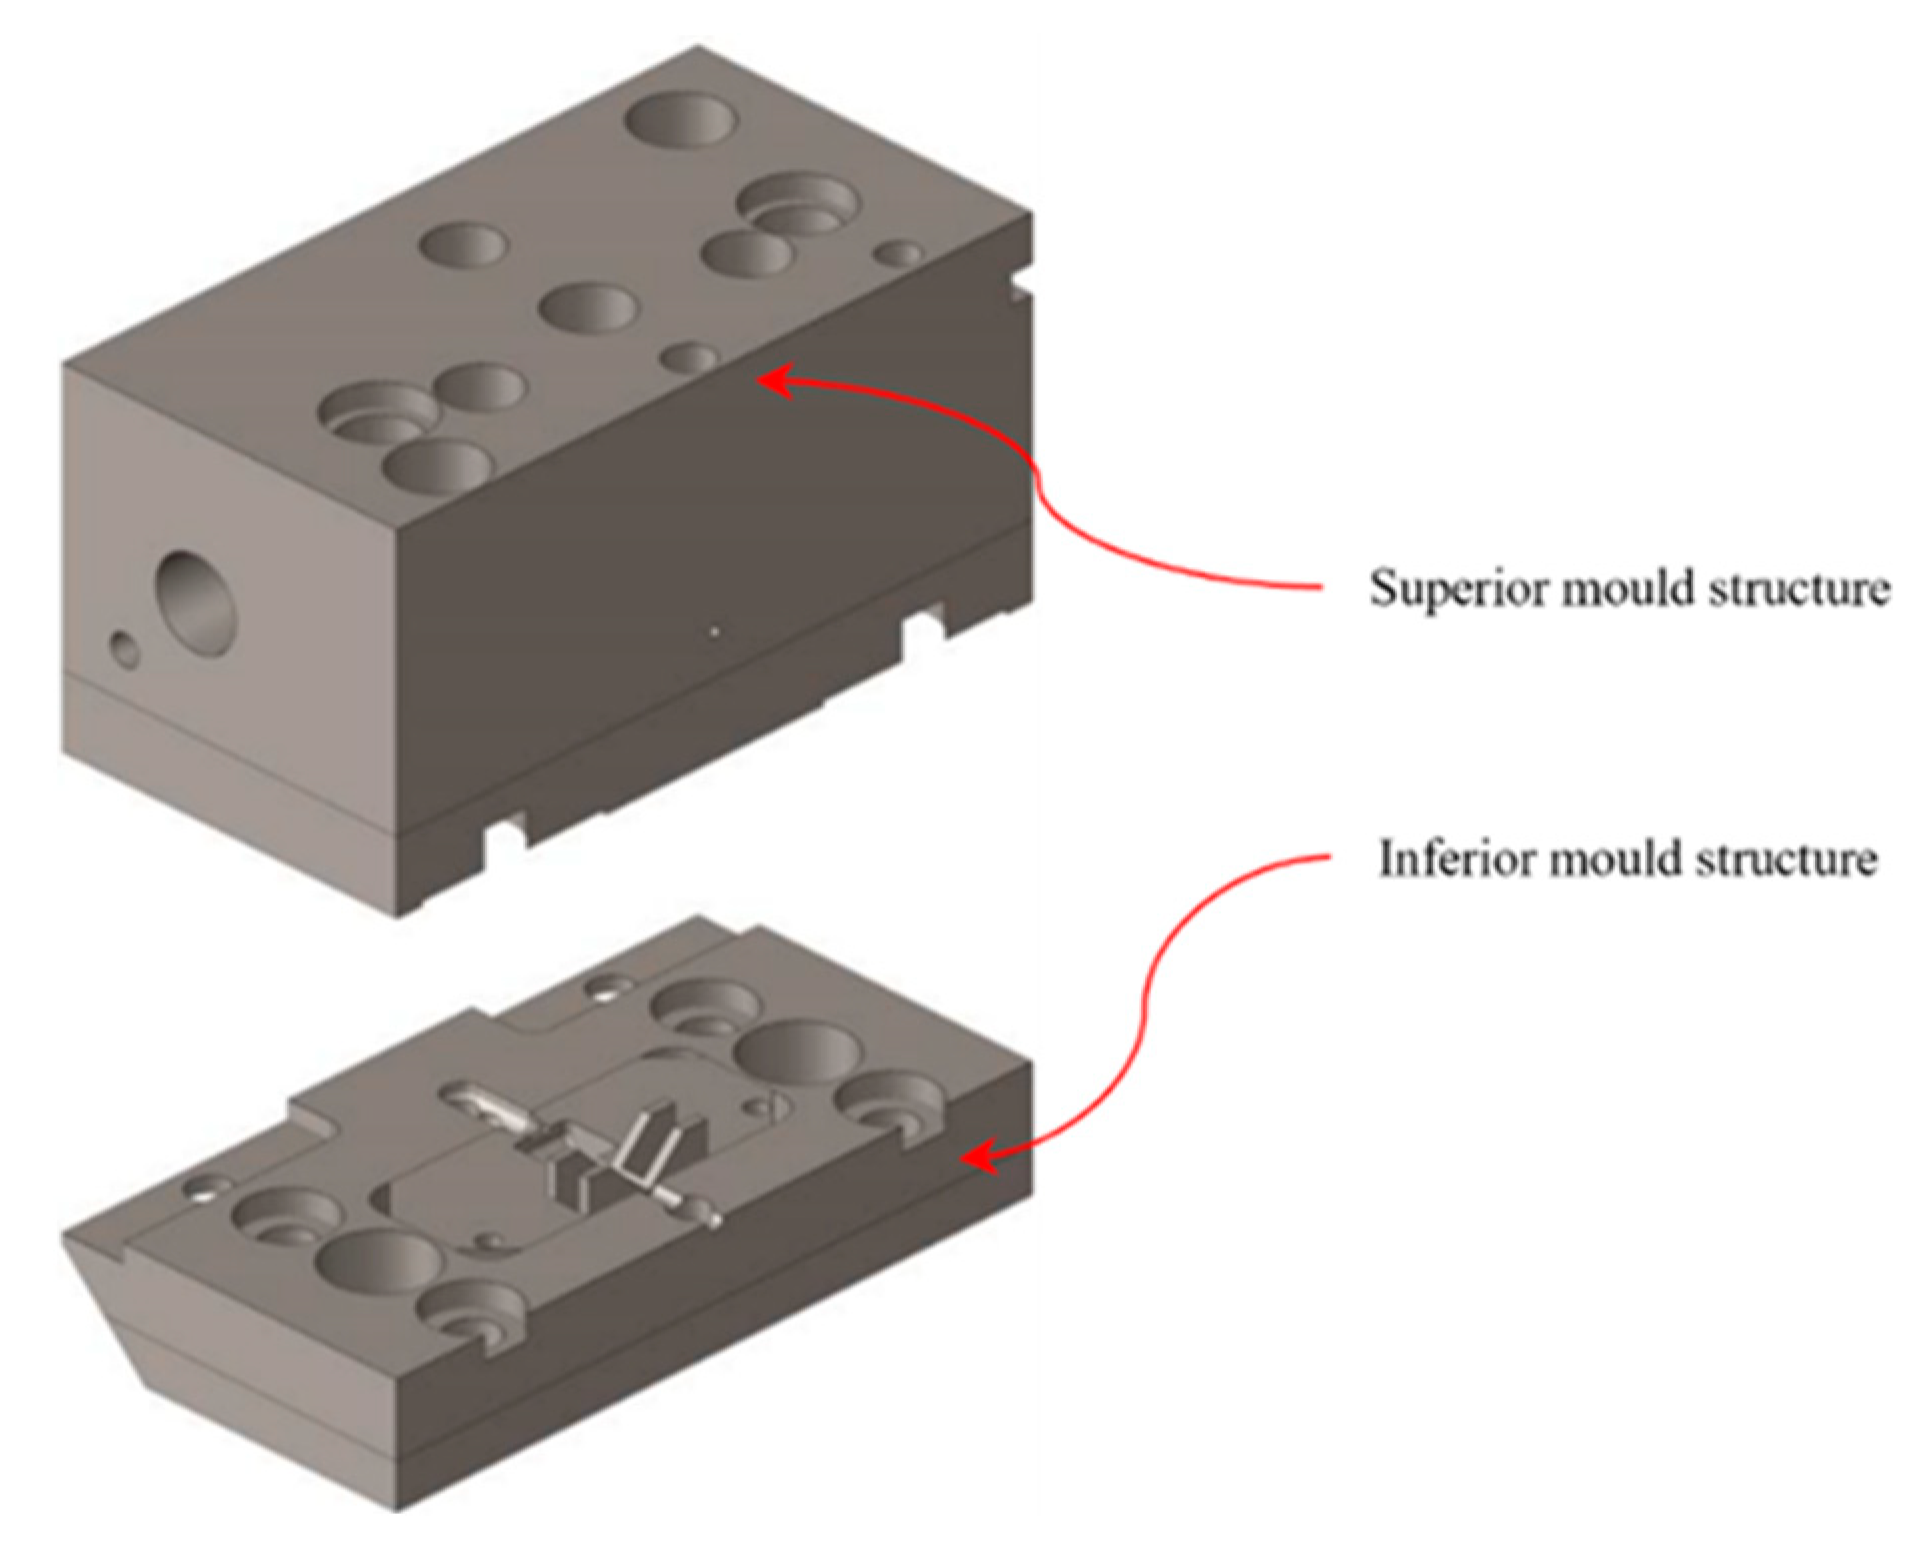
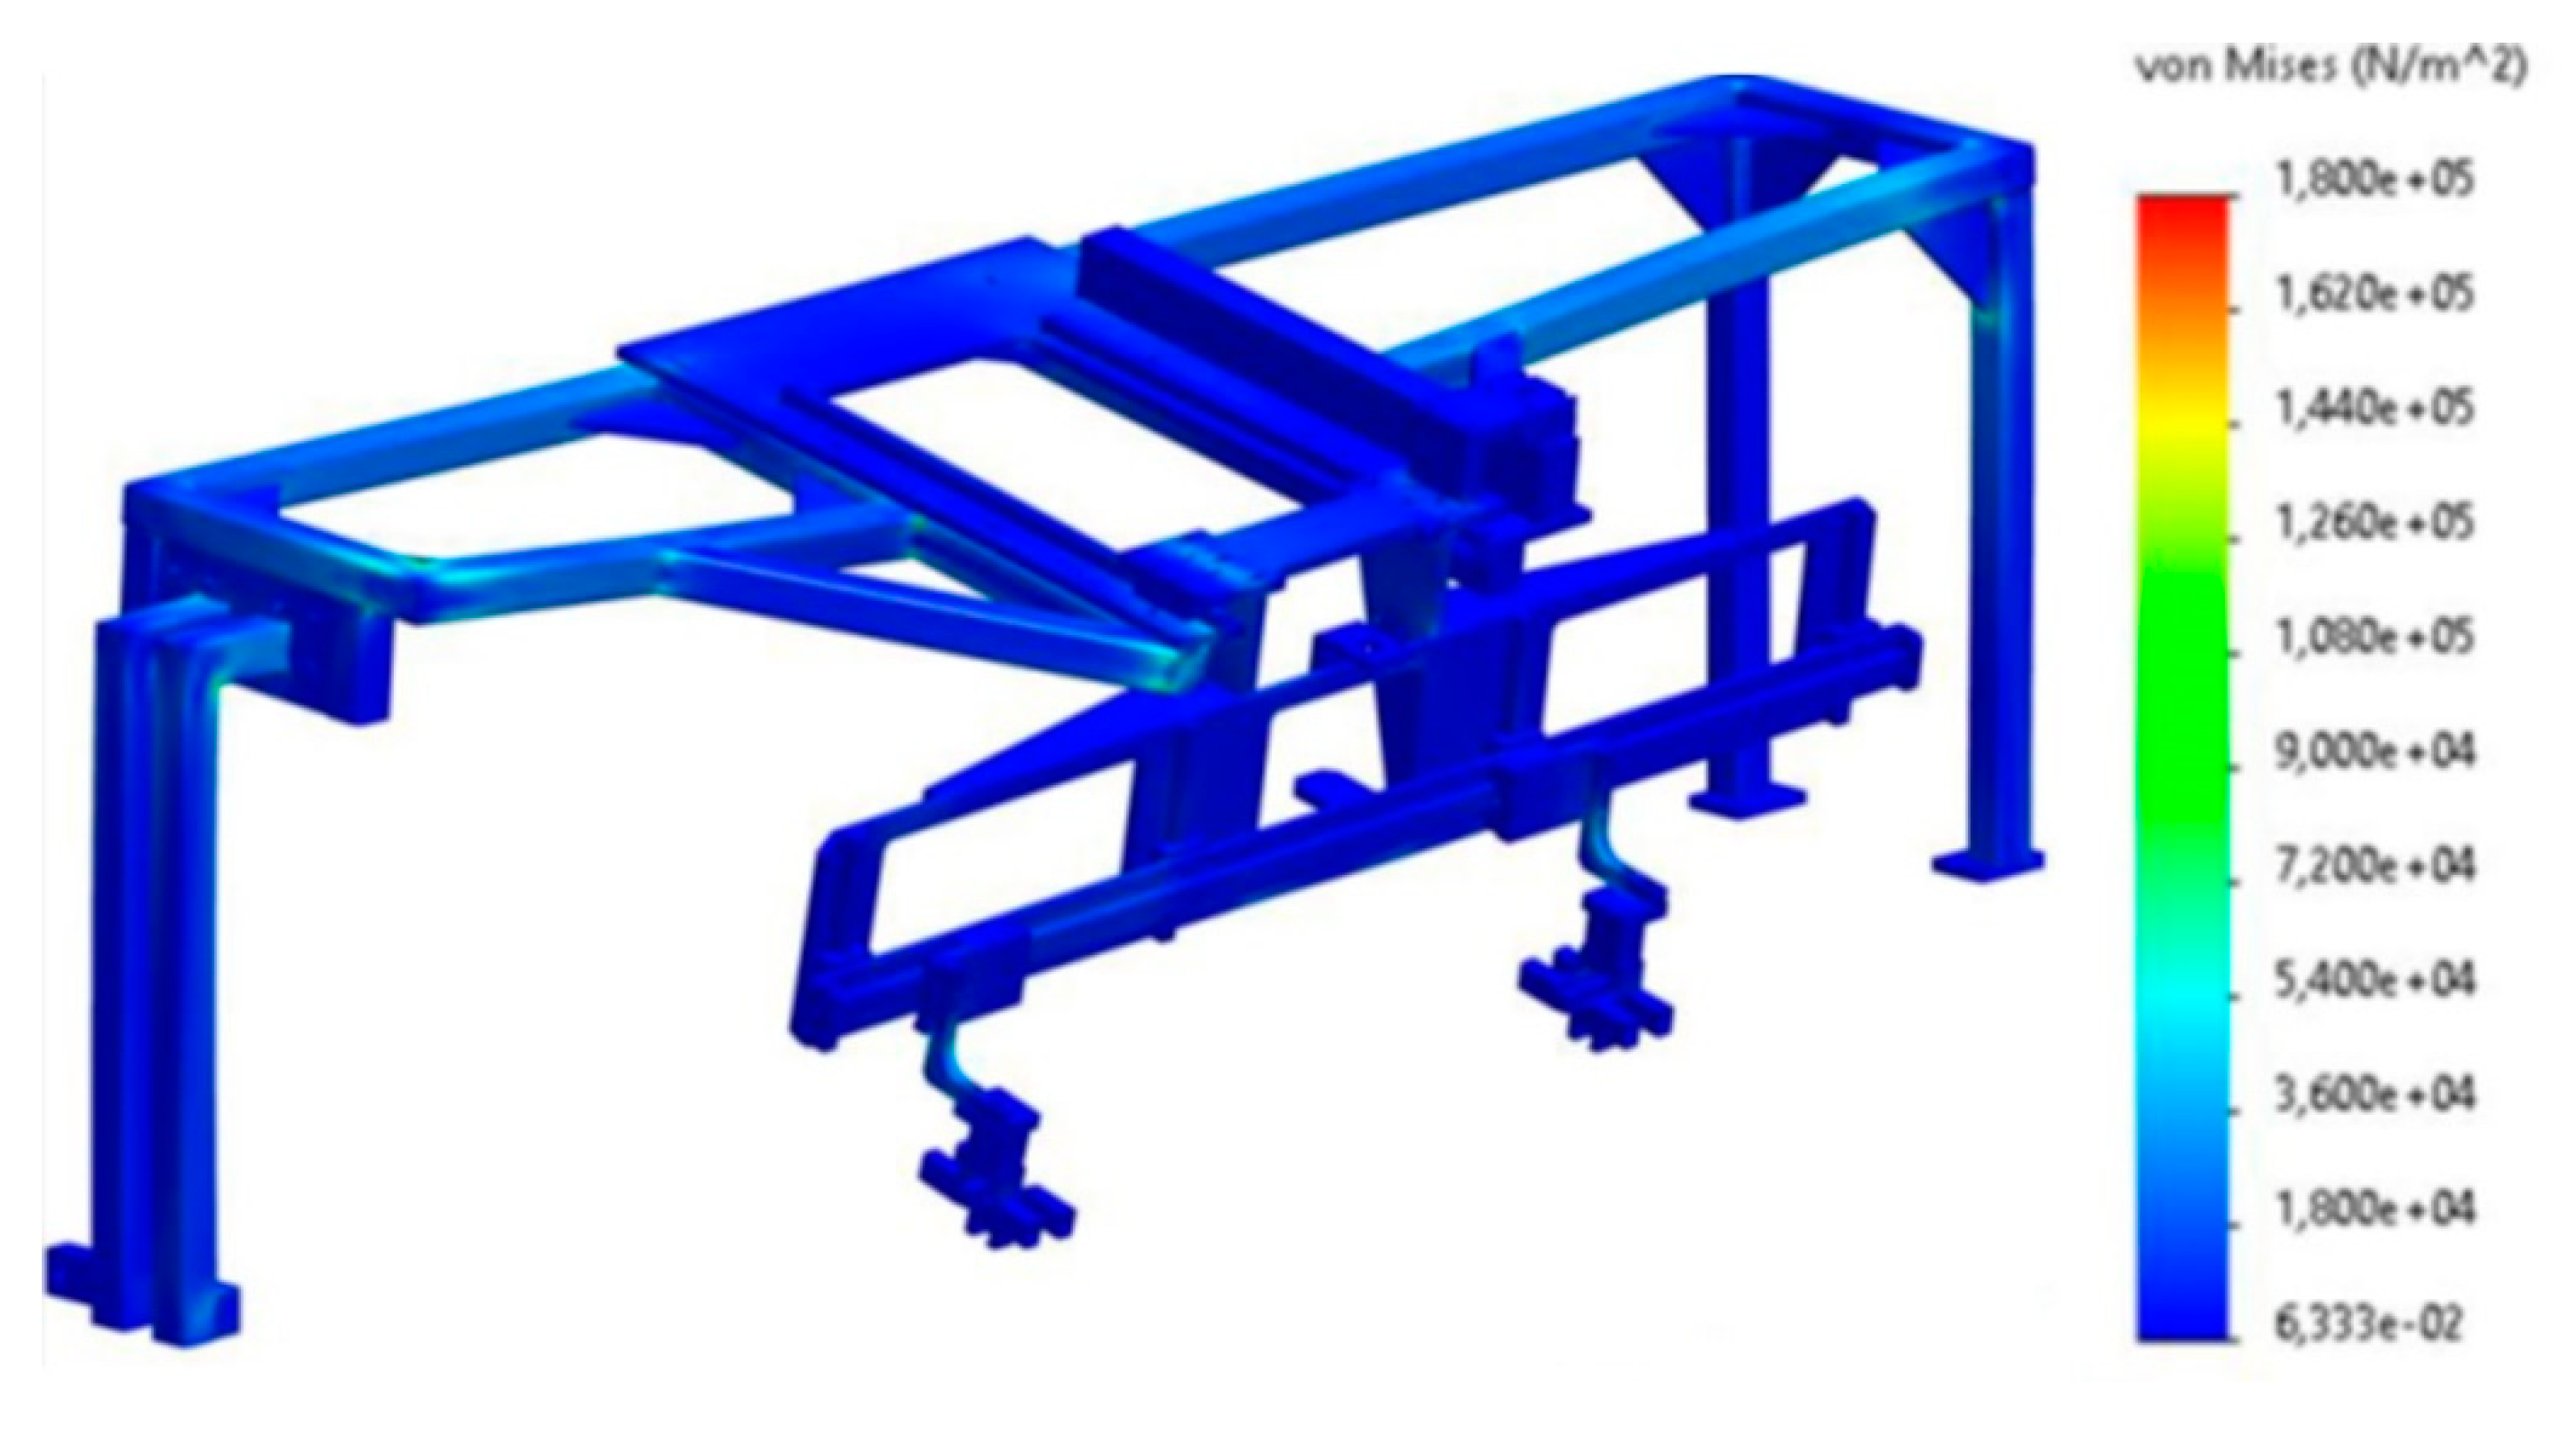
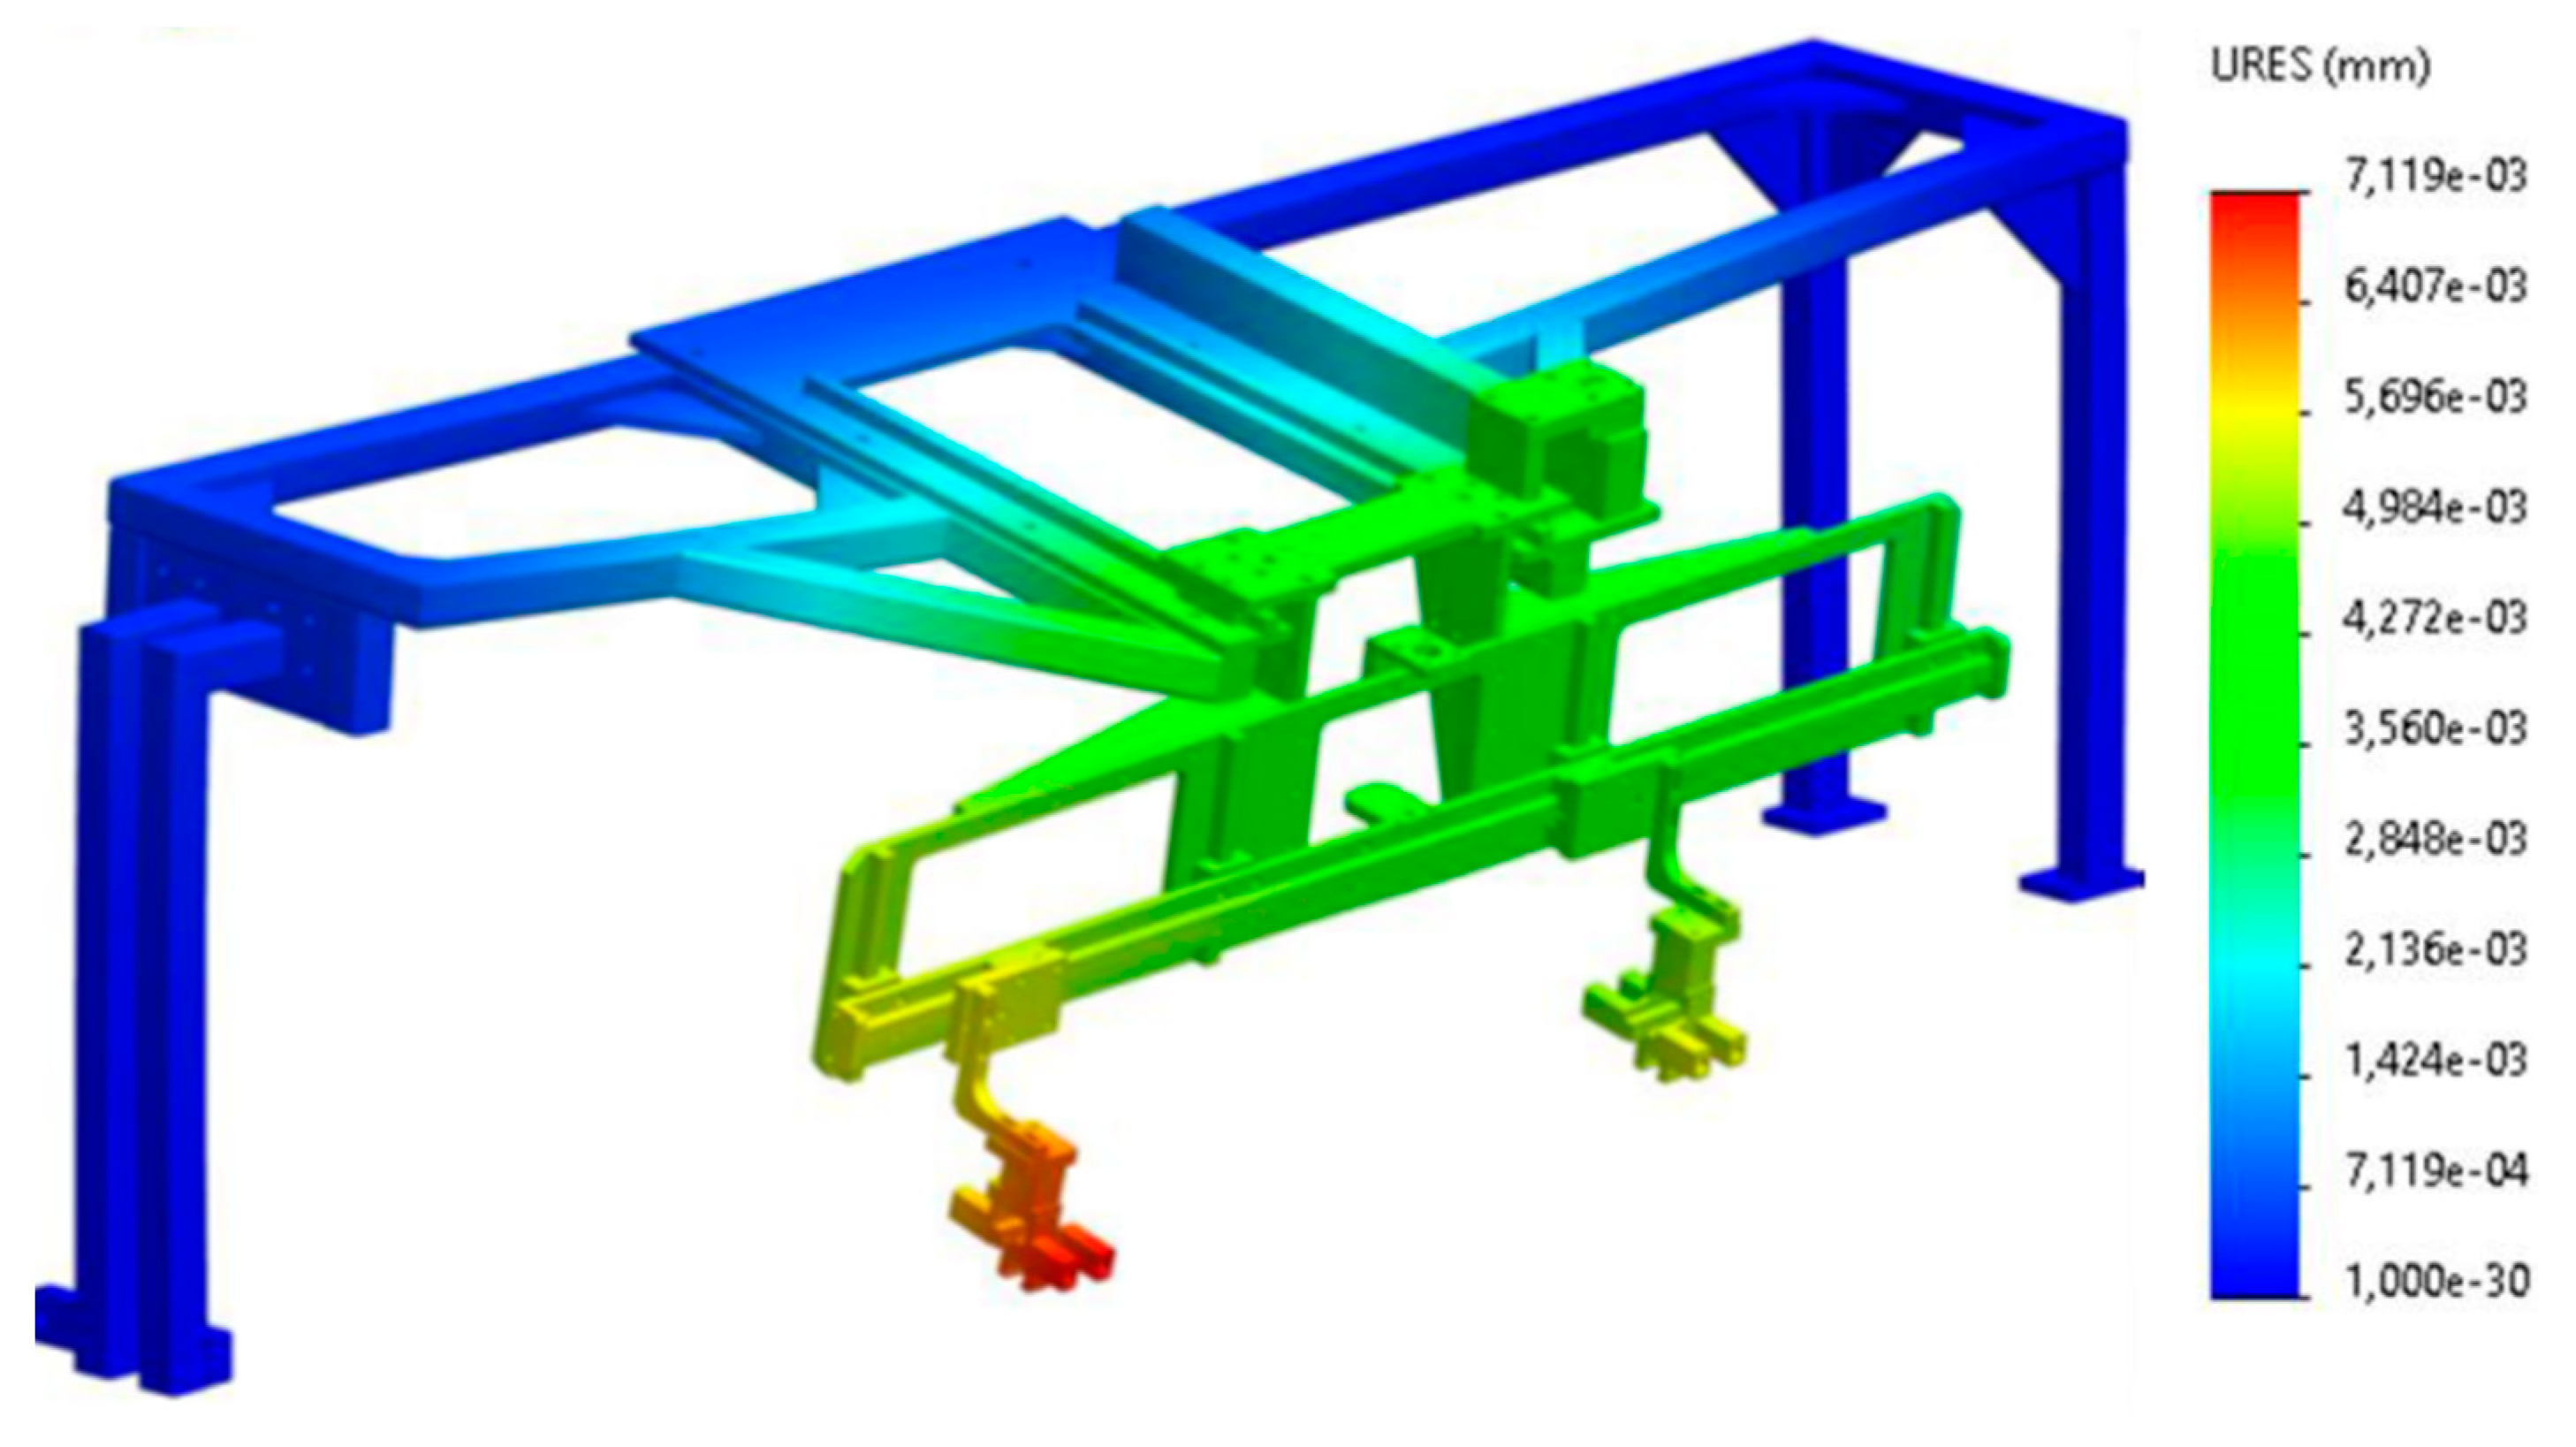
3.3. Validation of the Mold Structure

The validation process consisted of 25 injections from each terminal model; then, the produced parts are inspected and measured, and the respective dimensional reports are performed. With this goal, the mold was mounted on the company’s testing machine and the parts were injected. Upon completion of the testing process, it was possible to conclude that a large part of the sprues broke out of the injected terminal, thus not fulfilling the objectives of the work. Additionally, some samples of the injections showed non-conforming dimensions in the dimensional reports, implying further adjustments to the molds by Electric Discharge Machining (EDM). The premature failure of the sprues was caused by the initially reduced dimensions of the original gating system section, as shown in Figure 17.
Consequently, the gating system was changed to increase the cross-section area of the sprue aiming to counteract the tendency of early sprue failure during extraction, as shown in Figure 18. After adjusting the molds, it was necessary to assess the effect on the sprues. For this, the injections and the respective dimensional reports were repeated. As a result of the changes, the sprues remained attached to the terminal after its extraction from the mold, and it was concluded with the dimensional reports that all samples fulfilled the requirements.

3.4. Validation of the Produced Components

Once the validation of the mold has been carried out, validation of the other produced components was accomplished. Thus, for this purpose, visual analysis and measurements of the functional dimensions were undertaken to ensure that all components were suitable for their assembly. Afterward, it was concluded that all parts were in accordance with the technical drawings, so it was possible to start the intervention in the equipment. Figure 19 presents two examples of fabricated parts for implementation in the new equipment, corresponding to the measuring kit.

3.5. Process Description

The first stage of the process was the disassembly of the components of direct exchange, the mold structure, and the measurement kit, as they contain some components that would be subjected to alterations carried out externally. In Figure 20, both subassemblies are shown after disassembly.
A specialized technician in ZAMAK injection machines was assigned to install, adjust, and validate the structure, considering that it is a time-consuming procedure that involves deep knowledge of the process. In addition, the alteration to the structure of the robotic manipulator was initiated to be performed in parallel to other tasks, as shown in Figure 21.
Once the mentioned changes were implemented, all the conditions were met for the completion of the assembly of all components. Figure 22 presents the device with the changes completed.
To prepare the equipment for production, adjustments were made to the various subassemblies. Subsequently, the final validation of the produced cables was performed. This step is performed on a measuring bench, as shown in Figure 23, which concluded that the process fulfilled the requirements.

3.6. Results

3.6.1. Raw Material Waste

After completing the changes to the equipment, the first sprue samples were analyzed and compared with those obtained before their implementation. The average mass difference from five samples of each batch was 0.93 g, corresponding to a mean reduction of 48.3% per sprue. Then, the geometries of the resulting sprues were compared, showing large differences between them, indicating that further adjustments to the mold were required. After the analysis, it was concluded that the difference was caused by the sprue channel in the mold supports. Afterward, the sprue channel was adjusted by an external supplier by using EDM; the modification is shown in Figure 24. In parallel with these changes, a magnet was installed in the mold structures to ensure the correct position of the cable and eliminate some injection failures due to misplaced cables, which occurred before these modifications. The installed magnet does not have a further effect on the process.
After the modification to the sprue channel, the sprue mass was reduced by 1.21 g with respect to the cases prior to any modification, corresponding to a mean reduction of 62.6% per sprue. This proved to be very positive for the economic analysis of the investment, which is carried out next for the equipment under study and for other projects from the company, considering that the study was done in late 2021 to start its implementation by the start of 2022.
  • Saving on the BX726 production line
In the case of the line under study, the economic return is analyzed between the years 2022 and 2026, since the production forecast is limited to this period. Table 1 shows the data used for calculation purposes.
The resulting savings are calculated as shown in Equation (1), as follows:
Saving   22 26 [ ] = ( 2.8 1.1 ) × 1 , 021 , 700 × 5 × 1.21 × 10 3 3970 = 8728.82  
With the implementation made in the BX726 production line, the return on investment (ROI) will be achieved in August 2023, following the production forecast, which is an acceptable date given the initial investment. This project worked as a model for the changes to be made to active equipment, as well as for all future projects developed by the company, whose values will be analyzed next.
  • Investment in changing existing lines
The proposed concept received positive feedback from the company’s management, which was willing to allocate a budget of EUR 40,000 to change 10 of the critical active equipment by the end of the year. For this investment, the amount saved between 2022 and 2026 will be analyzed, based on an annual production estimate, as presented in Table 2.
With the presented data, the calculation of the saving is shown in Equation (2), as follows:
Saving   22 26 [ ] = 10 × ( 2.8 1.1 ) × 1,000,000 × 5 × 1.21 × 10 3 40,000 = 62,850  
Considering that the production lines are ready at the start of 2022, a profit of EUR 62,850 is expected by the end of 2026, which is highly significant considering the initial investment.
  • Implementation in new projects
After the implementation of the project, it became imperative that the sprue reduction concept is implemented in all newly developed equipment, due to the major economic impact associated with nil initial investment. Thus, in Table 3, the new projects that will be implemented until 2023 are presented.
The calculation of the amount saved for the same period is accomplished in Equation (3), as follows:
Saving   22 26 [ ] = ( 2.8 1.1 ) × 1,000,000 × ( 3 × 5 + 10 × 4 ) × 1.21 × 10 3 = 113,135  
The implementation of this concept in new projects will have a very positive impact, since the initial investment is mandatory and does not change by this design concept, and the respective result will be entirely converted into profit.

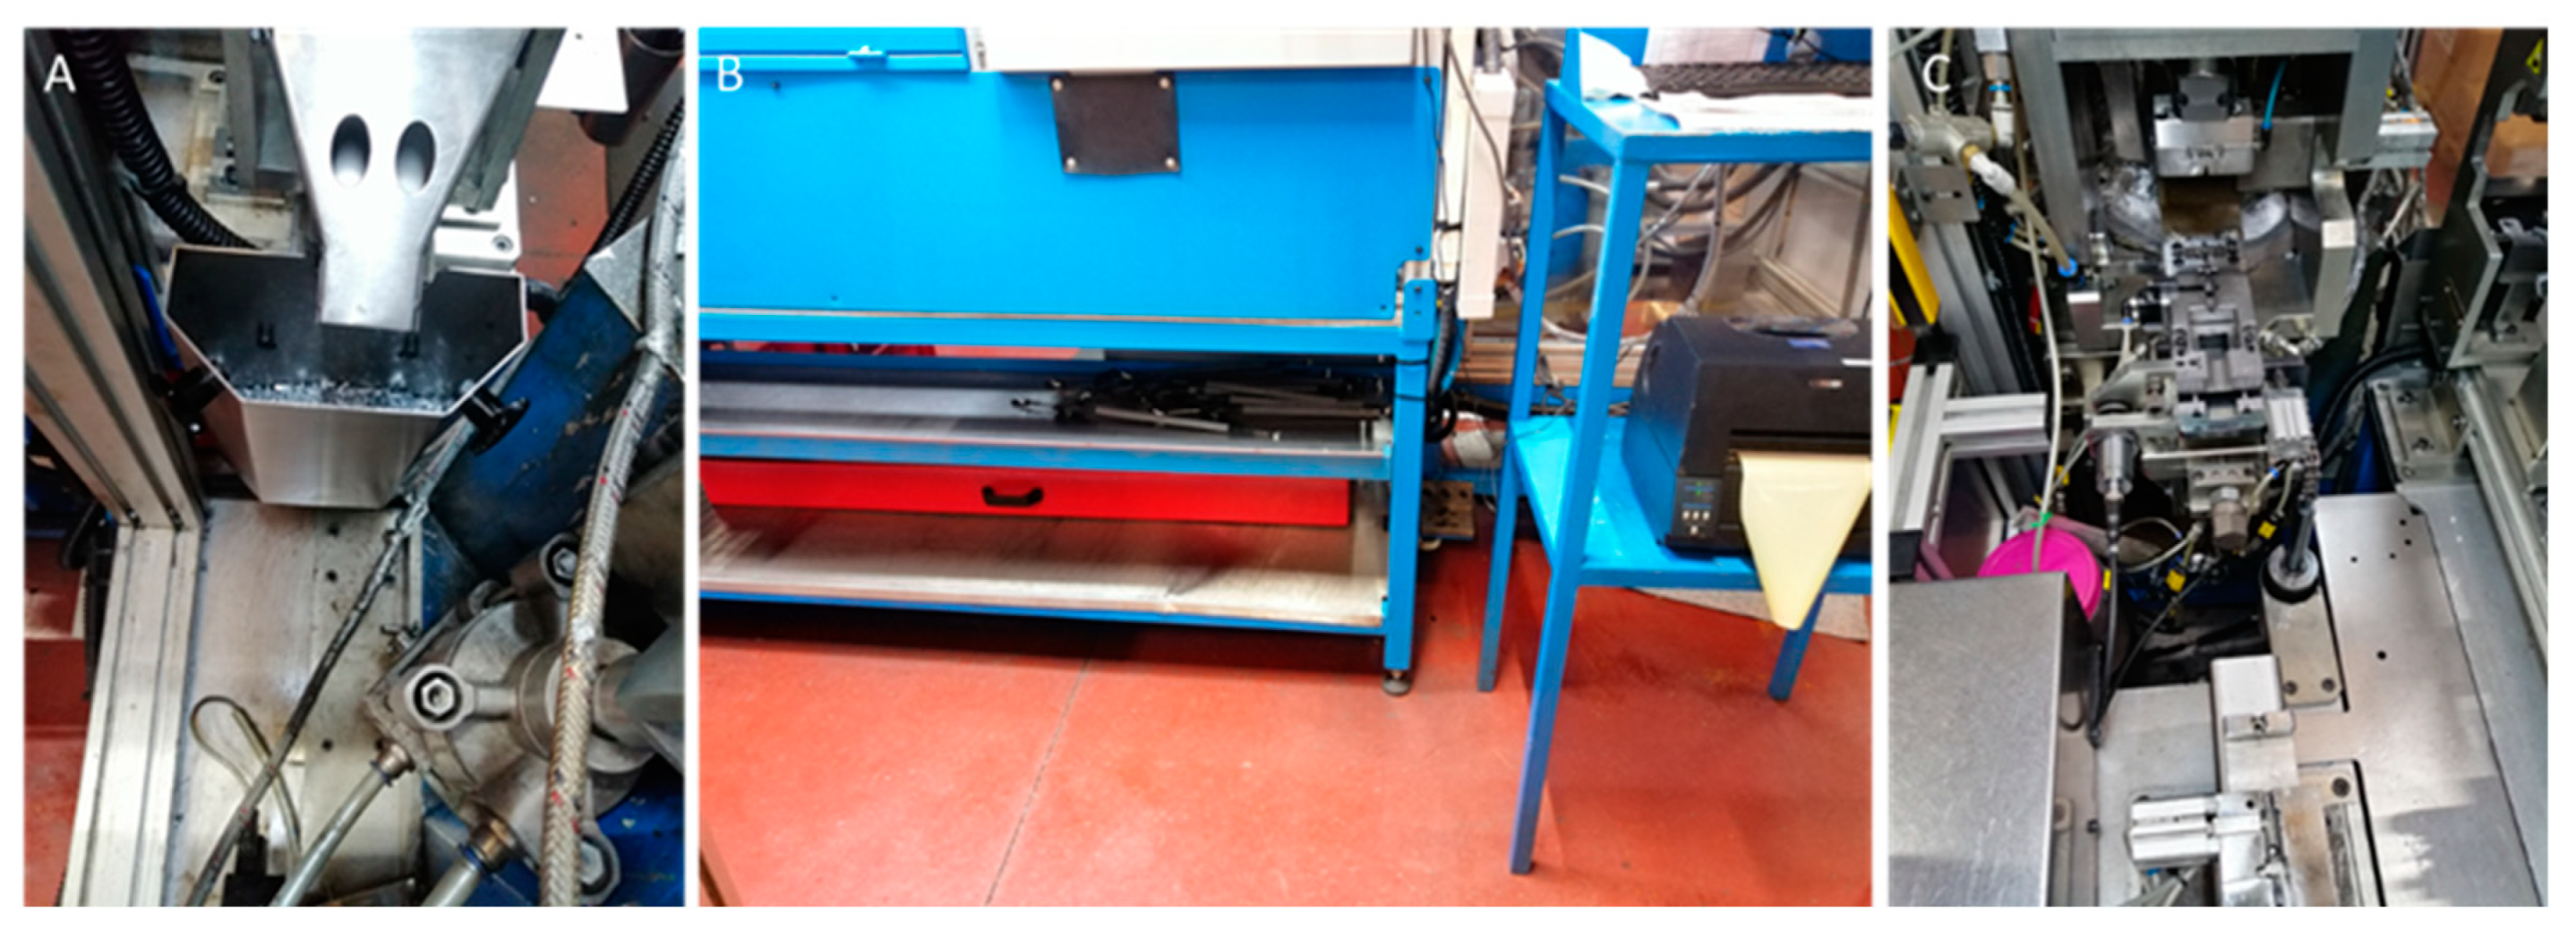
3.6.2. Dedicated Sprue Collection

Besides the sprue mass and respective cost savings with the proposed change, it is necessary to guarantee the sprue collection in dedicated containers. To achieve this goal, changes were made to the feeding sections of the sprue removal shear, making it possible to reinforce them and avoid premature failure. With the accomplished changes and respective production monitoring, it was found that all sprues followed the injected terminals up to reaching the sprue removal station, and the existence of any sprues outside the container for their collection was eliminated, as shown in Figure 25.

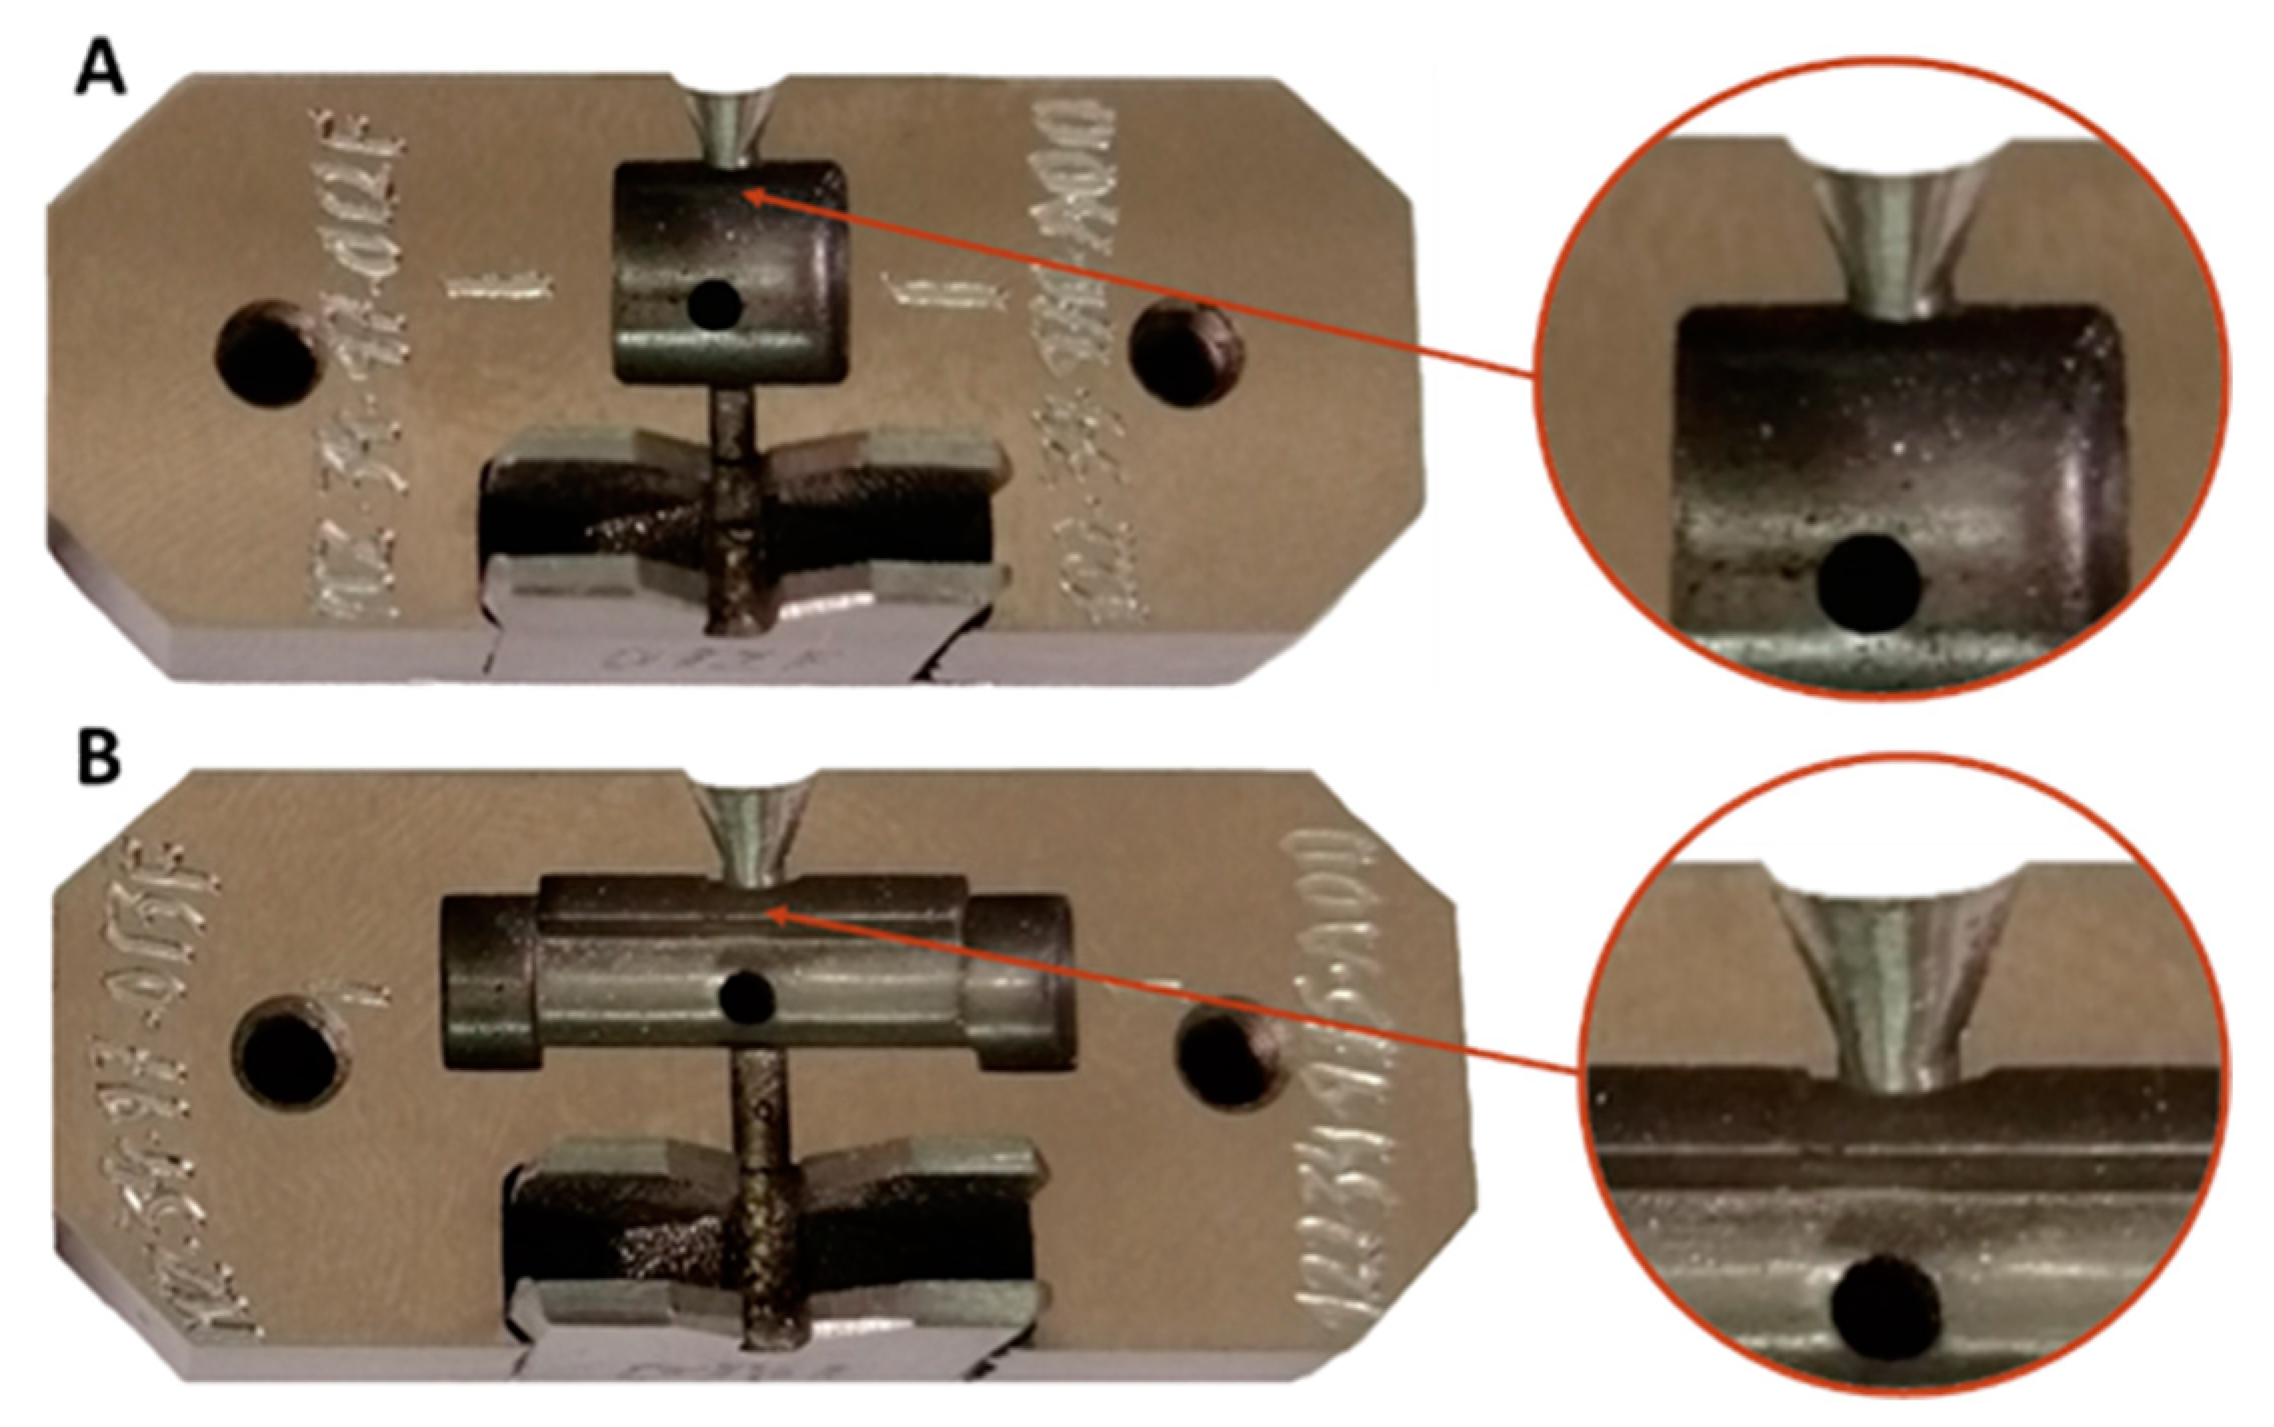
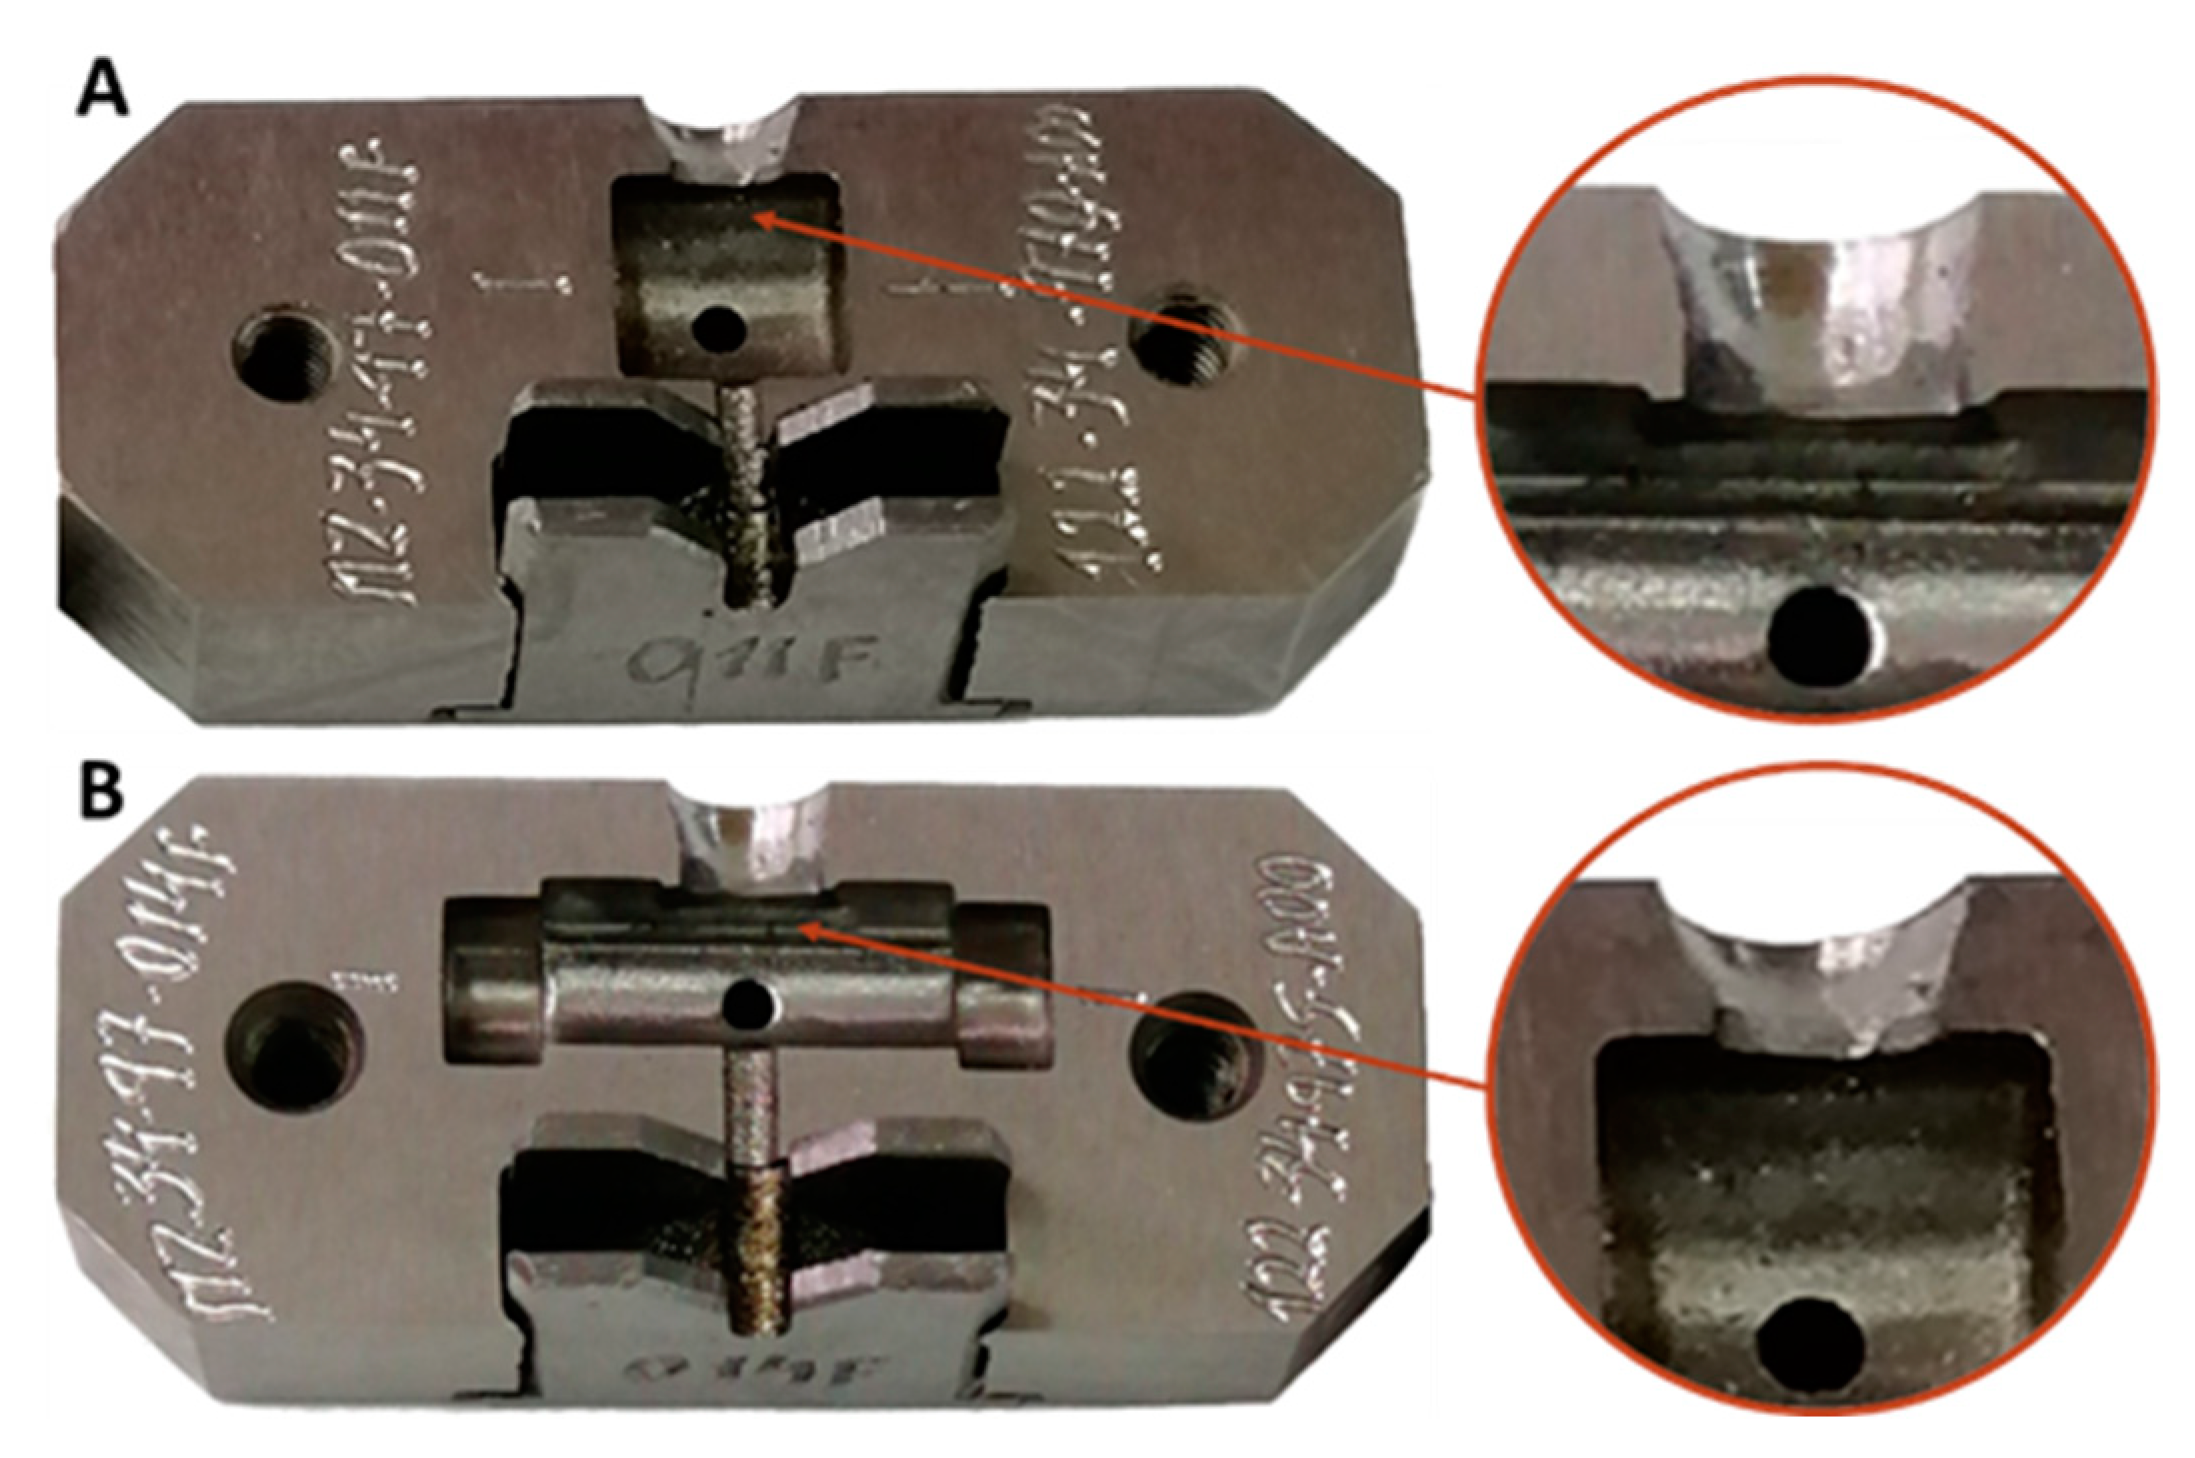
3.6.3. Final Product Quality Improvement

The molds currently used by the company do not include exhaust ports for the gases, which translates into the existence of excessive porosities in the injected terminals. As the volume of the cavities dedicated to the sprue was reduced significantly, it is predictable that there will be a reduction in the porosities inside the injected terminals after the intervention. To analyze the changes in the injection process, a few samples were prepared for a metallographic analysis by following the field’s common practices and procedures. For porosity analysis, the procedure specified by the BDG P202 standard [24] was followed. In addition, the images obtained with an Olympus BX53M Metallurgical Microscope and 200× optical zoom were processed in the Olympus Stream Basic® software (Olympus Imaging and Measuring Systems, Tokyo, Japan), making it possible to quantify the porosity within the terminals. Figure 26 shows sample microscope images before (A,C) and after the intervention (B,D); the images were obtained with a microscope analysis.
The procedure used for the analysis of porosity involved choosing the largest rectangular area visible in the sections followed by the processing of the microscope images in the software. The results are presented in Table 4, corresponding to one measurement per sample.
From the analysis of Figure 26 and Table 4, it is possible to conclude that there is a very significant decrease in the occurrence of porosities with the new injections, reduced by 10.2% between samples A and B and by 55.9% between samples C and D. The existence of two macroporosities in sample B can be explained by the poor regulation of the oil spray, which significantly affects the analysis. This problem comes from the fact that a vacuum system is used for the lubrication of the molds which makes it impossible to precisely adjust the lubrication of the molds. Nonetheless, the result of the intervention proved to be quite positive due to the great impact that the reduction in the sprue size had on the porosity of the terminals and a consequent increase in resistance is also expected.
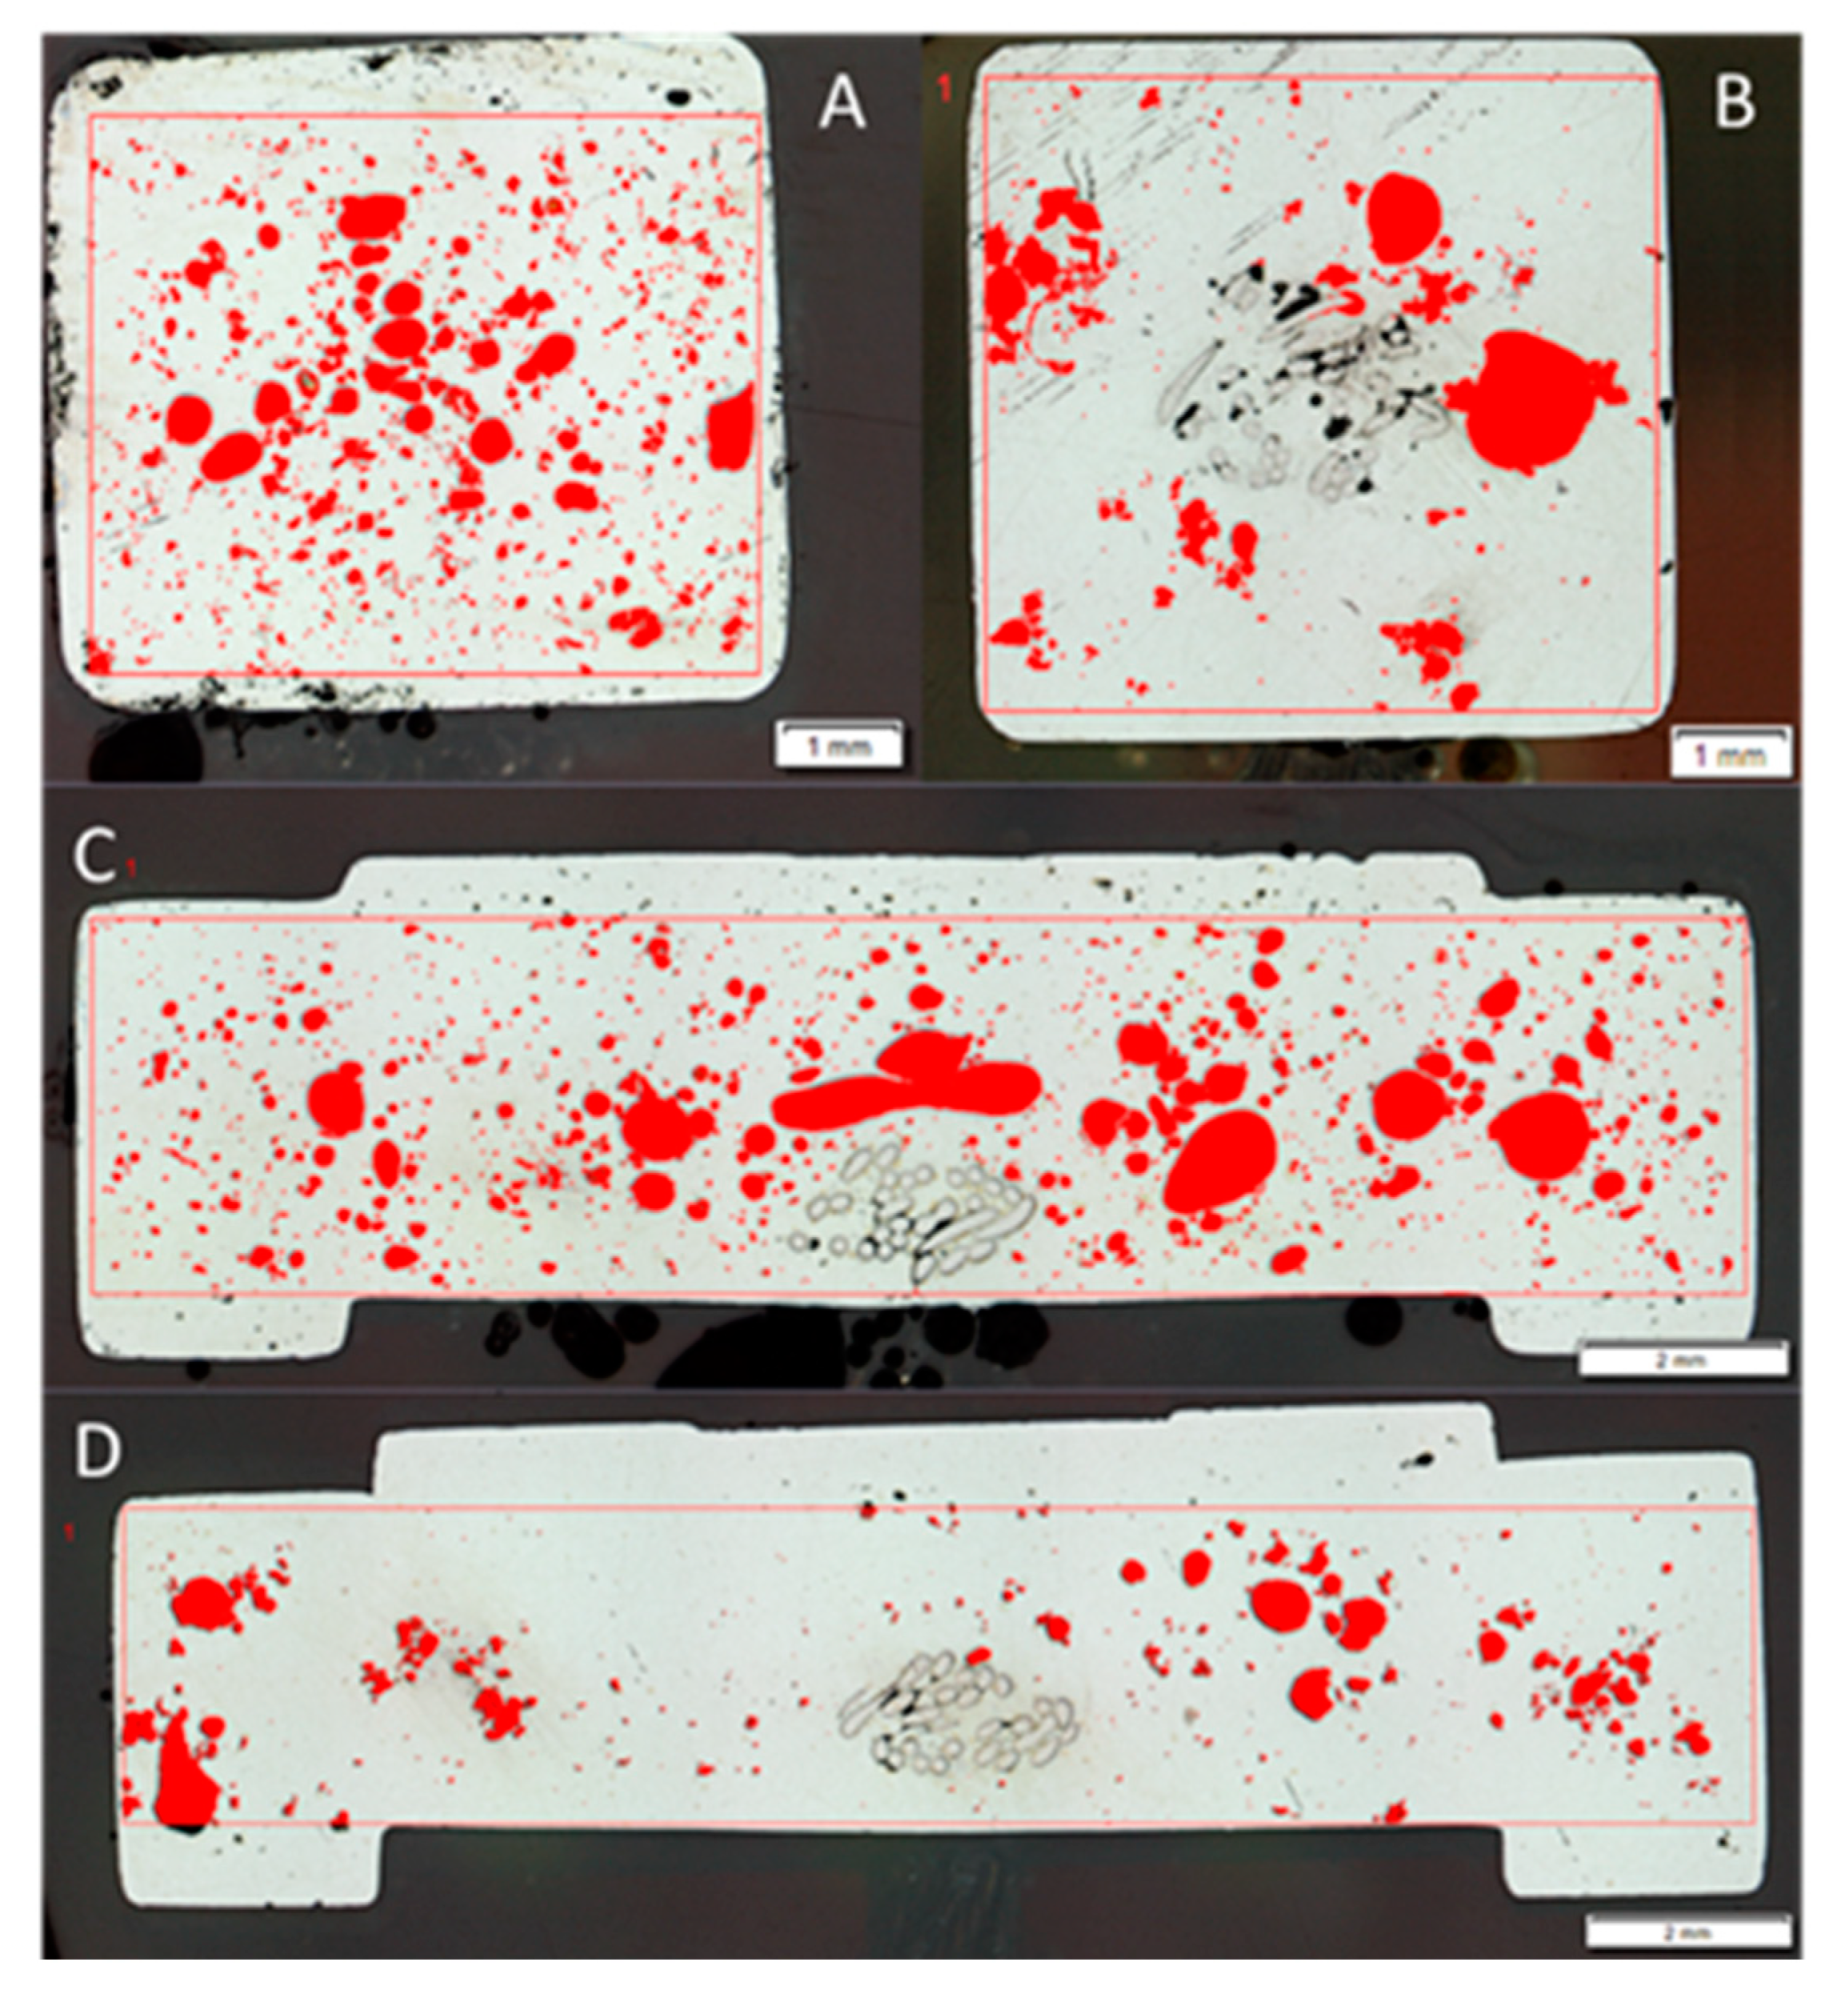
  • Microstructure analysis
After polishing, the surface evenly reflects the light that falls on it, allowing only the detection of cracks, pores, or inclusions. To be able to analyze the metallographic constituents of the material, it is necessary to carry out a chemical treatment for their identification. In the case of the analysis performed, a solution of ferric chloride was used, leading to the microscopic images shown in Figure 27.
By image inspection, it is possible to conclude that the grain size is slightly higher in the initial samples, which also present a more rounded geometry, while the later samples present a microstructure with grain formation that resembles dendrites and a finer granulometry. The larger grain size was caused by the slower cooling rate associated with the larger mass of the sprues before the modifications. On the other hand, the finer grain promotes an improved toughness of the sample, also resulting in higher fatigue strength [25], which clearly benefits the injected terminal, since it will undergo cyclical loading. Additionally, samples from injections after the intervention showed improved uniformity in grain size and structure, which, despite not being a very significant difference, translates into a positive result. It is important to note that, after the modifications, all the produced cables passed all the quality and strength tests defined by the company.

4. Conclusions

Industrial processes are often considered case studies for product improvement and knowledge application. In this work, the injection molding process employed to produce control cables for the automotive industry was analyzed and improved. This process corresponded to a local company. The main concern was the uncontrolled separation of sprues throughout the manufacturing process, which ended up scattered around the facilities. The analysis employed the Strengths, Weaknesses, Opportunities, and Treats (SWOT) technique and the Finite Element Method (FEM) to analyze those processes and machine components involved in the injection molding of the cable terminals. In summary, the application of SWOT methodology together with engineering tools such as the FEM led to the improvement of the mold structures, mold sprue gates, measuring kit and strength testing device, the structure of the robotic manipulator, and auxiliary components of the injection molding machine. These improvements can be summarized as follows:
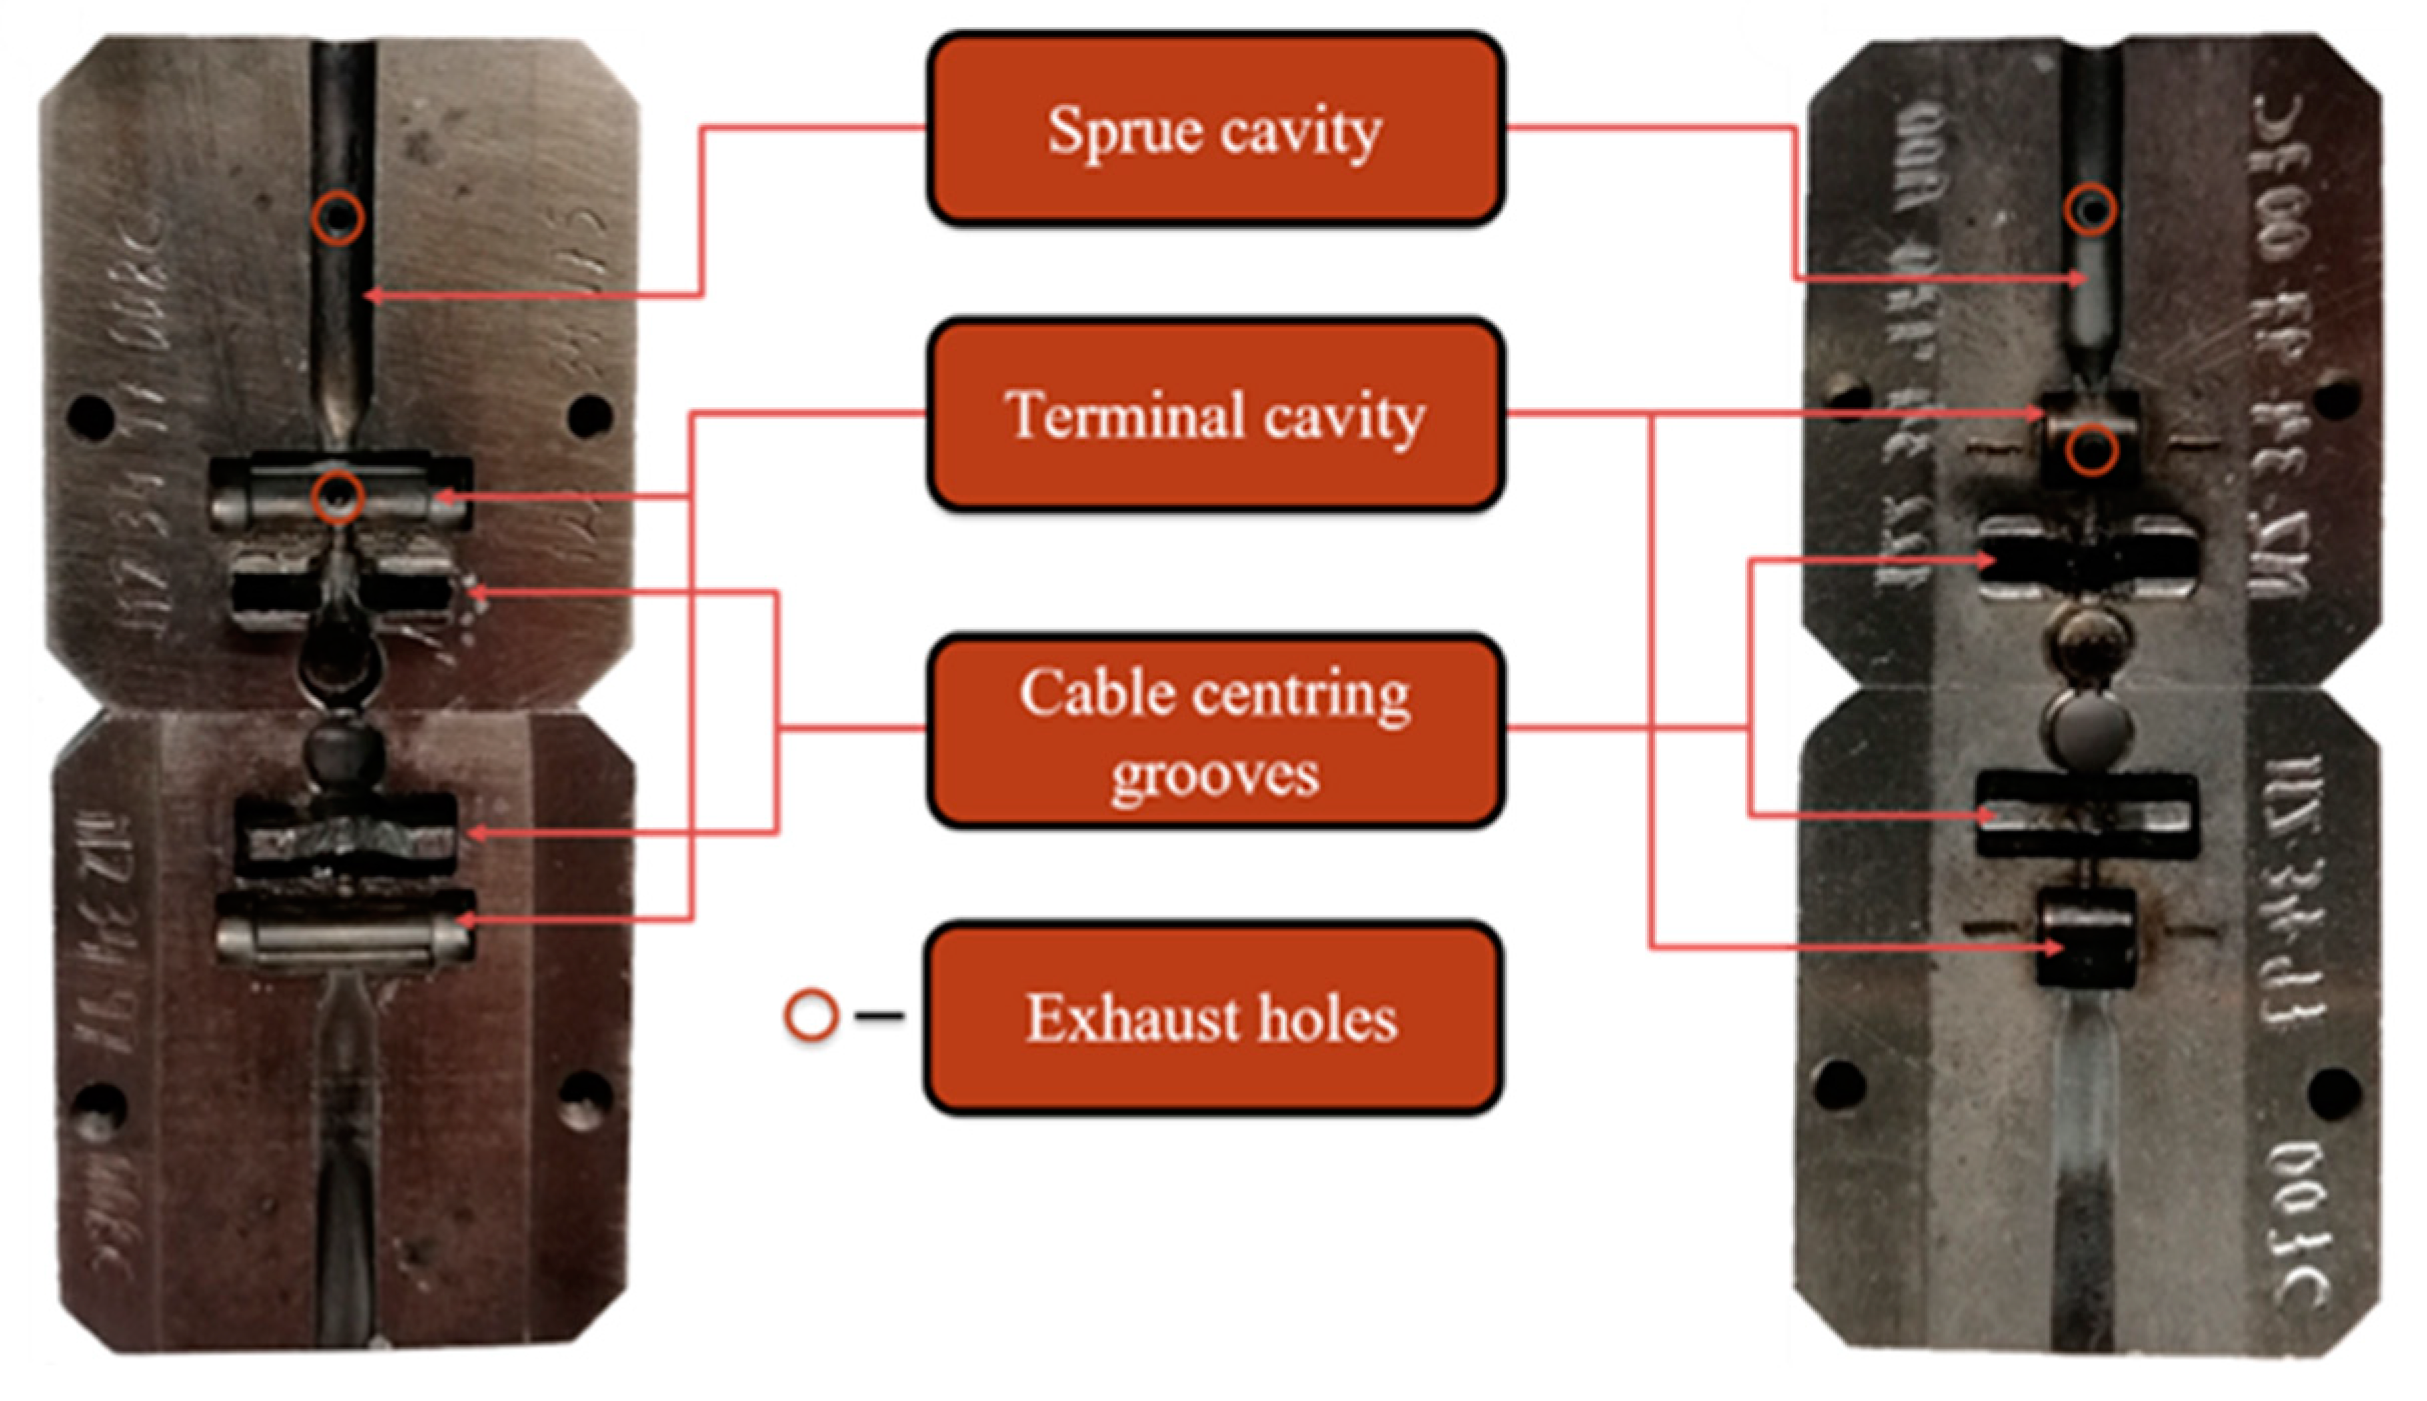
  • The capability to inject 95% of the company products with one standardized type of mold structure led to the reduction of downtime. The improved mold structure was the result of an iterative process combining FEM and SWOT analyses until a suitable solution was obtained.
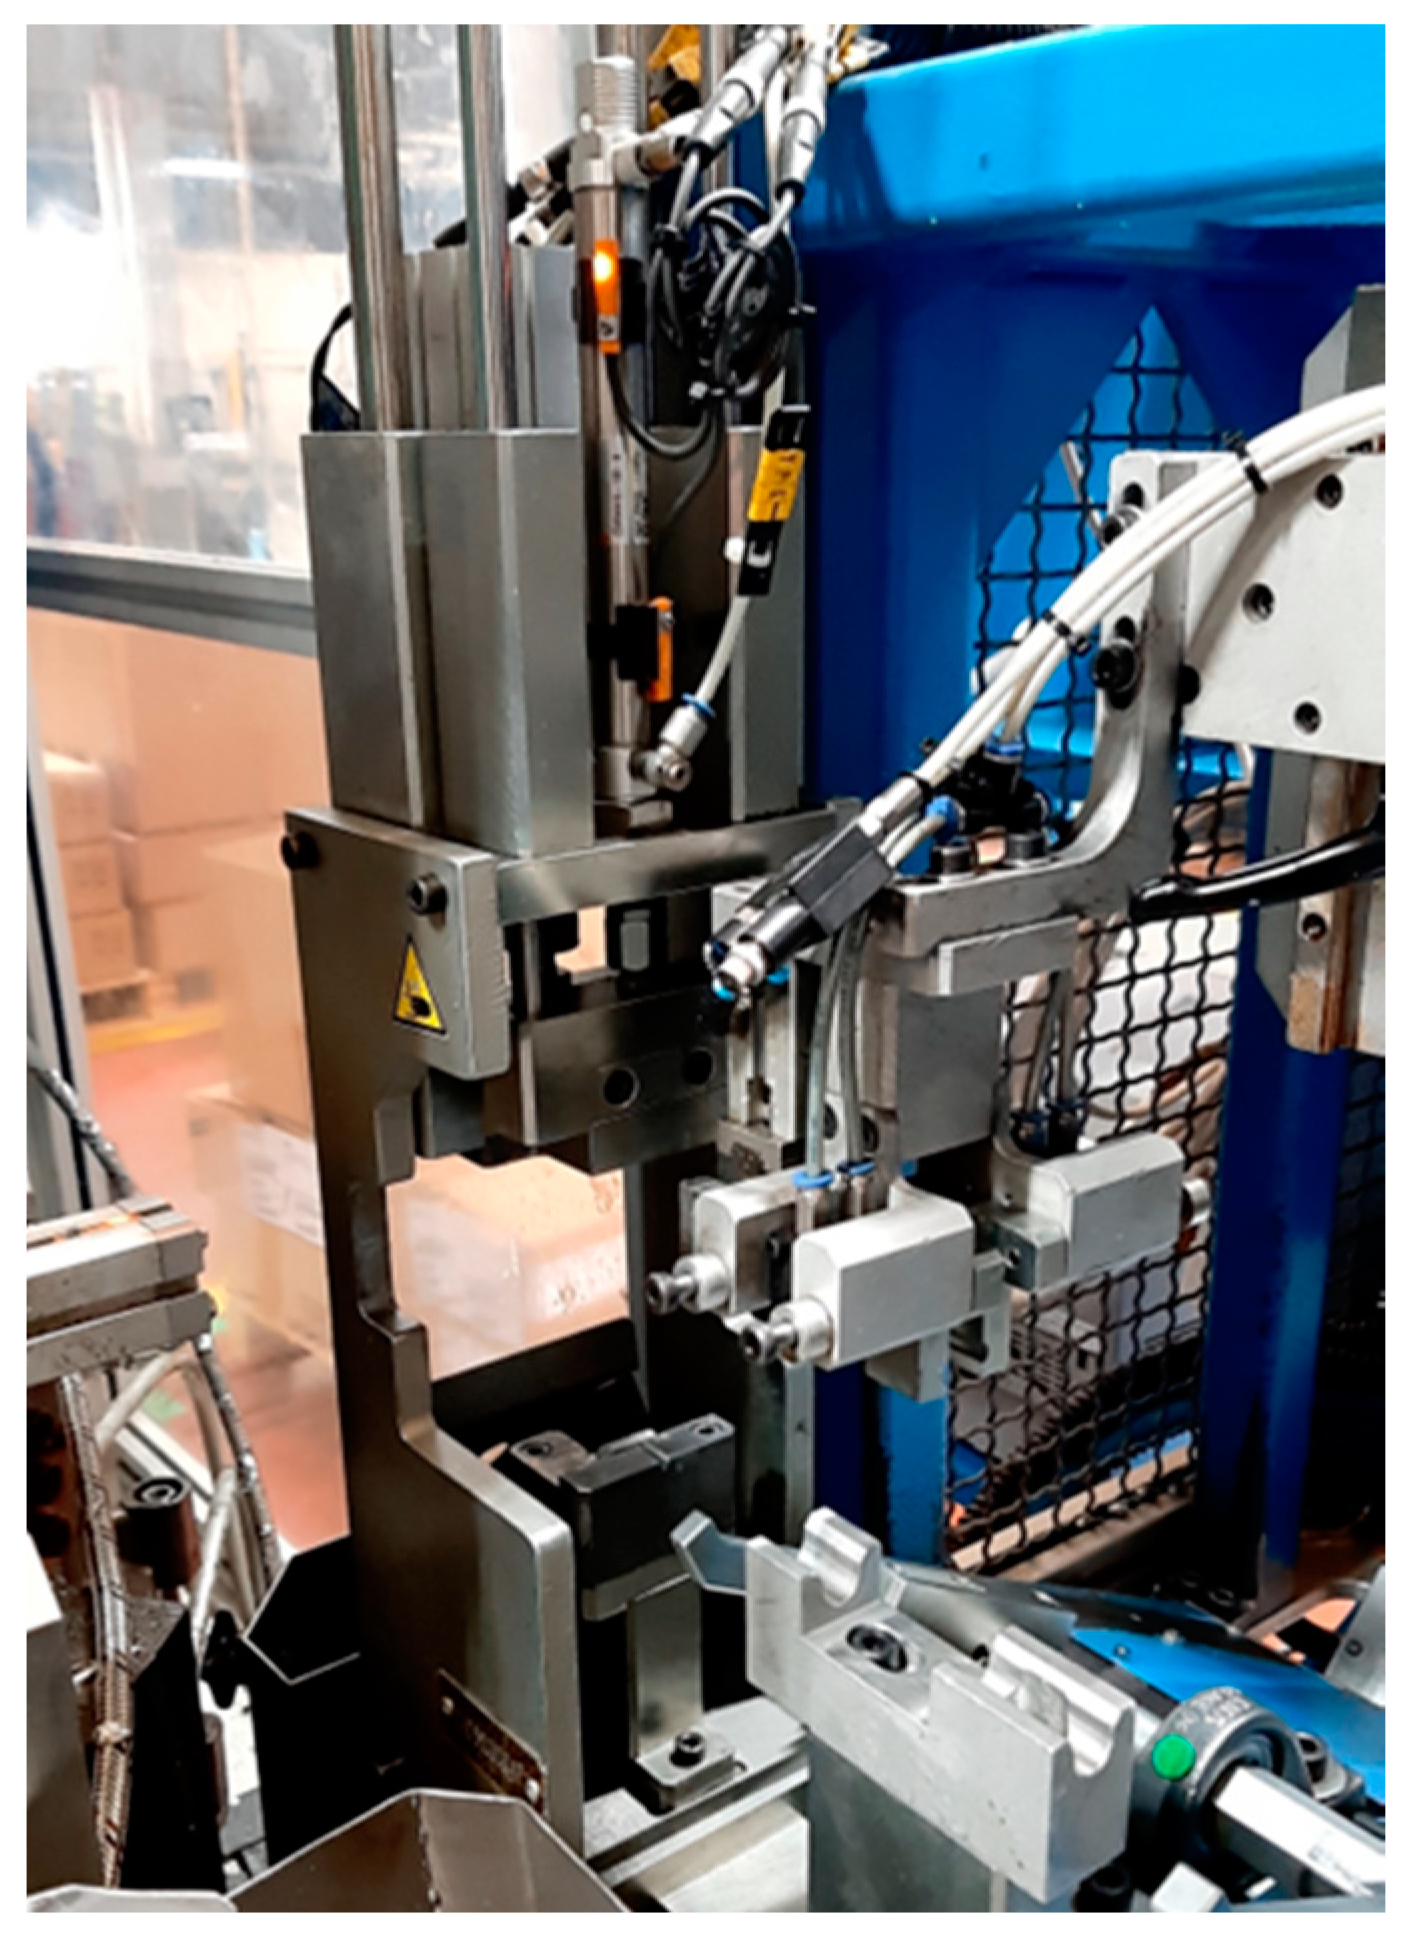
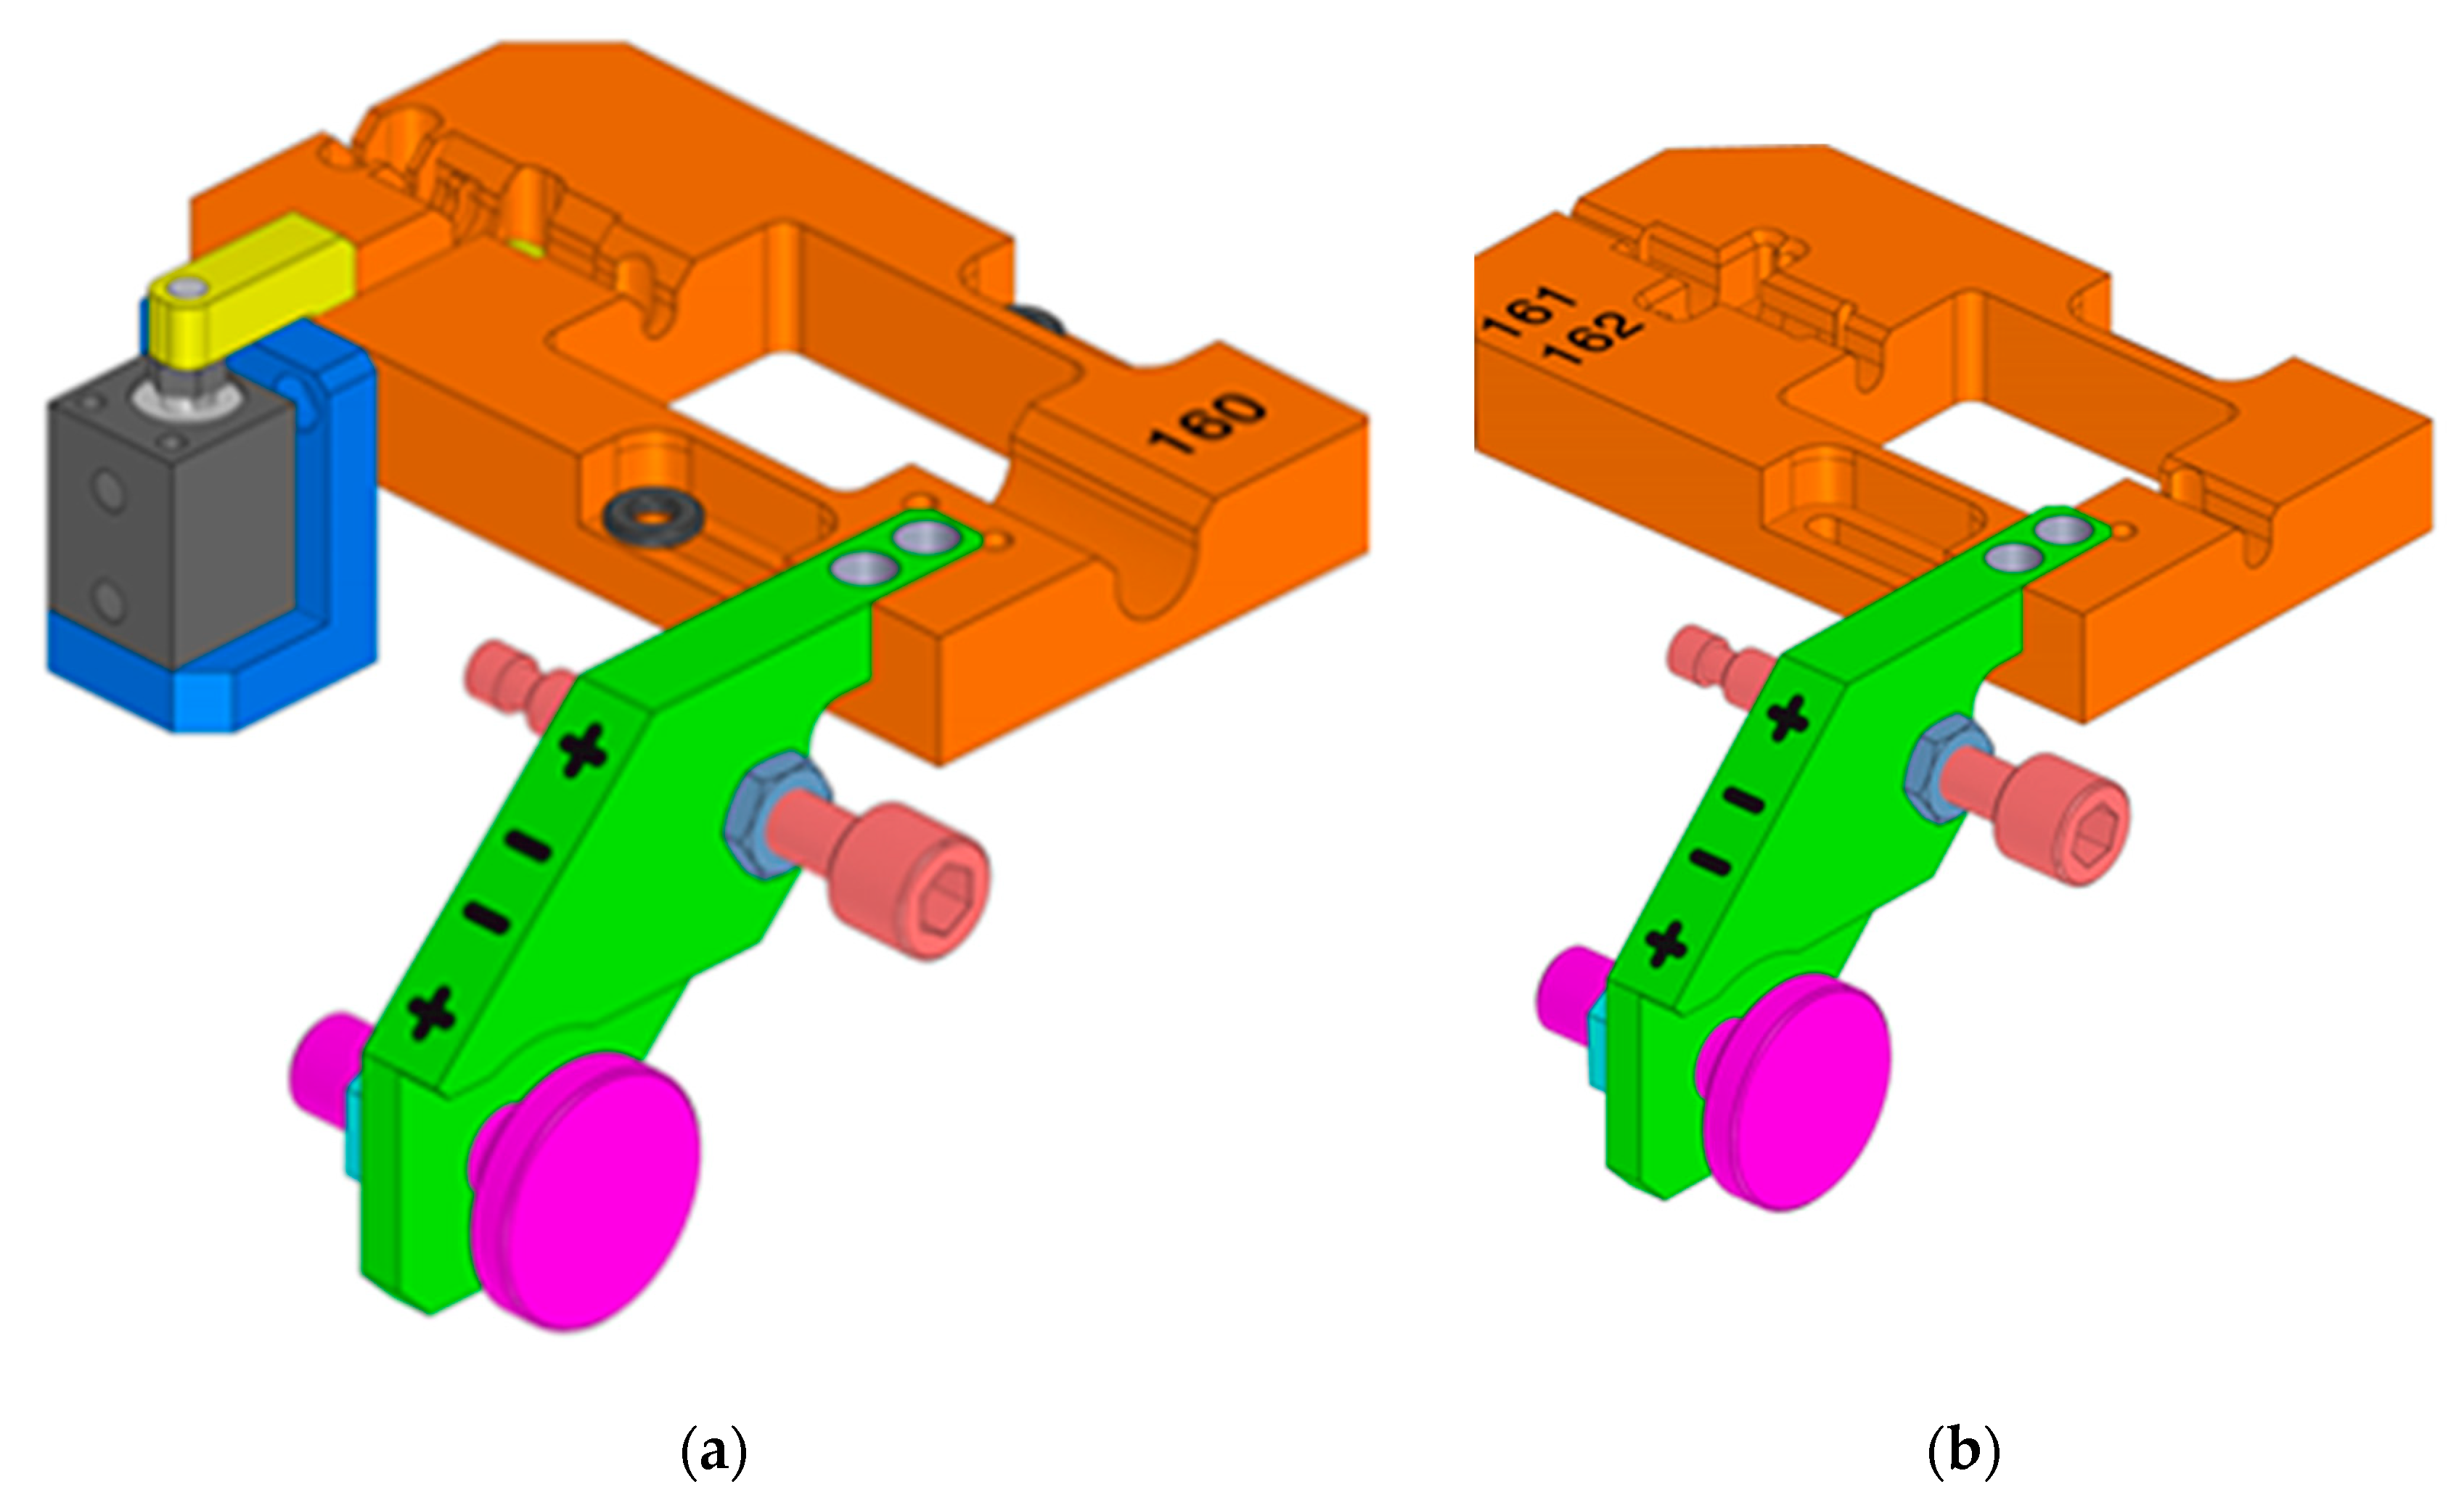
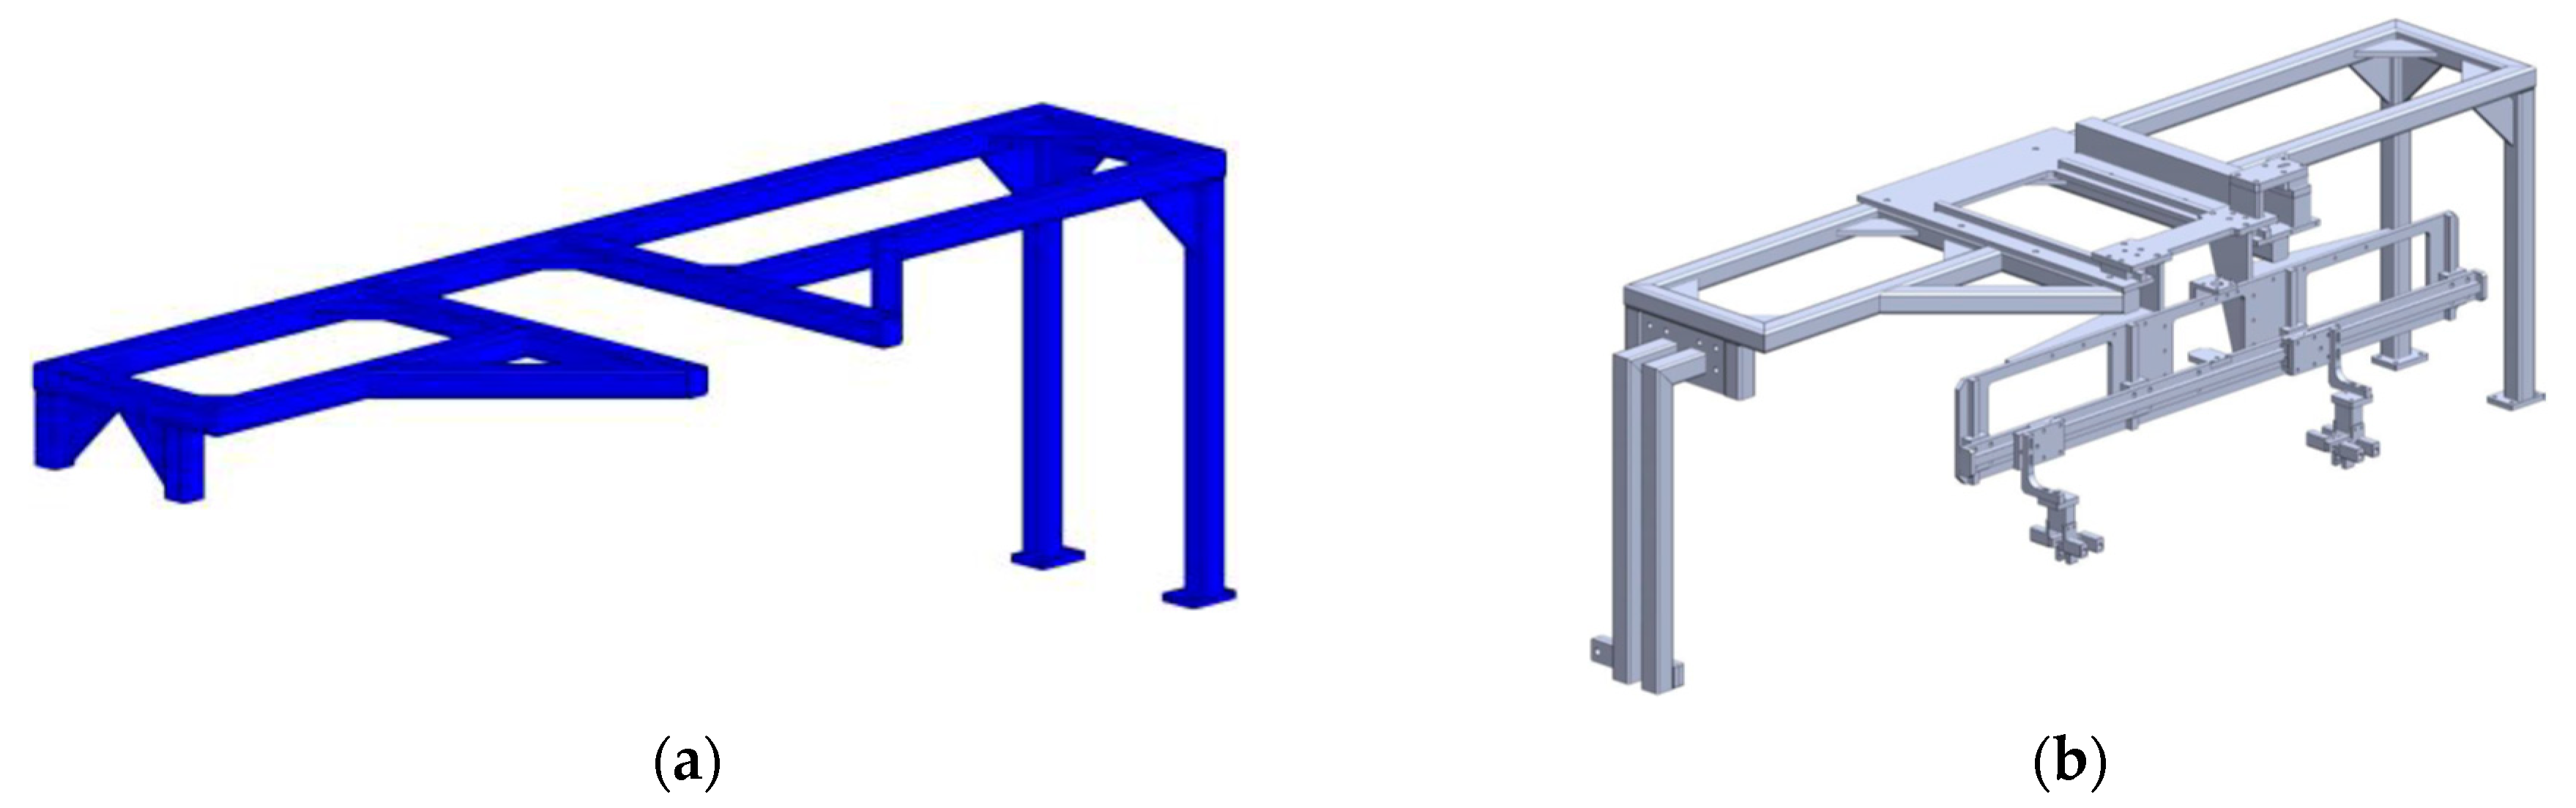
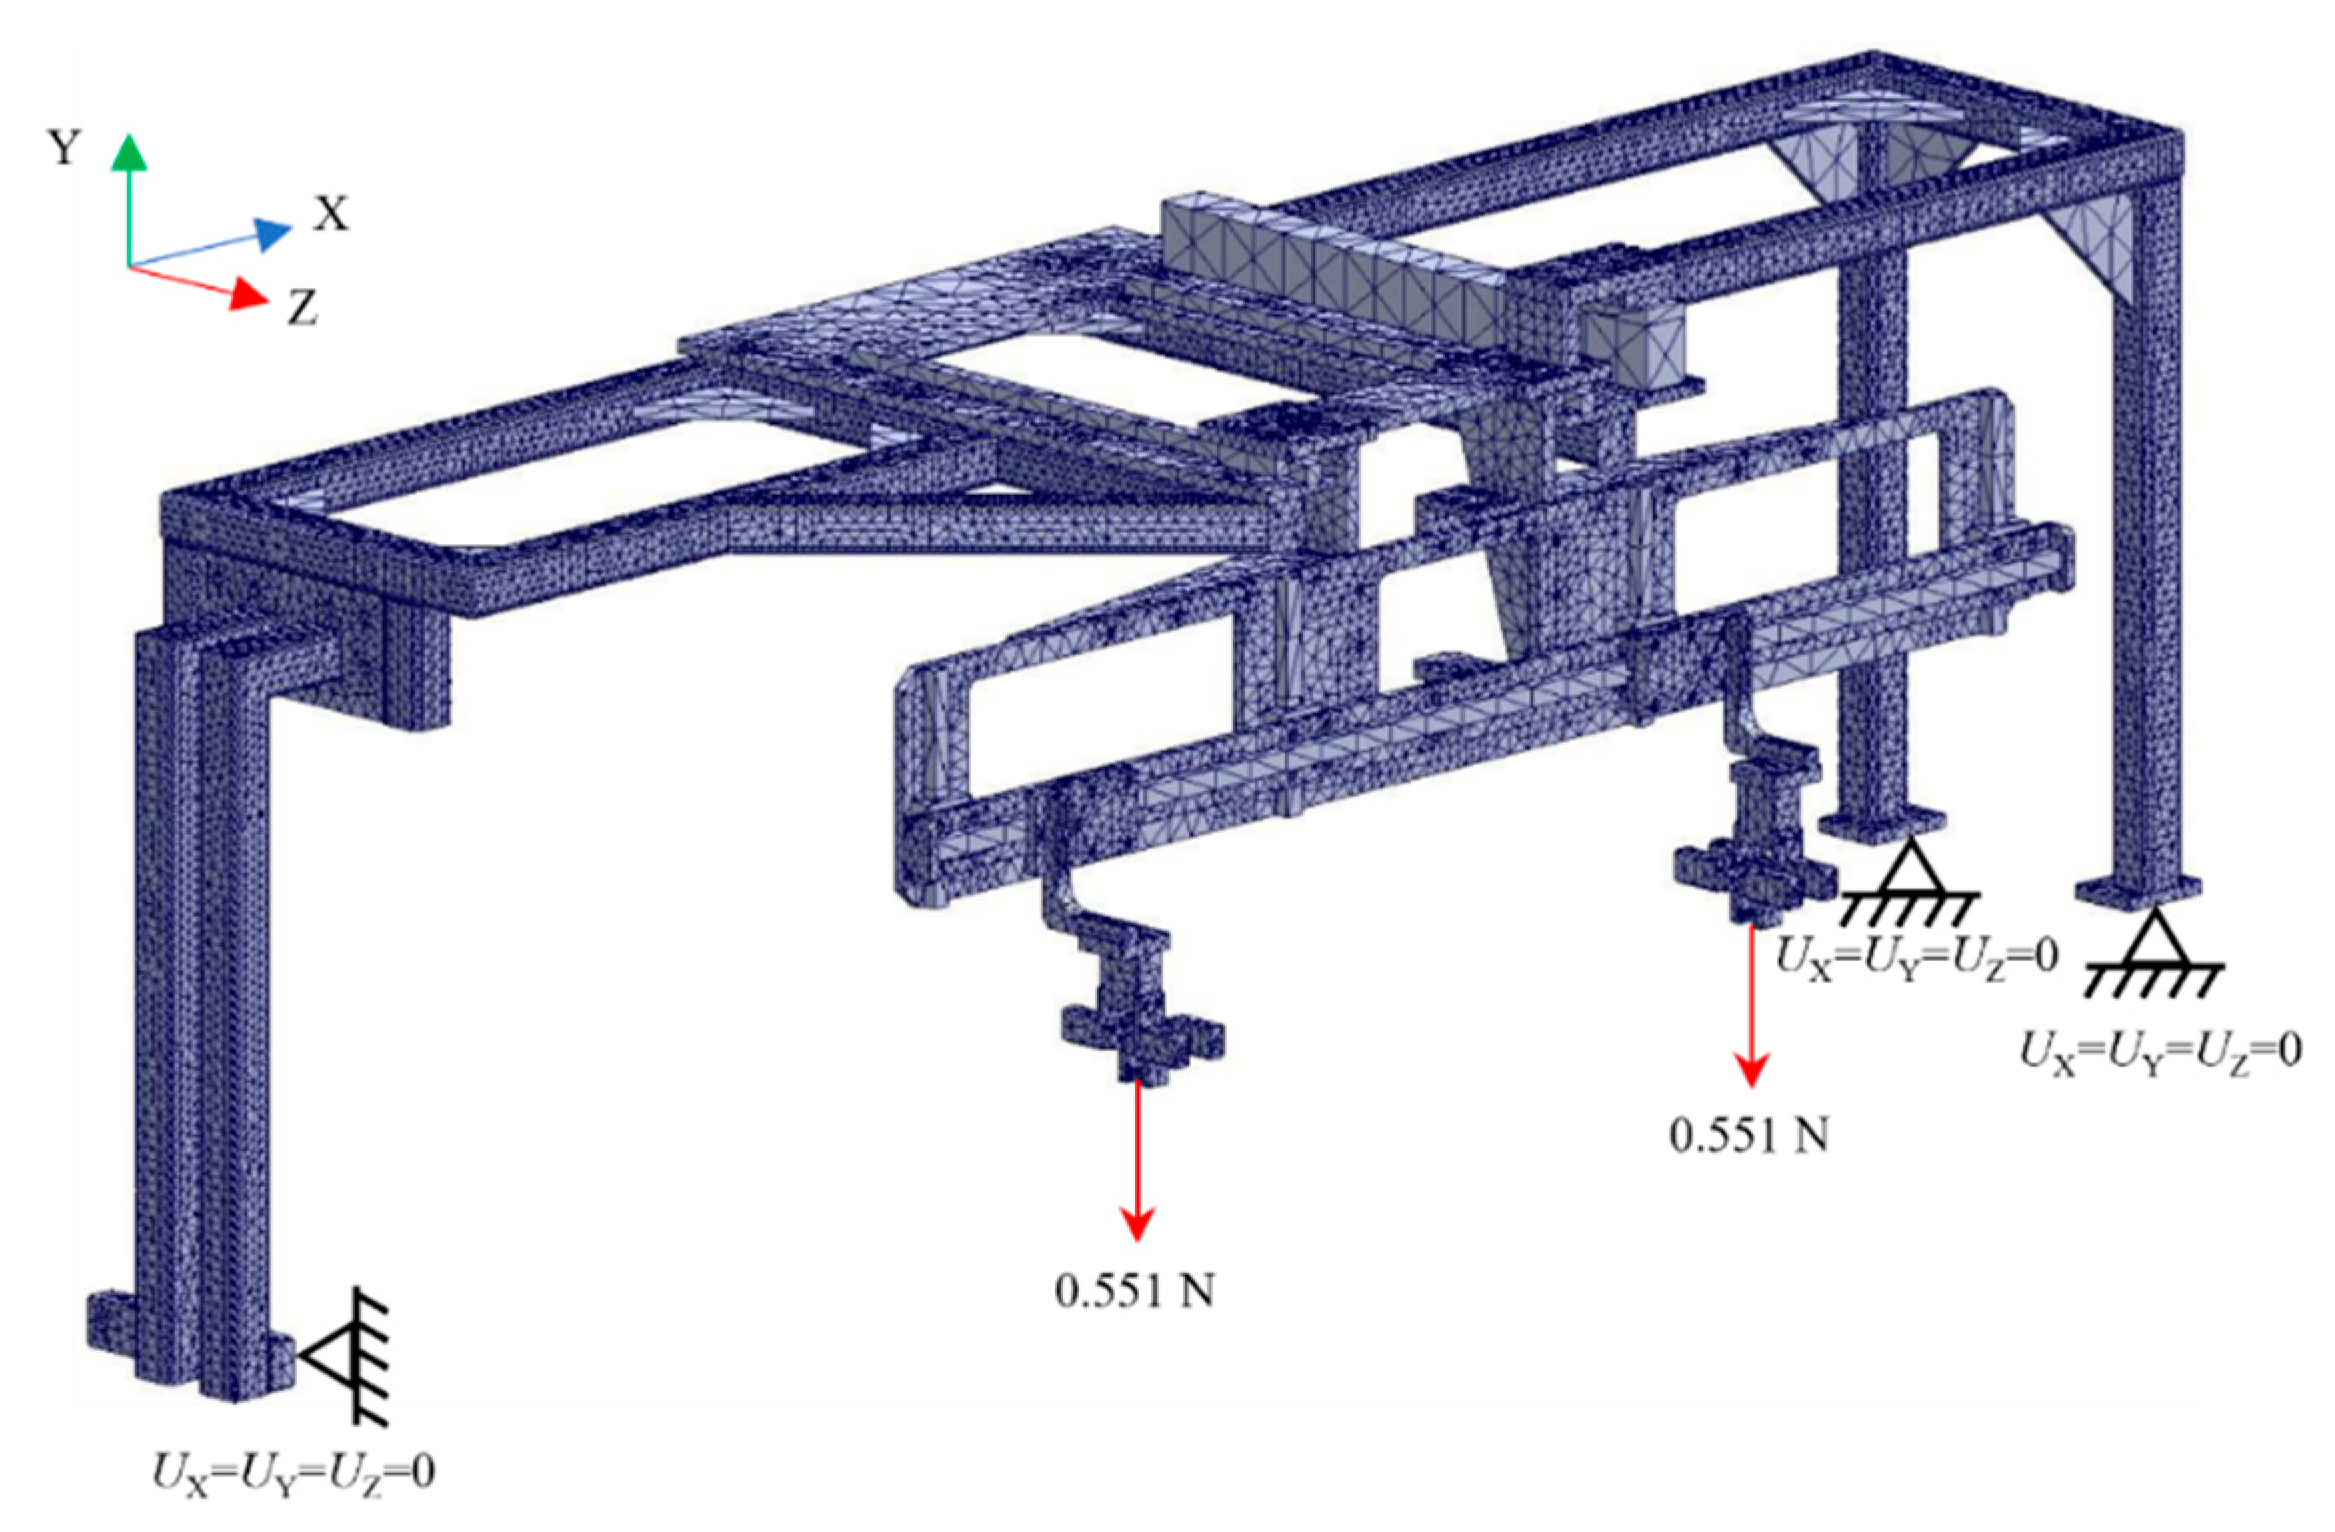
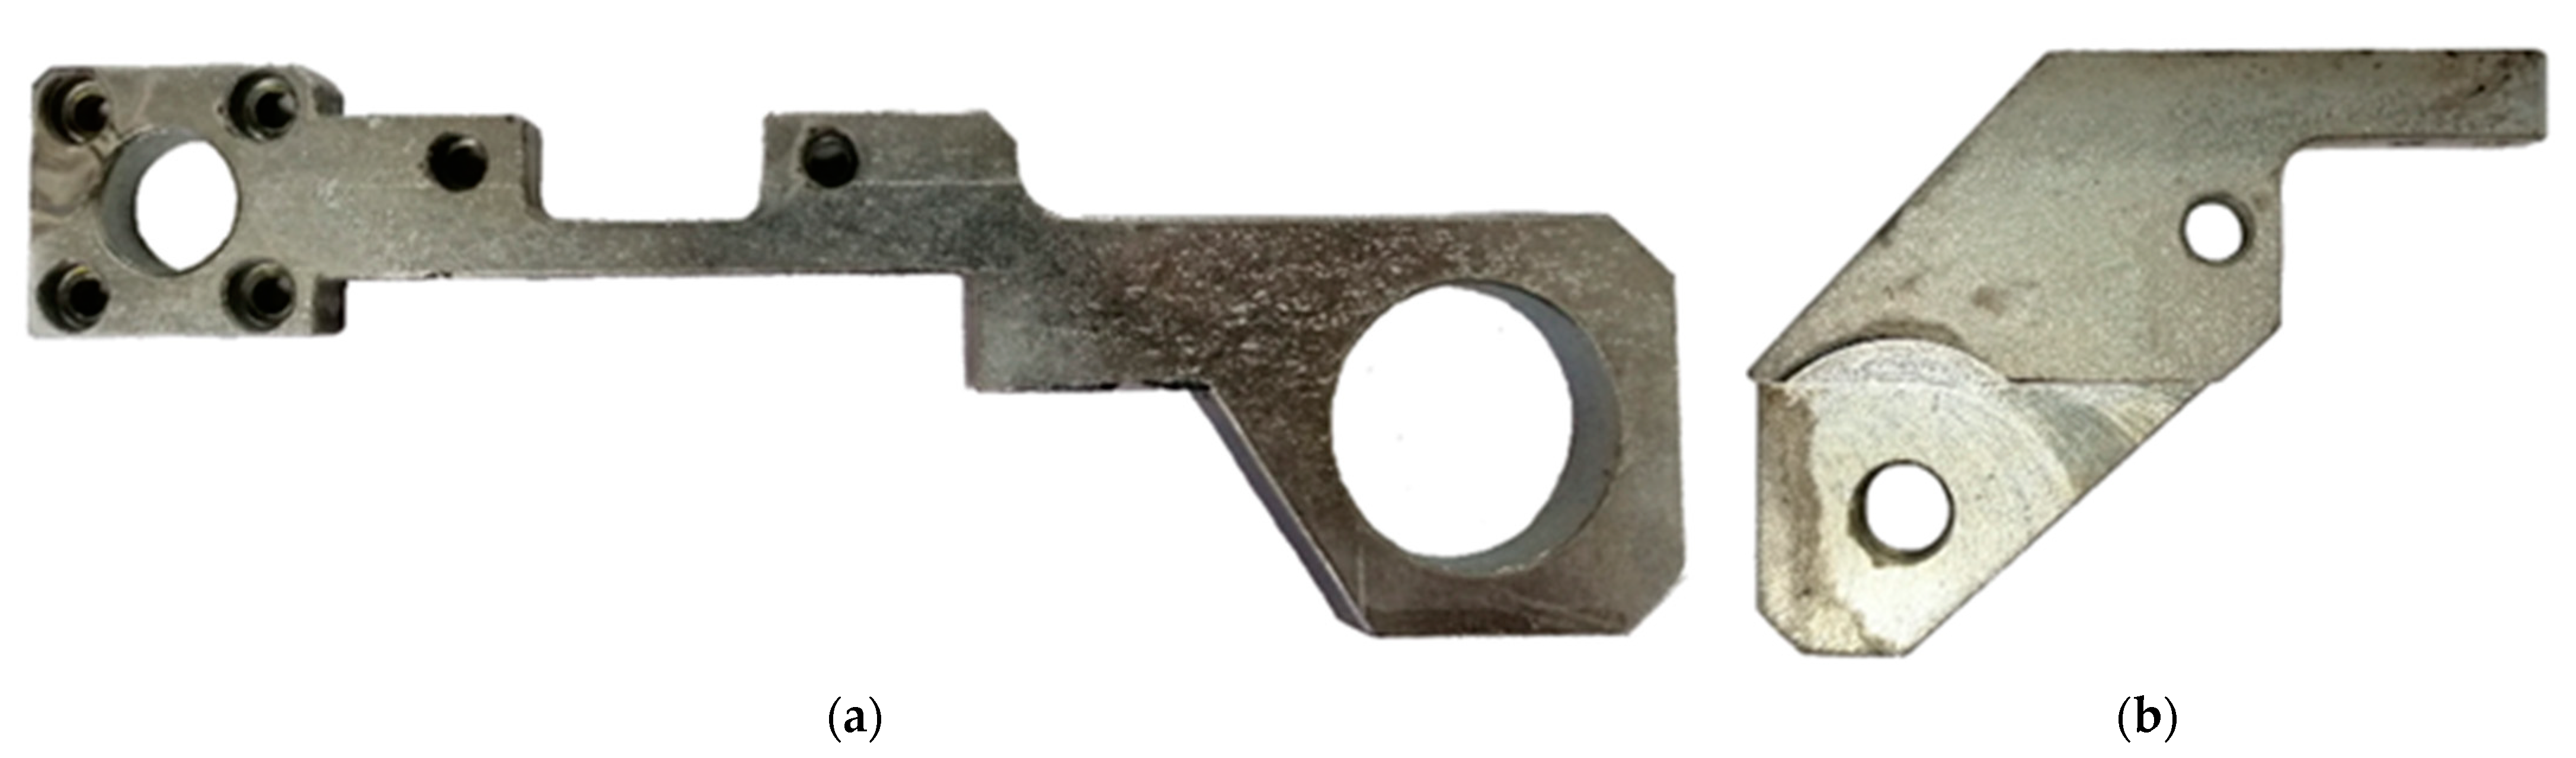
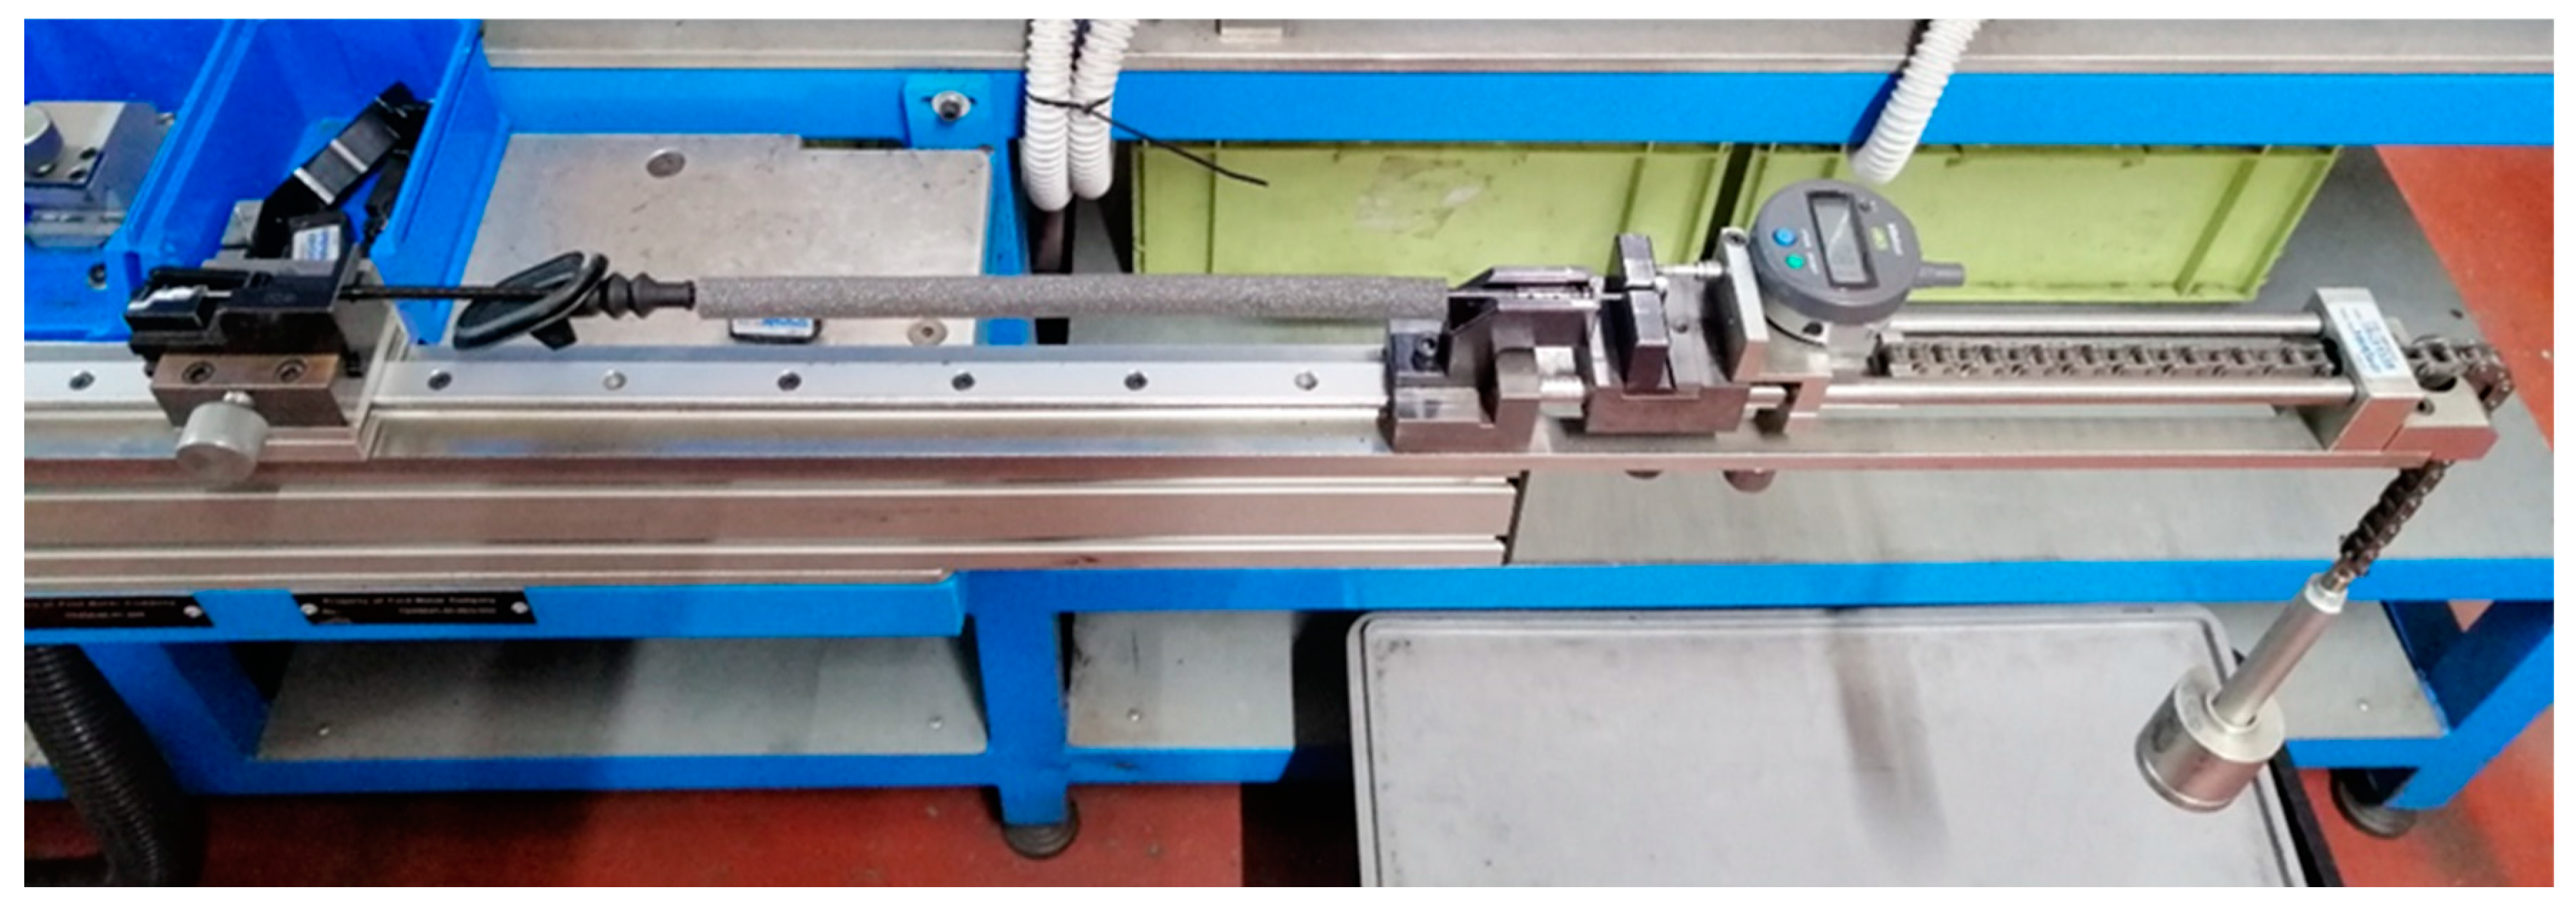
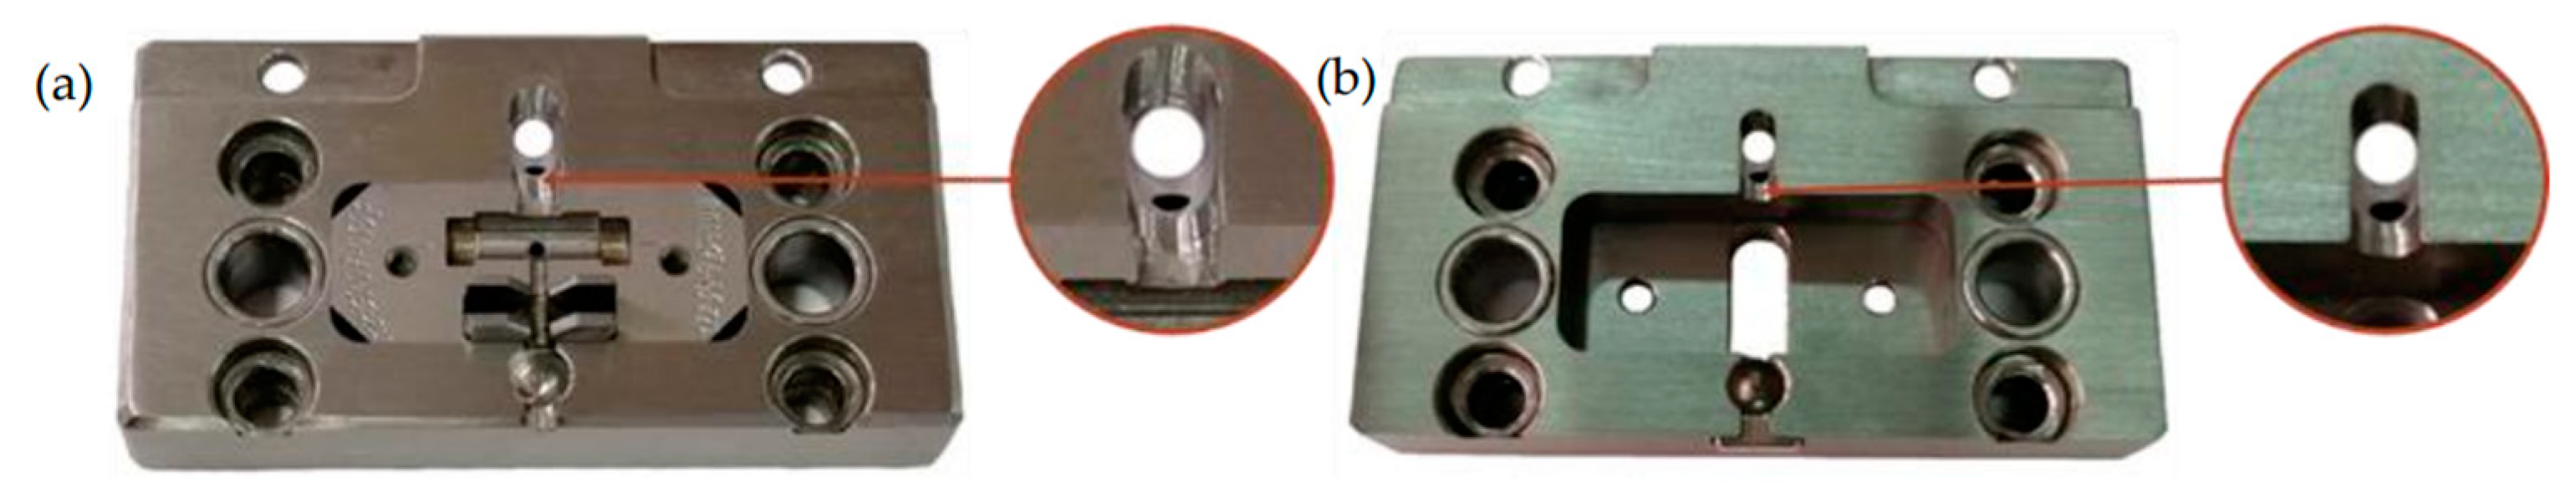
  • As the mold structure was modified and improved, it required further improvements to the measuring kit, namely the front and back positioning fixtures, which ensure the correct location of the control cable throughout the injection process. A similar approach was followed for the structure of the robotic manipulator, which transports the control cables from the injection station to the sprue removal station.
  • In all the previous cases, the number of fabricated components was minimal, while existing components were modified slightly by machining; hence, maintaining compatibility with the other production lines operating in the company.
In addition, the random size of the sprues was caused by a variation on the sprue gate throughout the molds employed in the company. Before and after the improvement of the injection molds and mold structures, a control injection run of 25 injections was performed. Metallographic analyses and control cable transport tests were performed. The analyses of these data led to:
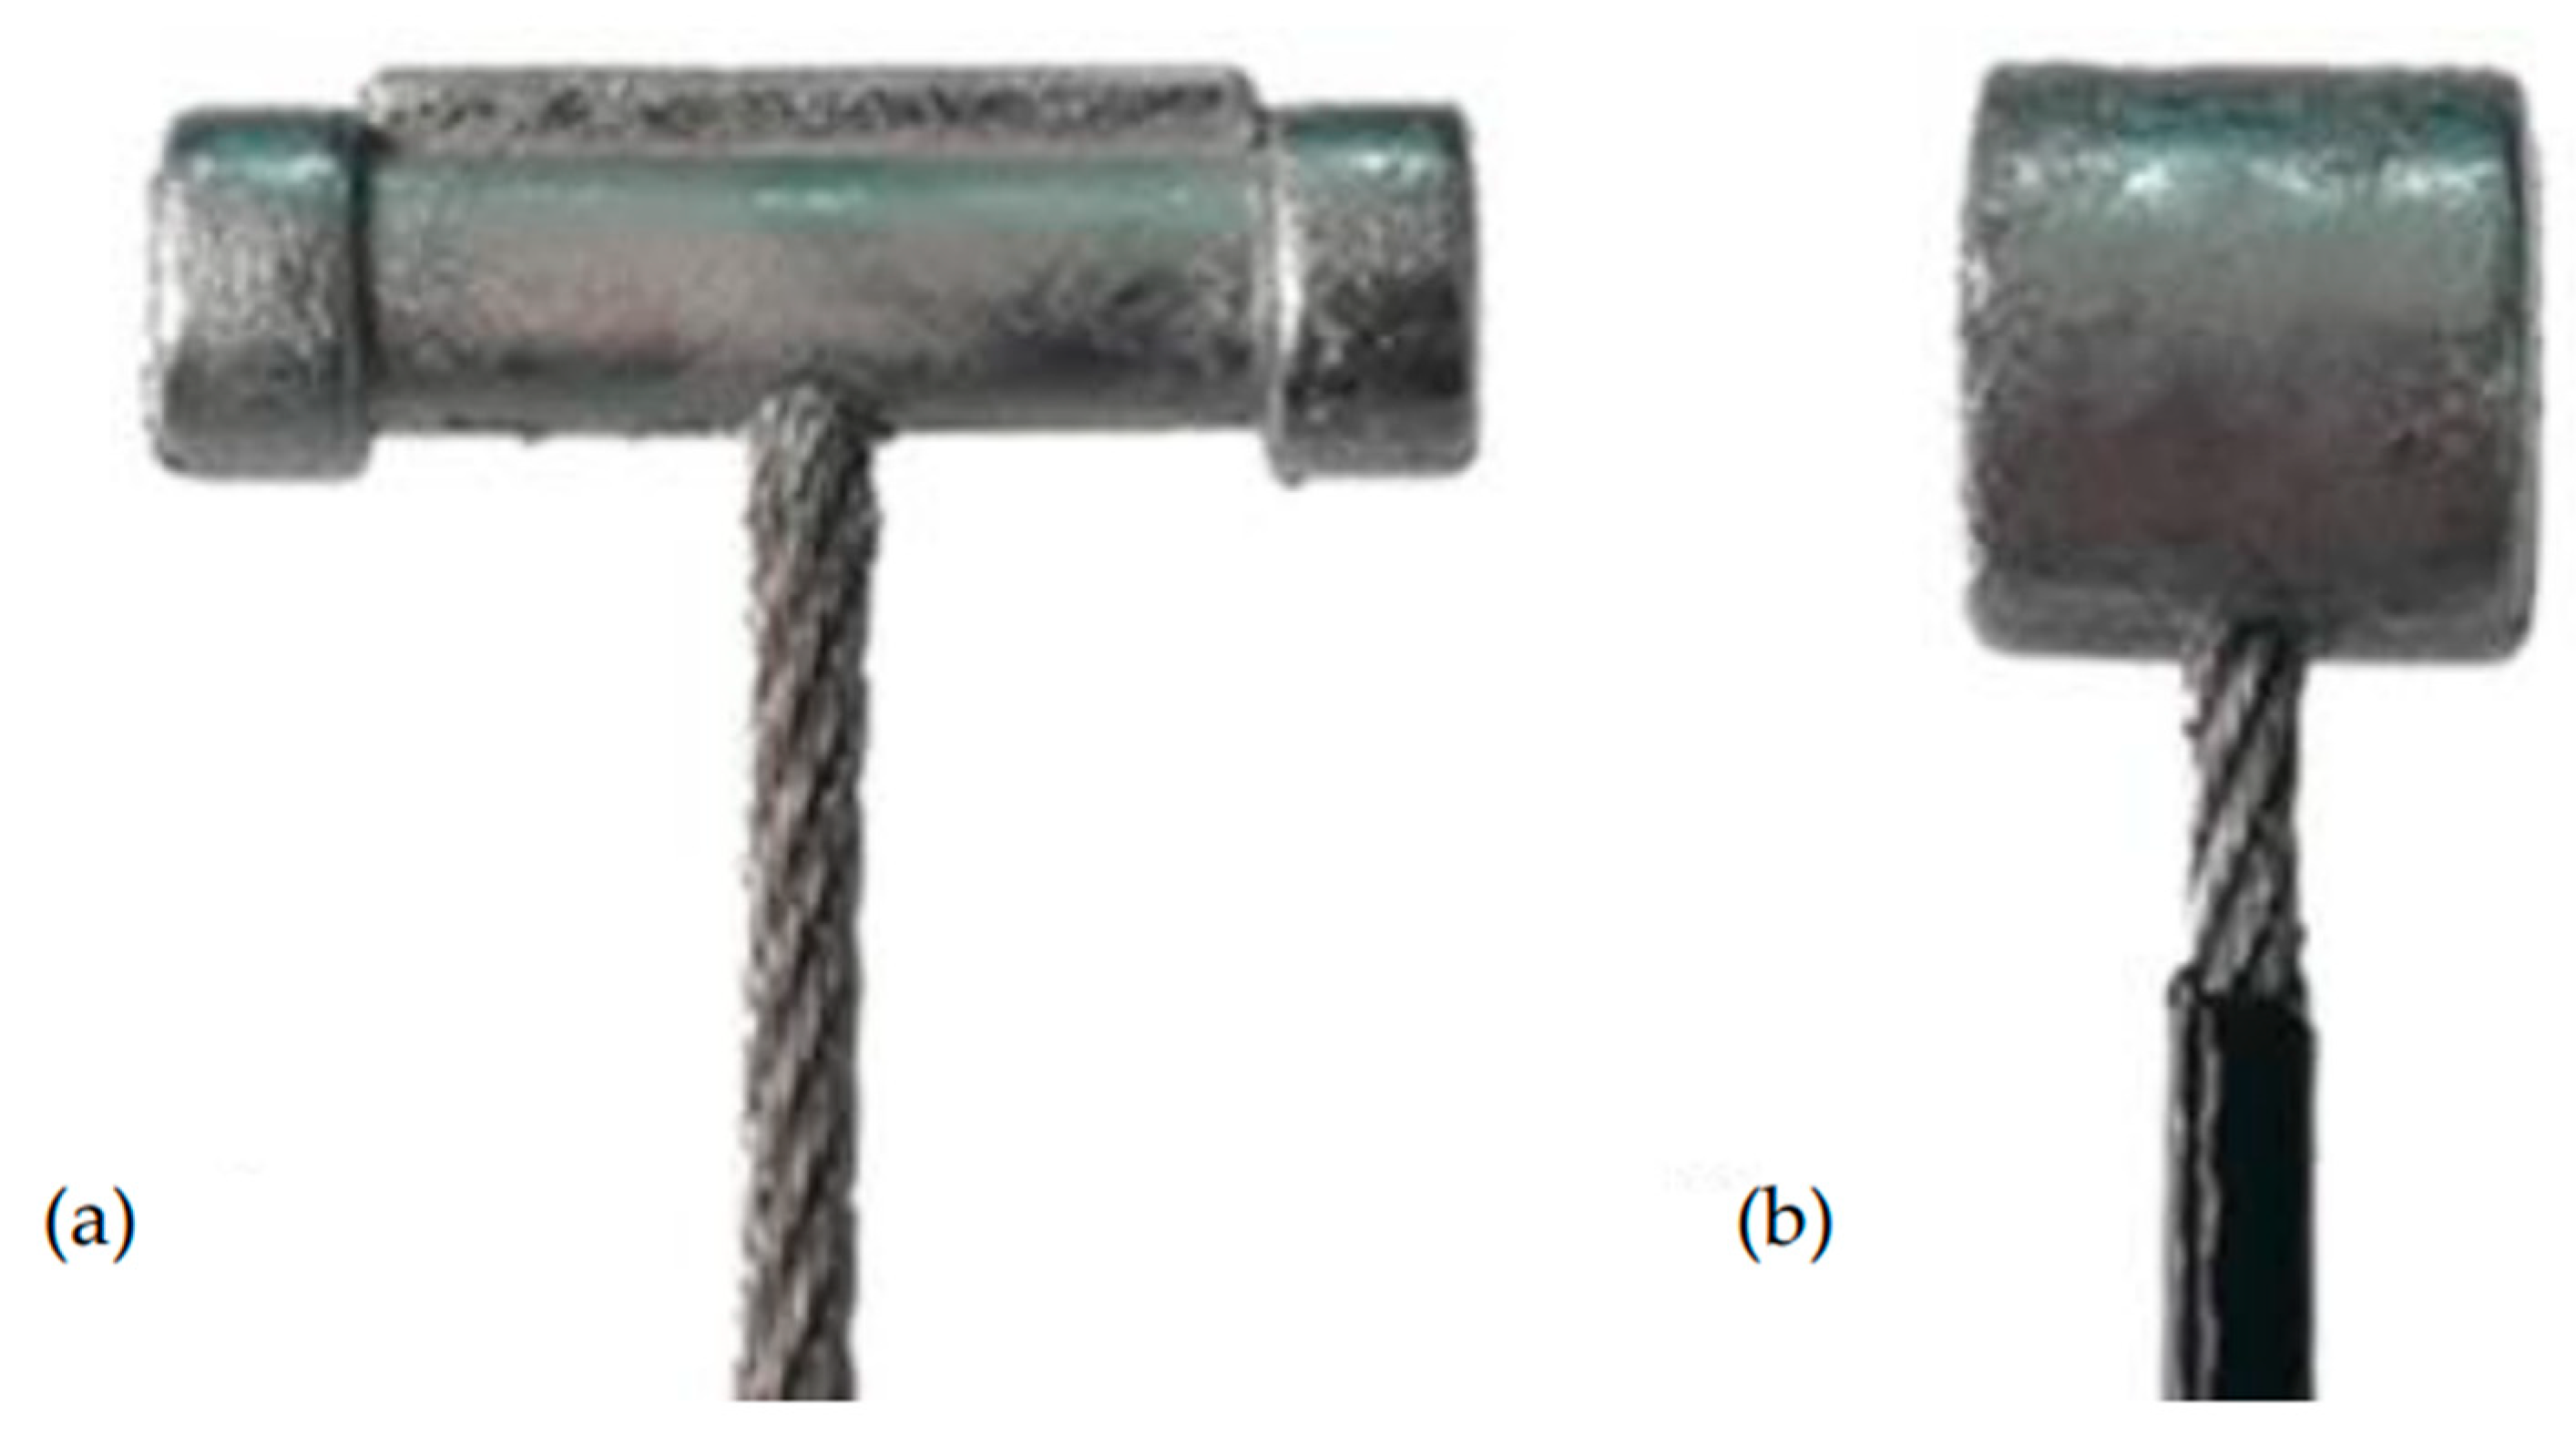
  • Establishing the cause of the random size and consequent behavior of the sprues before the improvements were done. Once the cause was found, the mold and mold structures were fine-tuned to produce a controlled sprue size, also reflected in a controlled behavior of the sprues.
  • The reduction of the sprue size led to the improvement of the terminal strength, which improved the quality of the control cables produced. The control of the sprue size means that the cooling rate of the terminal was also controlled; additionally, a smaller sprue mass indicates faster cooling rates, which lead to a stronger microstructure.
The combination of the SWOT and FEM techniques together with the synchronization between departments within the company led to a significant improvement, which did not require major disruptions to the company’s production. Furthermore, the investment for one production line will be returned in slightly over a year, while it would take four years for 10 production lines; consequently, the return of investment is relatively quick. In conclusion, the combination of process improvement techniques and engineering knowledge benefited the quality of a product, while also improving the reliability and reducing production costs of the associated machinery.

Author Contributions

Conceptualization: J.L.T.A.P., R.D.S.G.C. and F.J.G.S.; data curation: J.L.T.A.P., R.D.S.G.C., F.J.G.S. and I.J.S.-A.; formal analysis: J.L.T.A.P., F.J.G.S. and I.J.S.-A.; methodology: R.D.S.G.C. and F.J.G.S.; resources: C.P., D.B.; software: J.L.T.A.P., I.J.S.-A.; supervision: R.D.S.G.C., C.P. and D.B.; writing—original draft J.L.T.A.P., R.D.S.G.C. and I.J.S.-A.; writing—Review and editing: F.J.G.S., C.P. and D.B. All authors have read and agreed to the published version of the manuscript.

Funding

This research received no external funding.

Data Availability Statement

Currently, the data used for this work cannot be disclosed due to a confidentiality agreement with the host company.

Conflicts of Interest

The authors declare no conflict of interest.

References

  1. Senthilkumar, C.B.; Nallusamy, S. Enrichment of quality rate and output level in a medium scale manufacturing industry by implementation of appropriate quality tools. Mater. Today Proc. 2021, 37, 817–822. [Google Scholar] [CrossRef]
  2. Cheng, G.; Li, L. Joint optimization of production, quality control and maintenance for serial-parallel multistage production systems. Reliab. Eng. Syst. Saf. 2020, 204, 107–146. [Google Scholar] [CrossRef]
  3. Ishikawa, K. What is Total Quality Control? The Japanese Way; Prentice Hall: Hoboken, NJ, USA, 1985. [Google Scholar]
  4. Westcott, R.T.; Duffy, G.L. The Certified Quality Improvement Associate Handbook; ASQ Quality Press: Milwaukee, WI, USA, 2014. [Google Scholar]
  5. Kogawa, A.C.; Salgado, H.R.N. Quality tools for a successful strategic management. Int. J. Bus. Process Integr. Manag. 2017, 8, 153–159. [Google Scholar] [CrossRef]
  6. Wilson, C. Brainstorming and Beyond: A User-Centered Design Method; Morgan Kaufmann: Cambridge, MA, USA, 2013. [Google Scholar]
  7. Rodrigues, H.; Silva, F.J.G.; Morgado, L.G.; Sá, J.C.; Ferreira, L.P.; Campilho, R.D.S.G. A novel computer application for scrap reporting and data management in the manufacturing of components for the automotive industry. Procedia Manuf. 2020, 51, 1319–1326. [Google Scholar] [CrossRef]
  8. Silva, F.J.; Campilho, R.D.; Ferreira, L.P.; Pereira, M.T. Establishing guidelines to improve the high-pressure die casting process of complex aesthetics parts. In Transdisciplinary Engineering Methods for Social Innovation of Industry 4.0; IOS Press: Amsterdam, The Netherlands, 2018; Volume 7, pp. 887–896. [Google Scholar]
  9. Gürel, E.; Tat, M. SWOT analysis: A theoretical review. J. Int. Soc. Res. 2017, 10, 994–1006. [Google Scholar] [CrossRef]
  10. Dyson, R.G. Strategic development and SWOT analysis at the University of Warwick. Eur. J. Oper. Res. 2004, 152, 631–640. [Google Scholar] [CrossRef]
  11. Karimi, M.; Niknamfar, A.H.; Niaki, S.T.A. An application of fuzzy-logic and grey-relational ANP-based SWOT in the ceramic and tile industry. Knowl.-Based Syst. 2019, 163, 581–594. [Google Scholar] [CrossRef]
  12. Ayar, M.S.; Ayar, V.S.; George, P.M. Simulation and experimental validation for defect reduction in geometry varied aluminium plates casted using sand casting. Mater. Today Proc. 2020, 27, 1422–1430. [Google Scholar] [CrossRef]
  13. Goenka, M.; Nihal, C.; Ramanathan, R.; Gupta, P.; Parashar, A.; Joel, J. Automobile Parts Casting-Methods and Materials Used: A Review. Mater. Today Proc. 2020, 22, 2525–2531. [Google Scholar] [CrossRef]
  14. Groover, M.P. Fundamentals of Modern Manufacturing: Materials, Processes, and Systems; John Wiley & Sons: New York, NY, USA, 2020. [Google Scholar]
  15. Anderson, B. Die Casting Engineering: A Hydraulic, Thermal and Mechanical Process; CRC Press: Boca Raton, FL, USA, 2005. [Google Scholar]
  16. Pinto, H.; Silva, F.J.G. Optimisation of Die Casting Process in Zamak Alloys. Procedia Manuf. 2017, 11, 517–525. [Google Scholar] [CrossRef]
  17. Campbell, J. Complete Casting Handbook: Metal Casting Processes, Metallurgy, Techniques and Design; Butterworth-Heinemann: Oxford, UK, 2015. [Google Scholar]
  18. Nunes, V.; Silva, F.J.G.; Andrade, M.F.; Alexandre, R.; Baptista, A.P.M. Increasing the lifespan of high-pressure die cast molds subjected to severe wear. Surf. Coat. Technol. 2017, 332, 319–331. [Google Scholar] [CrossRef]
  19. Swift, K.G.; Booker, J.D. Process Selection: From Design to Manufacture; Elsevier: Amsterdam, The Netherlands, 2003. [Google Scholar]
  20. Pinto, H.A.; Silva, F.J.G.; Martinho, R.P.; Campilho, R.D.S.G.; Pinto, A.G. Improvement and validation of Zamak die casting moulds. Procedia Manuf. 2019, 38, 1547–1557. [Google Scholar] [CrossRef]
  21. Chandrasekaran, R.; Campilho, R.D.S.G.; Silva, F.J.G. Reduction of scrap percentage of cast parts by optimizing the process parameters. Procedia Manuf. 2019, 38, 1050–1057. [Google Scholar] [CrossRef]
  22. Sun, J.; Le, Q.; Fu, L.; Bai, J.; Tretter, J.; Herbold, K.; Huo, H. Gas entrainment behavior of aluminum alloy engine crankcases during the low-pressure-die-casting process. J. Mater. Process. Technol. 2019, 266, 274–282. [Google Scholar] [CrossRef]
  23. Davis, J.R. Zinc and Zinc Alloys. In Metals Handbook, 2nd ed.; ASM International: Novelty, OH, USA, 1998; pp. 589–597. [Google Scholar]
  24. BDG. BDG Reference Sheet P202 [Internet]. 2010, p. 24. Available online: https://www.guss.de/fileadmin/user_upload/richtlinien/bdg-richtlinie_p_202_eng.pdf (accessed on 4 May 2022).
  25. Askeland, D.R. The Science and Engineering of Materials; Springer: Boston, MA, USA, 1996. [Google Scholar]
Figure 1. Cable terminal with its sprue.
Processes 10 01953 g001
Figure 2. Models of control cables produced in the line BX726.
Processes 10 01953 g002
Figure 3. Preparation processes to the control cables: (a) removal of the plastic cover to the cable, (b) mushrooming of the inner cable’s tip.
Processes 10 01953 g003
Figure 4. Production line BX726; the terminal injection area is indicated.
Processes 10 01953 g004
Figure 5. Types of cable ends injected in the line BX726: (a) model 75, (b) model 70.
Processes 10 01953 g005
Figure 6. Robotic manipulator within the line BX726.
Processes 10 01953 g006
Figure 7. Machine to remove the sprues from the cable terminals.
Processes 10 01953 g007
Figure 8. Injection machine and its main components.
Processes 10 01953 g008
Figure 9. Details of the molds, terminals model 75 and model 70 shown.
Processes 10 01953 g009
Figure 10. Scattered sprues on the work floor and palliative measures to contain them; (a,b) sprues scattered on the machine and its guides, (c,d) extra sprue containers placed as a palliative measure.
Processes 10 01953 g010
Figure 11. Geometry of the improved mold structure.
Processes 10 01953 g011
Figure 12. Improved positioning devices for different product references: (a) models 159 and 160, (b) models 161 and 162.
Processes 10 01953 g012
Figure 13. Modified structure for the robotic manipulator: (a) standalone structure, (b) assembled manipulator.
Processes 10 01953 g013
Figure 14. Finite Element mesh, boundary conditions and loads on the robotic manipulator’s structure.
Processes 10 01953 g014
Figure 15. Effective stresses in the robotic manipulator’s structure under working loads.
Processes 10 01953 g015
Figure 16. Magnitude of displacement in the manipulator’s structure under working loads.
Processes 10 01953 g016
Figure 17. Original gating system for terminal of model 75 (A) and model 70 (B).
Processes 10 01953 g017
Figure 18. Gating system, after modification, for terminal of model 75 (A) and model 70 (B).
Processes 10 01953 g018
Figure 19. Example of fabricated parts for the equipment modification: proximity sensor support (a) and target support (b).
Processes 10 01953 g019
Figure 20. Equipment after disassembling the components to be changed: (A) robotic manipulator grips, (B) measuring kit.
Processes 10 01953 g020
Figure 21. Structure of the robotic manipulator after the changes.
Processes 10 01953 g021
Figure 22. Equipment after assembly and ready for operation.
Processes 10 01953 g022
Figure 23. Validation of the produced control cable after changing the equipment.
Processes 10 01953 g023
Figure 24. Structure of the molds before (a) and after changing the sprue channel geometry (b).
Processes 10 01953 g024
Figure 25. Equipment after the intervention: correct sprue storage in the dedicated container (A), lack of scattered sprues (B), and clean path up to the container after continuous production (C).
Processes 10 01953 g025
Figure 26. Terminal section with 200× optical zoom with porosity filter: before (A,C), and after the intervention (B,D).
Processes 10 01953 g026
Figure 27. Sample surfaces after the chemical treatment, with a zoom of 200×: before (A,C), and after the intervention (B,D).
Processes 10 01953 g027
Table 1. Data used to calculate the saving achieved with the BX726 production line.
ZAMAK’s Retail Price2.8 EUR/kg
Scrap ZAMAK’s retail price1.1 EUR/kg
Sprue mass reduction1.21 g
Total investment3970 EUR
BX726 production line’s annual average production [22,23,24,25]1,021,700 units
Table 2. Data used to calculate the savings achieved with ten critical lines.
Number of Production Lines to Modify10
Expected average investment per production line4000 EUR
Production line’s annual average production1,000,000
Table 3. Data used to calculate the saving achieved for new projects until 2026.
Number of Projects to Be Implemented in 20223
Number of projects to be implemented in 202310
Production line’s annual average production1,000,000
Table 4. Results obtained with the porosity analysis for the various samples.
SamplePorosity [%]PoresPores Density [1/mm]Porosity According to BDG P202
A10.28243781.12%15.0/ØL1.0
B9.2373220.06%10.0/ØL1.8
C12.6228636.19%15.0/ØL2.8
D5.56100418.65%10.0/ØL1.3
Publisher’s Note: MDPI stays neutral with regard to jurisdictional claims in published maps and institutional affiliations.

